Article

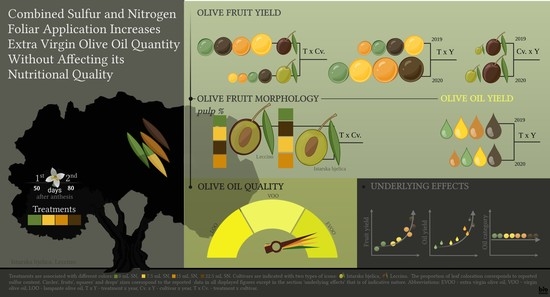
Combined Sulfur and Nitrogen Foliar Application Increases Extra Virgin Olive Oil Quantity without Affecting Its Nutritional Quality

1
Department for Ecology, Agronomy and Aquaculture, University of Zadar, Trg Kneza Višeslava 9, 23000 Zadar, Croatia
2
Department of Agriculture and Nutrition, Institute of Agriculture and Tourism, Karla Huguesa 8, 52440 Poreč, Croatia
3
Department of Applied Sciences, Institute for Adriatic Crops and Karst Reclamation, Put Duilova 11, 21000 Split, Croatia
4
Centre of Excellence for Biodiversity and Molecular Plant Breeding, Svetošimunska 25, 10000 Zagreb, Croatia
5
Department of Plant Nutrition, Division for Agroecology, Faculty of Agriculture, University of Zagreb, Svetošimunska 25, 10000 Zagreb, Croatia
6
Department of Plant Breeding, Genetics and Biometrics, Division for Plant Sciences, Faculty of Agriculture, University of Zagreb, Svetošimunska 25, 10000 Zagreb, Croatia
7
Department of Biology, Biotechnical Faculty, University of Ljubljana, Jamnikarjeva 111, 1000 Ljubljana, Slovenia
8
Department of Low and Medium Energy Physics, Jožef Stefan Institute, Jamova 39, 1000 Ljubljana, Slovenia
*
Author to whom correspondence should be addressed.
These authors contributed equally to this work.
Horticulturae 2022, 8(3), 203; https://doi.org/10.3390/horticulturae8030203
Submission received: 31 December 2021 / Revised: 21 February 2022 / Accepted: 21 February 2022 / Published: 25 February 2022
(This article belongs to the Special Issue Related Studies on Horticultural Tree Leaves)

Abstract

:
This study investigates the effect of combined sulfur (S) and nitrogen (N) foliar fertilization on leaf S and N concentration, as well as on the growth of olive fruit and on the quantity and quality of olive oil, obtained from two olive cultivars ‘Istarska bjelica’ and ‘Leccino’ in two consecutive years. S and N are some of the most important nutrients, and both play a crucial role in plant oil production. The here-reported fertilization program significantly increased S concentration in leaves without affecting N concentration, which led to an increase in fruit yield and improvement of all fruit morphological parameters. The best oil yield per tree was obtained under the treatment with the highest S/N dose. Oil quality was not affected by S and N supply, and this allowed us to classify all our oil samples as extra virgin (EVOO). Regarding the content of total phenols (TPC) and composition of fatty acid methyl esters (FAME), they remained unaltered under the applied treatments. All investigated fruit morphological parameters, as well as fruit and oil yield, were highly cultivar-dependent. ‘Istarska bjelica’ was characterized as a cultivar with higher fruit mass and pulp percentage, while its stone parameters were lower than those of ‘Leccino’. Consequently, the extraction oil yield obtained from ‘Istarska bjelica’ fruits was much higher. Moreover, environmental conditions had a great impact on fruit and oil quantity. The here-obtained results led us to the conclusion that supply of S and N can enhance oil production without affecting its nutritional quality, a finding that could generate large long-term effects on economic growth in the olive oil sector.

Graphical Abstract

1. Introduction

Olea europaea L. is one of the oldest cultivated crops in the Mediterranean Basin. Nearly 90% of the grown olives are used for oil production, and the remaining 10% are used as table olives. Olive oil is the main source of lipids in the Mediterranean diet [1], since triacylglycerols are the most abundant chemical components in olive fruits and, consequently, in olive oil. The high content of saturated (SFA), monounsaturated (MUFA), and polyunsaturated (PUFA) fatty acids is important for the nutritional value and health benefits of olive products, making them recognized as functional foods. The most common fatty acid found in olives is oleic acid (C18:1, about 73%), followed by the linoleic (C18:2), palmitic (C16:0), stearic (C18:0), and linolenic (C18:3) fatty acids [2]. The consumption of MUFAs, such as oleic acid, is associated with a decrease in several cardiovascular risk factors. Lipids derived from plants are widely used as cooking oils, in cosmetics, as detergents, and as lubricants; thus, their production is of a great economic interest [3]. In addition to lipids, olive oil also naturally contains other compounds such as hydrocarbons, sterols, tocopherols, aliphatic alcohols, polyphenols, and pigments.
Some of the most important bioactive compounds found in olives are polyphenols. In recent years, there has been growing interest in finding naturally occurring antioxidants which can be used in the food and pharmaceutical industries in order to replace the synthetic ones [4]. Polyphenols comprise up to 3% of the olive fresh pulp weight, while their concentration in extra virgin olive oil varies between 50 mg/kg and 800 mg/kg oil [5]. Phenols have an ability to scavenge free radicals or to chelate transition metals, thereby suppressing oxidative reactions, making them prominent candidates that can protect humans by reducing the risk and severity of certain chronic diseases [6].
The chemical composition of olives and olive oil depends on many factors including fertilization practice. It has been reported by several authors that the supply of sulfur (S) can increase the lipid content in seeds of different cultivars such as rape, canola, and mustard, as well as change the ratio of fatty acids, thereby improving the oil quality [3,7,8,9]. Sulfur is the fourth major plant nutrient after nitrogen (N), phosphorus (P), and potassium (K), and it plays a crucial role in plant growth and development [10]. It participates in many biochemical reactions, and it is a key factor in the synthesis of four sulfur-containing amino acids, methionine, cysteine, homocysteine, and taurine, of which only the first two are incorporated into proteins [11]. In addition, it determines plants yield. It is known that oilseeds and legumes have higher requirements for S and are more sensitive to its deficiency, which can lead to retarded growth, reduced leaf size, and leaf chlorosis [12]; therefore, these crops respond efficiently to S fertilization. Crop requirements for S depend on many factors, and the balance between S and other nutrients is important for a possible synergistic or antagonistic effect. Among other essential nutrients, N has been reported as the most important one to be applied together with S due to the way in which these two elements interact [7]. Both elements are essential in protein and enzyme synthesis, as well as for plant oil production, and deficiency of S or N reduces the assimilation efficiency and uptake of the other [13].
To the best of our knowledge, there are no available data on the effect of combined S and N application on olive oil quantity and quality. This work was aimed at studying the influence of increasing levels of foliar application of S and N on the growth of olive fruit, yield, oil accumulation, and oil quality of olive cultivars ‘Istarska bjelica’ and ‘Leccino’.

2. Materials and Methods

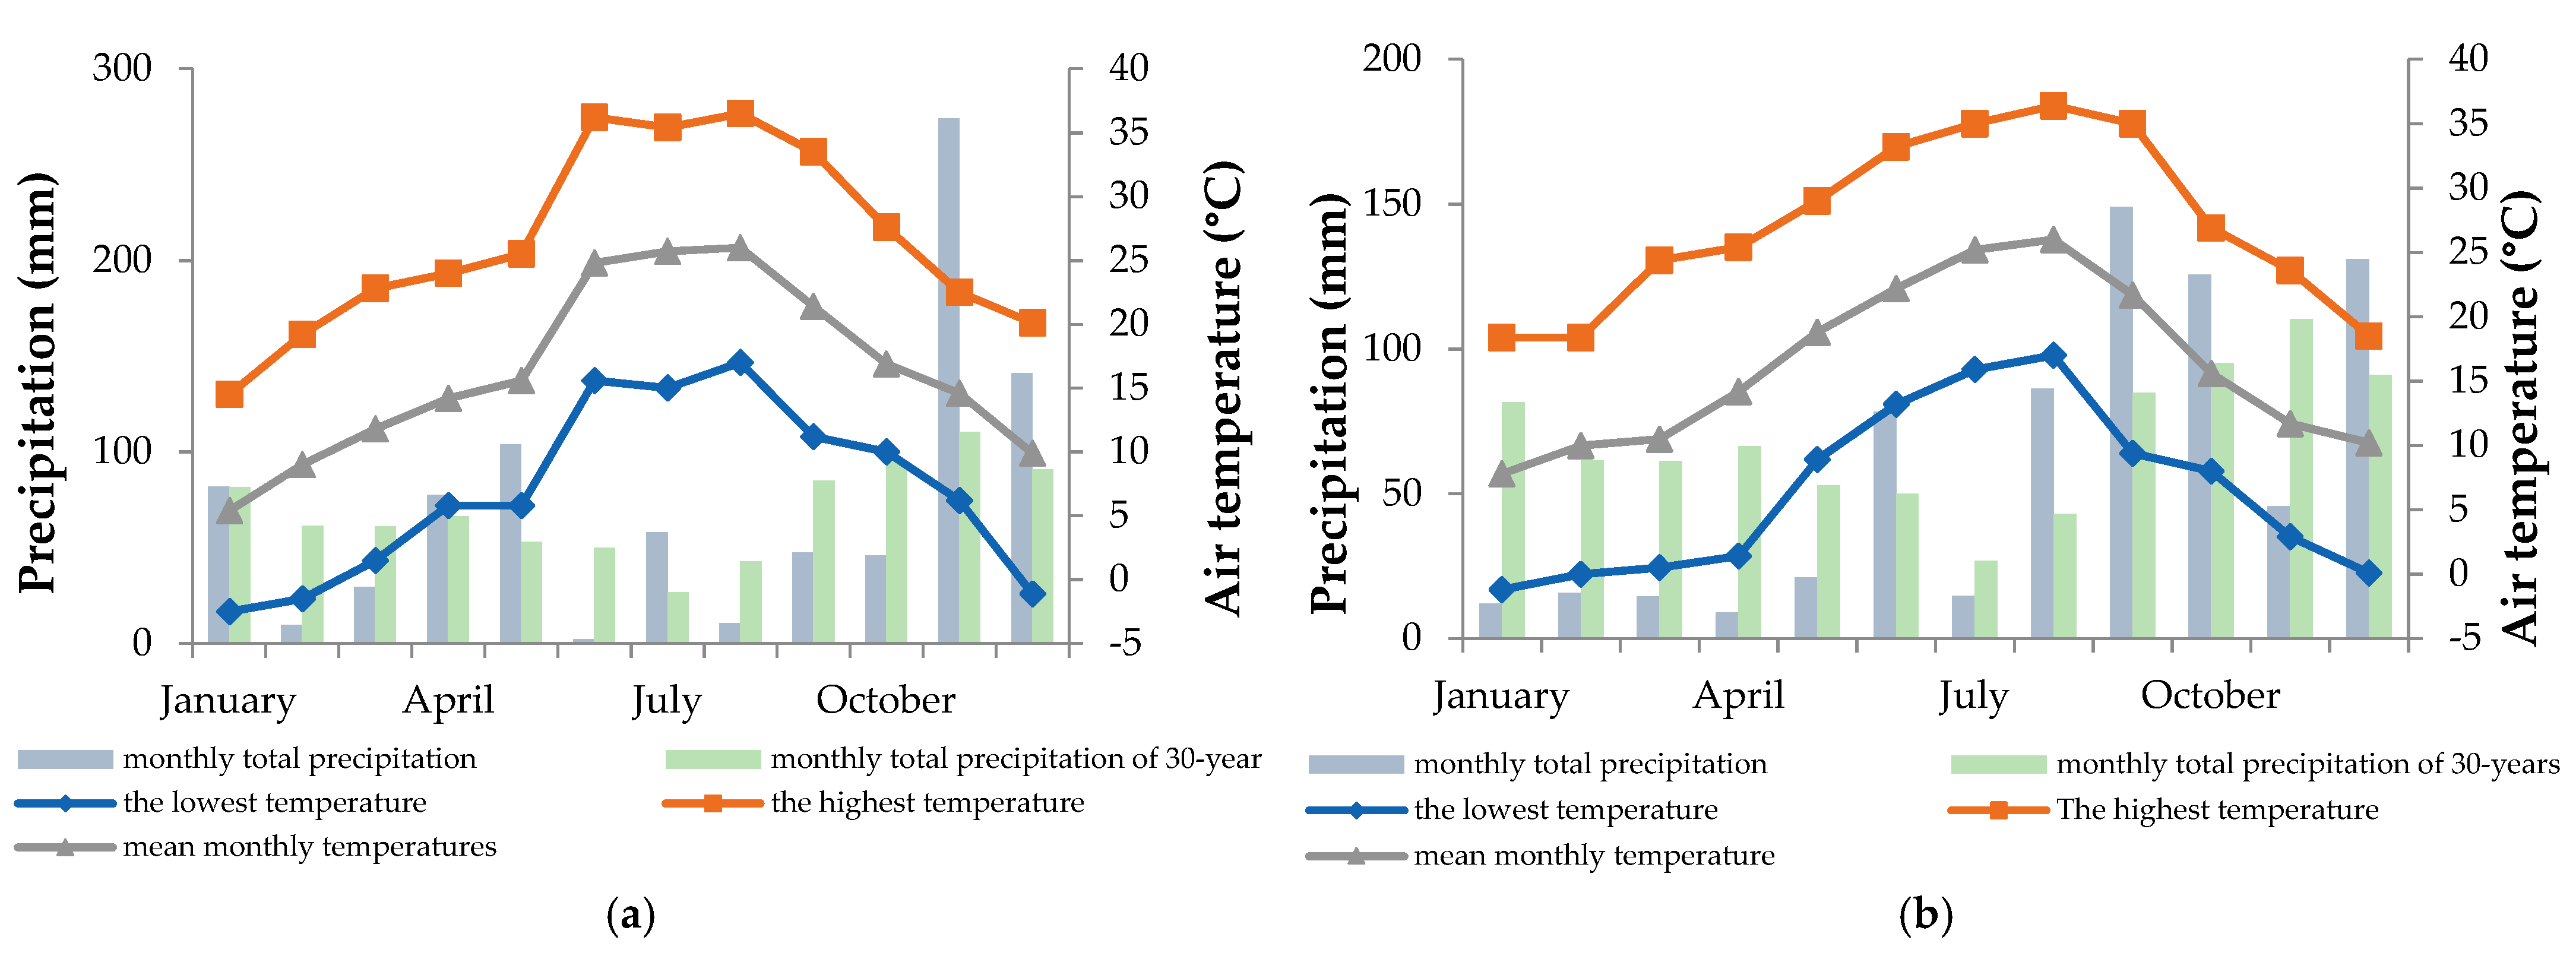
2.1. Experimental Conditions, Treatments, and Sampling

A field experiment was set up on 10 year old olive trees of two cultivars, ‘Istarska Bjelica’ and ‘Leccino’, in an orchard located in Sikovo, Zadar, Croatia (latitude: 43°59′29.16″ N, longitude: 15°25′29.79″ E; altitude: 49 m above sea level). Olive trees were self-rooted and planted at a spacing of 8 × 7 m. Olive trees were trained in a free vase training system and grown without irrigation. Fruit yield in the year prior to the experiment ranged from 10 kg/tree for ‘Istarska bjelica’ to 20 kg/tree for ‘Leccino’ cultivar. The experiment was conducted during the 2019 and 2020 growing seasons in the climate area classified as Csa (Mediterranean climate with hot summer) according to Köppen [14]. The average air temperature was 16.3 °C in 2019 and 16.2 °C in 2020, with total rainfall of 881.5 mm in 2019 and 702.7 mm in 2020 (Figure 1, data obtained from the Croatian Meteorological and Hydrological Service).
The experiment was set up as a completely randomized design. The total number of plants for each cultivar was 16 with four trees per each treatment. Only well-developed fruiting trees were chosen for the experiment. Foliar fertilization was applied 50 and 80 days after anthesis (Table 1). Fertilization treatments consisted of the control treatment (0 mL SN, 1 mL wetting agent per 1 L of water [Tensiofill; Agrofill S.r.l., Ponso, Italy]), 7.5 mL SN (7.5 mL of Thiotrac [Yara International ASA, Oslo, Norway] and 1 mL of Tensiofill wetting agent per 1 L of water), 15 mL SN (15 mL of Thiotrac and 1 mL of Tensiofill wetting agent per 1 L of water), and 22.5 mL SN (22.5 mL of Thiotrac and 1 mL of Tensiofill wetting agent per 1 L of water). The chemical composition of Thiotrac fertilizer was 750 g/L SO3 (9.37 M) and 200 g/L N (14.29 M). Its concentrations used in the abovementioned SN treatments were defined according to our preliminary experiment. The solutions were applied foliarly until runoff (approximately 4–6 L per tree). The solutions were uniformly applied with a portable backpack sprayer (Solo Incorporated, VA, USA) during the early morning hours to ensure optimal application conditions.

2.2. Soil Characterization

The chemical properties of the soil in the orchard are reported in the Supplementary Materials (Table S1) and were determined as follows: soil reaction (pH) according to HRN ISO 10390:2005 [15], total nitrogen according to HRN ISO 11261:2004 [16], organic matter according to ISO 14235:1998 [17], total carbonate content according to volumetric method defined by HRN ISO 10693:2004 [18], and plant-available phosphorus (P) and potassium (K) according to [19].

2.3. Leaf Sampling

Samples for analyses consisted of 100 healthy leaves per tree collected along four transects (SE, NE, SW, and NW) from central parts of the shoots’ withes. Sampling was conducted three times: (1) 10 days from the first foliar treatment, (2) 10 days from the second foliar treatment (Table 1), and (3) just before harvesting. After each sampling, leaves were taken to the laboratory and rinsed with 1% acetic acid, followed by twice with deionized water. Samples were then dried in an oven (Memmert Universal Oven UF160; Memmert GmbH+Co. KG, Schwabach, Germany) at 75 °C until constant mass, milled to a fine powder (0.2 mm sieves, Ultra Centrifugal mill ZM 200; Retsch Maschinen GmbH, Setzingen, Germany), and used for further analyses [20].

2.4. Fruit Sampling

During mid-October (2019 and 2020), in order to ensure that, in 2 years of research, the sampled fruits were approximately equally mature, fruits from all five categories (0–4 according to skin color) were collected from the orchard and used as a reference (Figure S1). Harvested fruits were used to evaluate the maturity of fruits for oil production, by calculating the maturity index on the basis of an evaluation of the skin and pulp color [21,22]. Calculated indices are shown in Table S2. Additionally, 40 randomly chosen fruits per tree were collected along four transects (SE, NE, SW, and NW) and accurately weighted with a precision up to 0.01 g, and then fruit length and width were measured using a Vernier caliper (JIANGXI, Jiangxi, China). After the separation of the pulp from stone, the length, width, and mass of the stone, as well as the mass of the pulp, were measured [23].
For olive oil production, 2 kg of fruits at technical maturity were additionally hand-harvested equally all around each olive tree.
In order to calculate the fruit yield, all the remaining fruits were mechanically harvested and weighted. The obtained mass was added to the fruit masses used for morphological measurements and oil production.

2.5. Chemicals

Methanol (MeOH), hydrogen peroxide, and acetic and nitric acids were purchased from VWR International S.A.S. (Fontenay-sous-Bois, France), heptane was purchased from Avantor Performance Materials Poland S.A. (Gliwice, Poland), petroleum ether was purchased from Lach-Ner, s.r.o. (Neratovice, Chech Republic), and phosphoric acid was purchased from Sigma-Aldrich (St. Louis, MO, USA). Potassium hydroxide was purchased from Gram-mol d.o.o. (Zagreb, Croatia), and the mixture of methyl esters of pure fatty acids (C8–C24), Folin–Ciocâlteu reagent, and gallic acid were purchased from Sigma Aldrich (St. Louis, MO, USA). All chemicals were of analytical grade purity and were used without further purification.
Deionized water was obtained by a purification system Hydrolab 10 SP (Hydrolab, Straszyn, Poland). Hydrogen was supplied by UTP d.o.o. (Pula, Croatia), whereas air and helium were obtained from Messer Croatia Plin d.o.o. (Zaprešić, Croatia).

2.6. S and N Concentration Measurements

The concentration of S was measured following the procedure described by Vidović et al. [24].
A single-element standard solution of S (Inorganic Ventures, Christiansburg, VA, USA) was used to control the plasma positioning and preparation of calibration standard solutions. The calibration standard was prepared by serial dilution of a stock solution (concentration range from 0.01 to 100 mg/L). The accuracy of the procedure was tested using certified reference materials (WEPAL, Wageningen, The Netherlands) prepared in the same way as the samples. The most suitable emission lines without background and spectral interferences were selected for the detection.
The concentration of N was measured as follows: 50 mg of sample was accurately weighted into glass vials and suspended in 30 mL of HCl (0.2 M). The obtained mixture was homogenized using a dispersion drive (Ultra Turrax, IKA®-T10, Werke GmbH & Co. KG) for 1 min at a speed of 4. Then, the suspension was transferred to the equipment sampler and analyzed by a combustion–chemiluminescence method using a TOC analyzer equipped with a TN unit (TOC-L, TNM-L SSM, Shimadzu Corp., Kyoto, Japan).

2.7. Oil Extraction

One thousand grams of fruits were used for the oil production in two repetitions. Oil samples were extracted using Abencor laboratory oil-mill (MC2, Ingenierias y Sistemas S.L., Seville, Spain). The olives were ground with a metal hammer mill and then mixed at 25 ± 1 °C in vertical mixers for 40 min. One part of the obtained olive paste was used for water and oil content determination, while the other was centrifuged for 90 s at 3500 rpm. After centrifugation, the oil together with the water was transferred into a separation cylinder (MC2, Ingenierias y Sistemas, Seville, Spain). The separated oil was centrifuged for 1 min at 4000 rpm, decanted, and used for further analysis.

2.8. Determination of Water and Oil Content

The content of water was determined gravimetrically by drying fresh olive paste (FOP) at 80 °C until constant weight. The dried olive paste was collected in plastic containers and stored at −20 °C. Two grams of dry olive paste (DOP) sample was weighed in cellulose thimbles and submitted to extraction with 75 mL of petroleum ether using a 2055 Soxtec Avanti Manual System at 135 °C, which is the temperature recommended by the manufacturer (FOSS Tecator AB, Höganäs, Sweden). The extraction program was as follows: boiling for 30 min, rinsing for 60 min, and solvent recovery for 15 min. Exhaustive extraction was obtained by repeating the extraction program of the same laboratory sample for the second time. The oil content in DOP (% on dry weight basis) was calculated by weighting extracted oil and dividing its mass by DOP mass. All measurements were carried out in duplicate.

2.9. Olive Oil Yields

Olive oil extraction yield was calculated as the ratio of the mass of extracted oil and mass of olive paste used for the extraction. Furthermore, olive oil yield per tree was calculated by multiplying fruit yield per tree and previously defined oil extraction yield.

2.10. Free Fatty Acids (FFA), Peroxide Value (PV), and Extinction Coefficients Measurements

The percentage of FFA in virgin olive oil was determined according to HRN EN ISO 660:2010 [25], PV was determined according to HR EN ISO 3960:2010 [26], and K232, K270, and ΔK were determined according to HR EN ISO 3656:2011 [27].

2.11. TPC in Olive Oil

The TPC in oil samples was determined as follows: 2 g of virgin olive oil was mixed with 6 mL of methanol 80% (v/v). The mixture was vortexed for 1 min (Vortex, IKA, Staufen im Breisgau, Germany), sonicated for 15 min (Sonorex DigitecDT 100H; Bandelin, Berlin, Germany), and then centrifuged at 5000 rpm for 25 min (Universal 320R, Andreas Hettich GmbH & Co. KG, Tuttlingen, Germany). An aliquot of 0.1 mL was mixed with 5 mL of distilled water and 0.5 mL of Folin–Ciocâlteu reagent. To the obtained mixture, 1 mL of saturated sodium carbonate solution was added after 3 min. The obtained mixture was left to stand for 60 min at room temperature in a dark place before the absorbance at 725 nm was measured using a Cary 50 UV/Vis spectrophotometer (Varian, CA, USA). The final results were calculated against a standard curve of pure gallic acid and expressed as mg of gallic acid equivalents per kg of oil. All measurements were carried out in triplicate.

2.12. FAME Determination

The relative proportions of fatty acids were determined using the standardized method of the International Olive Council COI/T.20/doc. No. 33 [28]. Briefly, 0.1 g of oil sample was weighed into a 6 mL glass test tube and dissolved in heptane (2 mL). Then, 2 M potassium hydroxide solution in methanol (0.2 mL) was added and stirred vigorously for 30 s. After separation of the formed methyl esters, the solution was injected into the Varian CP-3800 gas chromatograph (Varian Inc., Harbour City, CA, USA), equipped with a Varian CP-8400 Autosampler and a Varian CP-1177 Split/Splitless Capillary Injector used in split mode, with an Rtx-2330 capillary column (Restek, Bellefonte, PA, USA), before being finally detected by a Varian 3350 flame ionization detector (FID). The analysis was performed applying a split of 1:60, a carrier gas pressure of 241 kPa at the column head, and the following temperature program: injector 250 °C, detector 255 °C, initial column temperature 100 °C, programmed to increase the temperature to 245 °C with a linear gradient of 2.5 °C/min. Helium was the carrier gas, and air and hydrogen were used for the detector flame. Identification of FAMEs was based on their retention times with respect to the standard FAME mixture. Each sample was analyzed in duplicate. The results are expressed as relative percentages of fatty acids (C14 to C24) determined as FAMEs, and the sums of percentages of SFAs, MUFAs, and PUFAs were calculated. The method and configuration of the gas chromatograph allowed the quantification of trans-fatty acids, but their percentage was less than 0.01%. The analysis was performed in the accredited laboratory. The precision of the method was checked to be in accordance with the precision data for each fatty acid (repeatability and reproducibility) provided by the standard method of analysis.

2.13. Statistical Analysis

A three-way analysis of variance (ANOVA) was performed for all the data, with treatment, cultivar, and year as the main factors. When it was necessary, the data were transformed and then subjected to analysis of variance. Multiple comparisons of means were based on a Tukey’s test at p ≤ 0.05. Results are reported as the mean ± SE. Statistical analysis was performed using the Statistica 13.2 software (StatSoft®, Palo Alto, CA, USA).

2.14. Graphical Content

Some figures were created with Biorender (https://biorender.com/).

3. Results

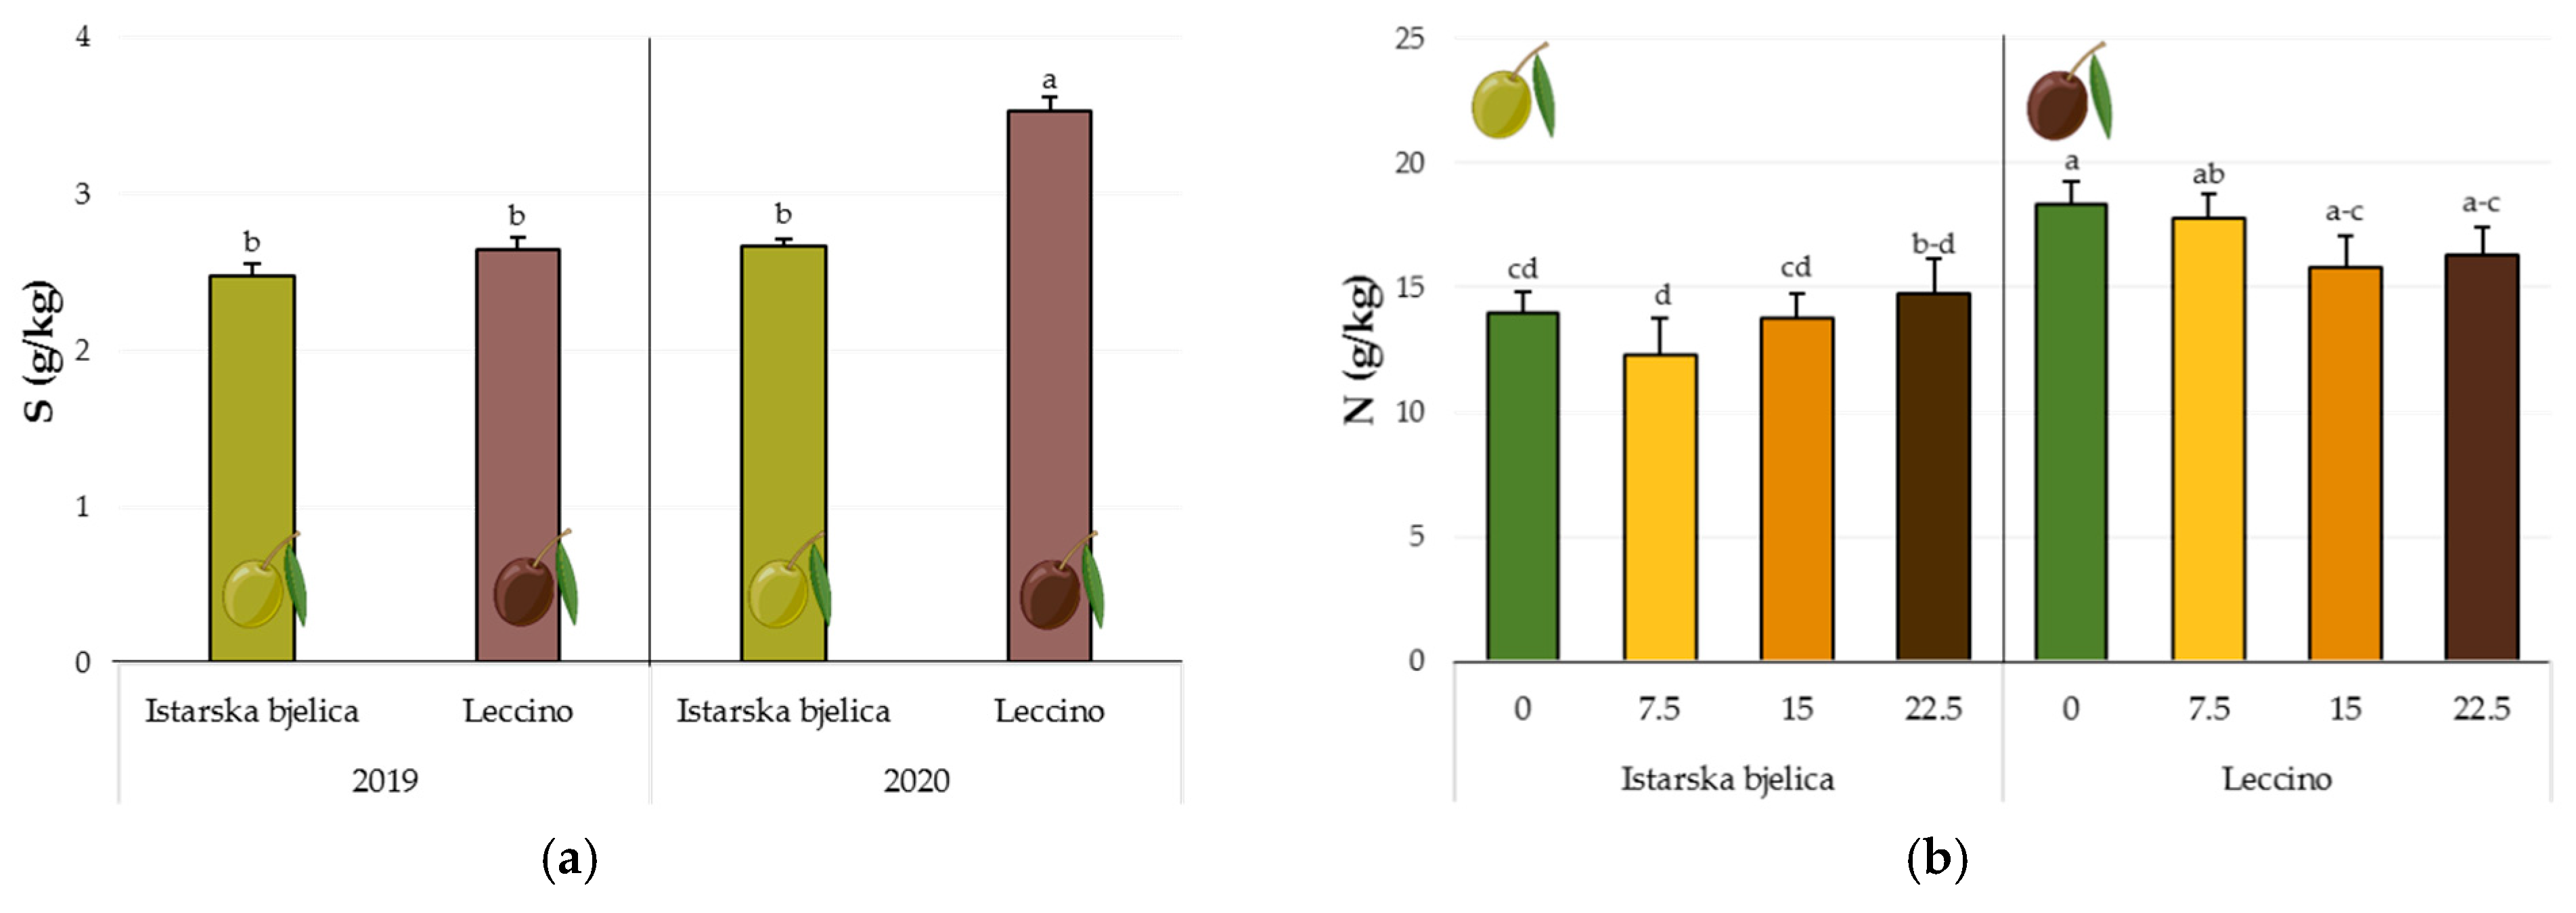
3.1. S and N Concentration in Olive Leaves
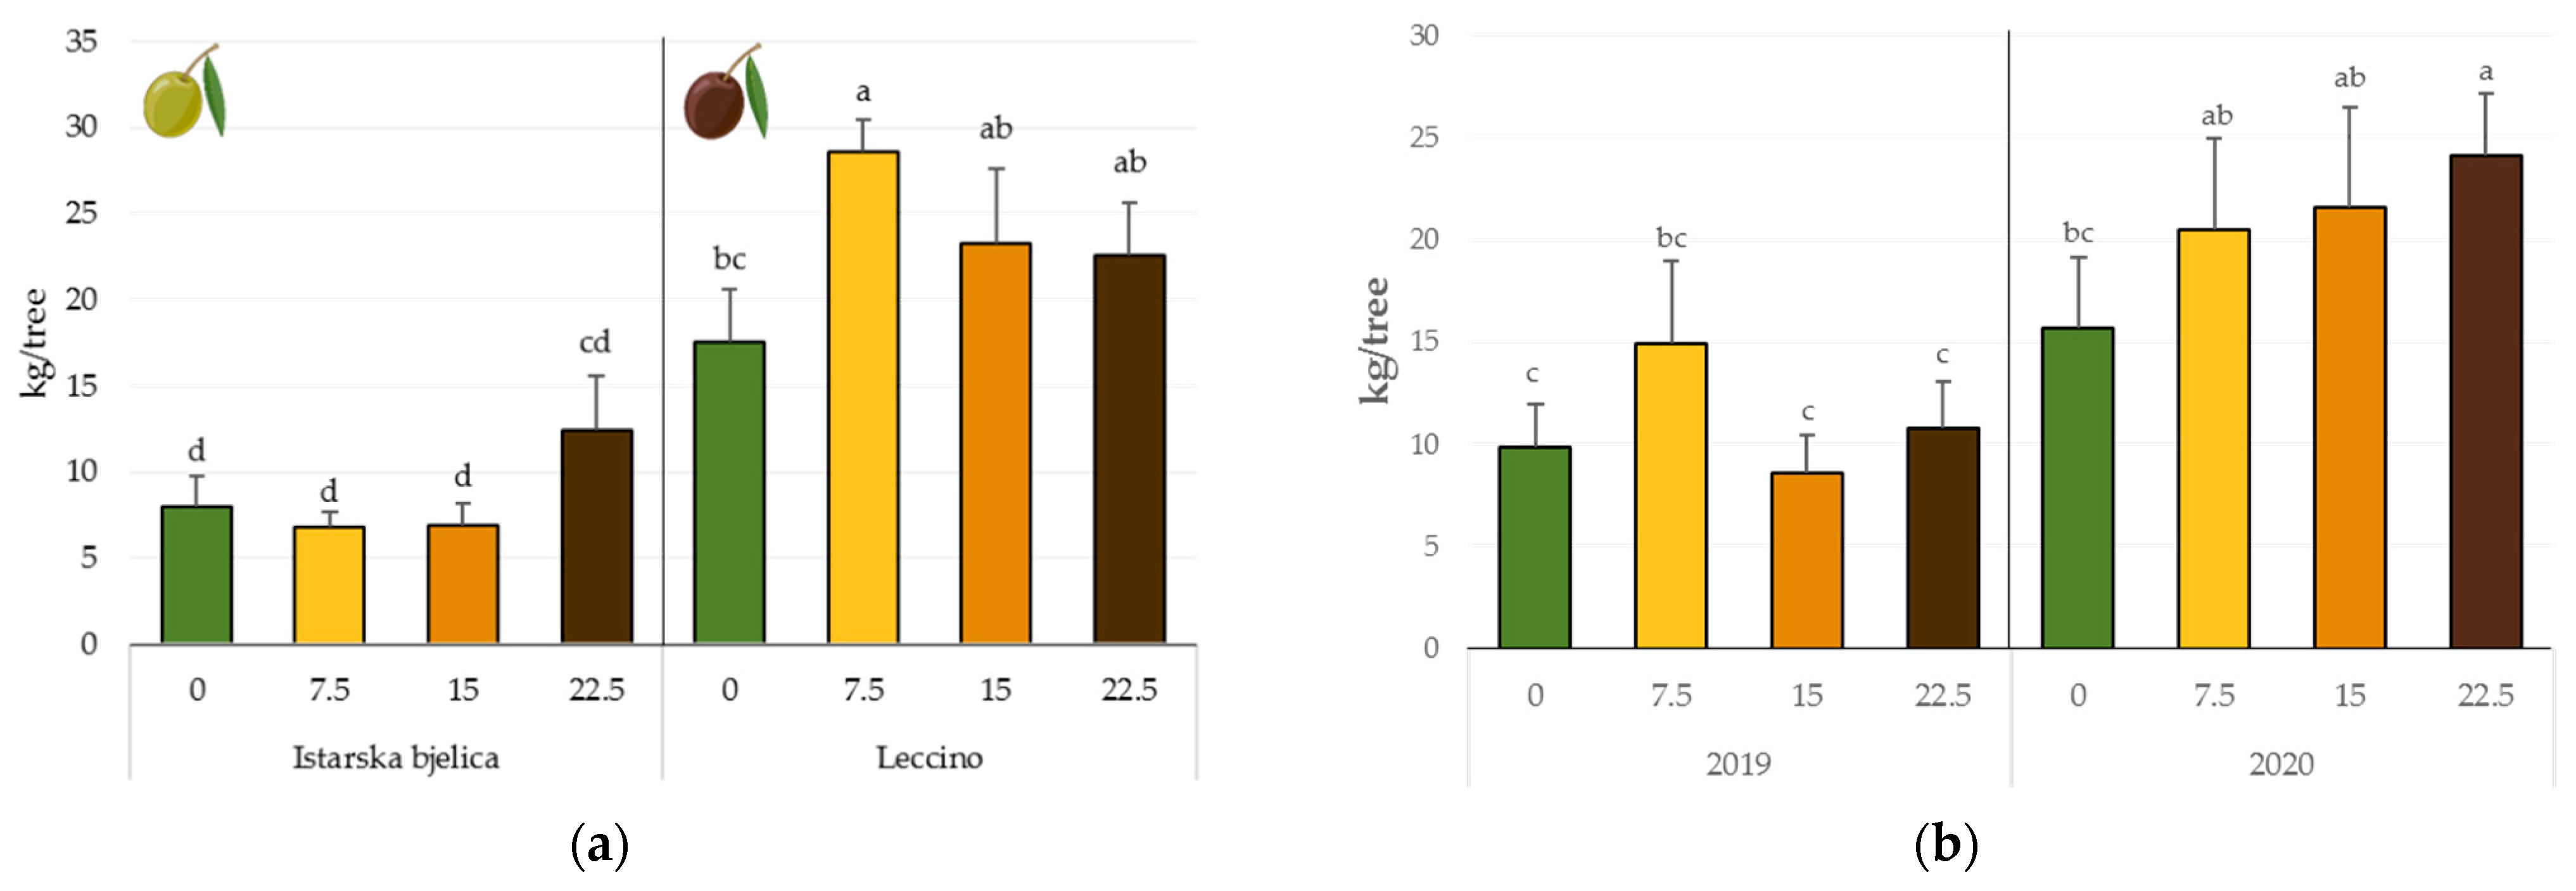
The S and N concentrations in the leaves of two olive cultivars ‘Istarska bjelica’ and ‘Leccino’ subjected to foliar fertilization with S-based fertilizer containing N (0 mL SN, 7.5 mL SN, 15 mL SN, and 22.5 mL SN) and collected in 2 years are reported in Table 2.
S concentration was significantly higher in leaves treated with 15 mL SN and 22.5 mL SN when compared to those treated with 7.5 mL SN and 0 mL SN, while no significant effect of applied treatments was observed for N concentrations. A significant first-order interaction between cultivar and year was observed for S showing higher concentration of this nutrient in ‘Leccino’ leaves in 2020 when compared to all other combinations. No difference in the concentration of S was noticed for ‘Istarska bjelica’ between the 2 years (Figure 2a). The concentration of N was notably affected by the interactive effect of the applied treatment and cultivar. Generally, ‘Leccino’ leaves were more abundant in N in relation to ‘Istarska bjelica’ leaves in 0 mL SN and 7.5 mL SN treatments (Table 2, Figure 2b). However, there were no significant differences between selected treatments for each cultivar.

3.2. Fruit Yield

For fruit yield, all the first-order interactions were significant (Table 3 and Figure 3). Notably higher yield was obtained for ‘Leccino’ fruits under 7.5 mL SN treatment with respect to the control one (Figure 3a). Results of the interactive effect of the treatment and year revealed that the higher yield obtained under S treatments was mainly due to the high fruit yield in 2020 (Figure 3b). Trees treated with 22.5 mL SN in 2020 resulted in the highest fruit yield when compared to the control treatment. Cultivar and year interaction revealed that ‘Leccino’ cultivar had higher yield in both investigated years (Figure 3c).

3.3. Fruit Morphology

The interaction of treatment and cultivar significantly affected all fruit morphological parameters except stone length and stone length-to-width ratio (Table 3). Considering treatment as the main factor, the longest stones were obtained with the highest S/N dose. Generally, ‘Istarska bjelica’ fruits were longer than ‘Leccino’ fruits, and the highest value was reached for ‘Istarska bjelica’ under 22.5 mL SN treatment, while the lowest values were obtained for ‘Leccino’ fruits under the 0 mL SN and 7.5 mL SN treatments (Figure S2a). Fruit length for both cultivars gradually increased as S amount was increased. The fruit length-to-width ratio of ‘Istarska bjelica’ fruits was the highest under 22.5 mL SN treatment differing from 0 mL SN and 7.5 mL SN treatments. Quite different results were obtained for ‘Leccino’ fruits where control fruits had the highest length-to-width ratio, differing significantly from 7.5 mL SN and 15 mL SN treatments (Figure S2b). Pulp percentage increased in fruits deriving from trees supplied with S and N. For ‘Istarska bjelica’ fruits, pulp percentage was the lowest in 0 mL SN treatment, while no difference was recorded between remaining three treatments. The pulp percentage of ‘Leccino’ fruits gradually increased from 0 mL SN to 15 mL SN treatment, but this value remained unchanged under 22.5 mL SN treatment when compared to 15 mL SN (Figure S2c).
The treatment by year interaction was significant for all fruit morphological parameters except for stone length and stone length-to-width ratio (Table 3). Treatment with the highest dose of S and N in 2019 gave the best results in terms of fruit length differing from all other treatment combinations, while the lowest value was recorded for the control treatment in 2020 (Figure S3a). In both years, fruit length increased with the increase in S and N concentrations in applied fertilizer. The fruit length-to-width ratio was affected in an irregular way (Figure S3b). In 2019, 0 mL SN and 15 mL SN treatments were significantly different, while, in 2020, 7.5 mL SN and 22.5 mL SN treatments differed. Pulp percentage was generally higher in 2020 peaking under 7.5 mL SN and 15 mL SN treatments, while the smallest value was found to be under control treatment in 2019 (Figure S3c).
The interaction of cultivar and year affected all fruit morphological parameters (Table 3). Fruit length (Figure S4a) and pulp percentage (Figure S4e) were higher in 2019, differing significantly between cultivars and from the values obtained in 2020. The length of ‘Istarska bjelica’ fruits in 2019 was lower than ‘Leccino’, while opposite results were gained in 2020 (Figure S4b). A significant drop in fruit length was observed for the ‘Leccino’ cultivar from 2019 to 2020. Generally, ‘Istarska bjelica’ stones were longer than those of ‘Leccino’, while this difference was higher in 2020 than in 2019. Changes in fruit and stone length-to-width ratio had the same trend (Figure S4c,d). No difference was noticed between cultivars in 2020, while fruit and stone length-to-width ratios were greater for ‘Leccino’ in 2019.
The second-order interaction was significant for masses of all parts of fruit, as well as fruit and stone width (Table 3, Figure S5). Fruit mass (Figure S5a) and width (Figure S5b) were the highest for ‘Istarska bjelica’ under 22.5 mL SN treatment in 2019, differing significantly from all other combinations. Instead, both parameters had the lowest values in control ‘Leccino’ fruits in 2020. An increase across the applied treatments was observed for both fruit mass and width. The widest stones were those of ‘Istarska bjelica’ under 22.5 mL SN treatment, together with ‘Leccino’ under 15 mL SN and 22.5 mL SN treatments (Figure S5c). Stone mass reached the highest value in ‘Leccino’ 22.5 mL SN-treated fruits in 2019 and the smallest in 0 mL SN ‘Istarska bjelica’ fruits in 2020 (Figure S5d). Stone mass was significantly lower for both cultivars in 2020, gradually increasing with the increase in S and N concentration. The same trend was also observed for 2019. ‘Istarska bjelica’ was characterized by a higher pulp mass (Figure S5e). In all combinations, pulp mass was higher in 22.5 mL SN than in the control treatment. The highest value was obtained for ‘Istarska bjelica’ fruits under 22.5 mL SN treatment of both years, and the smallest was obtained for control ‘Leccino’ fruits in 2020.

3.4. Moisture, Dry Matter, and Oil Content in Olive Paste, Oil Extraction Yield, and Oil Yield per Tree

The oil fraction in FOP was significantly higher in 2019 when compared to 2020, while exactly opposite results were obtained for the oil fraction in DOP (Table 4 and Table S4). Oil extraction yield was highly dependent on the cultivar, and it was two times higher for ‘Istarska bjelica’ than for ‘Leccino’ (Table 4).
The interaction of treatment and cultivar significantly affected olive oil yield per tree, resulting in higher values for the 22.5 mL SN treatment (1.96 L/tree) compared to the 7.5 mL (1.08 L/tree) and 15 mL treatments (1.05 L/tree) of ‘Istarska bjelica’ cultivar. Oil yield of ‘Leccino’ cv. was much higher in the 7.5 mL (2.44 L/tree) compared to 0 mL treatment (1.30 L/tree), and these values in 2020 (1.88 L/tree) were much higher when compared to 2019 (1.30 L/tree, Table S3).
Significant first-order interactions were observed for all parameters (Table 4 and Table S4). The interactive effect of treatment and cultivar affected both oil fractions in the same way (Figure S6), indicating that only ‘Leccino’ samples contributed to the differences in oil fractions among treatments. Values of both parameters were higher in ‘Istarska bjelica’ samples but without differences among the treatments, while, for ‘Leccino’, an increase was observed with the increase in fertilizer concentration.
The treatment by year interaction was significant for water and dry matter fractions and oil extraction yield (Table 4 and Table S4, Figure 4). A higher oil extraction yield was obtained in 2019, being the best yield of the 22.5 mL SN sample, differing significantly from all other combinations. All samples in 2020 gave similar oil extraction yields.
The interaction of all three main factors was significant for water and dry matter fractions (Table S4, Figure S7). The lowest values for water fraction were found in 22.5 mL SN ‘Leccino’ oil in 2019, together with all four samples of ‘Istarska bjelica’ of the same year. Exactly opposite results were obtained for dry matter fraction.

3.5. Quality Parameters

A significant change in ΔK values was observed only when cultivar was considered as the main factor, and a greater change in K values was observed for ‘Istarska bjelica’ cultivar. The percentage of FFA was higher in ‘Istarska bjelica’ oil samples. Regarding the first-order interaction of treatment and cultivar, it was significant for PV and K270 value (Table 4, Figure S8). PV was the highest for ‘Leccino’ cultivar under 22.5 mL SN treatment, differing significantly from other corresponding treatments. For ‘Istarska bjelica’, no significant change in PV was observed among treatments.
The interactive effect of treatment and year was significant for FFA and K270 value (Table 4, Figure S9). In general, FFA percentage was higher in 2020 than in 2019. The 0 mL SN treatment 2020 was the most abundant in FFA, differing from 15 mL SN and 22.5 mL SN treatments, while the smallest values were recorded for 0 mL SN, 7.5 mL SN, and 15 mL SN treatments in 2019 (Figure S9).
The cultivar by year interaction significantly affected PV, K232, and K270 values (Table 4, Figure S10). PV reached its maximum in ‘Leccino’ oil in 2019, followed by ‘Leccino’ from 2020, and then ‘Istarska bjelica’ oil from both years (Figure S10a). The K232 value differed significantly among cultivars in both years, being higher for ‘Istarska bjelica’, while the lowest value was observed in ‘Leccino’ oil from 2020 (Figure S10b).
The second-order interaction affected only K270 value (Table 4, Figure S11). The smallest value was recorded for ‘Leccino’ 15 mL SN treatment in 2019, with this value being significantly different from the corresponding values obtained for 7.5 mL SN and 22.5 mL SN treatments. No difference was observed among treatments for both cultivars in 2020 and all treated ‘Istarska bjelica’ samples in 2019.
Only the first-order interactions were observed for the TPC in olive oil (Table S4, Figure S12). All oil samples from 2019 contained higher amounts of phenols than those from 2020 (Figure S12). When the interaction of cultivar and year was considered, ‘Istarska bjelica’ was more abundant in phenols than ‘Leccino’ because the values in 2019 for both cultivars were higher than in 2020.

3.6. Fatty Acids

None of the studied parameters nor their interactions had an effect on the concentration of oleic (C18:1) acid (Table S5). Treatments significantly affected the concentration of C14:0 fatty acid (Table S5), whose concentration was the highest in the 0 mL SN treatment, differing significantly from the 22.5 mL SN treatment.
The first-order interaction between treatment and cultivar was significant only for C16:1 (Figure S13). The concentration of this acid under 22.5 mL SN treatment was significantly higher in oils of ‘Leccino’ cultivar with respect to the oils of ‘Istarska bjelica’ cultivar, while in other treatments did not vary between the studied cultivars.
Treatment and year interaction had a significant impact on the concentration of C17:1 and C20:1 fatty acids (Figure S14). The concentration of C17:1 was lower in 2019. In particular, the 15 mL SN treatment contained the lowest amount of this compound and differed significantly from the control treatment of the same year and from all treatments in 2020. The concentration of C20:1 was significantly lower in 7.5 mL SN treatment in 2020 differing from all other combinations.
The interaction between cultivar and year had an impact on the concentration of the majority of fatty acids (Figure S15). In particular, the concentration of C18:0 was lower in ‘Leccino’ oil in 2020. On the contrary, C16:0 and C20:0 reached a maximum concentration in the previously mentioned sample. ‘Istarska bjelica’ in 2020 contained the highest concentration of C17:0, C22:0, and C24:0 fatty acids. The concentration of C18:3 was higher in both samples in 2019 when compared to 2020.
The second-order interaction was significant only for the concentration of C18:2 fatty acid. A constant decrease in the concentration of this acid was found for ‘Leccino’ samples in 2020, albeit without statistical significance (Figure S16). Samples of this cultivar obtained under 22.5 mL S N treatment were significantly different between the 2 years.
‘Leccino’ oil contained a higher percentage of MUFAs (Table S6). The interactive effect of the cultivar and year had a significant effect on SFAs concentration. The percentage of SFAs was the highest in ‘Leccino’ samples in 2020 (Figure S17). The second-order interaction was significant only for PUFAs percentage (Figure S18). Generally, ‘Leccino’ samples from 2020 contained a lower percentage of PUFAs when compared to all others, but the only significant difference was noticed for ‘Leccino’ samples under 22.5 mL treatment from 2019, which contained more PUFAs with respect to the corresponding samples from 2020.

4. Discussion

4.1. S and N Concentration in Olive Leaves

To the best of our knowledge, no previous studies evaluating the effects of combined S and N nutrition on the olive oil nutritional quality and olive fruit morphological parameters have been reported to date. Determination of leaf nutrient status is the best method for predicting the tree nutritional requirements and, consequently, for planning future fertilization [29]. Carciochi et al. [30] published that N fertilization increased S concentration and uptake, similar to other authors who observed the synergistic effect of these two nutrients [7]. According to that relationship, in our experiment, N (maximum N concentration in foliarly applied fertilizer was 4.5 g/ L) was added primarily to improve S assimilation and uptake; however, given that the amount of applied N required to significantly increase N status in olive leaves is reported to be 2–4 times greater than the highest amount used in this experiment [31,32], it is not surprising that, in this work, a significant increase in S concentration was only observed in leaves (Table 2). Too high concentrations of N can affect oil quantity [33] and quality by increasing the content of free fatty acids while reducing the polyphenolic content in oil. As a consequence, fruit resistance to fungal pathogens is reduced, which further impairs oil quality [34]. In our experiment, the concentration of N, as well as the concentration of S, in olive leaves was adequate in all treatments [35,36]. Taking into account that S plays an important role in many biological functions and increases the oil yield, results of leaf nutrient status obtained in the current study are a good indicator that the here-reported fertilization program could increase oil quantity and quality. The two investigated cultivars significantly differed in S and N concentrations, suggesting that nutrient status is heavily reliant on the genotype [37,38]. In addition, in 2020, the concentration of both nutrients was higher than in 2019, which can be partially attributed to the weather dependency; however, one of the most likely reasons is repeated application of nutrients in 2020 on already treated plants in 2019.

4.2. Fruit Yield

The use of mineral fertilizers is reported to be the most important factor, contributing 50% of the plant yield [39]. Verenyiova et al. [40] published that the highest yield for oilseed rape was obtained in the treatment with medium dose of S, while the lowest was obtained in the treatment with the highest dose of S. For soybean, contradictory results were obtained. Zerihun et al. [41] reported an improved yield with the increase in S concentration, while Chowdhury et al. [42] did not observe any yield change. Belikova et al. [43] found that, for apple trees, increased S concentrations increased fruit yields. Fruit yield in the current study was significantly affected by interactions with cultivar or year (Table 3); thus, it was not easy to make a conclusion on how S/N supply influences fruit yield and consequently oil yield. Fruit yield was also highly dependent on the type of cultivar and year. ‘Leccino’ had twofold higher yield than ‘Istarska bjelica’, while threefold better yield was obtained in 2020. Generally, water stress has a negative effect on fruit yield. June and August of 2020 were characterized by much higher precipitation (Figure 1, 78.3 mm and 86.3 mm, respectively) when compared to the same months of 2019 (2.1 mm and 10.4 mm, respectively). Since June–August are crucial months for fruit formation, such climatic conditions could be a reason for better yield obtained in 2020. Lavee and Wodner [44] reported that fruit yield is influenced mainly by agronomical and environmental conditions. This may be easily linked to the difference in cultivar flowering response to the various agroecological factors. It has been reported that lower temperature in May can prolong the flowering period [45], consequently leading to the lower fruit yield. May of 2019 was colder with respect to the same period of 2020. Another possible explanation is a higher leaf concentration of S and N in 2020. The synergistic effect of all above-described parameters probably led to the higher yield obtained in 2020.

4.3. Fruit Morphology

Fruit morphological analysis is reported to be an efficient method for the characterization and discrimination of olive cultivars [46]. The description of morphological parameters is of a great importance for phenomic studies since fruit shape and size are different depending on the type of cultivar. In addition, they also depend on the growing conditions. The mass of mature olive fruits ranges from 1.5 to 4.5 g, of which 70–80% is represented by pulp and 15–25% is represented by stone. In the current study, fruit mass varied between 2.47 g in the 0 mL SN treatment and 3.35 g in 22.5 mL SN treatment. Pulp was represented by 80% in the control treatment, while this percentage under S/N fertilization was even higher. All morphological parameters were significantly improved under upgraded S and N nutrition (Table 3). These results are closely related to those obtained for fruit yield and are in excellent agreement with earlier-published results [3]. As expected, all parameters differed between cultivars, confirming that fruit growth is genetically determined. It is important to underline that ‘Leccino’ cultivar had a much greater stone and lower pulp content with respect to ‘Istarska bjelica’. Fruit growth parameters varied also between the years and were mostly improved in 2019.

4.4. Moisture, Dry Matter, and Oil Content

Before oil production, fruit maturity was evaluated because it is supposed to be one of the parameters linked to the oil quality. To define the maturity index (MI), skin and pulp color were evaluated according to Uceda and Frias [21]. In both years, the MI of ‘Istarska bjelica’ fruits was around 1, while that of ‘Leccino’ fruits was around 2 (Table S2). Generally, ‘Istarska bjelica’ showed a lower MI, while year had no impact on this parameter.
In our study, around 60% of the olive paste weight was represented by water and was significantly affected by all three main parameters (Table S4). The ‘Istarska bjelica’ cultivar was characterized by lower moisture content, indicating that this cultivar is more influenced by seasonal rainfall. A medium dose of S-based fertilizer caused the highest moisture content, while, in 2019, water fraction was lower probably due to the lower precipitation during the summer months. Due to the great influence of climatic conditions on oil content expressed on a fresh weight base, another common way is to express it on the basis of dry weight. Oil content was somewhat less than 20% in the FOP (Table 4), while in DOP, it was around 40% (Table S4) and, in both cases, was significantly improved by S and N supply. This parameter can be considered as cultivar-dependent since ‘Istarska bjelica’ contained around 35% more oil in both FOP and DOP.

4.5. Oil Yields

Around 70% of olive oil derives from the pulp, and the remaining 30% derives from the stone [47]. Oil extraction yield in 2019 was significantly improved by upgraded S and N supply and reached around 16% under the treatment with the highest S/N dose (Figure 4). An increase in oil extraction yield under S application has been reported in sunflower and groundnut [48], in rapeseed mustard [49], in canola [33,50,51], and in sesame [52]. A strong effect of genotype on the oil extraction yield was confirmed in this experiment. It is important to underline that the oil extraction yield of ‘Istarska bjelica’ was almost twice as high as that of ‘Leccino’. Taking into account that ‘Istarska bjelica’ is a cultivar characterized by higher pulp percentage and smaller stone, and that oil derives mostly from the pulp, such results for oil extraction yield were expected. Furthermore, ‘Istarska Bjelica’ was already characterized as cultivar with high and ‘Leccino’ as cultivar with low oil content [23]. However, the fruit yield of ‘Istarska bjelica’ cultivar was significantly lower than that of ‘Leccino’.
Climatic conditions showed an important impact on the oil extraction yield. In 2019, yield was significantly higher than in 2020, although the oil fraction in DOP was higher in 2020. A possible explanation is the very high precipitation in October of 2020 close to harvesting time, since fruit moisture has a great impact on the extraction process, giving emulsions that lead to the low oil extraction yield [53].
Since the results for oil extraction yield and the results for fruit yield are not in agreement, we calculated olive oil yield per tree. The interaction of treatment and cultivar showed a tendency of S/N treatments to increase oil yield per tree, which was further cleared when main factors were considered, thus confirming a positive impact of 22.5 mL treatment, ‘Leccino’ cv., and 2020 on olive oil productivity.

4.6. Quality Parameters

To be classified as EVOO, oil samples must meet certain criteria. Quality parameters of olive oil include a PV, as well as K232 and K270 values, together with total phenolic and fatty acid content. In particular, the PV has to be smaller than or equal to 20, along with K232 ≤ 2.5, K270 ≤ 0.22, and ΔK ≤ 0.01. According to quality parameters analyses, our oil samples met the requirements to be classified as extra virgin [54] (Table 4). PV is a very useful quality parameter in unsaturated fats and oils used to evaluate their commercial and nutritional value, and it is an indicator of a good oil conservation [47]. It describes the level to which autoxidation has advanced, since peroxides are intermediates in this reaction. The highest dose of S and N in our study increased PV, while still maintaining it way below the upper limit for EVOO, thus confirming the low autoxidation level of oil samples. The autoxidation was shown to be cultivar-dependent and was higher in ‘Leccino’ oil. Samples were more stable against primary oxidation in 2020. Together with PV, K232 provides additional information about primary oxidation reactions. In our samples, K232 remained unchanged under the applied treatments, suggesting that S and N application do not catalyze peroxides formation. The K270 value, instead, describes the secondary oxidation process and was the highest under 22.5 mL SN treatment but still below the limits for the EVOO. Both K values were dependent on the type of cultivar and year, being lower for ‘Leccino’ samples and in 2019. No significant change in ΔK was found for none of the main effects.

4.7. TPC

Leaf N concentration is very important due to the fact that TPC is influenced by the N status. Results obtained in this study confirm the aforementioned fact since TPC remained unchanged under the applied treatments (Table S4). Regarding cultivar, in ‘Istarska bjelica’ which contained less N when compared to ‘Leccino’, the content of phenols was higher. In addition to N concentration, the TPC is dependent on the cultivar and climate [55]; thus, the higher TPC obtained in this study for ‘Istarska bjelica’ could be a result of the effect of N status which has been defined to be genotype dependent. As for year, according to Brito et al. [1], the different trend in phenol accumulation could be ascribed to the different climatologic conditions. The summer stress in 2019 during the fruit development and rainfall in 2020 close to harvesting time (125.7 mm) justify the obtained results.

4.8. Fatty Acids

The ratio between different fatty acids in oil is very important and can determine its use. An adequate supply of N and S can affect the metabolic pathway of fatty acids, resulting in their different relative content [1]. Our samples, as expected, contained a very high amount of MUFAs (over 70%, Table S6). In particular, the most common one was oleic acid (C18:1, Table S5). Other detected MUFAs were palmitoleic (C16:1), heptadecanoic (C17:1), gadoleic (C20:1), and erucic (C22:1) acids. A significant effect of S and N nutrition was observed only for the latter two. The gadoleic acid concentration was the lowest under 7.5 mL SN treatment, being equal in all others, while erucic acid concentration increased proportionally with the increase in S and N concentration. These results are in disagreement with those published by Ahmad et al. [3] who reported a significant decrease in oleic and erucic acid concentrations under S supply. Chain elongation of oleic acid gives as a product erucic acid; thus, their concentrations should be inversely proportional. The safe limit for erucic acid is less than 2% erucic acid in oil, a criterion that was satisfied in our samples. A reduced erucic-to-oleic acid ratio improves the oil quality. We obtained the lowest ratio under 7.5 mL SN treatment, while this ratio was similar in the remaining treatments (data not shown). The erucic-to-oleic acid ratio was reported to be closely related to the N:S ratio in seeds of rapeseed [3]. Our results could not confirm this thesis. The percentage of PUFAs in all samples was lower than the percentage of SFAs. The most important PUFA acid is linoleic (C18:2), while others were not present in detectable amounts. The oleic-to-linoleic acid ratio can also be used as an indicator of the oxidative stability and, thus, quality of olive oil. The determined ratio in all samples was greater than 10 (data not shown), indicating very high oxidative stability. Regarding SFAs, compounds related to the increased content of low-density lipoproteins (LDL) cholesterol [56], the most important are palmitic (C16:0) and stearic (C18:0) acids. Furthermore, we detected the presence of myristic (C14:0), margaric (C17:0), arachidic (C20:0), behenic (C22:0), and lignoceric acids (C24:0). Although several authors reported an increase in the content of stearic and palmitic acid under S supply [7,33], in our samples, they remained unchanged. The content of all examined fatty acids was in the range prescribed for EVOO. The percentage of SFAs, MUFAs, and PUFAs did not change under the treatments, leading to the conclusion that S and N nutrition did not affect fatty acid composition.
The difference in fatty acid composition of VOOs is known to depend mainly on the olive variety, which can be partially related to their biosynthesis during ripening. We observed different fatty acid patterns between cultivars, confirming the possibility of discriminating the olive oils on the basis of fatty acid profile [57]. While the percentage of SFAs remained unchanged, ‘Leccino’ cultivar contained a higher percentage of MUFAs and a lower percentage of PUFAs (Table S6). Since the ratio of MUFAs to SFAs remained almost unchanged (data not shown), it was not possible to say that one of the cultivars gave oil with improved quality and stability against oxidative damage with respect to the other. The percentage of SFAs and PUFAs was dependent on the year. Samples from 2020 contained more SFAs, while those from 2019 contained more PUFAs, leading to PUFA-to-SFA ratios of 2.39 and 2.73, respectively. Since a lower ratio means higher stability of oil, we can conclude that, in 2019, the oil quality was somewhat higher.

5. Conclusions

Foliar application of S and N increased only S concentration in leaves leaving N concentration unchanged. Fruit yield and olive oil yield per tree were significantly improved under combined S/N fertilization and were found to be highly cultivar-dependent. For ‘Leccino’ cultivar, a twofold higher fruit yield was obtained when compared to ‘Istarska bjelica’. All fruit morphological parameters were improved under upgraded S and N nutrition and, as expected, differed between cultivars, confirming that fruit shape and size are genetically determined. In addition to the fruit yield, S and N supply also improved oil yield per tree, reaching its maximum under the treatment with the highest S/N dose. In addition to treatments, oil yield per tree was strongly affected by genotype. Oil yield per tree obtained for ‘Istarska bjelica’ was threefold lower than that of ‘Leccino’, in agreement with results gained for fruit yield. The combined S/N fertilization program did not have any impact on oil quality. Although some quality parameters were affected by applied treatments, all of them were within the allowed limits for extra virgin olive oils, suggesting that S/N supply does not catalyze the autoxidation of oil samples. Applied treatments did not affect TPC or FAME concentrations. Our observations are important from the economic point of view since the here-described fertilization program can improve olive fruit and oil quantity without affecting the oil quality, and it might be useful to develop efficient agronomic management practices for sustainable crop production.

Supplementary Materials

The following supporting information can be downloaded at https://www.mdpi.com/article/10.3390/horticulturae8030203/s1: Table S1. Physicochemical properties of the soil; Table S2. Mean maturity indices during the harvesting in 2019 and 2020; Table S3. The effect of treatment (T) (0, 7.5, 15, and 22.5 mL of applied SN foliar fertilizer per 1 L of water), cultivar (Cv.) (Istarska bjelica, Leccino) and collection year (Y) (2019, 2020) on olive oil yield per tree; Table S4. The effect of treatment (T) (0, 7.5, 15, and 22.5 mL of applied SN foliar fertilizer per 1 L of water), cultivar (Cv.) (Istarska bjelica, Leccino), and collection year (Y) (2019, 2020) on water and dry matter fractions in fresh olive paste (FOP), oil fraction in dry (DOP) olive paste and total phenolic content (TPC) in olive oil; Table S5. The effect of treatment (T) (0, 7.5, 15, and 22.5 mL of applied SN foliar fertilizer per 1 L of water), cultivar (Cv.) (Istarska bjelica, Leccino), and collection year (Y) (2019, 2020) on fatty acid profile in olive oil; Table S6. The effect of treatment (T) (0, 7.5, 15, and 22.5 mL of applied SN foliar fertilizer per 1 L of water), cultivar (Cv.) (Istarska bjelica, Leccino), and collection year (Y) (2019, 2020) on percentage of saturated (SFA), monounsaturated (MUFA), and polyunsaturated (PUFA) fatty acids in olive oil; Figure S1. Fruits used as reference to determine the maturity index; Figure S2. Multiple comparisons of the effects of treatment and cultivar on olive fruit morphological parameters; Figure S3. Multiple comparisons of the effects of treatment and year on olive fruit morphological parameters; Figure S4. Multiple comparisons of the effects of cultivar and year on olive fruit morphological parameters; Figure S5. Multiple comparisons of the effects of treatment, cultivar, and year on olive fruit morphological parameters; Figure S6. Multiple comparisons of the effects of treatment and cultivar on olive oil percentage; Figure S7. Multiple comparisons of the effects of treatment, cultivar, and year on water and dry matter fractions in olive oil; Figure S8. Multiple comparisons of the effects of treatment and cultivar on peroxide value (PV) of olive oil; Figure S9. Multiple comparisons of the effects of treatment and year on free fatty acids (FFA) content in olive oil; Figure S10. Multiple comparisons of the effects of cultivar and year on olive oil quality parameters; Figure S11. Multiple comparisons of the effects of treatment, cultivar, and year on K270 values in olive oil; Figure S12. Multiple comparisons of the effects of: (a) treatment and year on the total phenolic content (TPC), and (b) cultivar and year on the TPC in olive oil; Figure S13. Multiple comparisons of the effects of treatment and cultivar on the concentration of C16:1 fatty acid in olive oil; Figure S14. Multiple comparisons of the effects of treatment and year on the concentration of C17:1 and C20:1 fatty acids in olive oil; Figure S15. Multiple comparisons of the effects of cultivar and year on the concentration of fatty acids in olive oil; Figure S16. Multiple comparisons of the effects of treatment, cultivar, and year on the concentration of C18:2 fatty acid in olive oil; Figure S17. Multiple comparisons of the effects of cultivar and year on the concentration of saturated fatty acids (SFAs) in olive oil; Figure S18. Multiple comparisons of the effects of treatment, cultivar, and year on the concentration of polyunsaturated fatty acids (PUFAs) in olive oil.

Author Contributions

Conceptualization, I.P. (Igor Pasković) and S.G.B.; validation and formal analysis, M.L., M.J.Š. and I.P. (Igor Palčić); investigation, Š.M., I.P. (Igor Pasković) and K.G.; data curation, Š.M., N.V. and I.P. (Igor Pasković); writing—original draft preparation, Š.M., N.V., I.P. (Igor Pasković) and S.G.B.; writing—review and editing, Š.M., N.V., I.P. (Igor Pasković), M.L., M.J.Š., I.L., M.P. (Marko Petek), M.P. (Marija Pecina), M.H.Ć., D.B., K.G., M.P.P., M.C., P.P. and S.G.B., visualization, N.V. and K.G.; funding acquisition, I.P. (Igor Pasković); project administration, I.P. (Igor Pasković), Š.M., N.V., K.G., M.C. and M.P.P. All authors have read and agreed to the published version of the manuscript.

Funding

This research was supported in part by the Croatian Science Foundation under the project “Phytochemical Farming: Mineral Nutrients and Elicitors Application to Enhance Olive Leaf Phenolics” (UIP-2017-05-8464). In addition, the work of doctoral students Kristina Grozić, Marija Polić Pasković, and Marin Cukrov was supported in part by the “Young researchers’ career development project—training of doctoral students” program under the Croatian Science Foundation projects, DOK-2018-09-1841 (K.G.), DOK-2021-02-5517 (M.P.P.), and DOK-2020-01-3872 (M.C.).

Institutional Review Board Statement

Not applicable.

Informed Consent Statement

Not applicable.

Data Availability Statement

The data presented in this study are available on request from the corresponding author.

Conflicts of Interest

The authors declare no conflict of interest.

References

  1. Brito, C.; Dinis, L.T.; Moutinho-Pereira, J.; Correia, C.M. Drought stress effects and olive tree acclimation under a changing climate. Plants 2019, 8, 232. [Google Scholar] [CrossRef] [Green Version]
  2. Alves, E.; Melo, T.; Barros, M.P.; Domingues, M.M.R.; Domingues, P. Lipidomic Profiling of the Olive (Olea europaea L.) Fruit towards Its Valorisation as a Functional Food: In-depth identification of triacylglycerols and polar lipids in Portuguese olives. Molecules 2019, 24, 2555. [Google Scholar] [CrossRef] [Green Version]
  3. Ahmad, A.; Abdin, M.Z. Effect of sulphur application on lipid, RNA and fatty acid content in developing seeds of rapeseed (Brassica campestris L.). Plant Sci. 2000, 150, 71–76. [Google Scholar] [CrossRef]
  4. Charoenprasert, S.; Mitchell, A. Factors influencing phenolic compounds in table olives (Olea europaea). J. Agric. Food Chem. 2012, 60, 7081–7095. [Google Scholar] [CrossRef]
  5. Brighente, I.M.C.; Dias, M.; Verdi, L.G.; Pizzolatti, M.G. Antioxidant activity and total phenolic content of some Brazilian species. Pharm. Biol. 2007, 45, 156–161. [Google Scholar] [CrossRef]
  6. Talhaoui, N.; Taamalli, A.; Gómez-Caravaca, A.M.; Fernández-Gutiérrez, A.; Segura-Carretero, A. Phenolic compounds in olive leaves: Analytical determination, biotic and abiotic influence, and health benefits. Food Res. Int. 2015, 77, 92–108. [Google Scholar] [CrossRef]
  7. Aulakh, M.S.; Malhi, S.S. Interactions of Nitrogen with Other Nutrients and Water: Effect on Crop Yield and Quality, Nutrient Use Efficiency, Carbon Sequestration, and Environmental Pollution. Adv. Agron. 2005, 86, 341–409. [Google Scholar] [CrossRef]
  8. Malhi, S.S.; Gill, K.S. Effectiveness of sulphate-S fertilization at different growth stages for yield, seed quality and S uptake of canola. Can. J. Plant Sci. 2002, 82, 665–674. [Google Scholar] [CrossRef]
  9. Pasricha, N.S.; Sahota, N.S. Yield, nutrient concentration and quality of mustard crops as influenced by nitrogen and sulphur fertilizers. J. Agric. Sci. 1980, 94, 545–549. [Google Scholar] [CrossRef]
  10. Chowdhury, M.A.H.; Sultana, T.; Rahman, M.A.; Saha, B.K.; Chowdhury, T.; Tarafder, S. Sulphur fertilization enhanced yield, its uptake, use efficiency and economic returns of Aloe vera L. Heliyon 2020, 6, e05726. [Google Scholar] [CrossRef]
  11. Brosnan, J.; Brosnan, M.E. Amino Acid Assessment Workshop. J. Nutr. 2006, 136, 16365–16405. [Google Scholar]
  12. Ergle, D.R.; Eaton, M. Sulphur nutrition of Aloe vera plants. J. Plant Physiol. 2005, 26, 639–6546. [Google Scholar] [CrossRef] [PubMed] [Green Version]
  13. Hasanuzzaman, M.; Nahar, K.; Anee, T.I.; Fujita, M. Glutathione in plants: Biosynthesis and physiological role in environmental stress tolerance. Physiol. Mol. Biol. Plants 2017, 23, 249–268. [Google Scholar] [CrossRef] [PubMed]
  14. Šegota, T.; Filipčić, A. Köppen’s classification of climates and the problem of corresponding Croatian terminology. Geoadria 2003, 8, 17–37. [Google Scholar] [CrossRef] [Green Version]
  15. HRN ISO 10390; Kakvoća tla–Određivanje pH-Vrijednosti (ISO 10390:2005). Hrvatski Zavod za Norme: Zagreb, Hrvatska, 2005.
  16. HRN ISO 11261; Kakvoća tla–Određivanje Ukupnog Dušika–Prilagođena Kjedahlova Metoda (ISO 11261:1995). Hrvatski Zavod za Norme: Zagreb, Hrvatska, 2004.
  17. ISO 14235; Soil Quality—Determination of Organic Carbon by Sulfochromic Oxidation. International Organization for Standardization: Genève, Switzerland, 1998.
  18. HRN ISO 10693; Kakvoća tla–Određivanje Sadržaja Karbonata-Volumetrijska Metoda (ISO 10693:1995). Hrvatski Zavod za Norme: Zagreb, Hrvatska, 2004.
  19. Egner, H.; Riehm, H.; Domingo, W.R. Untersuchung über die chemische Bodenanalyse als Grundlage für die Beurteilung des Nahrstoffzustanden der Boden. II. Chemische Extraktionsmethoden zur Phosphor und Kaliumbestimmung. K. LantbR. HogsK. AnniR. W. R. 1960, 26, 199–215. [Google Scholar]
  20. Pasković, I.; Herak Ćustić, M.; Pecina, M.; Bronić, J.; Ban, D.; Radić, T.; Pošćić, F.; Jukić Špika, M.; Soldo, B.; Palčić, I.; et al. Manganese soil and foliar fertilization of olive plantlets: The effect on leaf mineral and phenolic content and root mycorrhizal colonization. J. Sci. Food Agric. 2019, 99, 360–367. [Google Scholar] [CrossRef] [Green Version]
  21. Uceda, M.; Frias, L. Evolution of the Fruit Oil Content, Oil Composition and Oil Quality. In Proceedings of the II Seminario Oleícola Internacional; International Olive Oil Council: Cordoba, Spain, 1975; p. 125130. [Google Scholar]
  22. Guzmán, E.; Baeten, V.; Pierna, J.A.F.; García-Mesa, J.A. Determination of the olive maturity index of intact fruits using image analysis. J. Food Sci. Technol. 2015, 52, 1462–1470. [Google Scholar] [CrossRef] [Green Version]
  23. Barranco, D.; Cimato, A.; Fiorino, P.; Rallo, L.; Touzani, A.; Castaneda, C.; Serafini, F.; Trujillo, I. World Catalogue of Olive Varietes; International Olive Oil Council: Madrid, Spain, 2000. [Google Scholar]
  24. Vidović, N.; Pasković, I.; Lukić, I.; Žurga, P.; Majetić Germek, V.; Grozić, K.; Cukrov, M.; Marcelić, Š.; Ban, D.; Talhaoui, N.; et al. Biophenolic profile modulations in olive tissues as affected by manganese nutrition. Plants 2021, 10, 1724. [Google Scholar] [CrossRef]
  25. HRN ISO 660; Životinjske i Biljne Masti i Ulja–Određivanje Kiselinskog Broja i Kiselosti (ISO 660:2009; EN ISO 660:2009). Hrvatski Zavod za Norme: Zagreb, Hrvatska, 2010.
  26. HRN ISO 3960; Životinjske i Biljne Masti i Ulja–Određivanje Peroksidnog Broja–Jodometrijsko Određivanje Točke Završetka (ISO 3960:2007, Ispravljena Verzija 2009-05-15; EN ISO 3960:2010). Hrvatski Zavod za Norme: Zagreb, Hrvatska, 2010.
  27. HRN ISO 3656; Životinjske i Biljne Masti i Ulja–Određivanje Apsorbancija u Ultraljubičastom Spektru Izraženih kao Specifična UV Ekstinkcija (ISO 3656:2011; EN ISO 3656:2011). Hrvatski Zavod za Norme: Zagreb, Hrvatska, 2011.
  28. International Olive Council. Determination of Fatty Acid Methyl Esters by Gas Chromatography. COI/T.20/Doc. No 33/Rev. 1. 2017. Available online: https://www.internationaloliveoil.org/wp-content/uploads/2019/11/COI-T.20-Doc.-No-33-Rev.-1-2017.pdf. (accessed on 31 December 2021).
  29. Fernández-Escobar, R.; Moreno, R.; García-Creus, M. Seasonal changes of mineral nutrients in olive leaves during the alternate-bearing cycle. Sci. Hortic. (Amst.) 1999, 82, 25–45. [Google Scholar] [CrossRef]
  30. Carciochi, W.D.; Salvagiotti, F.; Pagani, A.; Reussi Calvo, N.I.; Eyherabide, M.; Sainz Rozas, H.R.; Ciampitti, I.A. Nitrogen and sulfur interaction on nutrient use efficiencies and diagnostic tools in maize. Eur. J. Agron. 2020, 116, 126045. [Google Scholar] [CrossRef]
  31. Fernández-Escobar, R.; García-Novelo, J.M.; Restrepo-Diaz, H. Mobilization of nitrogen in the olive bearing shoots after foliar application of urea. Sci. Hortic. 2011, 127, 452–454. [Google Scholar] [CrossRef]
  32. Perica, S.; Androulakis, I.I.; Loupassaki, M.H. Effect of Summer Application of Nitrogen and Potassium on Mineral Composition of Olive Leaves. Acta Hortic. 1994, 356, 221–224. [Google Scholar] [CrossRef]
  33. Jan, A.; Ahmad, G.; Arif, M.; Jan, M.T.; Marwat, K.B. Quality parameters of canola as affected by nitrogen and sulfur fertilization. J. Plant Nutr. 2010, 33, 381–390. [Google Scholar] [CrossRef]
  34. Zipori, I.; Erel, R.; Yermiyahu, U.; Ben-gal, A.; Dag, A. Sustainable management of olive orchard nutrition: A review. Agriculture 2020, 10, 11. [Google Scholar] [CrossRef] [Green Version]
  35. Fernández-Escobar, R. Olive Nutritional Status and Tolerance to Biotic and Abiotic Stresses. Front. Plant Sci. 2019, 10, 1–7. [Google Scholar] [CrossRef]
  36. Chatzissavvidis, C.; Therios, I. Response of four olive (Olea europaea L.) cultivars to six B concentrations: Growth performance, nutrient status and gas exchange parameters. Sci. Hortic. (Amst.) 2010, 127, 29–38. [Google Scholar] [CrossRef]
  37. Pasković, I.; Lukić, I.; Žurga, P.; Majetić Germek, V.; Brkljača, M.; Koprivnjak, O.; Major, N.; Grozić, K.; Franić, M.; Ban, D.; et al. Temporal variation of phenolic and mineral composition in olive leaves is cultivar dependent. Plants 2020, 9, 1099. [Google Scholar] [CrossRef]
  38. Lukić, I.; Pasković, I.; Žurga, P.; Majetić Germek, V.; Brkljača, M.; Marcelić, Š.; Ban, D.; Grozić, K.; Lukić, M.; Užila, Z.; et al. Determination of the variability of biophenols and mineral nutrients in olive leaves with respect to cultivar, collection period and geographical location for their targeted and well-timed exploitation. Plants 2020, 9, 1667. [Google Scholar] [CrossRef]
  39. Abdin, M.Z.; Ahmad, A.; Khan, N.; Khan, I.; Jamal, A.; Iqbal, M. Sulphur Interaction with Other Nutrients. In Sulphur in Plants; Springer: Dordrecht, The Netherlands, 2003; pp. 359–374. [Google Scholar] [CrossRef]
  40. Varényiová, M.; Ducsay, L.; Ryant, P. Sulphur nutrition and its effect on yield and oil content of oilseed rape (Brassica napus L.). Acta Univ. Agric. Silv. Mendel. Brun. 2017, 65, 555–562. [Google Scholar] [CrossRef] [Green Version]
  41. Zerihun, G.; Girma, A.; Sheleme, B. Rhizobium inoculation and sulphur fertilizer improved yield, nutrients uptake and protein quality of soybean (Glysine max L.) varieties on Nitisols of Assosa area, Western Ethiopia. Afr. J. Plant Sci. 2017, 11, 123–132. [Google Scholar] [CrossRef] [Green Version]
  42. Chowdhury, I.R.; Paul, K.B.; Eivazi, F.; Bleich, D. Effects of Foliar Fertilization on Yield, Protein, Oil and Elemental Composition of two Soybean Varieties. Commun. Soil Sci. Plant Anal. 1985, 16, 681–692. [Google Scholar] [CrossRef]
  43. Belikova, H.; Losak, T.; Mezsaros, M.; Conka, P. The effect of foliar fertilization with sulphur on changes in mineral composition of leaves and fruits of Malus × domestica ‘Gloster’. Acta Hortic. 2018, 1217, 417–421. [Google Scholar] [CrossRef]
  44. Lavee, S.; Wodner, M. Factors affecting the nature of oil accumulation in fruit of olive (Olea europaea L.) cultivars. J. Hortic. Sci. 1991, 66, 583–591. [Google Scholar] [CrossRef]
  45. Vuletin Selak, G.; Perica, S.; Goreta Ban, S.; Radunic, M.; Poljak, M. Reproductive success after self-pollination and cross-pollination of olive cultivars in Croatia. HortScience 2011, 46, 186–191. [Google Scholar] [CrossRef] [Green Version]
  46. Blazakis, K.N.; Kosma, M.; Kostelenos, G.; Baldoni, L.; Bufacchi, M.; Kalaitzis, P. Description of olive morphological parameters by using open access software. Plant Methods 2017, 13, 111. [Google Scholar] [CrossRef] [Green Version]
  47. Calabriso, N.; Scoditti, E.; Pellegrino, M.; Annunziata Carluccio, M. Olive Oil; Elsevier Inc.: Amsterdam, The Netherlands, 2015; ISBN 9780124079427. [Google Scholar]
  48. Tandon, H.; Messick, D. Practical Sulphur Guide; Sulphur Institute: Washington, DC, USA, 2002. [Google Scholar]
  49. Chandel, R.; Sudhakar, P.; Singh, K. Response of sulphur nutrition in mustard—A review. Agric. Rev. 2003, 24, 175–182. [Google Scholar]
  50. Mansoori, I. Response of canola to nitrogen and sulfur fertilizers. J. Agric. Crop. Sci. 2012, 4, 28–33. [Google Scholar]
  51. Sattar, A.; Cheema, M.A.; Wahid, M.; Saleem, M.; Hassan, M. Interactive effects of sulphur and nitrogen on growth, yield and quality of canola. Crop. Environ. 2011, 2, 32–37. [Google Scholar]
  52. Raja, A.; Omar Hattab, K.; Gurusamy, L.; Vembu, G.; Suganya, S. Sulphur application on growth and yield and quality of sesame varieties. Int. J. Agric. Res. 2007, 2, 599–606. [Google Scholar]
  53. Beltrán, G.; Del Río, C.; Sánchez, S.; Martínez, L. Seasonal changes in olive fruit characteristics and oil accumulation during ripening process. J. Sci. Food Agric. 2004, 84, 1783–1790. [Google Scholar] [CrossRef]
  54. EEC. Characteristics of olive oil and olive-residue oil and the relevant methods of 401 analyses. Regulation EEC/2568/91 and later modifications. Off. J. Eur. Commun. 1991, L24, 1–83. [Google Scholar]
  55. Covas, M.I.; Ruiz-Gutiérrez, V.; De La Torre, R.; Kafatos, A.; Lamuela-Raventós, R.M.; Osada, J.; Owen, R.W.; Visioli, F. Minor components of olive oil: Evidence to date of health benefits in humans. Nutr. Rev. 2006, 64, S20–S30. [Google Scholar] [CrossRef]
  56. Valente, S.; Machado, B.; Pinto, D.C.G.A.; Santos, C.; Silva, A.M.S.; Dias, M.C. Modulation of phenolic and lipophilic compounds of olive fruits in response to combined drought and heat. Food Chem. 2020, 329, 127191. [Google Scholar] [CrossRef] [PubMed]
  57. Lerma-García, M.J.; Ramis-Ramos, G.; Herrero-Martínez, J.M.; Simó-Alfonso, E.F. Classification of vegetable oils according to their botanical origin using sterol profiles established by direct infusion mass spectrometry. Rapid Commun. Mass Spectrom. 2008, 22, 973–978. [Google Scholar] [CrossRef] [PubMed]
Figure 1. Meteorological conditions in Sikovo: (a) 2019; (b) 2020.
Horticulturae 08 00203 g001
Figure 2. Multiple comparisons of the effects of (a) cultivar (Cv.) (Istarska bjelica, Leccino) and year (Y) (2019, 2020) on the concentration of sulfur (S), and (b) treatment (T) (0, 7.5, 15, and 22.5 mL of applied SN foliar fertilizer per 1 L of water) and cultivar on the concentration of nitrogen (N) in olive leaves. Different superscript lowercase letters represent statistically significant differences between mean values at p < 0.05 obtained by a three-way ANOVA and Tukey’s test.
Horticulturae 08 00203 g002
Figure 3. Multiple comparisons of the effects of (a) treatment (T) (0, 7.5, 15, and 22.5 mL of applied SN foliar fertilizer per 1 L of water) and cultivar (Cv.) (Istarska bjelica, Leccino), (b) treatment and year (Y) (2019, 2020), and (c) cultivar and year on olive fruit yield. Different superscript lowercase letters represent statistically significant differences between mean values at p < 0.05 obtained by a three-way ANOVA and Tukey’s test.
Horticulturae 08 00203 g003aHorticulturae 08 00203 g003b
Figure 4. Multiple comparisons of the effects of treatment (T) (0, 7.5, 15, and 22.5 mL of applied SN foliar fertilizer per 1 L of water) and year (Y) (2019, 2020) on olive oil extraction yield. Different superscript lowercase letters represent statistically significant differences between mean values at p < 0.05 obtained by a three-way ANOVA and Tukey’s test.
Horticulturae 08 00203 g004
Table 1. Foliar fertilization with sulfur and nitrogen in 2019 and 2020.
‘Istarska Bjelica’‘Leccino’
2019202020192020
Application 1
(50 days from anthesis)
19 Jul. 201915 Jul. 202020 Jul. 201916 Jul. 2020
Application 2
(80 days from anthesis)
18 Aug. 201914 Aug. 202019 Aug. 201915 Aug. 2020
Jul.—July; Aug.—August.
Table 2. The effect of treatment (T) (0, 7.5, 15, and 22.5 mL of applied SN foliar fertilizer per 1 L of water), cultivar (cv.) (Istarska bjelica, Leccino), and collection year (Y) (2019, 2020) on sulfur and nitrogen concentrations in olive leaves.
Source of VariationS (g/kg)N (g/kg)
Treatment(T)
0 mL SN2.55 ± 0.11 b16.17 ± 0.80
7.5 mL SN2.75 ± 0.10 b15.03 ± 1.11
15 mL SN3.00 ± 0.14 a14.78 ± 0.82
22.5 mL SN3.01 ± 0.13 a15.55 ± 0.88
p-value***n.s.
Cultivar (Cv.)
Istarska bjelica2.57 ± 0.05 b13.71 ± 0.59 b
Leccino3.08 ± 1.00 a17.06 ± 0.54 a
p-value******
Year (Y)
20192.56 ± 0.06 b13.05 ± 0.59 b
20203.09 ± 0.09 a17.72 ± 0.35 a
p-value******
T × Cv.n.s.*
T × Yn.s.n.s.
Cv. × Y***n.s.
T × Cv. × Yn.s.n.s.
Results are expressed as means ± standard errors (n = 4). Different superscript lowercase letters in a column represent statistically significant differences between mean values for each main effect at p < 0.05 obtained by a three-way ANOVA and Tukey’s test. First- (T × Cv., T × Y, Cv. × Y) and second-order interactions (T × Cv. × Y) are presented. Significance: *** p < 0.001, * p < 0.05, n.s.—not significant.
Table 3. The effect of treatment (T) (0, 7.5, 15, and 22.5 mL of applied SN foliar fertilizer per 1 L of water), cultivar (Cv.) (Istarska bjelica, Leccino), and collection year (Y) (2019, 2020) on fruit yield and fruit morphological parameters.
Source of VariationFruit Yield (kg/Tree)Fruit Mass (g)Fruit Length (mm)Fruit Width (mm)Stone Mass (g)Stone Length (mm)Stone Width (mm)Fruit Length-to-Width RatioStone Length-to-Width RatioPulp Mass (g)Pulp Percentage (%)
Treatment (T)
0 mL SN12.76 ± 2.09 b2.47 ± 0.02 d19.39 ± 0.08 d14.77 ± 0.07 d0.47 ± 0.01 d13.73 ± 0.06 c6.92 ± 0.03 d1.32 ± 0.00 ab1.99 ± 0.012.00 ± 0.02 d80.33 ± 0.23 c
7.5 mL SN17.69 ± 2.99 a2.78 ± 0.03 c20.01 ± 0.08 c15.40 ± 0.07 c0.50 ± 0.00 c14.23 ± 0.24 b7.16 ± 0.03 c1.30 ± 0.00 c2.02 ± 0.052.28 ± 0.03 c81.23 ± 0.23 b
15 mL SN 15.11 ± 3.01 ab3.14 ± 0.03 b20.91 ± 0.07 b16.02 ± 0.06 b0.54 ± 0.01 b14.51 ± 0.06 b7.33 ± 0.02 b1.31 ± 0.00 bc1.98 ± 0.012.60 ± 0.03 b82.06 ± 0.22 a
22.5 mL SN17.47 ± 2.49 a3.35 ± 0.03 a21.62 ± 0.08 a16.36 ± 0.06 a0.59 ± 0.01 a15.11 ± 0.06 a7.51 ± 0.02 a1.33 ± 0.00 a2.02 ± 0.012.76 ± 0.03 a81.55 ± 0.21 b
p-value**********************n.s.******
Cultivar (Cv.)
Istarska bjelica8.51 ± 1.03 b3.39 ± 0.02 a21.47 ± 0.05 a16.91 ± 0.03 a0.47 ± 0.00 b13.57 ± 0.03 b7.10 ± 0.02 b1.27 ± 0.00 b1.92 ± 0.01 b2.92 ± 0.02 a85.99 ± 0.08 a
Leccino23.01 ± 1.65 a2.48 ± 0.02 b19.50 ± 0.05 b14.36 ± 0.03 b0.58 ± 0.00 a15.22 ± 0.12 a7.36 ± 0.02 a1.36 ± 0.00 a2.09 ± 0.02 a1.91 ± 0.01 b76.60 ± 0.09 b
p-value*********************************
Year (Y)
201911.04 ± 1.35 b3.10 ± 0.02 a20.75 ± 0.05 a15.90 ± 0.04 a0.61 ± 0.00 a14.84 ± 0.05 a7.55 ± 0.01 a1.31 ± 0.00 b1.97 ± 0.00 b2.50 ± 0.02 a79.72 ± 0.14 b
202020.47 ± 1.98 a2.77 ± 0.02 b20.22 ± 0.06 b15.38 ± 0.05 b0.44 ± 0.01 b13.95 ± 0.12 b6.91 ± 0.02 b1.32 ± 0.00 a2.04 ± 0.02 a2.33 ± 0.02 b82.87 ± 0.16 a
p-value******************************
T × Cv.************n.s.******n.s.*****
T × Y********n.s.***n.s.******
Cv. × Y***************************
T × Cv. × Yn.s.*n.s.***n.s.***n.s.n.s.*n.s.
Results are expressed as means ± standard errors (n = 4 for fruit yield, n = 160 for fruit morphological parameters). Different superscript lowercase letters in a column represent statistically significant differences between mean values for each main effect at p < 0.05 obtained by a three-way ANOVA and Tukey’s test. First- (T × Cv., T × Y, Cv. × Y) and second-order interactions (T × Cv. × Y) are presented. Significance: *** p < 0.001, ** p < 0.01, * p < 0.05, n.s.—not significant.
Table 4. The effect of treatment (T) (0, 7.5, 15, and 22.5 mL of applied SN foliar fertilizer per 1 L of water), cultivar (Cv.) (Istarska bjelica, Leccino), and collection year (Y) (2019, 2020) on oil fractions in fresh olive paste (FOP), oil extraction yield, and parameters of olive oil quality.
Source of VariationOil Fraction in FOP (%)Oil Extraction Yield (%)FFA (%)PV (eq O2/kg)K232K270ΔK
Treatment (T)
0 mL SN17.20 ± 1.21 b11.08 ± 0.92 c0.34 ± 0.03 a4.69 ± 0.37 b2.02 ± 0.040.19 ± 0.01 b−0.00 ± 0.00
7.5 mL SN17.75 ± 1.13 ab12.40 ± 1.02 ab0.32 ± 0.02 a4.56 ± 0.46 b2.00 ± 0.040.20 ± 0.00 ab−0.00 ± 0.00
15 mL SN 17.50 ± 0.97 b11.95 ± 1.04 bc0.28 ± 0.02 b4.37 ± 0.45 b1.99 ± 0.050.19 ± 0.01 b−0.00 ± 0.00
22.5 mL SN18.62 ± 0.96 a13.49 ± 1.21 a0.30 ± 0.01 ab5.51 ± 0.69 a2.04 ± 0.040.20 ± 0.00 a−0.00 ± 0.00
p-value**********n.s.**n.s.
Cultivar (Cv.)
Istarska bjelica21.71 ± 0.21 a15.82 ± 0.39 a0.34 ± 0.01 a3.58 ± 0.07 b2.12 ± 0.01 a0.20 ± 0.00 a−0.01 ± 0.00 a
Leccino13.82 ± 0.28 b8.64 ± 0.38 b0.28 ± 0.02 b6.07 ± 0.41 a1.89 ± 0.03 b0.18 ± 0.01 b−0.00 ± 0.00 b
p-value********************
Year (Y)
201918.36 ± 0.76 a13.63 ± 0.69 a0.25 ± 0.01 b5.70 ± 0.46 a2.09 ± 0.02 a0.18 ± 0.01 b−0.00 ± 0.00
202017.18 ± 0.72 b10.83 ± 0.72 b0.37 ± 0.01 a3.94 ± 0.13 b1.94 ± 0.03 b0.20 ± 0.00 a−0.00 ± 0.00
p-value******************n.s.
T × Cv.*n.s.n.s.***n.s.*n.s.
T × Yn.s.*****n.s.n.s.**n.s.
Cv. × Yn.s.n.s.n.s.*********n.s.
T × Cv. × Yn.s.n.s.n.s.n.s.n.s.**n.s.
Results are expressed as means ± standard errors (n = 4). Different superscript lowercase letters in a column represent statistically significant differences between mean values for each main effect at p < 0.05 obtained by a three-way ANOVA and Tukey’s test. First- (T × Cv., T × Y, Cv. × Y) and second-order interactions (T × Cv. × Y) are presented. Significance: *** p < 0.001, ** p < 0.01, * p < 0.05, n.s.—not significant. FFA—free fatty acids, PV—peroxide value, K232 and K270—extinction coefficients.
Publisher’s Note: MDPI stays neutral with regard to jurisdictional claims in published maps and institutional affiliations.

