Article

Identification and Characterization of Two Putative Citrus Phosphomannose Isomerase (CsPMI) Genes as Selectable Markers for Mature Citrus Transformation

1
Citrus Research & Education Center, University of Florida, Lake Alfred, FL 33850, USA
2
Pomology Department, Faculty of Agriculture, Mansoura University, Mansoura 35516, Egypt
*
Author to whom correspondence should be addressed.
Horticulturae 2022, 8(3), 204; https://doi.org/10.3390/horticulturae8030204
Submission received: 14 January 2022 / Revised: 21 February 2022 / Accepted: 24 February 2022 / Published: 25 February 2022
(This article belongs to the Special Issue Citrus Biotechnology)

Abstract

:
Two Citrus sinensis (L.) phosphomannose isomerase (PMI) genes, CsPMI1 and CsPMI2, were evaluated as novel selectable markers in mature citrus transformation. Transgenic shoots produced after transformation of Kuharske rootstock with each PMI construct were selected on six treatments of mannose and sucrose. For CsPMI1, there were no significant differences among the various mannose and sucrose treatments for the mean number of positive shoots (PS), the mean transformation efficiency based on the number of shoots (TES), or the mean transformation efficiency based on the number of explants (TEE). However, for the CsPMI2 gene, the number of transgenics produced in two treatments (7.5 g L−1 mannose + 22.5 g L−1 sucrose and 15 g L−1 mannose + 15 g L−1 sucrose) was significantly greater than the sucrose control for TES at 4.2% and 3.7%, respectively. Moreover, TEE at 4.2% in the 15 g L−1 mannose + 15 g L−1 sucrose treatment, supported the TES value. Most of the transgenic lines demonstrated higher in vivo and in vitro enzyme assays compared with the wild-type control. CsPMI2 provided acceptable selection in mature citrus, and it will be applied in future intragenic research.

1. Introduction

Genetically modified organisms (GMOs) could be the solution to many problems afflicting crops, such as Huanglongbing (HLB) disease, which is currently devastating citrus production in most parts of the world. However, conventional GMOs, in which the transgene comes from another organism, are rife with public concerns because of the presence of foreign DNA. Therefore, cisgenic and intragenic technologies were developed as alternate tools for genetic modification using genes and genetic elements from within interbreeding species. Cisgenesis involves genetic modification using a complete copy of naturally occurring genes with their native regulatory elements that belong exclusively to sexually compatible plants [1], while intragenesis refers to a combination of genes and regulatory elements belonging within sexually compatible species [2,3,4]. To date, application of cisgenesis and intragenesis are limited to a few species, such as apple (Malus domestica) [5,6,7,8], strawberry (Fragaria ananassa) [9] and potato (Solanum tuberosum L.) [10], mainly due to the lack of knowledge of useful genes, their regulatory sequences, or reliable plant-derived selectable markers. In citrus, intragenic plants were obtained using a T-DNA-like vector comprised solely of citrus sequences, but the transformation efficiency was low [11]. A citrus intragenic selectable marker encoding 5-enolpyruvylshikimate-3-phosphate synthase (EPSPS), an essential enzyme of the shikimate pathway, generated a high transformation efficiency based on the number of positive shoots/total shoots produced ×100 (TES) [12].
There is an urgent need for plant-derived selectable markers for food crops. A selectable marker plays a critical role in transgenic, cisgenic or intragenic plant production. To date, there are only a few successful reports of the generation of transgenic plants lacking a selectable marker [11,13,14] and large number of plants must be screened, usually with PCR, to obtain a few positive plants. A selectable marker functions to either suppress the growth of non-transformed cells (negative selectable marker) or it promotes the growth of transgenic cells (positive selectable maker) after the gene of interest is transferred into the cell, which later regenerates into plants and increases the efficiency of the transformation process [15]. Most commonly, selectable markers are antibiotic resistance genes, such as hygromycin phosphotransferase (hpt) or neomycin phosphotransferase II (nptII), or herbicide resistance genes, such as phosphothricin acetyltransferase (pat or bar) [16], which have attracted public concern regarding their safety, environmental and health risks. Removing selectable markers from the genome of GMO plants [17] requires additional steps and efforts, which are time-consuming and costly, while intragenic or cisgenic plants avoid this difficulty.
Phosphosmannose isomerase (PMI) catalyzes the reversible interconversion of mannose 6-phosphate into fructose 6-phosphate, which is an intermediate of the glycolysis pathway. PMI was utilized as a selectable marker for transformation of many plant species because expression of the genes encoding PMIs allow the cells to utilize mannose as a carbon source and survive on media containing mannose. PMI is common in nature and found across kingdoms. However, PMI is less ubiquitous in the plant kingdom, having been reported to be present in soybeans but absent in many plants [18]. E. coli manA gene, also known as EcPMI, was utilized as a selectable marker in the transformation of many plant species, such as rice [19,20,21,22], wheat [23,24,25], cabbage [26,27,28] and citrus [29,30,31,32]. In addition, the PMI from the green microalga Chlorella variabilis (CvPMI) was used as a selectable marker in rice [15] and Chlorococcum sp. (ChlPMI) was used in tomato [33]. The Oryza sativa PMI genes (OsPMI1, OsPMI2 and OsPMI3) and the Arabidopsis thaliana PMI gene (AtPMI2) were tested as selectable markers in rice [15]. Wang et al. [34] also tested soybean, corn, and Arabidopsis PMIs as selectable markers. To date, there is no report utilizing citrus PMIs (CsPMIs) as selectable markers. Using novel PMI genes from Citrus spp. as selectable markers will facilitate intragenesis for the genetic improvement of citrus to combat the devastating HLB disease.
The purpose of this study was to evaluate the performance of two citrus PMI genes (CsPMI1 and CsPMI2) as selectable markers under the control of cauliflower mosaic virus (CaMV) 35S promoter and terminator together with AtPMI2 controlled by the same genetic elements to generate Agrobacterium-mediated transgenics selected on different mannose and sucrose treatments to find the selectable marker that works well in citrus.

2. Materials and Methods

2.1. Plasmid Constructs

The CsPMI1 (NCBI accession: XM_006469025.2) and CsPMI2 (NCBI accession: XM_006482179.1) were identified through a BLAST search of National Center for Biotechnology Information (NCBI; https://www.ncbi.nlm.nih.gov, accessed on 21 December 2021) database using the AtPMI2 (NCBI accession: AT1G67070) sequence as a template. A phylogenetic tree was constructed between the two CsPMI proteins with homologs identified through a BLAST search in the NCBI website (https://www.ncbi.nlm.nih.gov, accessed on 21 December 2021). Multiple sequence alignment was conducted utilizing the ClustalW option of MEGA11 [35], and a tree was constructed with MEGA11 using the Neighbor-Joining method with 1000 bootstrap replicates. The bootstrap support values showing the confidence level are given at the clade nodes as percentages. Other parameters include Poisson model, uniform rates, and pairwise deletion.
Unnecessary internal restriction sites were modified from the AtPMI, CsPMI1 and CsPMI2 cDNA sequences, and subsequently chemically synthesized by Twist Bioscience (San Francisco, CA, USA) to contain BamHI and SacI sites at the 5′ and 3′ respectively. Each DNA fragment was cloned into a modified pC0390 (pCAMBIA vector backbone) plasmid under the control of a d35S promoter and the 35S terminator. This construct also contained the EGFP gene under the control of the Cassava vein mosaic virus (CsVMV) promoter and the Agrobacterium OCS terminator (Figure S1). Each Sanger sequence verified plasmid was subsequently transformed into Agrobacterium tumefaciens strain AGL1 by electroporation with the MicroPulser Electroporator (Bio-Rad, Hercules, CA, USA).

2.2. Plant Materials and Agrobacterium Transformation

Mature Kuharske citrange (Citrus sinensis Osb. × Poncirus trifoliata L. Raf.) introduction, budding, and plant transformation protocols were as described by Wu et al. [36]. Briefly, mature buds were budded onto three-month-old Volkameriana lemon (Citrus volkameriana Osbeck) rootstocks in a controlled temperature growth room with the growth conditions of a 12 h light cycle provided by cool white, fluorescent bulbs, at a temperature of 28 ± 4 °C and 50% relative humidity.
Explants were collected for transformation three months after budding. Mature stems were brushed with soapy water, sterilized in 20% (v/v) commercial Clorox (8.25% sodium hypochlorite) for 30 min and cut into explants approximately 1 cm in length. The explants were soaked in Agrobacterium suspension for 20 min and dried on filter papers before transferring to co-cultivation medium for a two-day dark incubation at 26 ± 2 °C, then subcultured onto Murashige Tucker (MT) medium [37] with 30% sucrose supplemented with 100 mg L−1 of meropenem, vancomycin, and timentin, respectively, for inhibiting Agrobacterium growth and 3 mg L−1 of 6-Benzylaminopurine (BAP) (Sigma Millipore, St. Louis, MO, USA) for three weeks in the dark [38]. The second and subsequent subcultures onto MT medium containing 3 mg L−1 of BAP plus six different combinations of mannose g L−1 + sucrose g L−1: 0/30, 1.9/28.1, 3.8/26.2, 7.5/22.5, 15/15, and 30/0, were conducted every two weeks under light in an incubator with a 12 h light cycle, 45 μmol m−2 s−1 light intensity, at 26 ± 2 °C for regeneration and elongation of shoots. Transgenic shoots were screened for GFP fluorescence with a Nikon SMZ 745T stereoscope (Nikon, Melville, NY, USA) equipped with a NIGHTSEA fluorescence adapter (NIGHTSEA, Lexington, MA, USA) and a blue filter.

2.3. PCR Confirmation of Transgenics

Polymerase chain reaction (PCR) was used to confirm the presence of transgenes. Total DNA was isolated from 80 mg leaves using the DNeasy Plant Mini Kit (Qiagen, Germantown, MD, USA). The primer pairs for EGFP-175, AtPMI2-368, CsPMI1-636 and CsPMI2-435 were used to amplify a 175 bp, 368 bp, 636 bp and 435 bp PCR product from EGFP, AtPMI2, CsPMI1 and CsPMI2 coding regions, respectively (Table S1), in endpoint PCR. Reactions were set to 20 µL volume containing 0.5 µM of each primer, 0.2 mM of each dNTP, 4 µL of 5× Phire Reaction Buffer (Thermo Fisher Scientific, Grand Island, NY, USA), 0.4 µL of Phire Hot Start II DNA Polymerase (Thermo Fisher Scientific, Grand Island, NY, USA) and 20 ng of genomic DNA template. The PCRs were run on the MJ Mini™ thermal cycler (Bio-Rad, Hercules, CA, USA) with the following conditions: one cycle of 98 °C for 30 s, 32 cycles of 98 °C for 5 s, 62 °C for 30 s, and 72°C for 7 s, one cycle of 72 °C for 60 s. The amplicons were analyzed by 2% agarose (Sigma Millipore, St. Louis, MO, USA) gel electrophoresis with the Gel Doc™ EZ Imager (Bio-Rad, Hercules, CA, USA).

2.4. Southern Blot Analysis

Genomic DNA was extracted from leaves of transgenic and non-transgenic wildtype plants using CTAB method described in Porebski et al. [39]. Briefly, 200 mg of leaf tissue was disrupted at 30 Hz for 2 min in the TissueLyser II (Qiagen, Germantown, MD, USA), lysed in 900 µL of CTAB buffer at 65 °C for 30 min, extracted with 700 µL chloroform to remove most of the proteins, then the DNA was precipitated with 2× volume of ethanol and dissolved in 30 to 50 µL of TE. The restriction enzyme EcoRV which cuts twice in the 35S promoter region and does not cut elsewhere in the T-DNA (Figure S1), was used to digest the genomic DNA, which was then size fractionated in 0.8% agarose gel electrophoresis overnight. The gel was depurinated, denatured, and blotted onto Hybond N+ (Roche, Sigma-Aldrich, St. Louis, MO, USA) membrane by capillary transfer according to the manufacturer’s instructions. The membrane was UV cross-linked for 2 min. The 552 bp of the EGFP probe was digoxigenin (DIG) labeled with the PCR DIG Probe Synthesis Kit (Roche, Sigma-Aldrich, St. Louis, MO, USA) using primers EGFP552F, 5′-ACGTAAACGGCCACAAGTTC-3′ and EGFP552R, 5′-ACTGGGTGCTCAGGTAGTGG-3′ with the following conditions: one cycle of 95 °C for 2 min, 30 cycles of 95 °C for 30 s, 60 °C for 30 s, 72 °C for 40 s, and a final extension of 72 °C for 10 min. The hybridizations were conducted with the DIG High Prime DNA Labeling and Detection Starter II (Roche, Sigma-Aldrich, St. Louis, MO, USA) following the manufacturer’s instructions. The blot was exposed to Kodak X-ray film (Fisher Scientific, Atlanta, GA, USA) for 30 min prior to image analyses.

2.5. Quantitative Real-Time Reverse Transcriptase-PCR (qRT-PCR)

RNA was isolated from 100 mg of finely ground citrus leaves using the Direct-zol™ RNA Miniprep Plus kit (Zymo Research, Tustin, CA, USA) according to the manufacturer’s instructions. After confirming the quality by electrophoresis in 1.5% agarose gel, the RNA template was mixed with the primers, heated to 65 °C for 5 min and incubated on ice for at least 1 min, then the cDNA was synthesized at 42 °C for 60 min using the RevertAid First Strand cDNA Synthesis Kit (Thermo Fisher Scientific, Waltham, MA, USA) and quantified via the Nanodrop spectrophotometer (Thermo Fisher Scientific, Waltham, MA, USA) The citrus actin7 gene (NCBI accession: XM_006464503.3) was used as a reference gene for the normalization. Primers for each gene are shown in Table S1. Forty ng of cDNA were used for quantitative real-time reverse transcription (qRT-PCR) performed in the StepOnePlus Real Time PCR system (Applied Biosystems, Thermo Fisher Scientific, Waltham, MA, USA) with the PowerUp Sybr Green Master Mix (Thermo Fisher Scientific, Waltham, MA, USA) at the following the conditions: 95 °C for 10 min, 40 cycles at 95 °C for 15 s and 60 °C for 60 s. Each sample was tested in triplicate to ensure accuracy. The C_T values of the target gene were compared with the C_T values of citrus Actin7 and the expression level of each target gene was quantified by the 2(−∆∆C_T) method [40].

2.6. PMI In Vivo Assay

The in vivo assay for PMI activity was determined according to the method described by Hu et al. [15]. Young leaf tissues (500 mg) were extracted in 500 μL of ice-cold Tris-HCl (50 mM, pH 7.5) containing 1% protease inhibitor cocktail (Sigma Millipore, St. Louis, MO), 1 mM phenylmethylsulfonyl fluoride (PMSF), 1 mM dithiothreitol (DTT), 100 μM Leupeptin, 10 μM E64 and 1 mM polyvinylpyrrolidone (PVP). The extraction buffer was prepared fresh, and all the components were dissolved at 4 °C. One hundred µL of extract was added to the substrate solution consisting of 75 μL of NADP (13.5 mM), 1 μL of PGI (1 kU/mL), and 0.5 μL of GDPDH (1 kU/mL) and incubated for 30 min at 37 °C to remove any endogenous D-M6P. The reaction was initiated by adding 20 μL of D-M6P (50 mM), and the ΔA340 was recorded for 60 min to calculate the activities. The experimental data were analyzed with an analysis of variance (ANOVA) test using one-way analysis, followed by the Student’s t-test to compare the different treatments. The analysis was conducted in JMP Pro 15 and the statistical significance was established at p < 0.05.

2.7. Chlorophenol Red Assay

A chlorophenol red (CPR) analysis was carried out for the visual detection of PMI activity. This protocol is based on Wright et al. [25]. Briefly, leaves were harvested from transgenic and non-transgenic citrus. Leaf surfaces were wiped with a 70% ethanol saturated paper towel. The leaves were then soaked in 70% of ethanol for 5–10 min and washed twice with sterile water. Leaves were cut into 7 mm × 6 mm sizes to fit in a sterile 24 well microtiter plate (SPL Life Science, Gyeonggi-do, Korea), loaded with 1 mL of MT liquid medium supplemented with 15 g L−1 of mannose, pH 6.0, and 50 mg L−1 of chlorophenol red. The plates were incubated in the dark at 26 °C for 4–5 days. The change of color from red or purple to yellow or orange indicated PMI activity.

2.8. Statistical Analysis of Transgenic Production

Scoring of Agrobacterium-mediated transgenic regeneration on mannose + sucrose treatments was performed seven weeks after the transformation. For AtPMI2, statistics were calculated on 60 explants per replicate and there were six replicates of six mannose + sucrose treatments (0 g L−1 mannose + 30 g L−1 sucrose, 1.9 g L−1 mannose + 28.1 g L−1 sucrose, 3.8 g L−1 mannose + 26.2 g L−1 sucrose, 7.5 g L−1 mannose + 22.5 g L−1 sucrose, 15 g L−1 mannose + 15 g L−1 sucrose, 30 g L−1 mannose + 0 g L−1 sucrose) in semi-solid medium. The 0 g L−1 mannose + 30 g L−1 sucrose was the control. For CsPMI1 and CsPMI2, there were six replicates of 67 explants per replicate of the same treatments. Response variables included the number of shoots longer than 2 mm (SL > 2), the number of positive shoots (PS), transformation efficiency based on the number of explants (TEE, the number of transgenic shoots/the number of explants × 100), and transformation efficiency based on the number of screened shoots (TES, number of transgenic shoots/the number of screened shoots × 100). Descriptive statistics, ANOVAs, and multiple comparisons against the sucrose control (0 g L−1 mannose + 30 g L−1 sucrose) were conducted using the Dunnett method in Minitab 19. Tests for normality indicated that the residuals did not fit a normal distribution, therefore count data were transformed with the square root transformation + 0.5 because of the preponderance of zeros, and percentage data were divided by 100 and the arcsine transformation applied to the data sets using Minitab 19.

3. Results

3.1. CsPMI1 and CsPMI2 Are Evolutionarily Distantly Related

To understand the evolutionary relationships between the CsPMI enzymes with similar PMI genes present in the model and common edible plant species, we constructed a phylogenetic tree between the two CsPMI enzymes with homologs identified through a BLAST search in the NCBI website (https://www.ncbi.nlm.nih.gov, accessed on 21 December 2021). CsPMI1 and CsPMI2 clustered in different clades, indicating they are distantly related evolutionarily (Figure 1). CsPMI1 was closely related to the Malus domestica PMI1L-a, while the CsPMI2 aligned closely with the Carica papaya PMI2.

3.2. Generation of Transgenics with Phosphomannose Isomerase Selectable Markers

Kuharske was transformed with AtPMI2, CsPMI1, and CsPMI2 vectors and EGFP positive transgenic shoots were selected on six treatments of mannose and sucrose (0 g L−1 mannose + 30 g L−1 sucrose, 1.9 g L−1 mannose + 28.1 g L−1 sucrose, 3.8 g L−1 mannose + 26.2 g L−1 sucrose, 7.5 g L−1 mannose + 22.5 g L−1 sucrose, 15 g L−1 mannose + 15 g L−1 sucrose, 30 g L−1 mannose + 0 g L−1 sucrose). In total, 34 AtPMI2 transgenics, 39 CsPMI1, and 49 CsPMI2 transgenics were produced from these experiments (Table 1). For AtPMI2, the most transgenics (12) were generated in treatment one, the sucrose control (0 g L−1 mannose + 30 g L−1 sucrose). For CsPMI1, ten transgenics were produced in treatment three (3.8 g L−1 mannose + 26.2 g L−1 sucrose), followed by nine transgenics in treatment four (7.5 g L−1 mannose + 22.5 g L−1 sucrose) (Table 1). For CsPMI2, treatment four (7.5 g L−1 mannose + 22.5 g L−1 sucrose) produced 17 transgenics, which was the best treatment for generating transgenics (Table 1). Transgenics were produced at 0 g L−1 mannose + 30 g L−1 sucrose with AtPMI, CsPMI1, and CsPMI2 vectors (Table 1). Non-transgenic escaped shoots were produced at all concentrations of mannose and sucrose, except for 30 g L−1 mannose + 0 g L−1 sucrose for AtpMI2 and CsPMI2, which is also common in citrus transformation.
Data for each experiment were analyzed separately in ANOVAs because the transformations were conducted at different times. As expected, for the AtPMI2 vector and the SL > 2 variable, treatment one (the sucrose control) and treatment two (1.9 g L−1 mannose + 28.1 g L−1 sucrose) yielded a significantly greater mean number of shoots longer than 2 mm than any other mannose/sucrose treatment (Table 2). For the number of positive shoots (PS) for the AtPMI2 vector, treatments three (3.8 g L−1 mannose + 26.2 g L−1 sucrose), four (7.5 g L−1 mannose + 22.5 g L−1 sucrose), and five (15 g L−1 mannose + 15 g L−1 sucrose) were statistically similar to the mean number of positive shoots generated in the 30 g L−1 sucrose control. Both treatments two (1.9 g L−1 mannose + 28.1 g L−1 sucrose) and six (30 g L−1 mannose) produced fewer mean number of positive shoots (PS). For the mean transformation efficiency variable based on the number of shoots (TES) and the AtPMI2 vector, treatments two (1.9 g L−1 mannose + 28.1 g L−1 sucrose), three (3.8 g L−1 mannose + 26.2 g L−1 sucrose), four (7.5 g L−1 mannose + 22.5 g L−1 sucrose), and five (15 g L−1 mannose + 15 g L−1 sucrose) were statistically similar to the 30 g L−1 sucrose control. For the transformation efficiency variable, based on the number of explants (TEE), treatments three and five (3.8 g L−1 mannose + 26.2 g L−1 sucrose and 15 g L−1 mannose + 15 g L−1 sucrose, respectively), were statistically comparable to the sucrose control, while all other treatments were significantly less efficient than the sucrose control.
For the CsPMI1 transformation, shoot length was significantly reduced in treatments three (3.8 g L−1 mannose + 26.2 g L−1 sucrose), four (7.5 g L−1 mannose + 22.5 g L−1 sucrose), five (15.0 g L−1 mannose + 15.0 g L−1 sucrose), and six (30 g L−1 mannose + 0 g L−1 sucrose) (Table 3). The PS, TES, and TEE variables were not significantly different among the six treatments, except for PS in treatment six (30 g L−1 mannose + 0 g L−1 sucrose) which was significantly lower than the other treatments (Table 3).
For the CsPMI2 vector and the SL>2 variable, treatments two (1.9 g L−1 mannose + 28.1 g L−1 sucrose) and three (3.8 g L−1 mannose + 26.2 g L−1 sucrose) were similar to the sucrose control (0 g L−1 mannose + 30 g L−1 sucrose), whereas mean shoot lengths in treatments four (7.5 g L−1 mannose + 22.5 g L−1 sucrose), five (15 g L−1 mannose + 15 g L−1 sucrose), and six (30 g L−1 mannose + 0 g L−1 sucrose) were significantly reduced (Table 4). For the mean PS variable, treatment six (30 g L−1 mannose + 0 g L−1 sucrose) was significantly less than the sucrose control, whereas treatment four (7.5 g L−1 mannose + 22.5 g L−1 sucrose) was significantly greater with a mean number of 2.7 positive shoots compared with the sucrose control with a mean number of 1.4 positive shoots. For the TES variable, treatments two (1.9 g L−1 mannose + 28.1 g L−1 sucrose), three (3.8 g L−1 mannose + 26.2 g L−1 sucrose), and six (30 g L−1 mannose + 0 g L−1 sucrose) were statistically similar to the sucrose control, but treatments four (7.5 g L−1 mannose + 22.5 g L−1 sucrose) and five (15 g L−1 mannose + 15 g L−1 sucrose) were significantly greater than the sucrose control. The mean transformation efficiencies of these latter treatments were 4.4% and 3.7%, respectively. For the TEE variable, treatments two (1.9 g L−1 mannose + 28.1 g L−1 sucrose), three (3.8 g L−1 mannose + 26.2 g L−1 sucrose), and five (15 g L−1 mannose + 15 g L−1 sucrose) were similar to the sucrose control, whereas treatment four (7.5 g L−1 mannose + 22.5 g L−1 sucrose) was significantly greater at 4.2% and treatment six (30 g L−1 mannose + 0 g L−1 sucrose) was significantly less than the sucrose control.
A random population of the transgenic shoots were micrografted onto decapitated Carrizo rootstock, and later, secondary grafted onto Volkameriana rootstock to boost tissue growth for molecular tests. In total, ten positive AtPMI2, 14 positive CsPMI1, and 20 positive CsPMI2 survived micrografting and secondary grafting and were grown for molecular analyses.

3.3. Molecular Analysis of the Transgenics

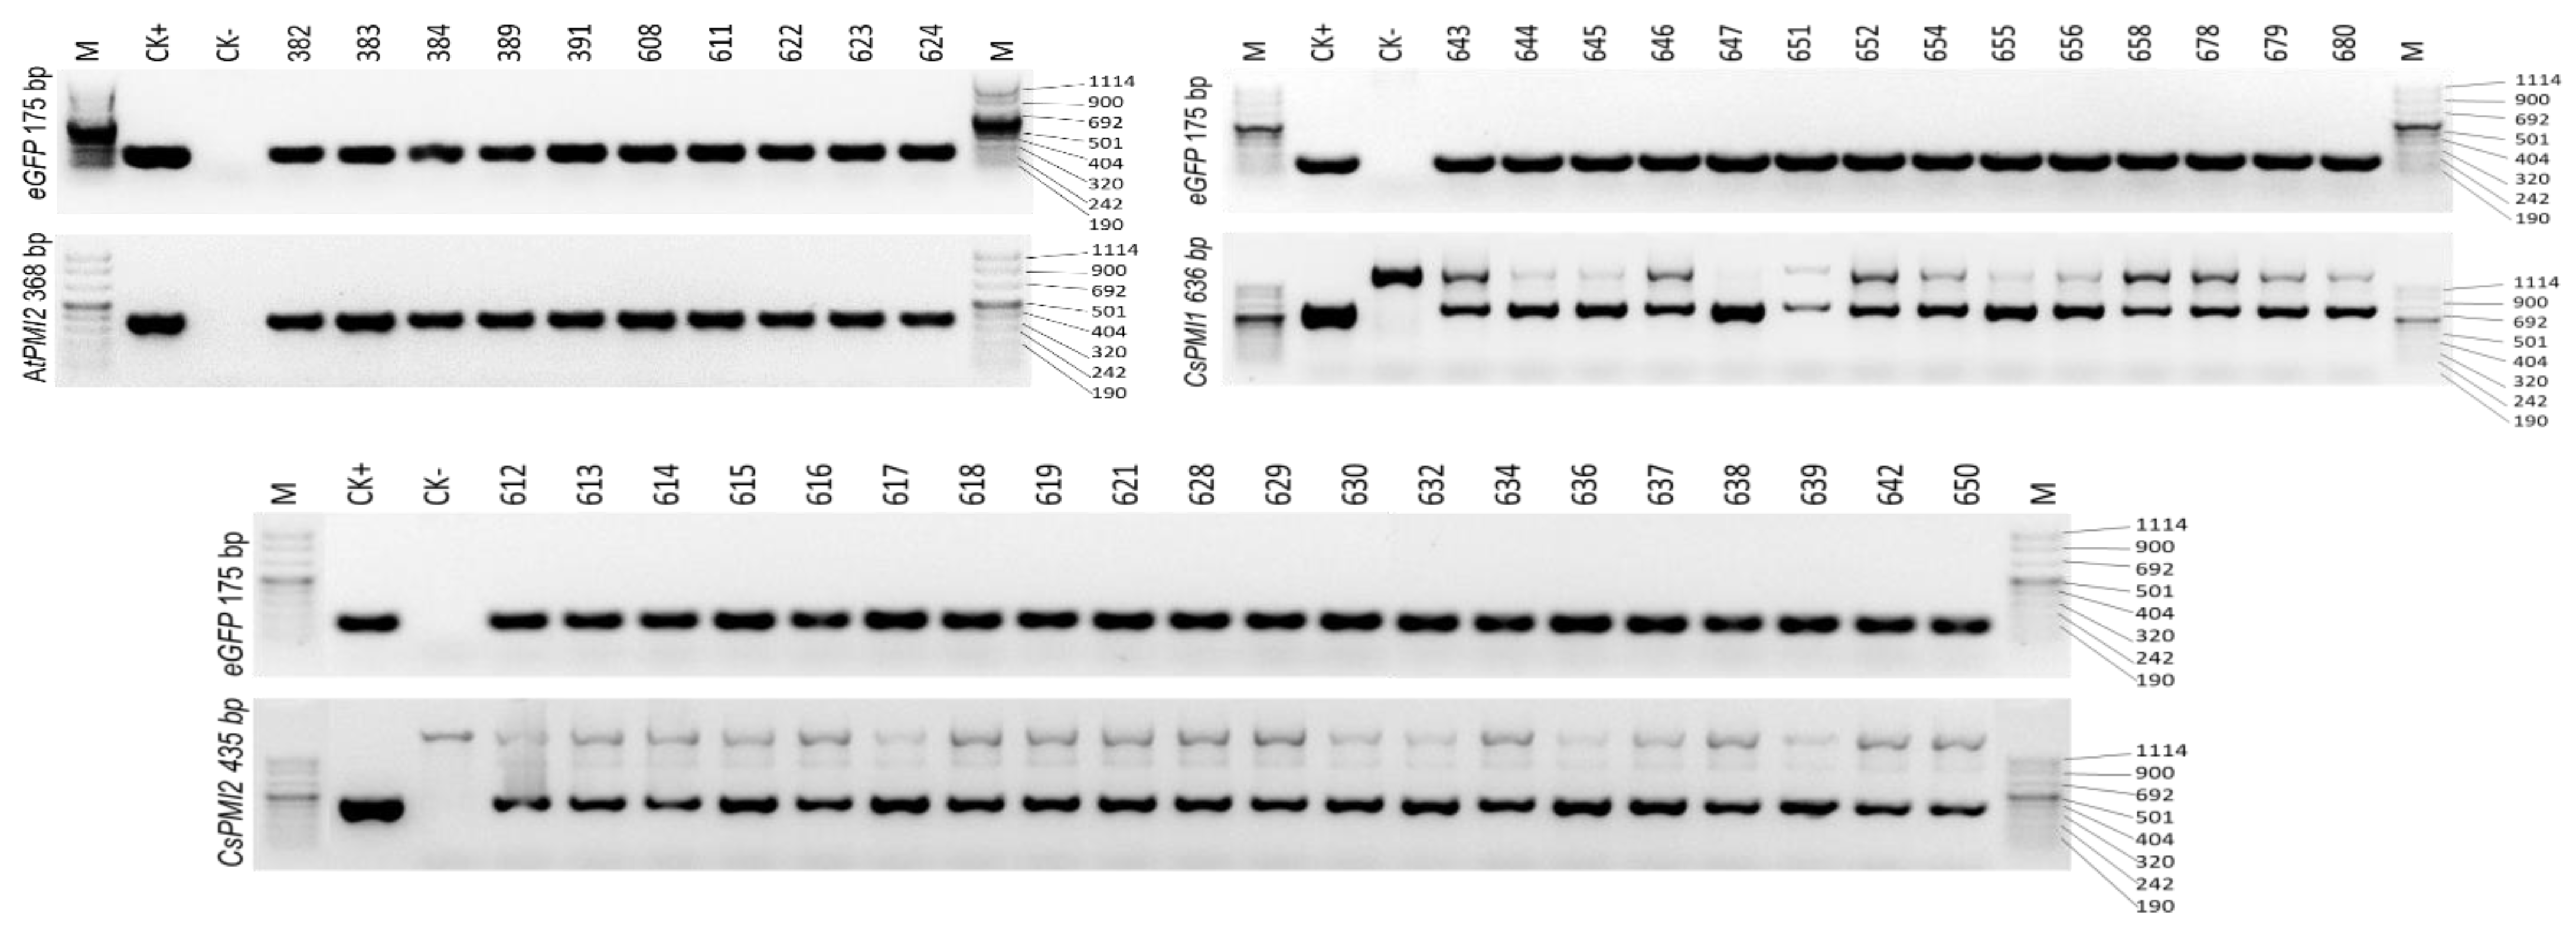
EGFP and AtPMI2, CsPMI1 or CsPMI2 specific primers were used in the PCR for confirmation of mature Kuharske transgenic lines. The plasmids and all the putative transgenic lines tested amplified an expected 175 bp band while the negative control did not (Figure 2), indicating that all these transgenic lines contain the EGFP coding sequences. Similarly, all ten AtPMI2 lines amplified a 368 bp of the AtPMI2 coding sequences (Figure 2, upper left); all fourteen CsPMI1 lines showed the expected 636 bp band of the CsPMI1 coding sequence (Figure 2, upper right); and all twenty CsPMI2 lines had the expected 435 bp of CsPMI2 coding sequences (Figure 2, lower). Bands of larger size indicate the endogenous CsPMI genes.
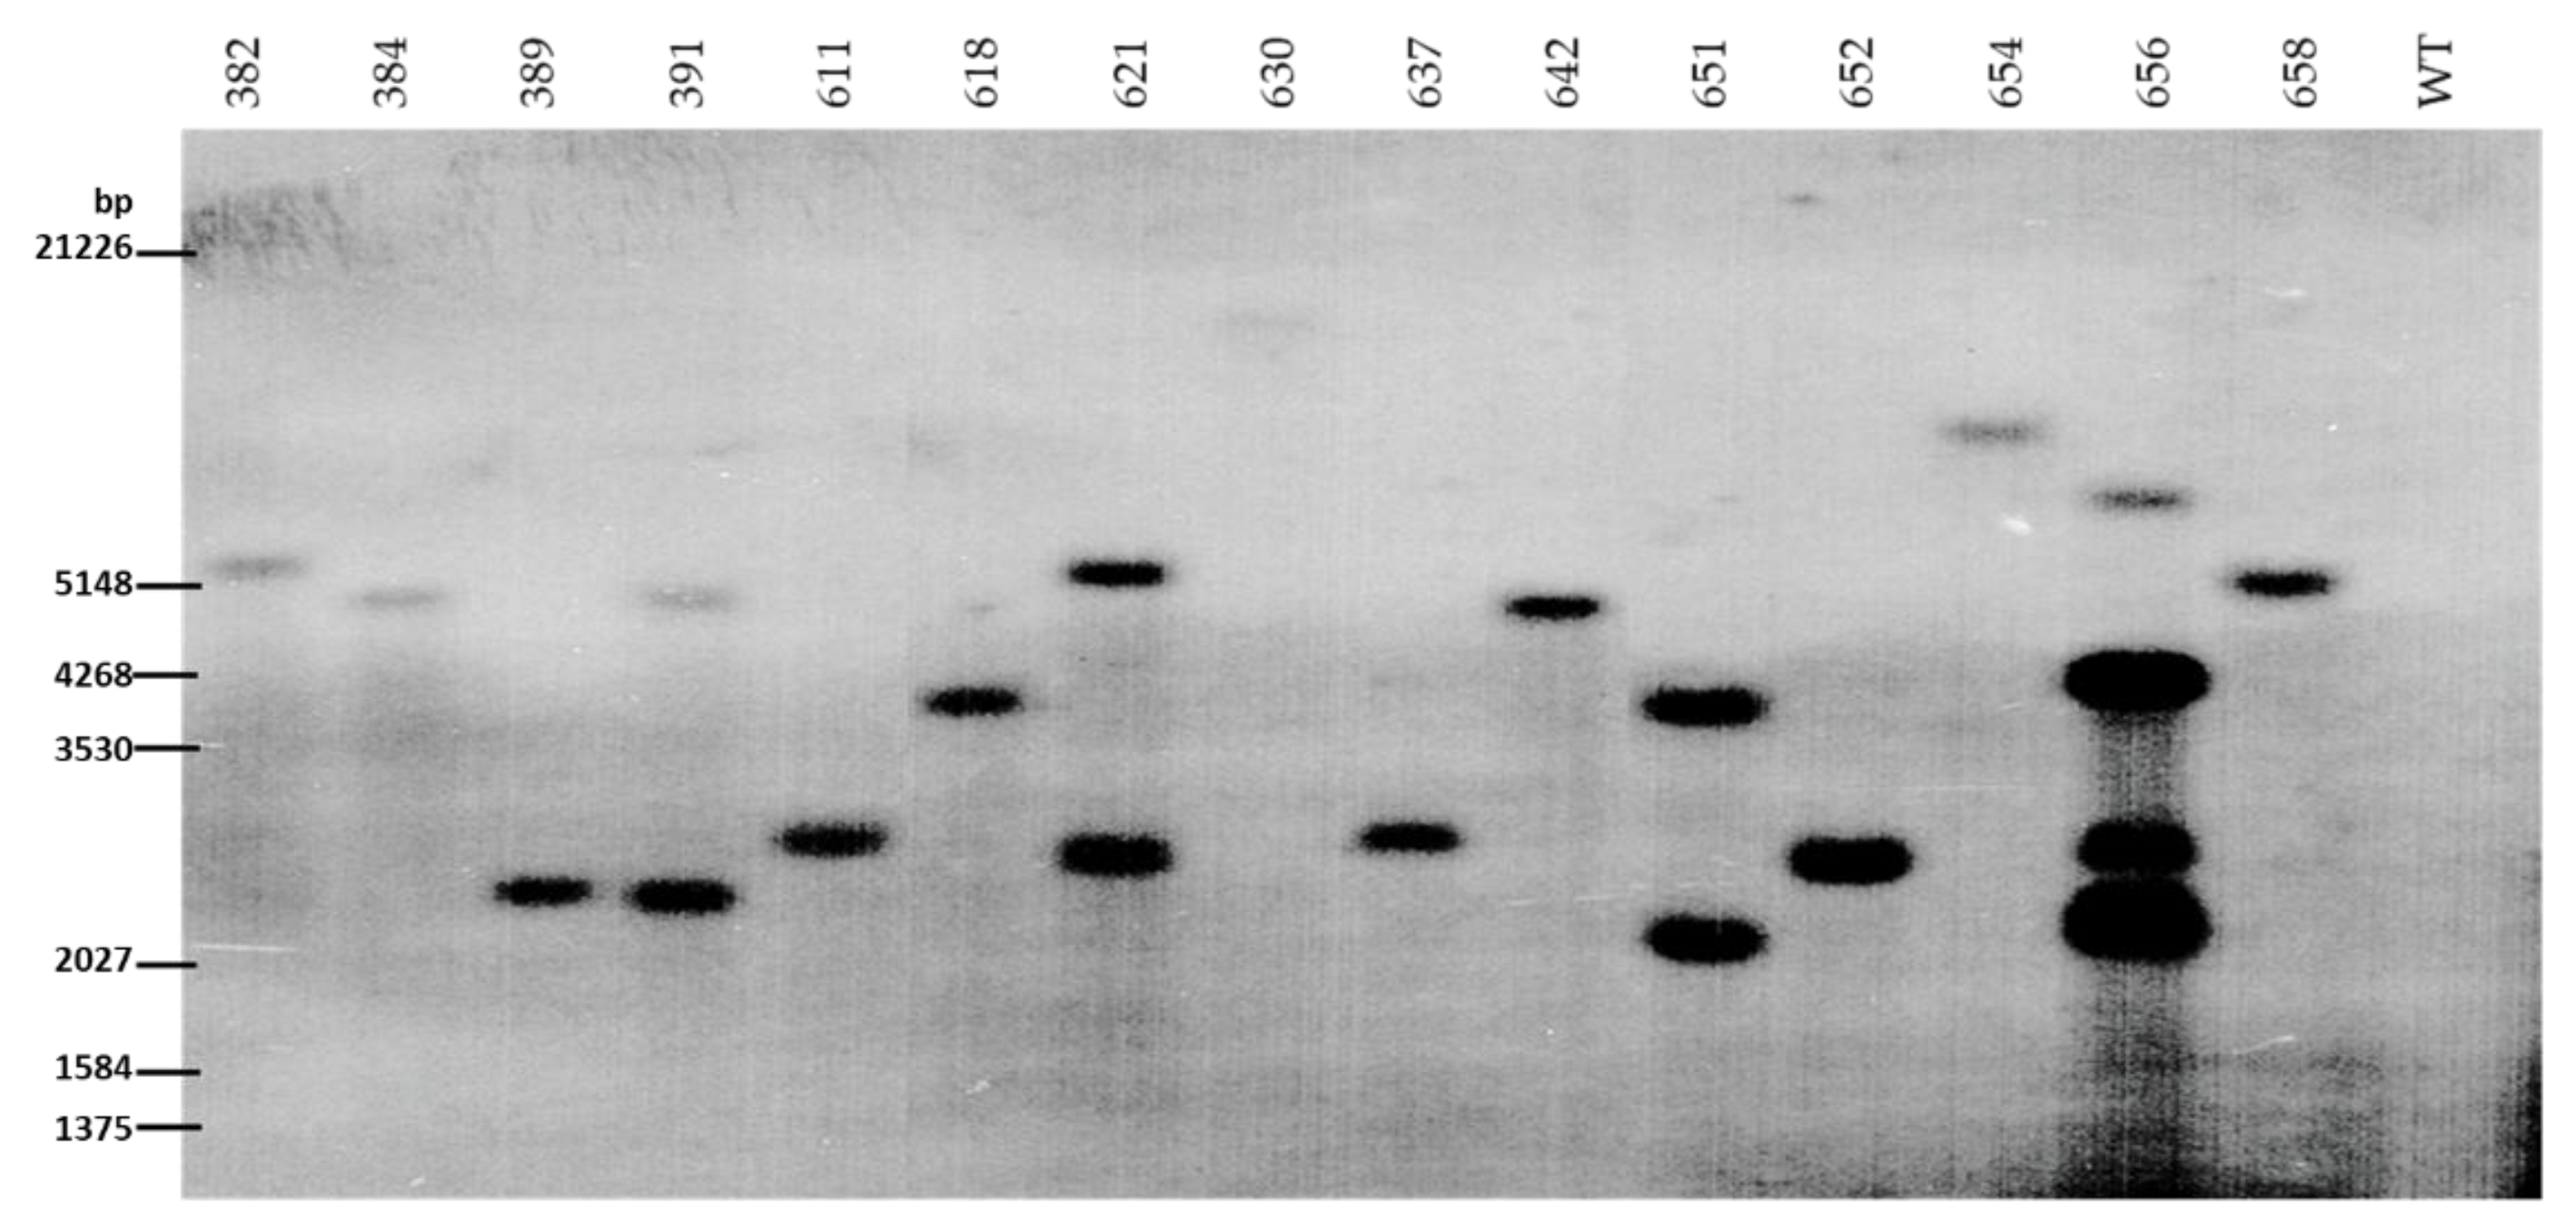
Five transgenic lines were randomly selected for each vector for Southern blot analysis with the 552 bp of the EGFP coding sequence probe (Figure S1). Due to presence of homologous CsPMIs in Kuharske citrange, EGFP was selected as the probe. Southern blot results indicated that most transgenic lines were low copy number for EGFP. Three out of five for both CsPMI1 and CsPMI2 transgenic lines and four out of five for AtPMI2 lines showed one band, indicating that there was single integration of transgenic EGFP in these lines (Figure 3).
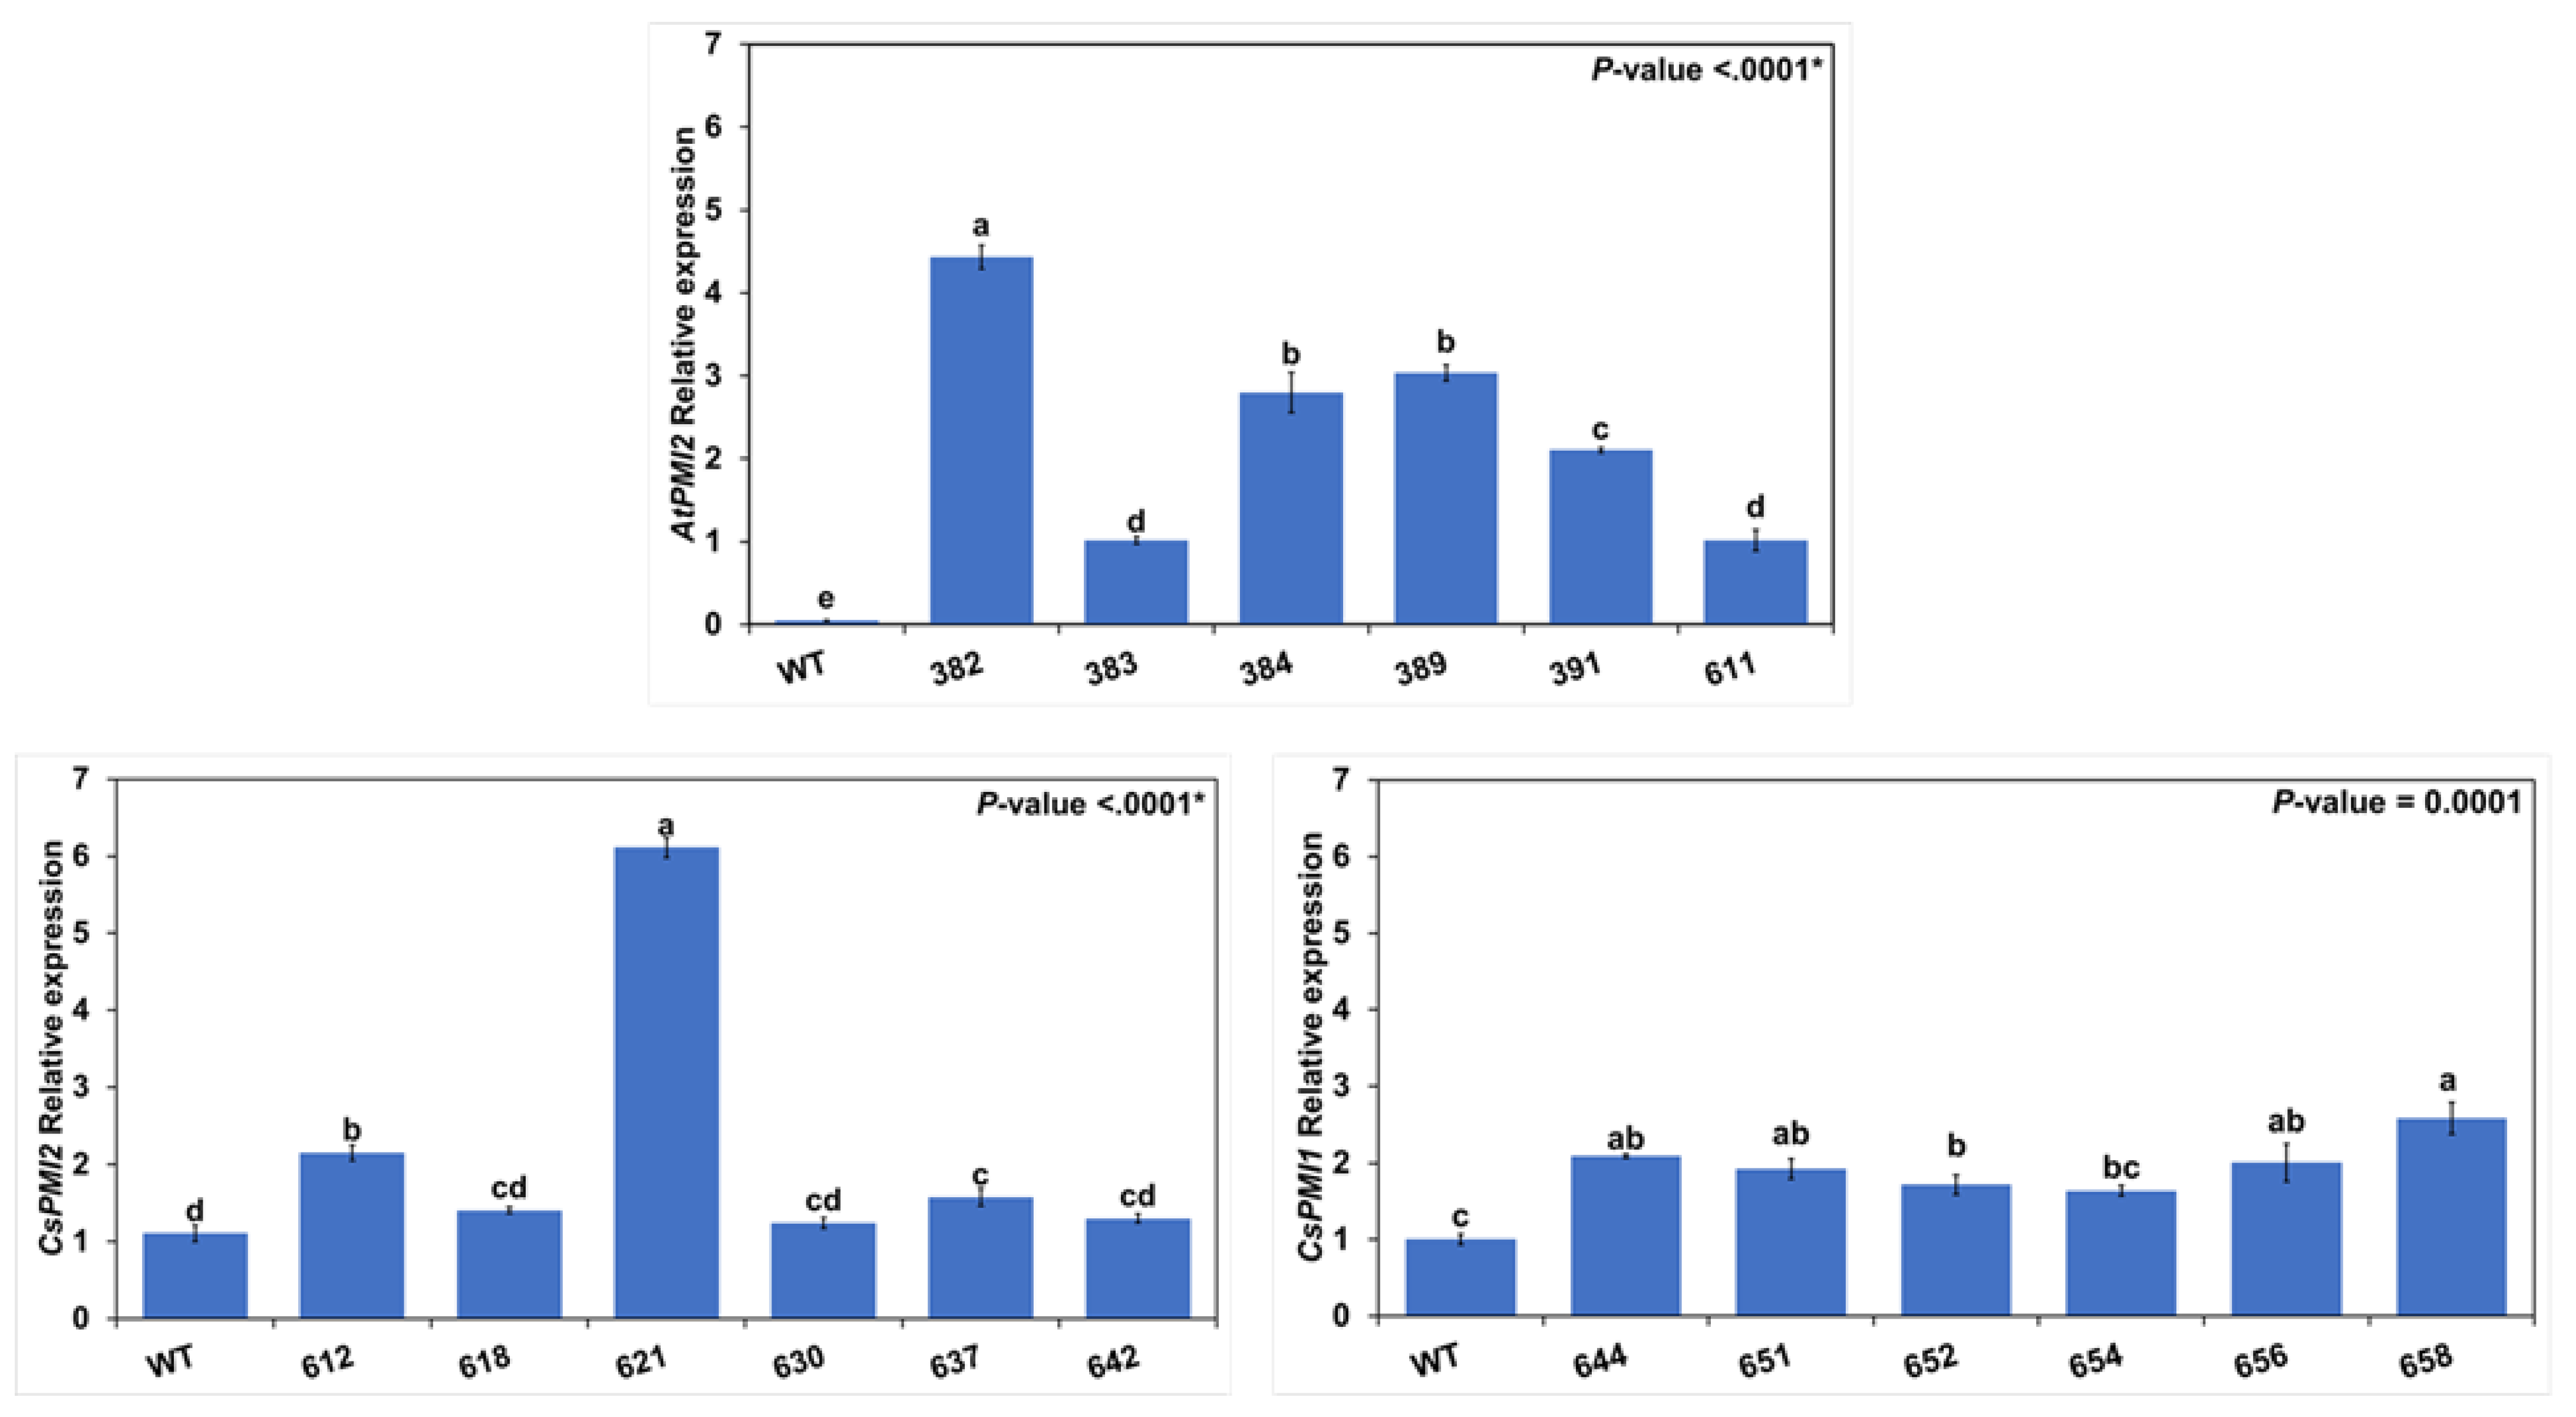
Quantitative real-time RT-PCR analysis of phosphomannose isomerase gene expression in citrus leaves of non-transgenic mature Kuharske citrange and six randomly selected, independent transgenic lines for each vector, were carried out. Analysis of PMI gene expression was highly significant (p-value < 0.0001) in all comparisons (Figure 4). The results showed that all the AtPMI2 transgenic lines expressed AtPMI2 gene while the non-transgenic control, lacking the gene, did not (Figure 4). Five lines (644, 651, 652, 656 and 658) out of six CsPMI1 lines and three lines (612, 621 and 637) out of six CsPMI2 lines expressed phosphomannose isomerase genes significantly higher than the non-transgenic control.

3.4. PMI In Vivo Enzyme Assay

Total PMI activity was examined in citrus leaves. Six independent transgenic lines of mature Kuharske citrange were randomly selected for each vector with non-transgenic, mature Kuharske citrange as a control. An E. coli PMI (EcPMI) Swingle citrumelo (C. paradisi Macfad. × P. trifoliata (L.) Raf.) single copy transgenic line was included as a positive control [32]. A non-transgenic Swingle citrumelo was also included to understand the background PMI activity between Kuharske citrange and Swingle citrumelo (Figure 5). There were three replicates from each plant and the test was repeated twice. The results were highly significant (p-value < 0.0001) and indicated that most of the transgenic lines from the three vectors showed higher PMI activity than the non-transgenic control (Figure 5). Five (line 382, 383, 384, 389 and 611) out of six AtPMI2 lines, four (line 644, 651, 652 and 654) out of six CsPMI1 lines and all CsPMI2 lines were significantly different than the non-transgenic control. The highest PMI activity was in line 621, a CsPMI2 transgenic line, and PMI activity of CsPMI1 line 644 was not significantly different from the positive control E. coli PMI (EcPMI) transgenic line.

3.5. Confirmation of PMI Expression Using Chlorophenol Red Assay

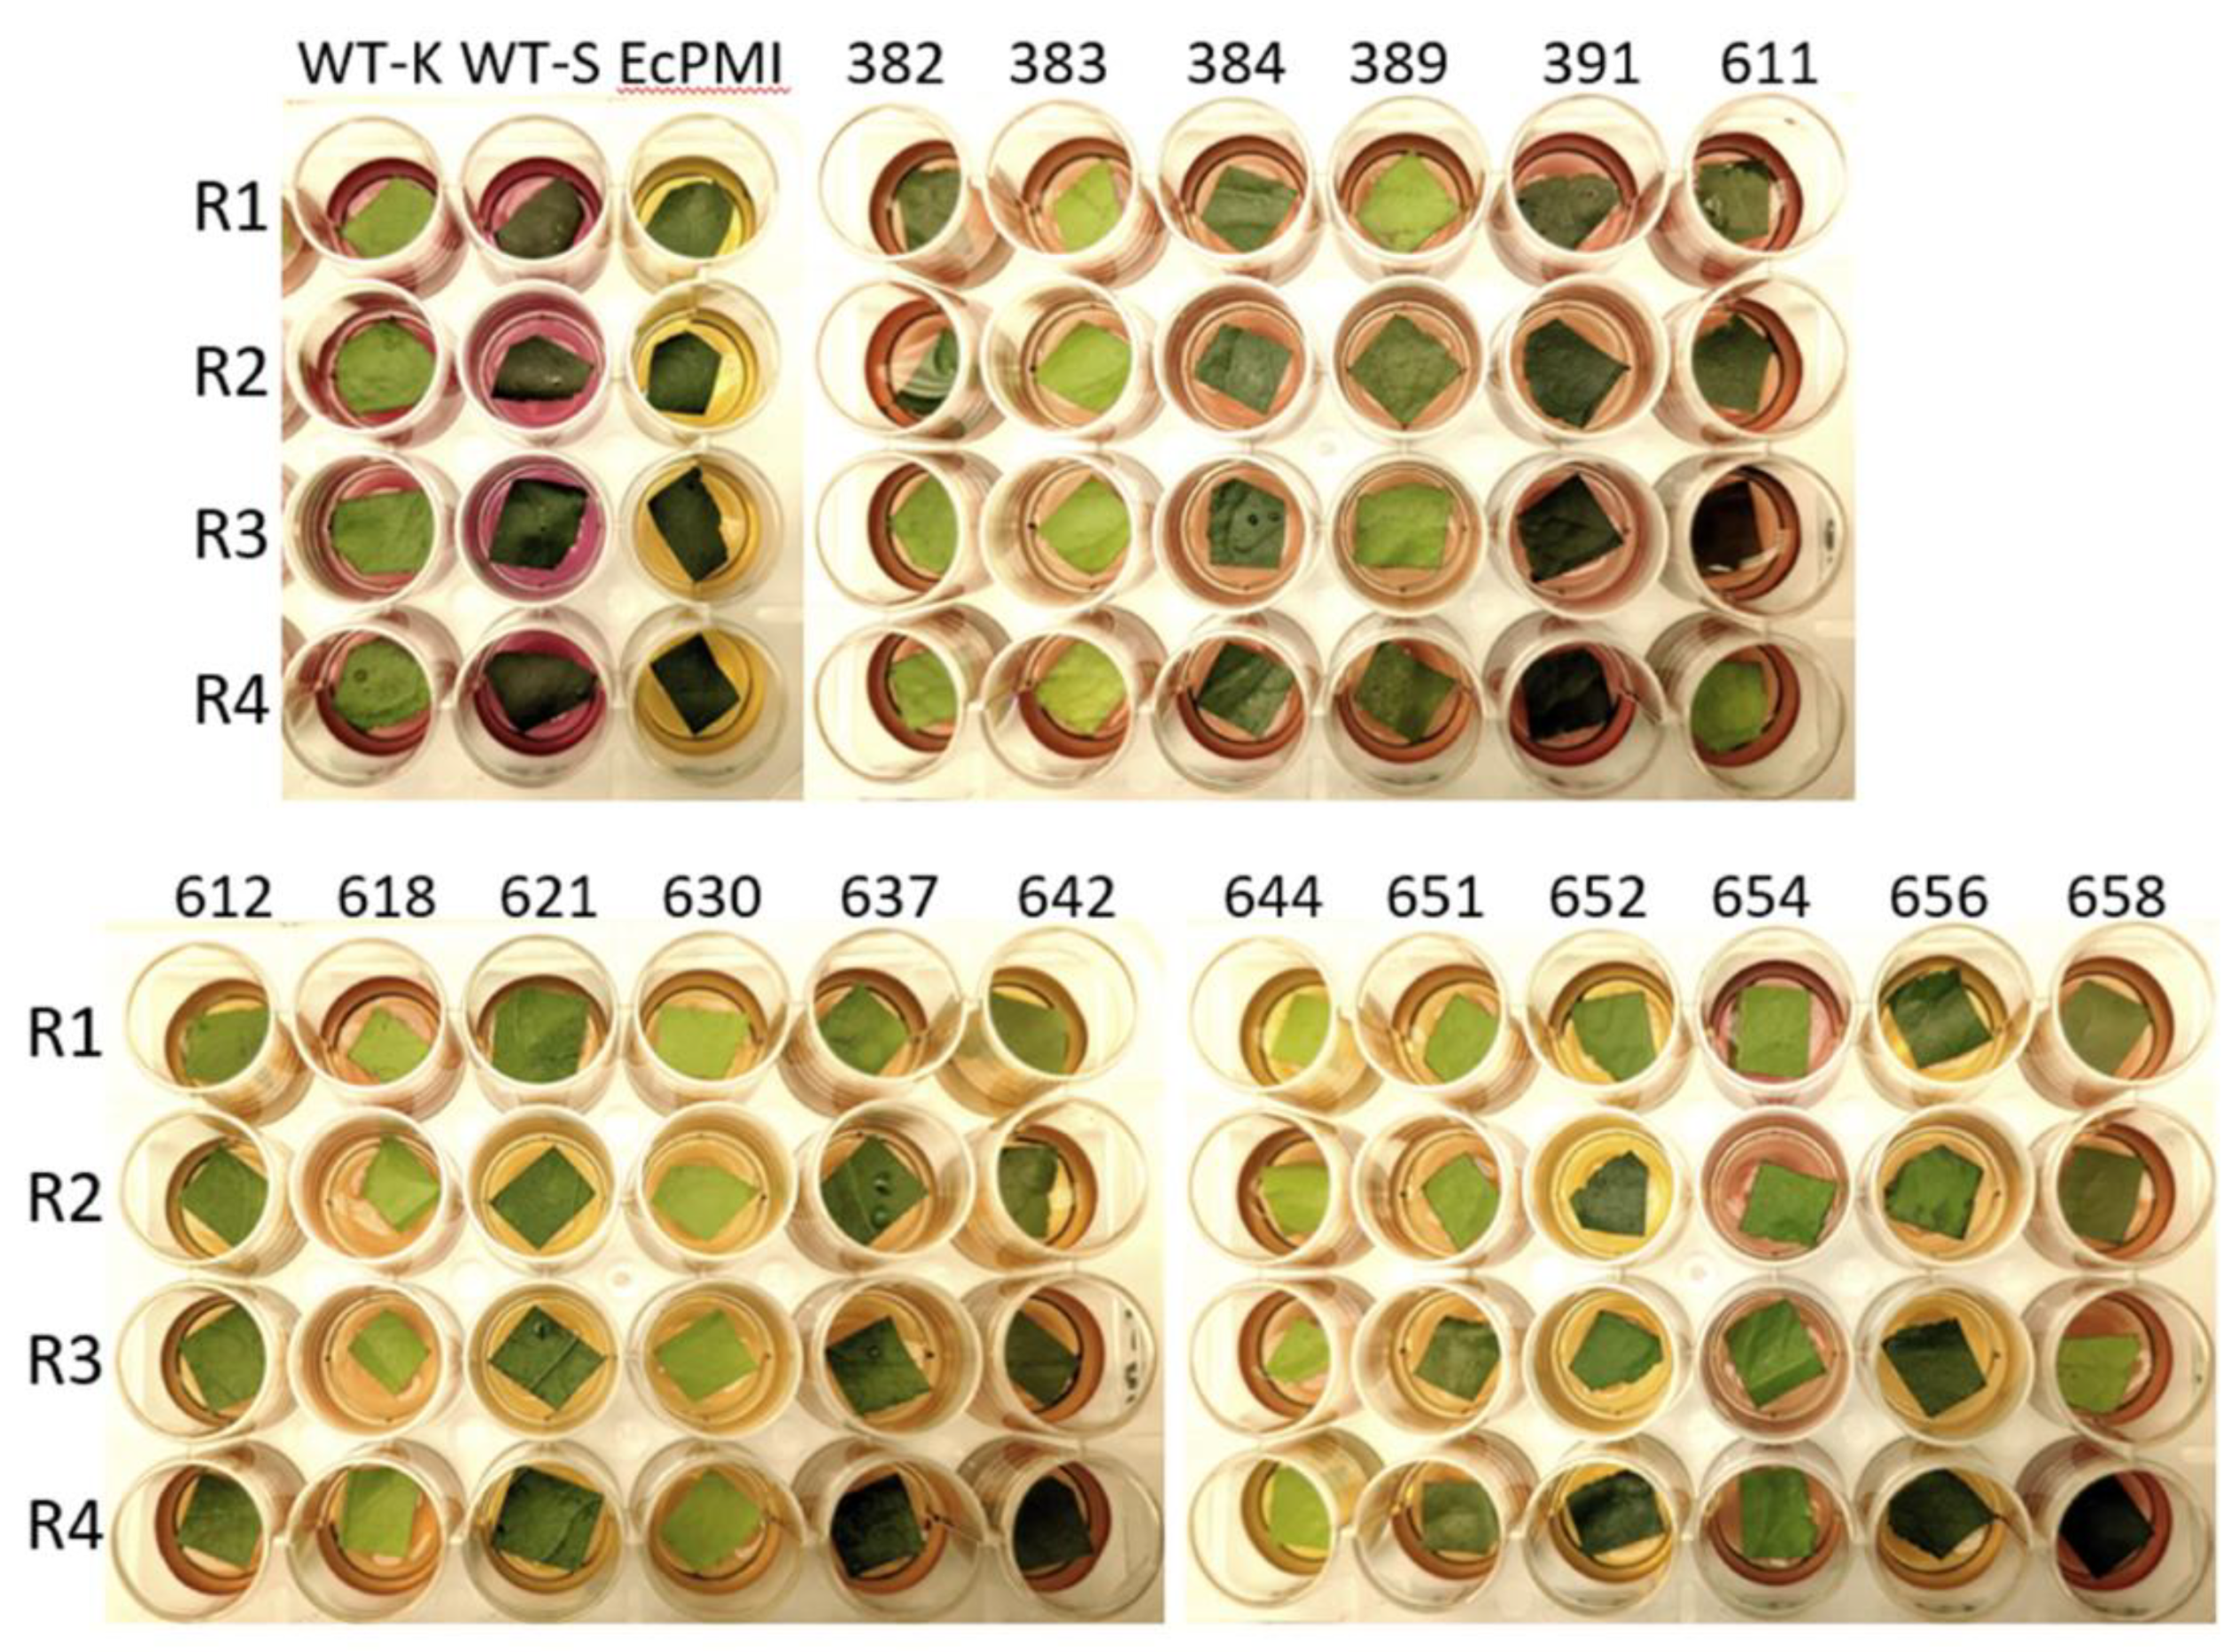
PMI activity was also analyzed in citrus leaves. Six independent transgenic lines of mature Kuharske citrange were randomly selected for each vector with non-transgenic, mature Kuharske citrange as a control. An E. coli PMI (EcPMI) transgenic line of Swingle citrumelo (C. paradisi Macfad. × P. trifoliata (L.) Raf.) obtained from another project was also included as a positive control and a non-transgenic Swingle citrumelo was also included as a negative control (Figure 6). There were four replicates with four different leaves from each plant. In general, the non-quantitative chlorophenol red assay showed that for several transgenic lines (EcPMI, 621, 630, 644, 652) from the three vectors, the color changed from red to bright yellow indicating the presence of PMI enzyme activity while the non-transgenic controls, with fewer copies of the genes, remained red.

4. Discussion

A high number of non-transgenic escapes is common in citrus transformation. In immature/juvenile sweet orange and grapefruit transformations, the escaped shoots varied from 60% to 90% [41]. In mature citrus transformation, the number of escapes is even higher than that of immature citrus. Cervera et al. (1998) reported that mature citrus escapes were 93.9 % in sweet orange [42] and ranged from 97% to 99.7% in clementine [43] at 100 mg L−1 kanamycin [40]. In the present work, at all mannose and sucrose concentrations, except for 30 g L−1 mannose and 0 g L−1 sucrose for AtPMI2 and CsPMI2, non-transgenic escaped shoots were produced.
It is also common in citrus transformation to obtain transgenic plants without selection. In our study, transgenics were produced at 0 g L−1 mannose and 30 g L−1 sucrose with all vectors. An et al., reported up to 0.67% transformation efficiency for immature “Duncan” grapefruit without selection [11]. Our experiments with mature “Hamlin” and “Early Valencia 1” (“EV1”) sweet orange cultivars showed transformation efficiency of ~1.94% without selection while the transformation efficiency varied from 5.12% to 6.84% at 100 mg L−1 kanamycin (unpublished). In the current study, a significantly greater number of transgenics were produced using mannose selection at 7.5 g L−1 mannose and 22.5 g L−1 sucrose and 15 g L −1 mannose and 15 g L−1 sucrose with CsPMI2 as determined by TES.
The PMI in vivo enzyme assays showed that enzyme activities of the transgenic AtPMI2, CsPMI1, CsPMI2 were detected, and all three enzymes were expressed equivalently well compared with the relatively low expression from the homologous PMIs in Kuharske. In vivo PMI enzyme activity was significantly higher in line 621 transformed with CsPMI2 than line 644 transformed with CsPMI1 and the E. coli PMI, although the latter two transgenic lines were statistically equivalent (Figure 5). The chlorophenol red assay is a non-quantitative visible confirmation of presence or absence of PMI enzyme activity, less able to differentiate degrees of enzyme activity. Nevertheless Figure 6 confirms enzyme activity using the chlorophenol red assay for the highest expressing lines (EcPMI, 382, 621, 644, 652). Wild-types and lines 658, 656 and 391 were not statistically different from one another as determined by the in vivo enzyme assay and were grouped in the same statistical class. However, the values for wild-types were at the lower end of this statistical group, had fewer copies of the gene, and were clearly biologically different.
Successful mannose selection using EcPMI as the selectable marker has been demonstrated in multiple publications in immature citrus [29,30,31,32]. In one case, transformation efficiency was ~45% [31], but mature citrus is more difficult to transform than immature citrus with a lower transformation efficiency [43]. In sweet orange, the transformation efficiency of mature tissues was approximately threefold lower than that of immature material [42]. EcPMI worked well as a selectable marker in immature citrus, and we have studied it in detail in immature citrus [31,32]. There are no reports of using EcPMI as a selectable marker in mature citrus, however our results for CsPMI2 from the present experiments are very encouraging that it can be used as an intragenic selectable marker.
In addition, because EcPMI is derived from Escherichia coli, which is a common human pathogen, it remains a public concern. Although risk assessments regarding the health and safety of EcPMI in animals and the environment are benign [18,24,44], public acceptance of transgenic fruit with foreign DNA has become a contentious issue. This study illustrates the potential to address the problem of public acceptance by utilizing endogenous citrus genes for the creation of intragenic citrus.
In future research, constitutive citrus promoters and citrus terminators will be used for the genetic improvement of citrus. Cyclophilin (CsCYP), glyceraldehyde-3-phosphate dehydrogenase C2 (CsGAPC2), and elongation factor 1-alpha (CsEF1) [45] will be evaluated with CsPMI2 to generate intragenic citrus plants. In addition, the CitVO1, CitUNK and PamMybA promoters and terminators, exhibiting strong expression in fruit, but weak expression in leaves and other vegetative tissues [46] could also be tested. The embryo specific Dc3 promoter and terminator [47] is another option to be evaluated. The best performing combination will be selected to produce intragenic citrus plants.

5. Conclusions

AtPMI2 and CsPMI1 were not suitable as selectable markers in mature citrus transformation. However, CsPMI2 at 7.5 g L−1 mannose and 22.5 g L−1 sucrose and 15 g L−1 mannose and 15 g L−1 sucrose provided acceptable selection and can be used as a selectable marker for intragenic research with citrus derived promoters and terminators.

Supplementary Materials

The following supporting information can be downloaded at: https://www.mdpi.com/article/10.3390/horticulturae8030204/s1, Figure S1: The expression cassettes of plasmid 2300AtPMI2, 2300CsPMI2 or 2300PMI1; Table S1: Primers for endpoint and qRT-PCR.

Author Contributions

J.M.Z. and M.D. conceived and designed the research. M.D. identified the PMI genes and produced the plant transformation constructs. M.C. budded mature citrus, produced the transgenics, micrografted and secondary grafted transgenic shoots. H.W. performed endpoint PCR, sequenced sub-clones, and produced the Southern blot. M.D., K.R.W. and G.Z.M. performed the qRT-PCR. L.M.M. conducted the in vivo enzyme assays. H.W. wrote the first draft. H.W., M.C., J.M.Z. and M.D. edited the manuscript. All authors have read and agreed to the published version of the manuscript.

Funding

University of Florida, Institute of Food and Agricultural Sciences, Citrus Research and Education (CREC) and Citrus Research & Development Fund (CRDF) grant 18-067C to J.M.Z.

Institutional Review Board Statement

Not applicable.

Data Availability Statement

All data generated or analyzed during this study are included in this published article. Sequence information is available in NCBI GenBank.

Conflicts of Interest

The authors declare no conflict of interest.

References

  1. Schouten, H.J.; Krens, F.A.; Jacobsen, E. Cisgenic plants are similar to traditionally bred plants: International regulations for genetically modified organisms should be altered to exempt cisgenesis. EMBO Rep. 2006, 7, 750–753. [Google Scholar] [CrossRef] [Green Version]
  2. Espinoza, C.; Schlechter, R.; Herrera, D.; Torres, E.; Serrano, A.; Medina, C.; Arce-Johnson, P. Cisgenesis and intragenesis: New tools for improving crops. Biol. Res. 2013, 46, 323–331. [Google Scholar] [CrossRef] [Green Version]
  3. Nielsen, K.M. Transgenic organisms—Time for conceptual diversification? Nat. Biotechnol. 2003, 21, 227–228. [Google Scholar] [CrossRef]
  4. Rommens, C.M.; Humara, J.M.; Ye, J.; Yan, H.; Richael, C.; Zhang, L.; Perry, R.; Swords, K. Crop improvement through modification of the plant’s own genome. Plant Physiol. 2004, 135, 421–431. [Google Scholar] [CrossRef] [Green Version]
  5. Kost, T.D.; Jänsch, M.; Gessler, C.; Patocchi, A.; Broggini, G.; Flachowsky, H. Generation of a cisgenic apple line of cultivar ‘Gala’ with increased fire blight resistance. In Proceedings of the XIV EUCARPIA Symposium on Fruit Breeding and Genetics 1172, Bologna, Italy, 17 October 2017; pp. 79–84. [Google Scholar]
  6. Krens, F.A.; Schaart, J.G.; Van der Burgh, A.M.; Tinnenbroek-Capel, I.E.; Groenwold, R.; Kodde, L.P.; Broggini, G.A.; Gessler, C.; Schouten, H.J. Cisgenic apple trees; development, characterization, and performance. Front. Plant Sci. 2015, 6, 286. [Google Scholar] [CrossRef] [Green Version]
  7. Vanblaere, T.; Flachowsky, H.; Gessler, C.; Broggini, G.A. Molecular characterization of cisgenic lines of apple ‘Gala’ carrying the Rvi6 scab resistance gene. Plant Biotechnol. J. 2014, 12, 2–9. [Google Scholar] [CrossRef]
  8. Würdig, J.; Flachowsky, H.; Saß, A.; Peil, A.; Hanke, M.-V. Improving resistance of different apple cultivars using the Rvi6 scab resistance gene in a cisgenic approach based on the Flp/FRT recombinase system. Mol. Breed. 2015, 35, 1–18. [Google Scholar] [CrossRef]
  9. Krens, F.; Salentijn, E.; Schaart, J.; Schouten, H.; Jacobsen, E. Current progress in trans-and cisgenic apple and strawberry breeding. Acta Hortic. 2012, 941, 37–48. [Google Scholar] [CrossRef] [Green Version]
  10. Haverkort, A.; Jacobsen, E.; Visser, R.; Boonekamp, P.; Vossen, J.; Kessel, G.; Hutten, R.; Franke, A.; Lotz, L. Sustainable resistance against phytophthora in potato through cisgenic. In Proceedings of the Eleventh EuroBlight Workshop, Lelystad, The Netherlands, 28–31 October 2008; pp. 259–260. [Google Scholar]
  11. An, C.; Orbovic, V.; Mou, Z. An efficient intragenic vector for generating intragenic and cisgenic plants in citrus. Am. J. Plant Sci. 2013, 4, 2131. [Google Scholar] [CrossRef] [Green Version]
  12. Merritt, B.A.; Zhang, X.; Triplett, E.W.; Mou, Z.; Orbović, V. Selection of transgenic citrus plants based on glyphosate tolerance conferred by a citrus 5-enolpyruvylshikimate-3-phosphate synthase variant. Plant Cell Rep. 2021, 40, 1947–1956. [Google Scholar] [CrossRef]
  13. de Vetten, N.; Wolters, A.-M.; Raemakers, K.; van der Meer, I.; ter Stege, R.; Heeres, E.; Heeres, P.; Visser, R. A transformation method for obtaining marker-free plants of a cross-pollinating and vegetatively propagated crop. Nat. Biotechnol. 2003, 21, 439–442. [Google Scholar] [CrossRef]
  14. Qin, J.; Wang, Y.; Zhu, C. Biolistic transformation of wheat using the HMW-GS 1Dx5 gene without selectable markers. Genet. Mol. Res. 2014, 13, 4361–4371. [Google Scholar] [CrossRef]
  15. Hu, L.; Li, H.; Qin, R.; Xu, R.; Li, J.; Li, L.; Wei, P.; Yang, J. Plant phosphomannose isomerase as a selectable marker for rice transformation. Sci. Rep. 2016, 6, 25921. [Google Scholar] [CrossRef] [Green Version]
  16. Peña, L.; Cervera, M.; Fagoaga, C.; Romero, J.; Ballester, A.; Soler, N.; Pons, E.; Rodríguez, A.; Peris, J.; Juárez, J. Citrus. Comp. Transgenic Crop Plants 2009, 1–62. [Google Scholar] [CrossRef]
  17. Srivastava, V.; Ow, D.W. Marker-free site-specific gene integration in plants. Trends Biotechnol. 2004, 22, 627–629. [Google Scholar] [CrossRef]
  18. Privalle, L.S.; Wright, M.; Reed, J.; Hansen, G.; Dawson, J.; Dunder, E.M.; Chang, Y.-F.; Powell, M.L.; Meghji, M. Phosphomannose isomerase–a novel system for plant selection. Can. Wheat Board Agrium Foragen 2000, 171. [Google Scholar] [CrossRef]
  19. Duan, Y.; Zhai, C.; Li, H.; Li, J.; Mei, W.; Gui, H.; Ni, D.; Song, F.; Li, L.; Zhang, W. An efficient and high-throughput protocol for Agrobacterium-mediated transformation based on phosphomannose isomerase positive selection in Japonica rice (Oryza sativa L.). Plant Cell Rep. 2012, 31, 1611–1624. [Google Scholar] [CrossRef]
  20. Gui, H.; Li, X.; Liu, Y.; Han, K.; Li, X. The relationship between PMI (manA) gene expression and optimal selection pressure in Indica rice transformation. Plant Cell Rep. 2014, 33, 1081–1090. [Google Scholar] [CrossRef]
  21. Hoa, T.T.C.; Al-Babili, S.; Schaub, P.; Potrykus, I.; Beyer, P. Golden Indica and Japonica rice lines amenable to deregulation. Plant Physiol. 2003, 133, 161–169. [Google Scholar] [CrossRef] [Green Version]
  22. Lucca, P.; Ye, X.; Potrykus, I. Effective selection and regeneration of transgenic rice plants with mannose as selective agent. Mol. Breed. 2001, 7, 43–49. [Google Scholar] [CrossRef]
  23. Gadaleta, A.; Giancaspro, A.; Blechl, A.; Blanco, A. Phosphomannose isomerase, pmi, as a selectable marker gene for durum wheat transformation. J. Cereal Sci. 2006, 43, 31–37. [Google Scholar] [CrossRef]
  24. Reed, J.; Privalle, L.; Powell, M.L.; Meghji, M.; Dawson, J.; Dunder, E.; Sutthe, J.; Wenck, A.; Launis, K.; Kramer, C. Phosphomannose isomerase: An efficient selectable marker for plant transformation. Vitr. Cell. Dev. Biol. Plant 2001, 37, 127–132. [Google Scholar] [CrossRef]
  25. Wright, M.; Dawson, J.; Dunder, E.; Suttie, J.; Reed, J.; Kramer, C.; Chang, Y.; Novitzky, R.; Wang, H.; Artim-Moore, L. Efficient biolistic transformation of maize (Zea mays L.) and wheat (Triticum aestivum L.) using the phosphomannose isomerase gene, pmi, as the selectable marker. Plant Cell Rep. 2001, 20, 429–436. [Google Scholar] [CrossRef]
  26. Hur, S.-H.; Min, B.-W. Efficient development of transgenic Cabbage with jasmonic acid carboxyl methyltransferase (JMT) gene based on PMI/mannose selection system. Plant Breed Biotechnol. 2015, 3, 226–237. [Google Scholar] [CrossRef] [Green Version]
  27. Ku, J.J.; Park, Y.H.; Park, Y.D. A non-antibiotic selection system uses the phosphomannose-isomerase (PMI) gene for Agrobacterium-mediated transformation of Chinese cabbage. J. Plant Biol. 2006, 49, 115–122. [Google Scholar] [CrossRef]
  28. Min, B.W.; Cho, Y.N.; Song, M.J.; Noh, T.K.; Kim, B.K.; Chae, W.K.; Park, Y.S.; Choi, Y.D.; Harn, C.H. Successful genetic transformation of Chinese cabbage using phosphomannose isomerase as a selection marker. Plant Cell Rep. 2007, 26, 337–344. [Google Scholar] [CrossRef]
  29. Ballester, A.; Cervera, M.; Pena, L. Evaluation of selection strategies alternative to nptII in genetic transformation of citrus. Plant Cell Rep. 2008, 27, 1005–1015. [Google Scholar] [CrossRef]
  30. Boscariol, R.; Almeida, W.; Derbyshire, M.; Mourao Filho, F.; Mendes, B. The use of the PMI/mannose selection system to recover transgenic sweet orange plants (Citrus sinensis L. Osbeck). Plant Cell Rep. 2003, 22, 122–128. [Google Scholar] [CrossRef]
  31. Dutt, M.; Lee, D.H.; Grosser, J.W. Bifunctional selection–reporter systems for genetic transformation of citrus: Mannose-and kanamycin-based systems. Vitr. Cell. Dev. Biol. Plant 2010, 46, 467–476. [Google Scholar] [CrossRef]
  32. Wu, H.; Acanda, Y.; Canton, M.; Zale, J. Efficient biolistic transformation of immature citrus rootstocks using phosphomannose-isomerase selection. Plants 2019, 8, 390. [Google Scholar] [CrossRef] [Green Version]
  33. Lin, Y.; Huang, J. Characterization of an algal phosphomannose isomerase gene and its application as a selectable marker for genetic manipulation of tomato. Plant Diver. 2021, 43, 63–70. [Google Scholar] [CrossRef]
  34. Wang, Y.; Geng, L.; Gui, H.; Liu, Y.; Wang, Y.; Zhang, X.; Li, X. Soybean PMI genes as a selectable marker for corn and rice transformation. Maize Genet. Coop. News Lett. 2015, 89, 1–3. [Google Scholar]
  35. Tamura, K.; Stecher, G.; Kumar, S. MEGA11: Molecular evolutionary genetics analysis version 11. Mol. Biol. Evol. 2021, 38, 3022–3027. [Google Scholar] [CrossRef]
  36. Wu, H.; Acanda, Y.; Shankar, A.; Peeples, M.; Hubbard, C.; Orbović, V.; Zale, J. Genetic transformation of commercially important mature citrus scions. Crop Sci. 2015, 55, 2786–2797. [Google Scholar] [CrossRef]
  37. Murashige, T.; Tucker, D.P.H. Growth factor requirements of citrus tissue cultre. Intl. Citrus Symp. 1969, 11, 1155–1161. [Google Scholar]
  38. Cervera, M.; Juarez, J.; Navarro, L.; Pena, L. Genetic transformation of mature citrus plants. In Methods in Molecular Biology; Pena, L., Ed.; Humana Press: Totowa, NJ, USA, 2005; Volume 86, pp. 177–187. [Google Scholar]
  39. Porebski, S.; Bailey, L.G.; Baum, B.R. Modification of a CTAB DNA extraction protocol for plants containing high polysaccharide and polyphenol components. Plant Mol. Biol. Rep. 1997, 15, 8–15. [Google Scholar] [CrossRef]
  40. Livak, K.J.; Schmittgen, T.D. Analysis of relative gene expression data using real-time quantitative PCR and the 2−ΔΔCT method. Methods 2001, 25, 402–408. [Google Scholar] [CrossRef]
  41. Pena, L.; Perez, R.M.; Cervera, M.; Juarez, J.A.; Navarro, L. Early events in Agrobacterium-mediated genetic transformation of citrus explants. Ann. Bot. 2004, 94, 67–74. [Google Scholar] [CrossRef] [Green Version]
  42. Cervera, M.; Juarez, J.; Navarro, A.; Pina, J.A.; Duran-Vila, N.; Navarro, L.; Pena, L. Genetic transformation and regeneration of mature tissues of woody fruit plants bypassing the juvenile stage. Transgenic Res. 1998, 7, 51–59. [Google Scholar] [CrossRef]
  43. Cervera, M.; Navarro, A.; Navarro, L.; Pena, L. Production of transgenic adult plants from clementine mandarin by enhancing cell competence for transformation and regeneration. Tree Physiol. 2008, 28, 55–66. [Google Scholar] [CrossRef] [Green Version]
  44. Chassy, B.M. Food safety risks and consumer health. New Biotechnol. 2010, 27, 534–544. [Google Scholar] [CrossRef]
  45. Erpen, L.; Tavano, E.; Harakava, R.; Dutt, M.; Grosser, J.; Piedade, S.; Mendes, B.; Mourão Filho, F. Isolation, characterization, and evaluation of three Citrus sinensis-derived constitutive gene promoters. Plant Cell Rep. 2018, 37, 1113–1125. [Google Scholar] [CrossRef]
  46. Dasgupta, K.; Hotton, S.; Belknap, W.; Syed, Y.; Dardick, C.; Thilmony, R.; Thomson, J.G. Isolation of novel citrus and plum fruit promoters and their functional characterization for fruit biotechnology. BMC Biotechnol. 2020, 20, 1–15. [Google Scholar] [CrossRef]
  47. Dutt, M.; Zambon, F.T.; Erpen, L.; Soriano, L.; Grosser, J. Embryo-specific expression of a visual reporter gene as a selection system for citrus transformation. PLoS ONE 2018, 13, e0190413. [Google Scholar] [CrossRef] [Green Version]
Figure 1. Phylogenetic tree of plant PMIs. MEGA11 was constructed using the Neighbor-Joining method with 1000 bootstrap replicates. The bootstrap support values showing the confidence level are given at the clade nodes as percentages. Other parameters include poisson model, uniform rates, and pairwise deletion.
Horticulturae 08 00204 g001
Figure 2. PCR confirmation of the phosphomannose isomerase gene (PMI) in mature Kuharske transgenic lines with EGFP and PMI primers. Upper left: M = molecular markers; CK+ = plasmid 2300AtPMI2 containing AtPMI2 and EGFP genes; CK- = non-transgenic wildtype Kuharske plant; lines 382, 383, 384, 389, 391,608, 611, 622, 623, 624 are the AtPMI2 transgenic lines. Upper right: M = molecular markers; CK+ = plasmid 2300CsPMI1 containing CsPMI1 and EGFP genes; CK- = non-transgenic wildtype Kuharske plant; lines 643, 644, 645, 646, 647, 651, 652, 654, 655, 656, 658, 678, 679, 680 are the CsPMI1 transgenic lines. Lower: M = molecular markers; CK+ = plasmid 2300CsPMI2 containing CsPMI2 and EGFP genes; CK- = non-transgenic wildtype Kuharske plant; lines 612, 613, 614, 615, 616, 617, 618, 619, 621, 628, 629, 630, 632, 634, 636, 637, 638, 639, 642, 650 are the CsPMI2 transgenic lines.
Horticulturae 08 00204 g002
Figure 3. Southern blot analysis of mature Kuharske transgenic lines with EGFP probe. Lines 382, 384, 389, 391, 611 are AtPMI2 transgenics; lines 618, 621, 630, 637, 642 are CsPMI2 transgenics; lines 651, 652, 654, 656, 658 are CsPMI1 transgenics; WT = non-transgenic wildtype Kuharske. Plant genomic DNA was digested with EcoRV.
Horticulturae 08 00204 g003
Figure 4. Quantitative real-time RT-PCR analysis of phosphomannose isomerase gene (PMI) expression in citrus leaves. The citrus actin7 gene (NCBI accession: XM_006464503.3) was used as a reference gene for the normalization. WT, non-transgenic mature Kuharske. Upper: lines 382, 383, 384, 389, 391, 611 are the AtPMI2 transgenic lines. Lower left: lines 612, 618, 621, 630, 637, 642 are the CsPMI2 transgenic lines. Lower right: lines 644, 651, 652, 654, 656, 658 are the CsPMI1 transgenic lines; six independent transgenic lines of mature Kuharske were selected randomly and examined from each construct, three replicates from each plant. The test was repeated twice. Bars represented the Mean ± Standard Error (SE) of three technical replicates. Means followed by the same letter were not different at p ≤ 0.05 using Student’s t-test.
Horticulturae 08 00204 g004
Figure 5. Quantitative analysis of total phosphomannose isomerase (PMI) activity in citrus leaves. WT-K, non-transgenic mature Kuharske; WT-S, non-transgenic Swingle; EcPMI, positive control of transgenic Swingle obtained from another project; lines 382, 383, 384, 389, 391, 611 are the AtPMI2 transgenics; lines 612, 618, 621, 630, 637, 642 are the CsPMI2 transgenics; lines 644, 651, 652, 654, 656, 658 are the CsPMI1 transgenics; six independent transgenic lines of mature Kuharske citrange were randomly selected and examined from each construct, three replicates from each plant. The test was repeated twice. Bars represented the Mean ± Standard Error (SE) of three technical replicates. Means followed by the same letter were not different at p ≤ 0.05 using Student’s t-test.
Horticulturae 08 00204 g005
Figure 6. Chlorophenol red assay for phosphomannose isomerase (PMI) activity of citrus leaves. WT-K, non-transgenic mature Kuharske; WT-S, non-transgenic Swingle; EcPMI, positive control of transgenic Swingle obtained from another project; lines 382, 383, 384, 389, 391, 611 are the AtPMI2 transgenics; lines 612, 618, 621, 630, 637, 642 are the AtPMI2 transgenics; lines 644, 651, 652, 654, 656, 658 are the CsPMI1 transgenics; six independent transgenic lines of mature Kuharske were selected randomly and examined from each construct, four replicates from each plant. R1 to R4 are replicates.
Horticulturae 08 00204 g006
Table 1. The number of transgenics produced using phosphomannose isomerase selection and different combinations of mannose and sucrose in mature Kuharske over six replicates.
VectorMannose +
Sucrose (g L−1)
No. of ExplantsNo. of ShootsTransgenic Shoots w/EGFP
AtPMI20/3036076012
1.9/28.13605222
3.8/26.23604827
7.5/22.53602936
15/153602897
30/03601160
Sum-2160246334
CsPMI10/304006848
1.9/28.14005706
3.8/26.240050410
7.5/22.54003349
15/154002365
30/0400721
Sum-2400240039
CsPMI20/304006518
1.9/28.14005686
3.8/26.24004429
7.5/22.540039217
15/154002969
30/040000
Sum-2400244249
Table 2. AtPMI2 means, multiple comparisons, and standard errors for the different variables.
Variables aTreatment
Mannose + Sucrose (g L−1) b
Mean c±SE d
SL > 20/30126.7 a15.3
SL > 21.9/28.187.0 a2.1
SL > 23.8/26.280.32.1
SL > 27.5/22.548.92.5
SL > 215/1548.23.9
SL > 230/019.48.5
PS0/302.0 a0.5
PS1.9/28.10.30.2
PS3.8/26.21.1 a0.3
PS7.5/22.51.0 a0.3
PS15/151.2 a0.2
PS30/00.00.0
TES0/301.4 a0.2
TES1.9/28.10.4 a0.2
TES3.8/26.21.3 a0.3
TES7.5/22.52.0 a0.5
TES15/152.4 a0.5
TES30/00.00.0
TEE0/303.6 a1.1
TEE1.9/28.10.70.4
TEE3.8/26.21.8 a0.4
TEE7.5/22.51.00.4
TEE15/152.2 a0.6
TEE30/00.00.0
a Variables: SL > 2, shoot length greater than 2 mm; PS, positive shoots; TES, transformation efficiency based on the number of screened shoots; TEE, transformation efficiency based on the number of explants; b Treatment, g mannose + g sucrose; c Mean of six replicates; d ± SE, ± standard error. Means with the same letter are not significantly different from the sucrose control at the 5% level.
Table 3. CsPMI1 means, multiple comparisons, and standard errors for the different variables.
Variables aTreatment
Mannose + Sucrose (g L−1) b
Mean c±SE d
SL > 20/30114.0 a8.1
SL > 21.9/28.195.0 a10.4
SL > 23.8/26.284.010.1
SL > 27.5/22.555.72.2
SL > 215/1539.43.4
SL > 230/012.01.6
PS0/301.3 a0.4
PS1.9/28.11.0 a0.4
PS3.8/26.21.7 a0.3
PS7.5/22.51.5 a0.2
PS15/150.7 a0.1
PS30/00.20.2
TES0/301.2 a0.4
TES1.9/28.11.3 a0.5
TES3.8/26.22.3 a0.6
TES7.5/22.52.6 a0.4
TES15/152.0 a0.4
TES30/01.0 a1.0
TEE0/302.1 a0.7
TEE1.9/28.11.6 a0.7
TEE3.8/26.22.5 a0.3
TEE7.5/22.52.5 a0.7
TEE15/151.1 a0.2
TEE30/00.2 a0.2
a Variables: SL > 2, shoot length greater than 2 mm; PS, positive shoots; TES, transformation efficiency based on the number of screened shoots; TEE, transformation efficiency based on the number of explants; b Treatment, g mannose + g sucrose; c Mean of 6 replicates; d ± SE, ± standard error. Means with the same letter are not significantly different from the sucrose control at the 5% level.
Table 4. CsPMI2 means, multiple comparisons, and standard errors for the different variables.
Variable aTreatment
Mannose + Sucrose (g L−1) b
Mean c±SE d
SL > 20/30108.5 a20.5
SL > 21.9/28.194.7 a23.8
SL > 23.8/26.273.7 a3.3
SL > 27.5/22.565.38.9
SL > 215/1549.36.9
SL > 230/015.52.6
PS0/301.4 a0.2
PS1.9/28.11.0 a0.1
PS3.8/26.21.4 a0.2
PS7.5/22.52.70.4
PS15/151.6 a0.3
PS30/00.00.0
TES0/301.7 a0.5
TES1.9/28.11.6 a0.6
TES3.8/26.22.0 a0.3
TES7.5/22.54.40.7
TES15/153.70.9
TES30/00.0 a0.0
TEE0/302.0 a0.2
TEE1.9/28.11.5 a0.2
TEE3.8/26.22.1 a0.3
TEE7.5/22.54.20.7
TEE15/152.4 a0.4
TEE30/00.00.0
a Variables: SL > 2, shoot length greater than 2 mm; PS, positive shoots; TES, transformation efficiency based on the number of screened shoots; TEE, transformation efficiency based on the number of explants; b Treatment, g mannose + g sucrose; c Mean of 6 replicates; d ± SE, ± standard error. Means with the same letter are not significantly different from the sucrose control at the 5% level.
Publisher’s Note: MDPI stays neutral with regard to jurisdictional claims in published maps and institutional affiliations.