
Grapevine Response to Stress Generated by Excessive Temperatures during the Budburst

 ,
,  ,
,  ,
, 

Abstract
:1. Introduction
2. Materials and Methods
2.1. 2017 Experiment
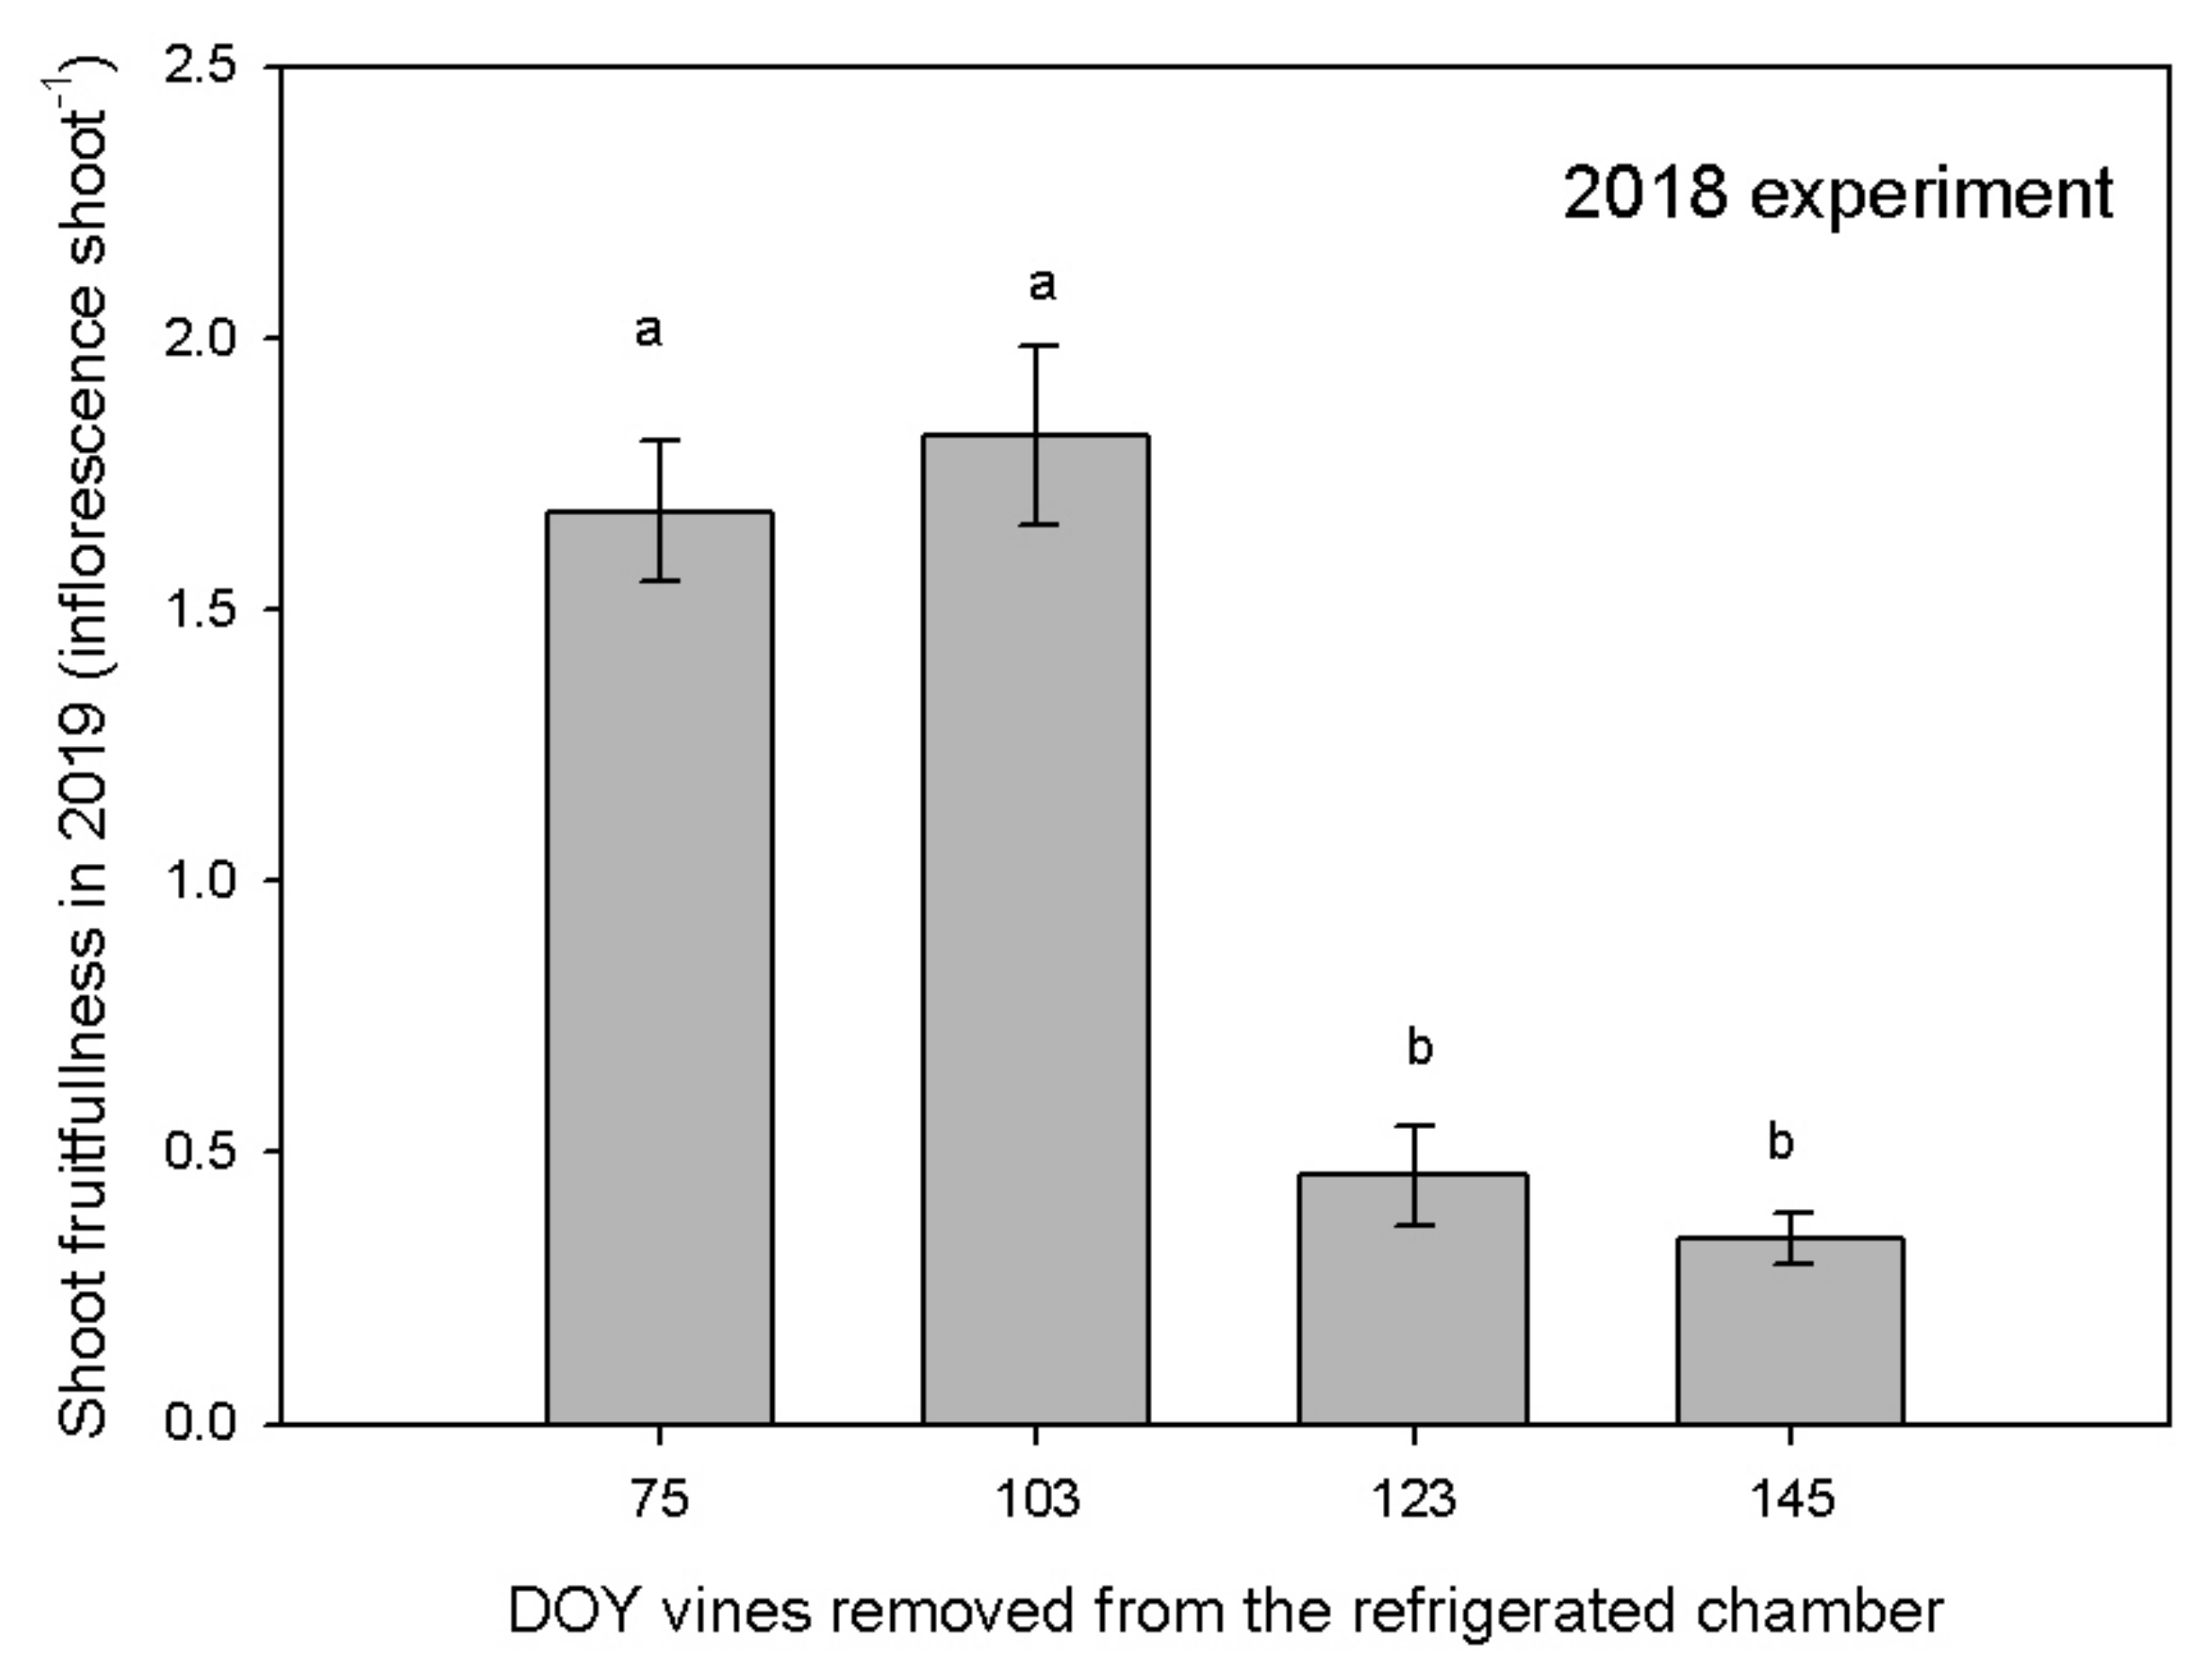
2.2. 2018 Experiment
2.3. Statistical Analysis
3. Results
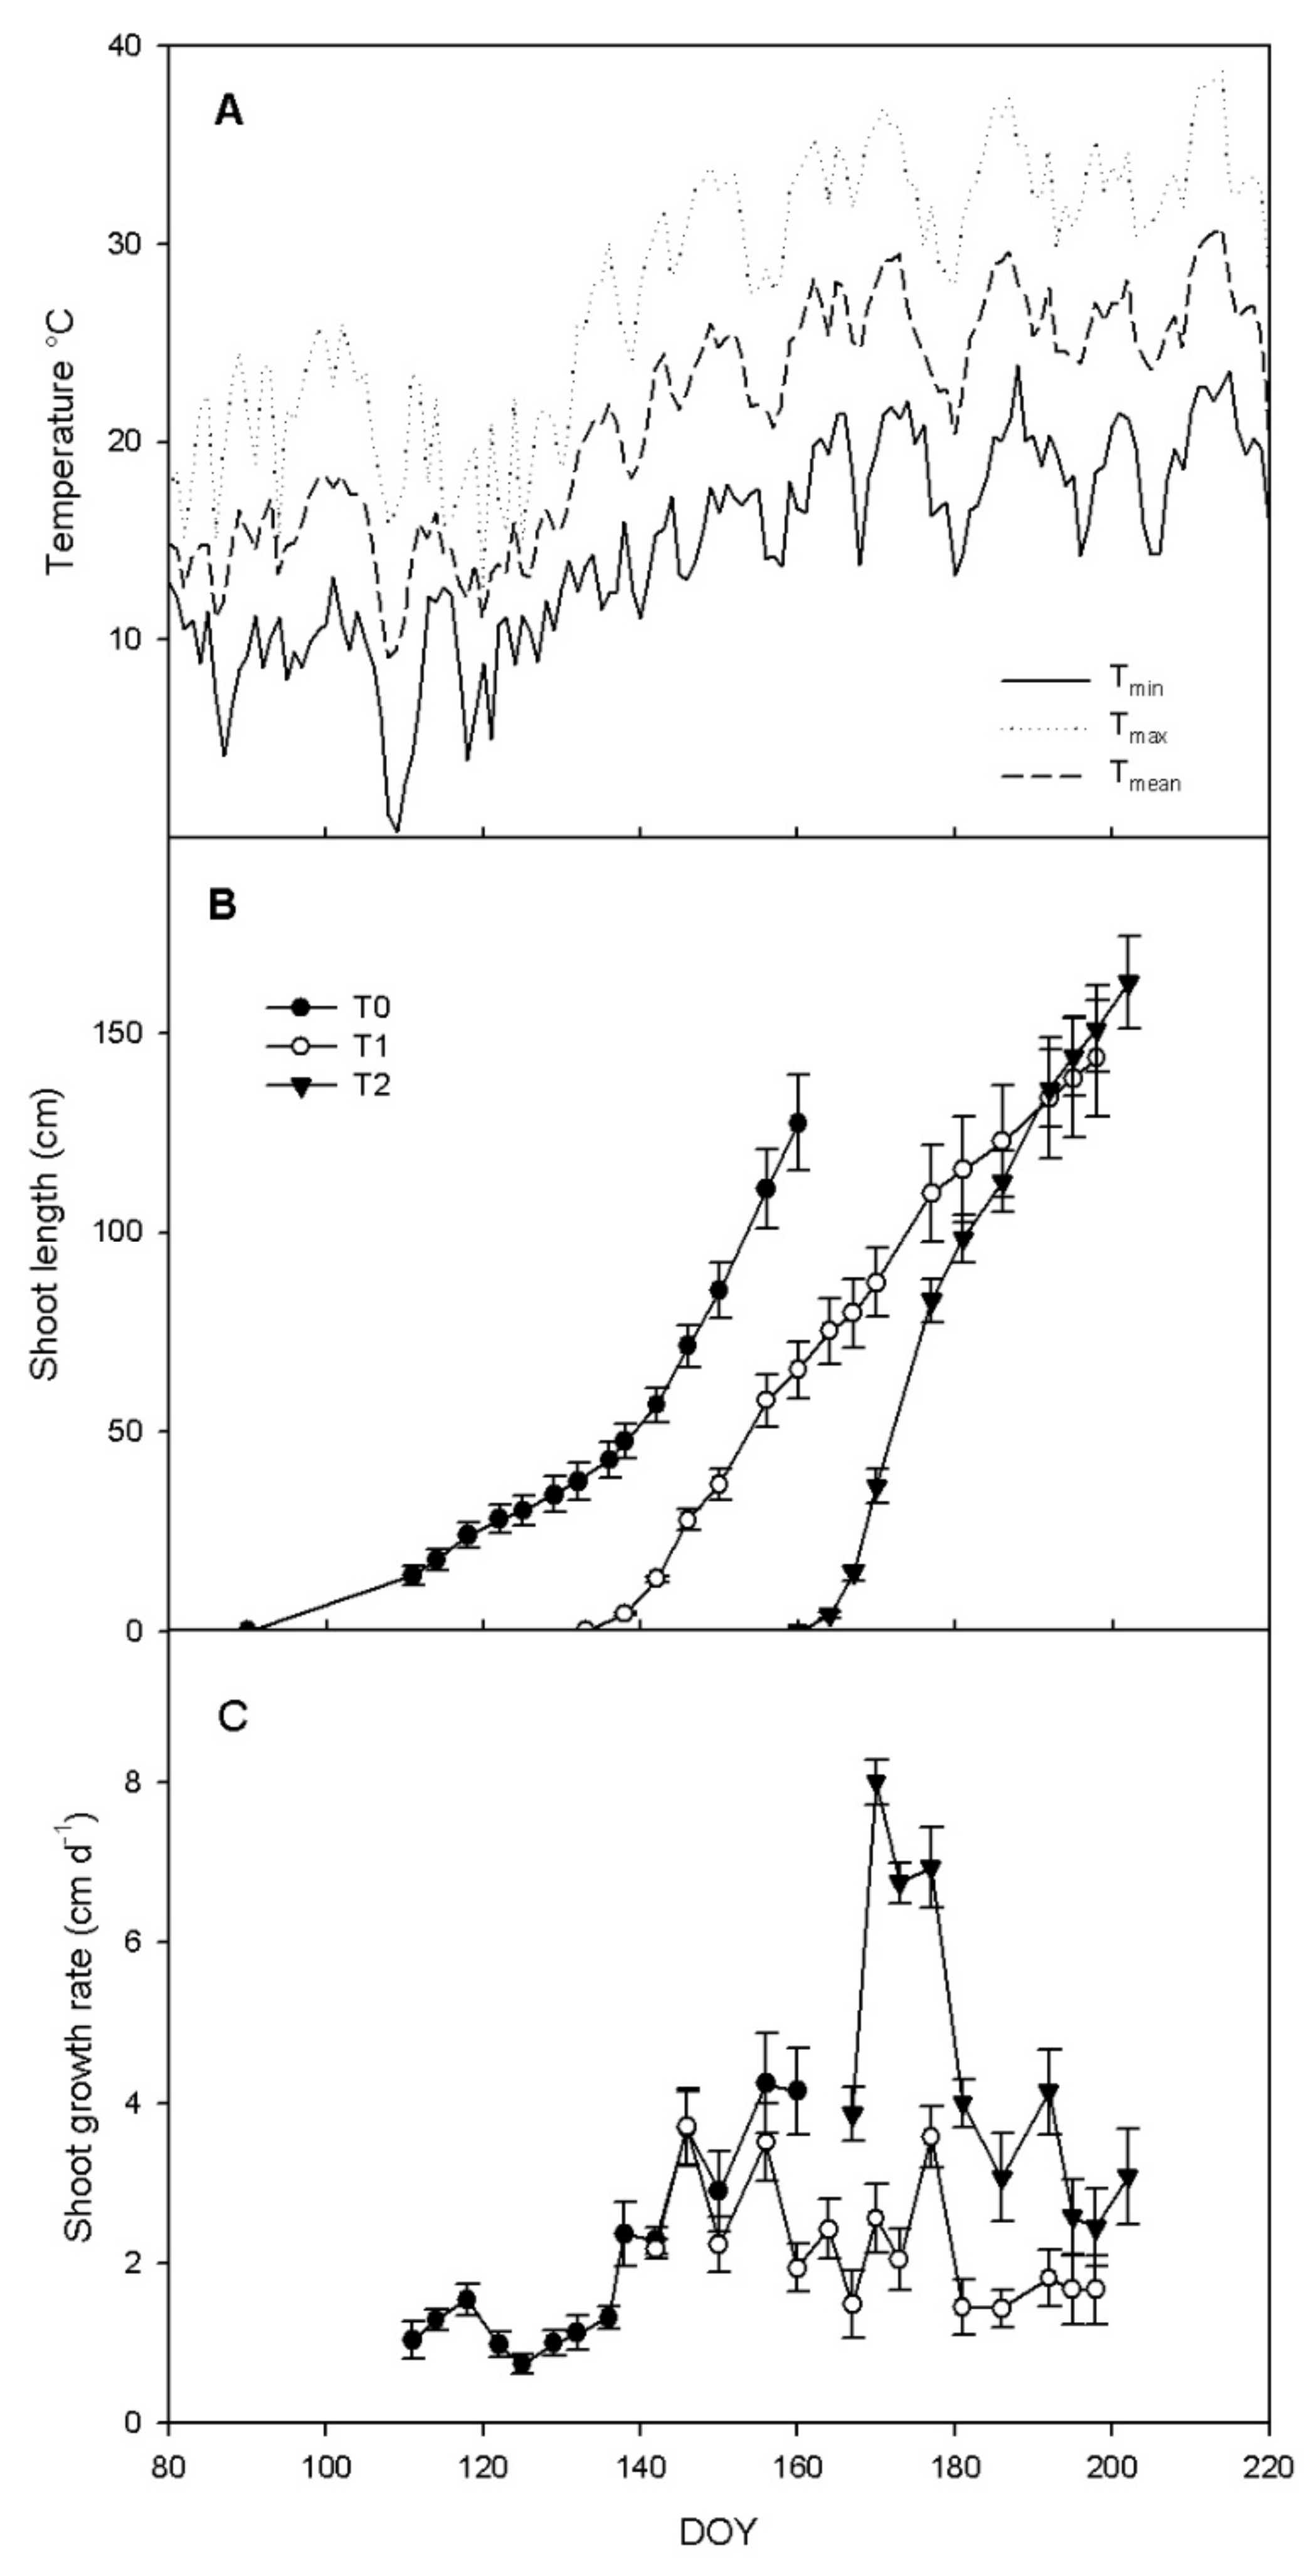
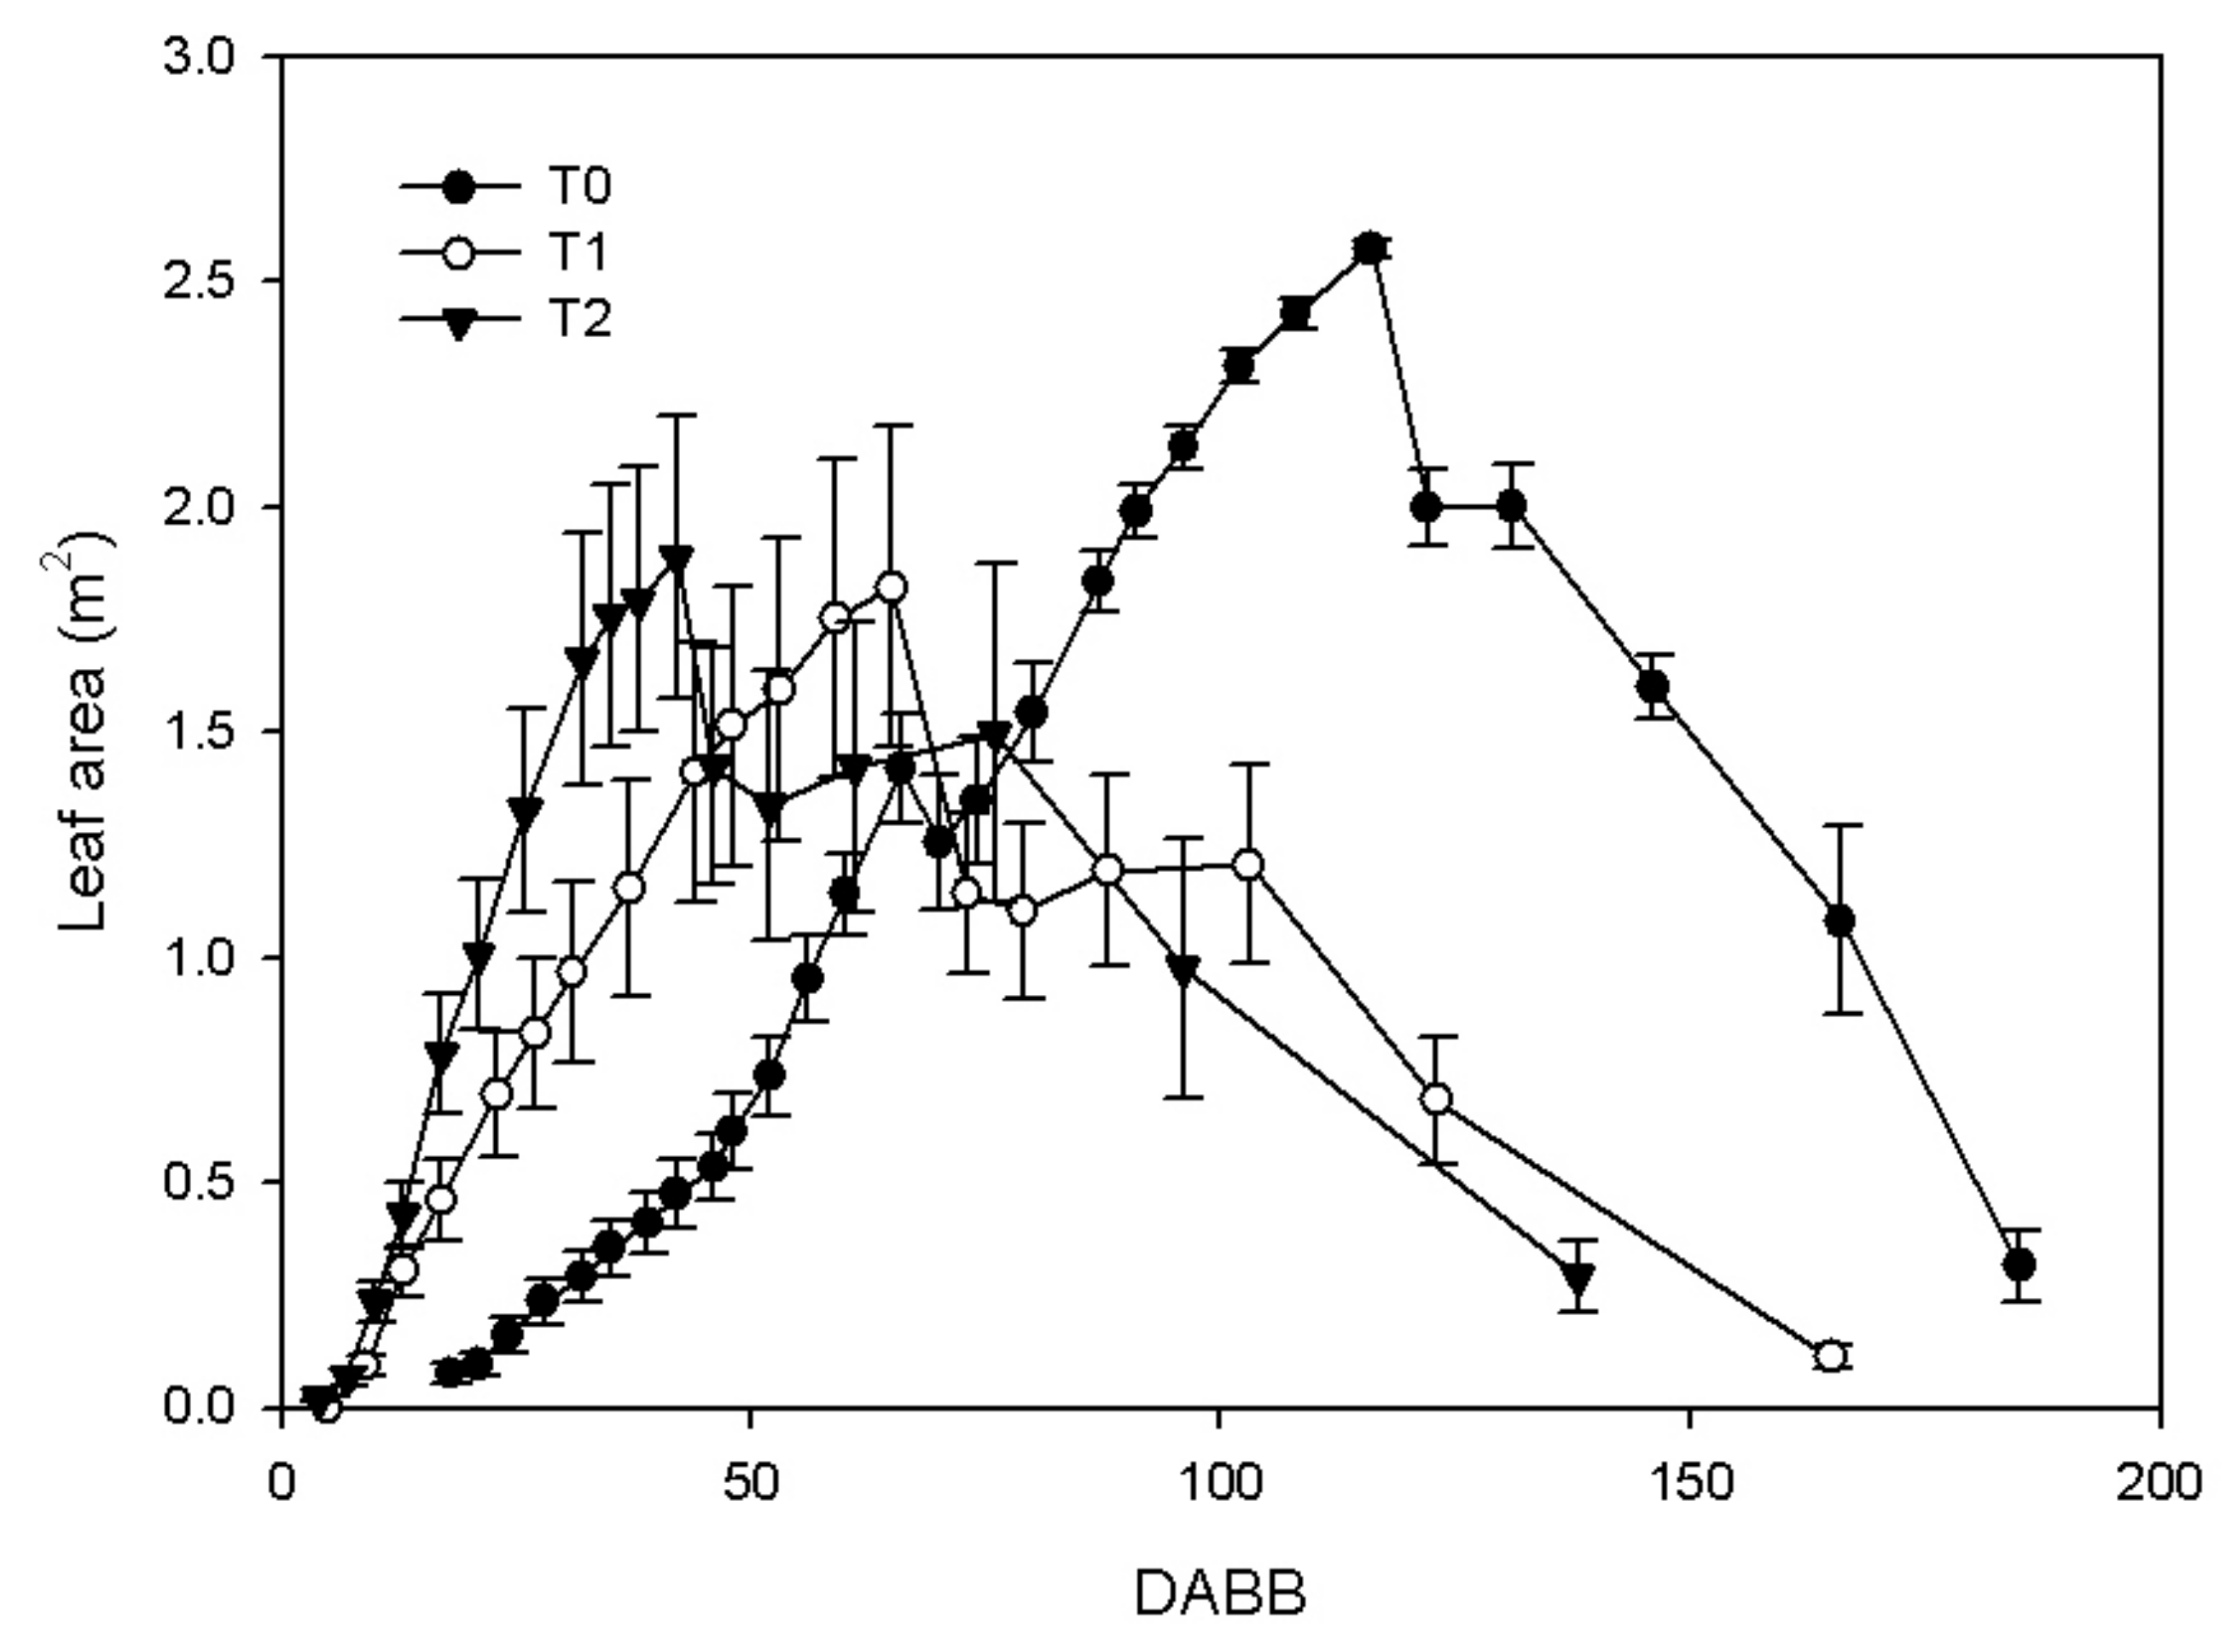
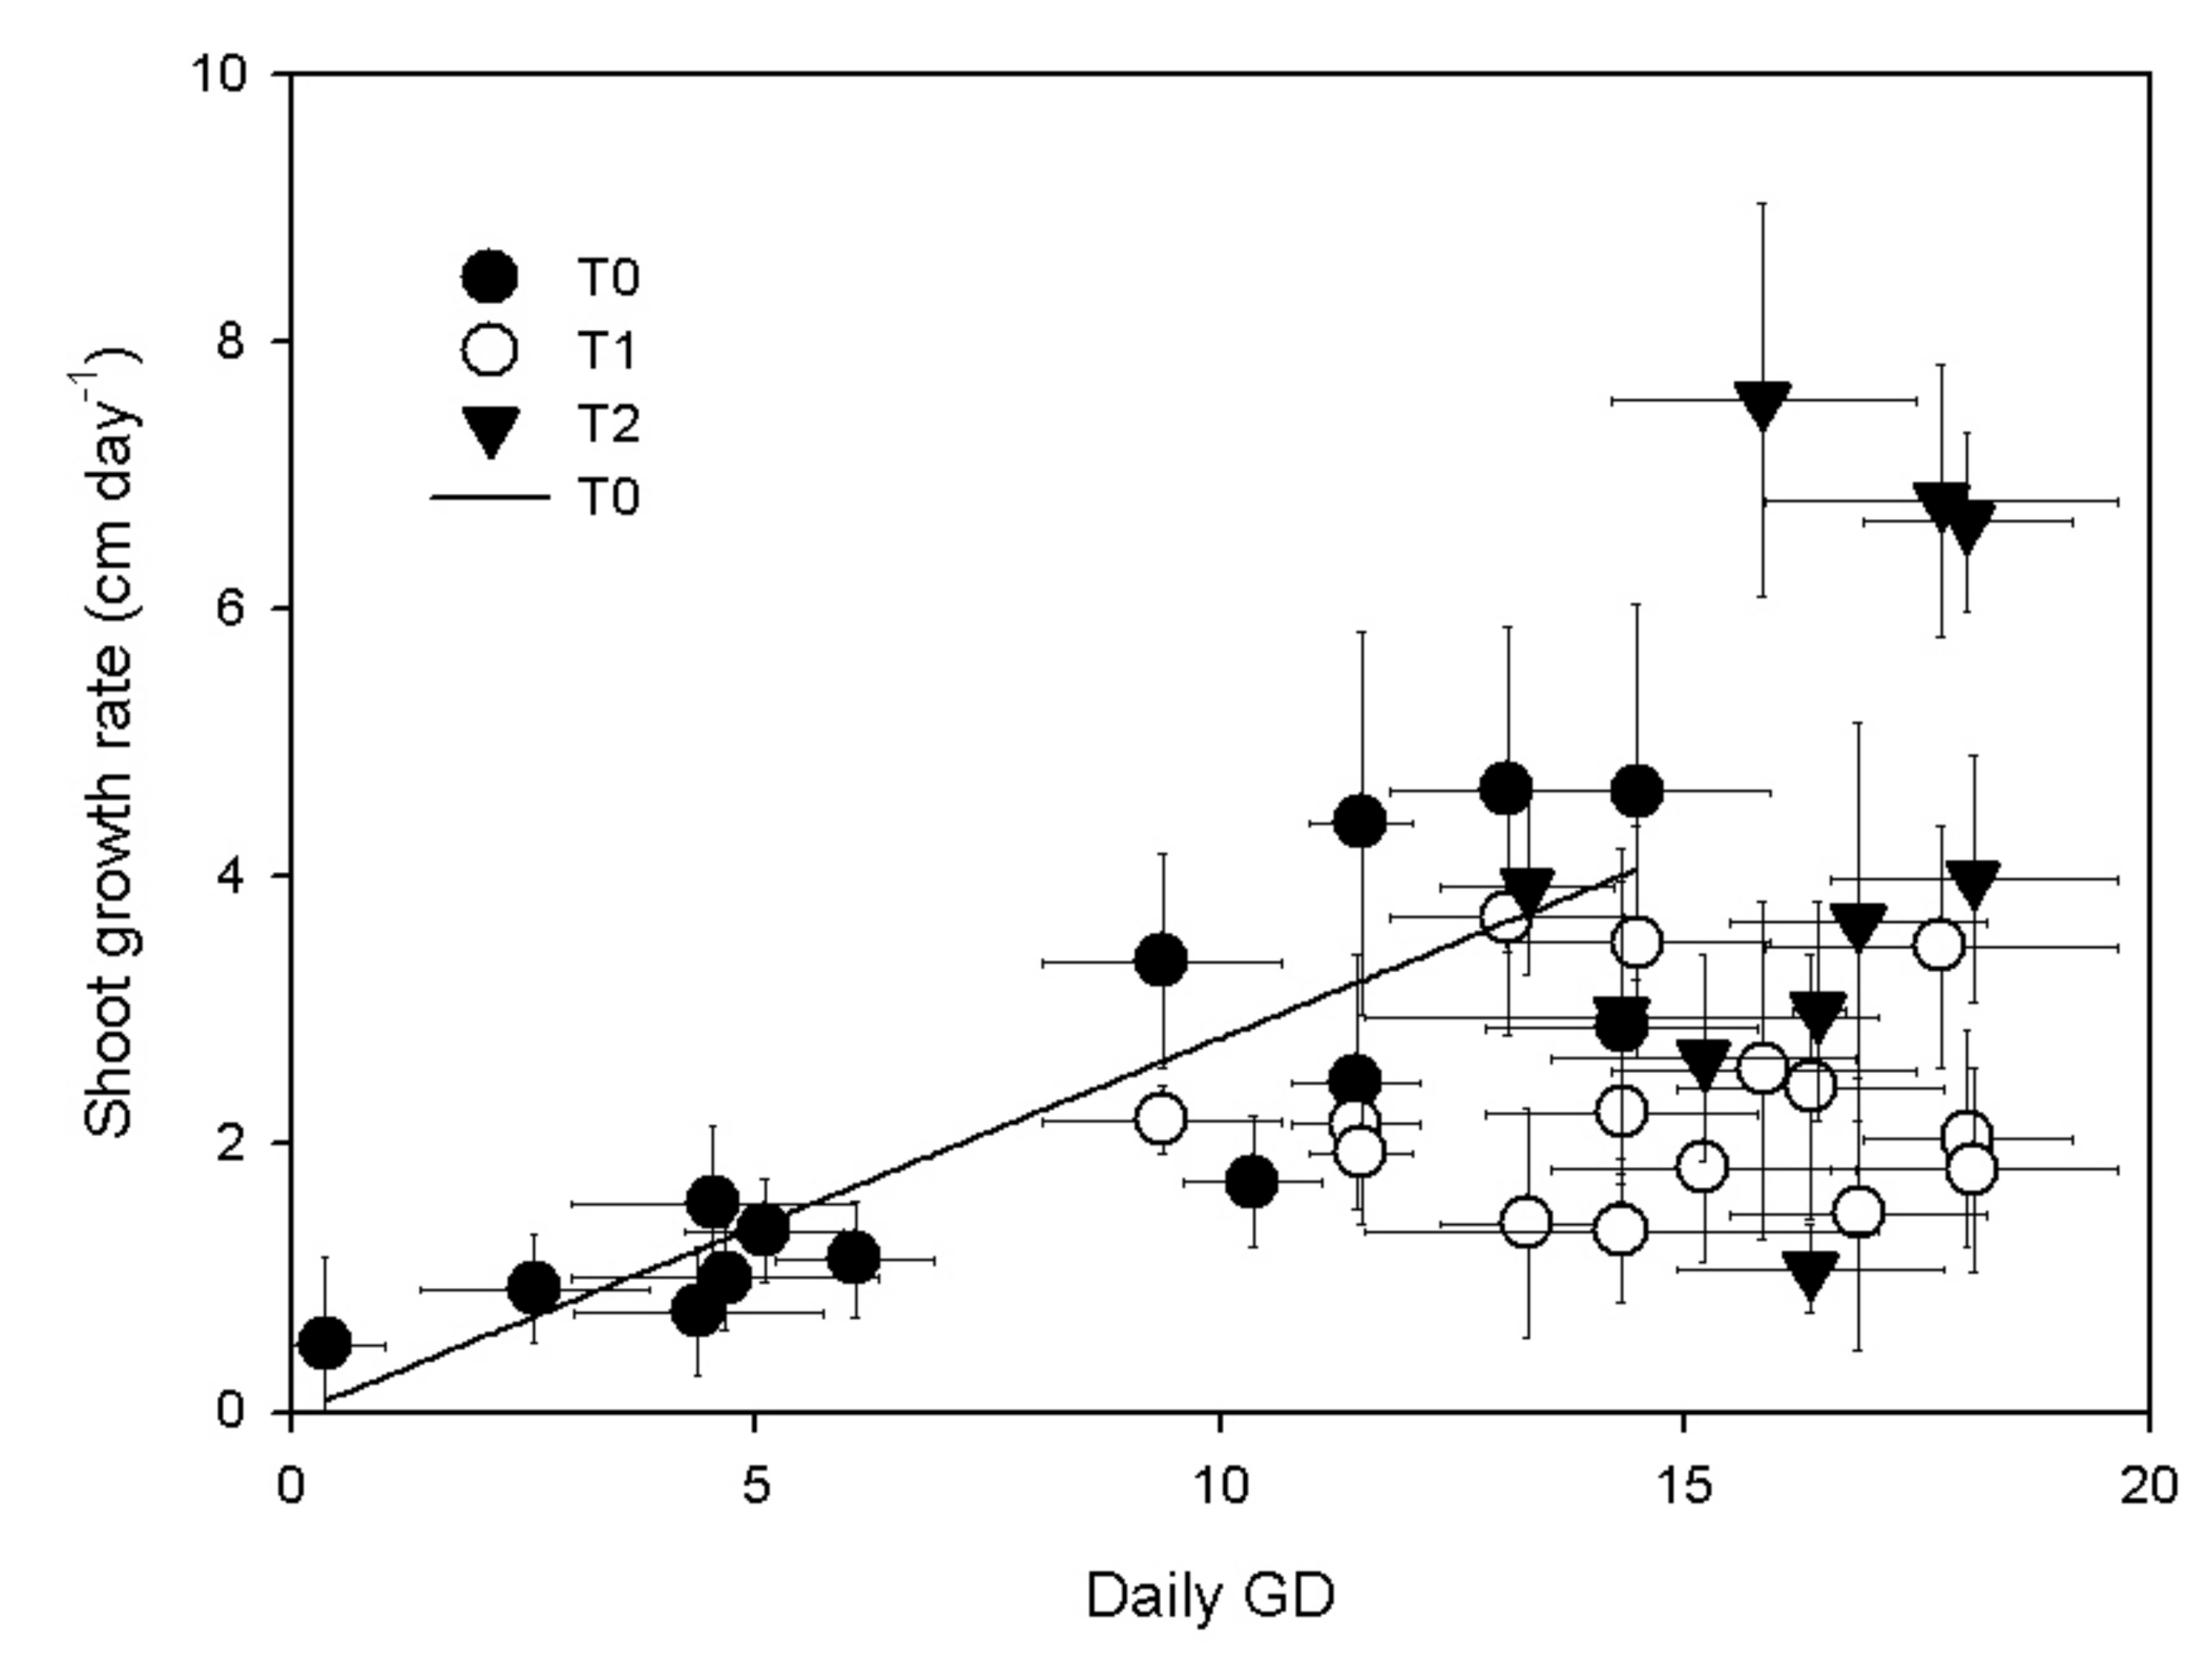
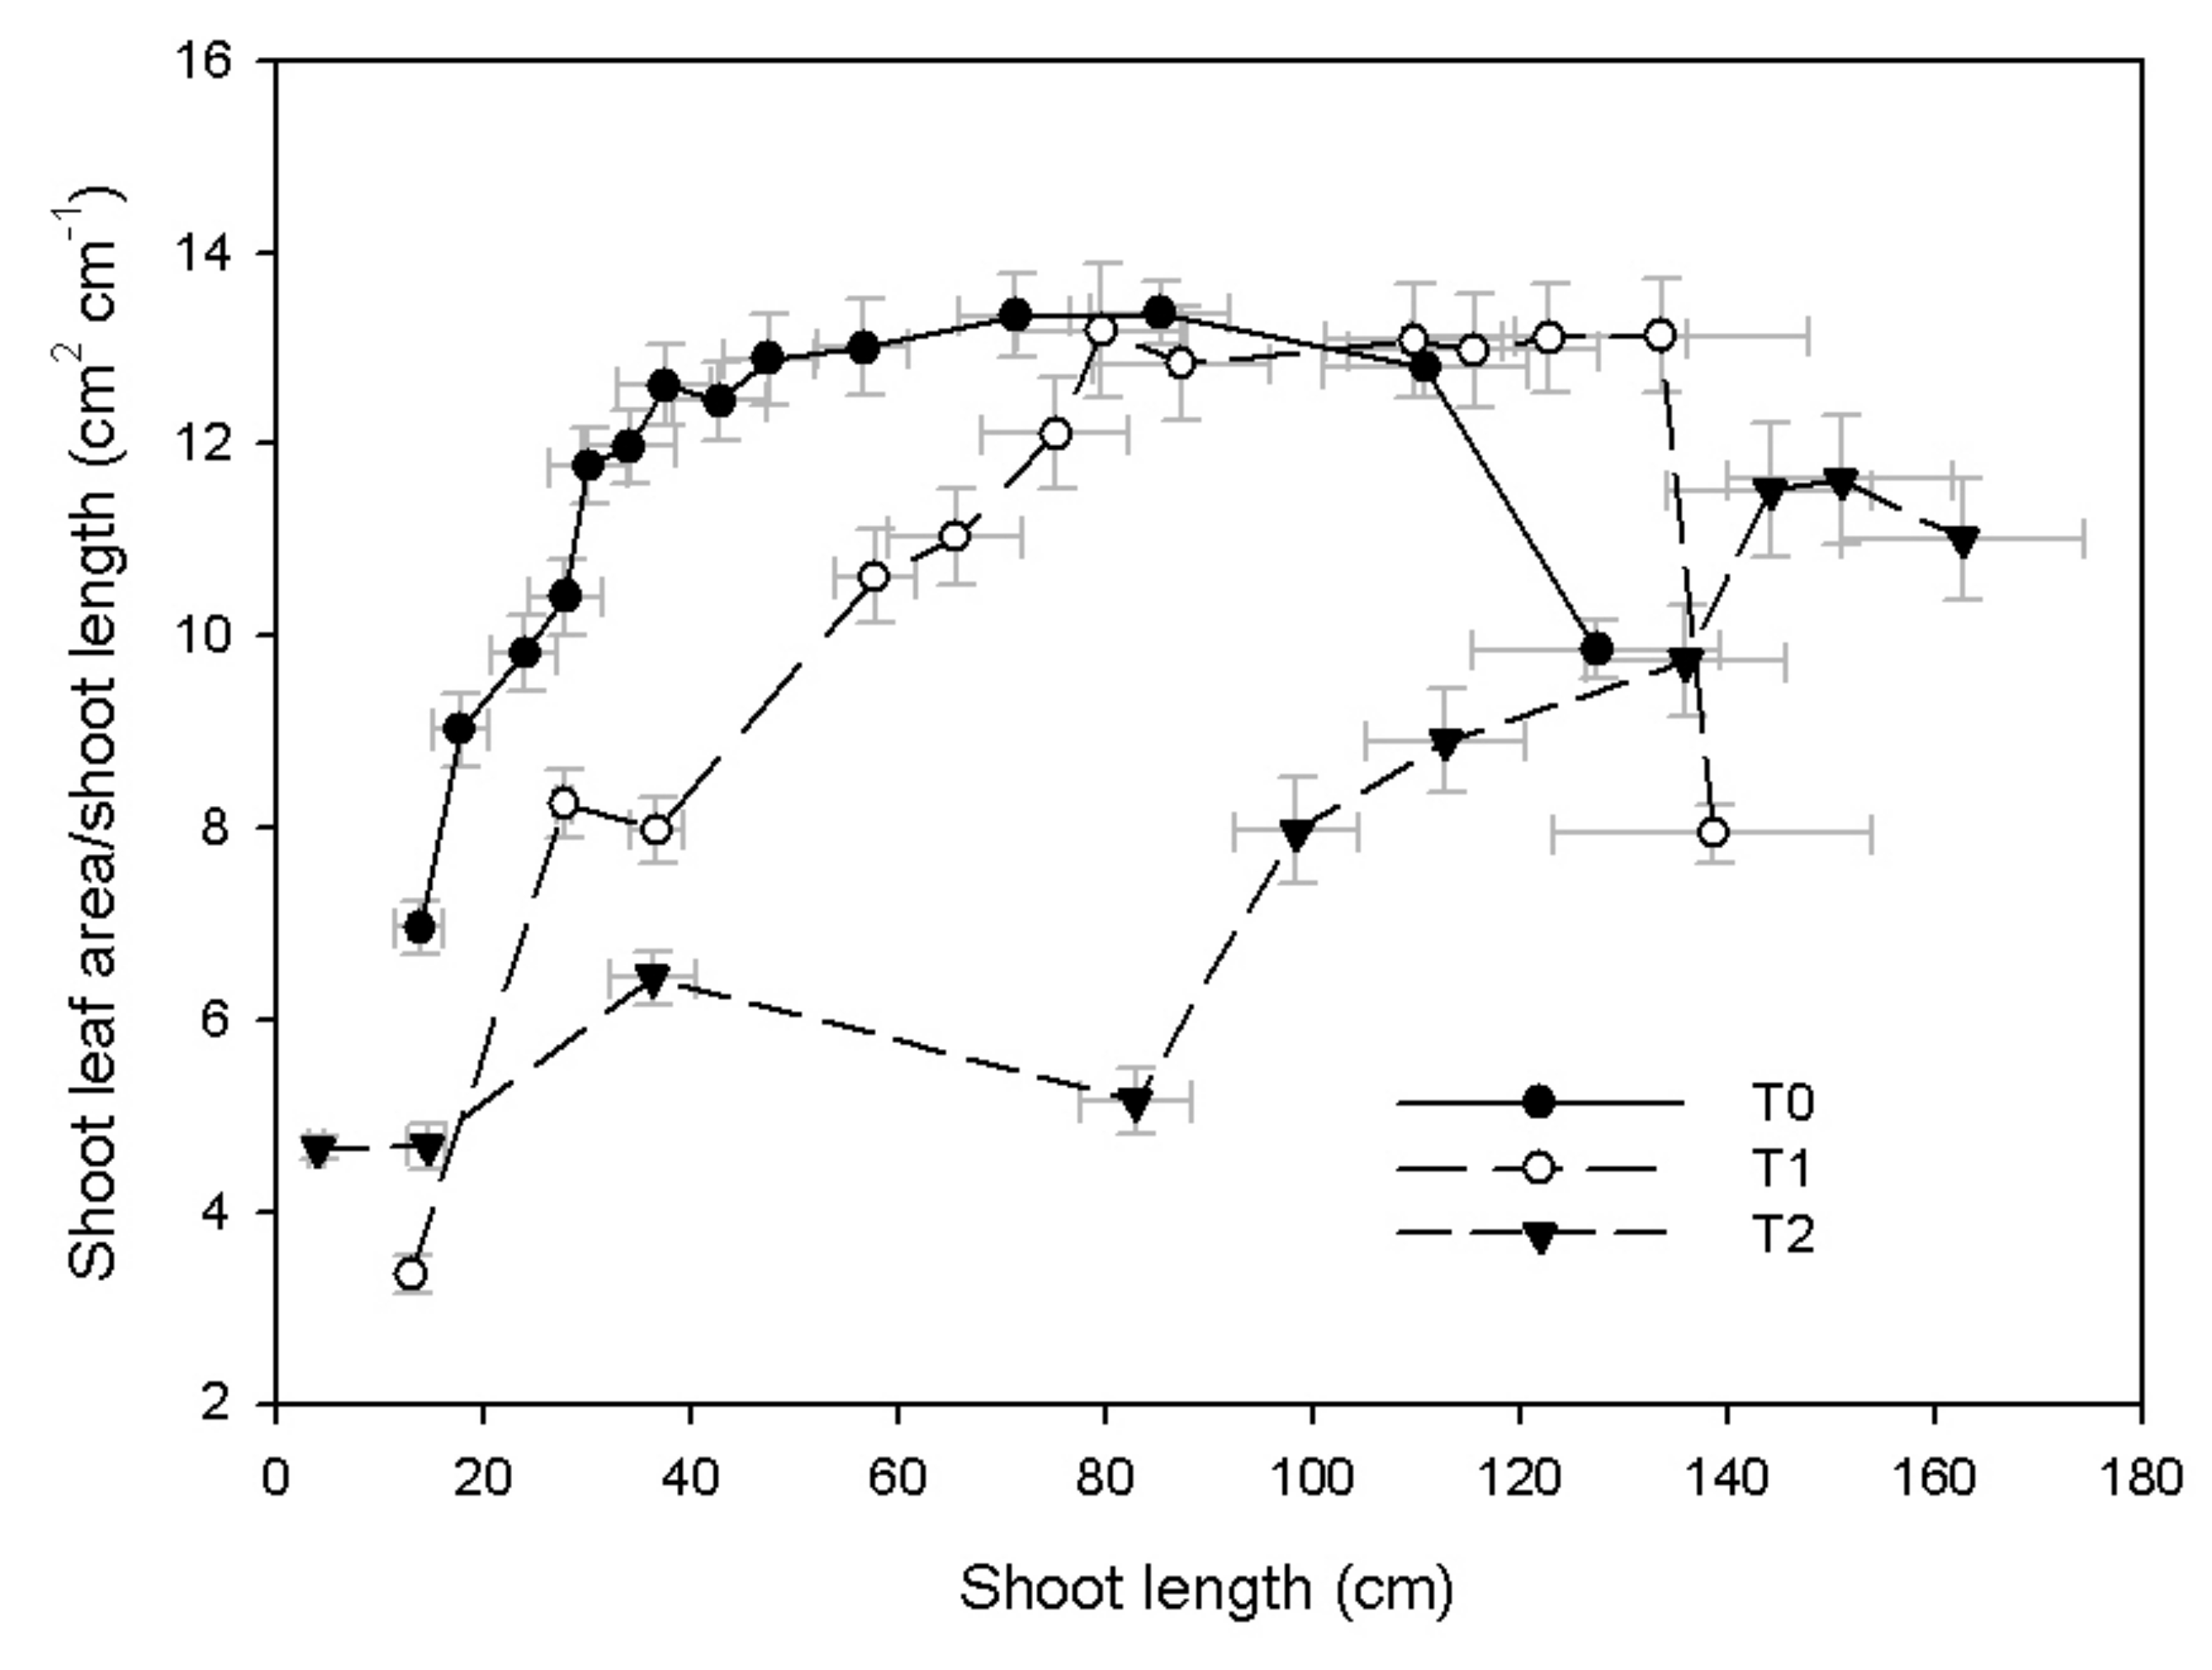
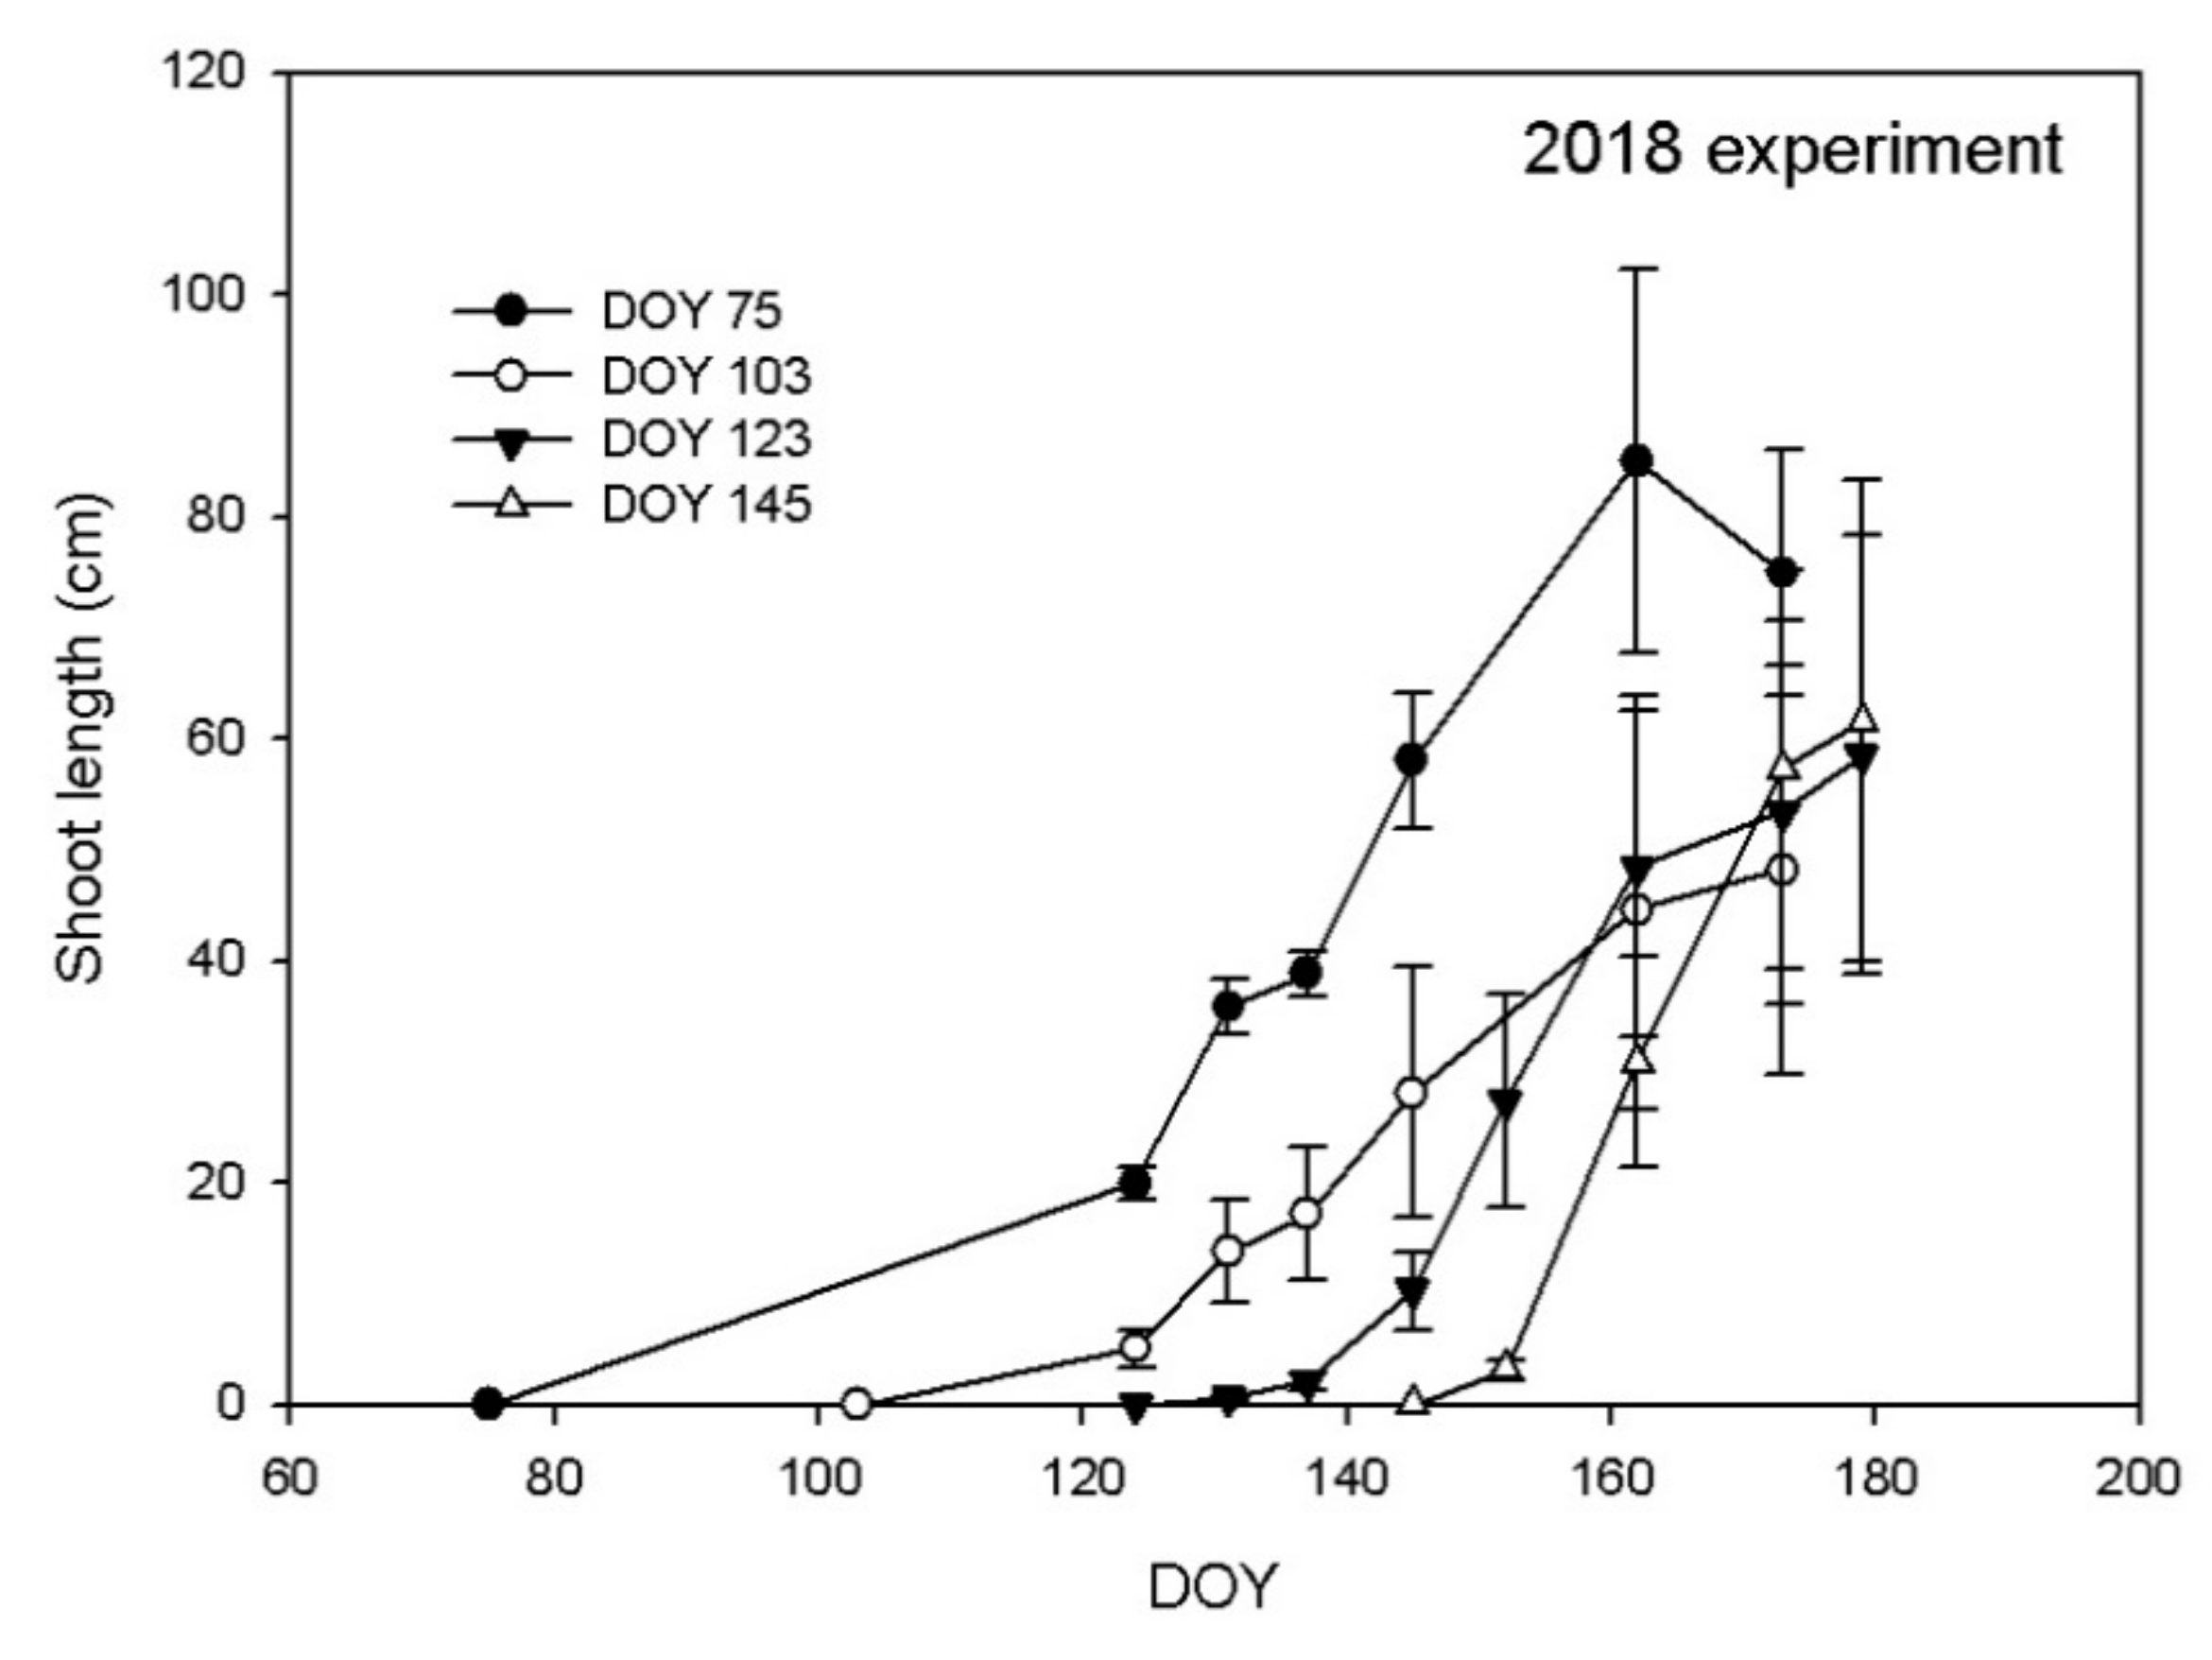
3.1. Shoot Growth
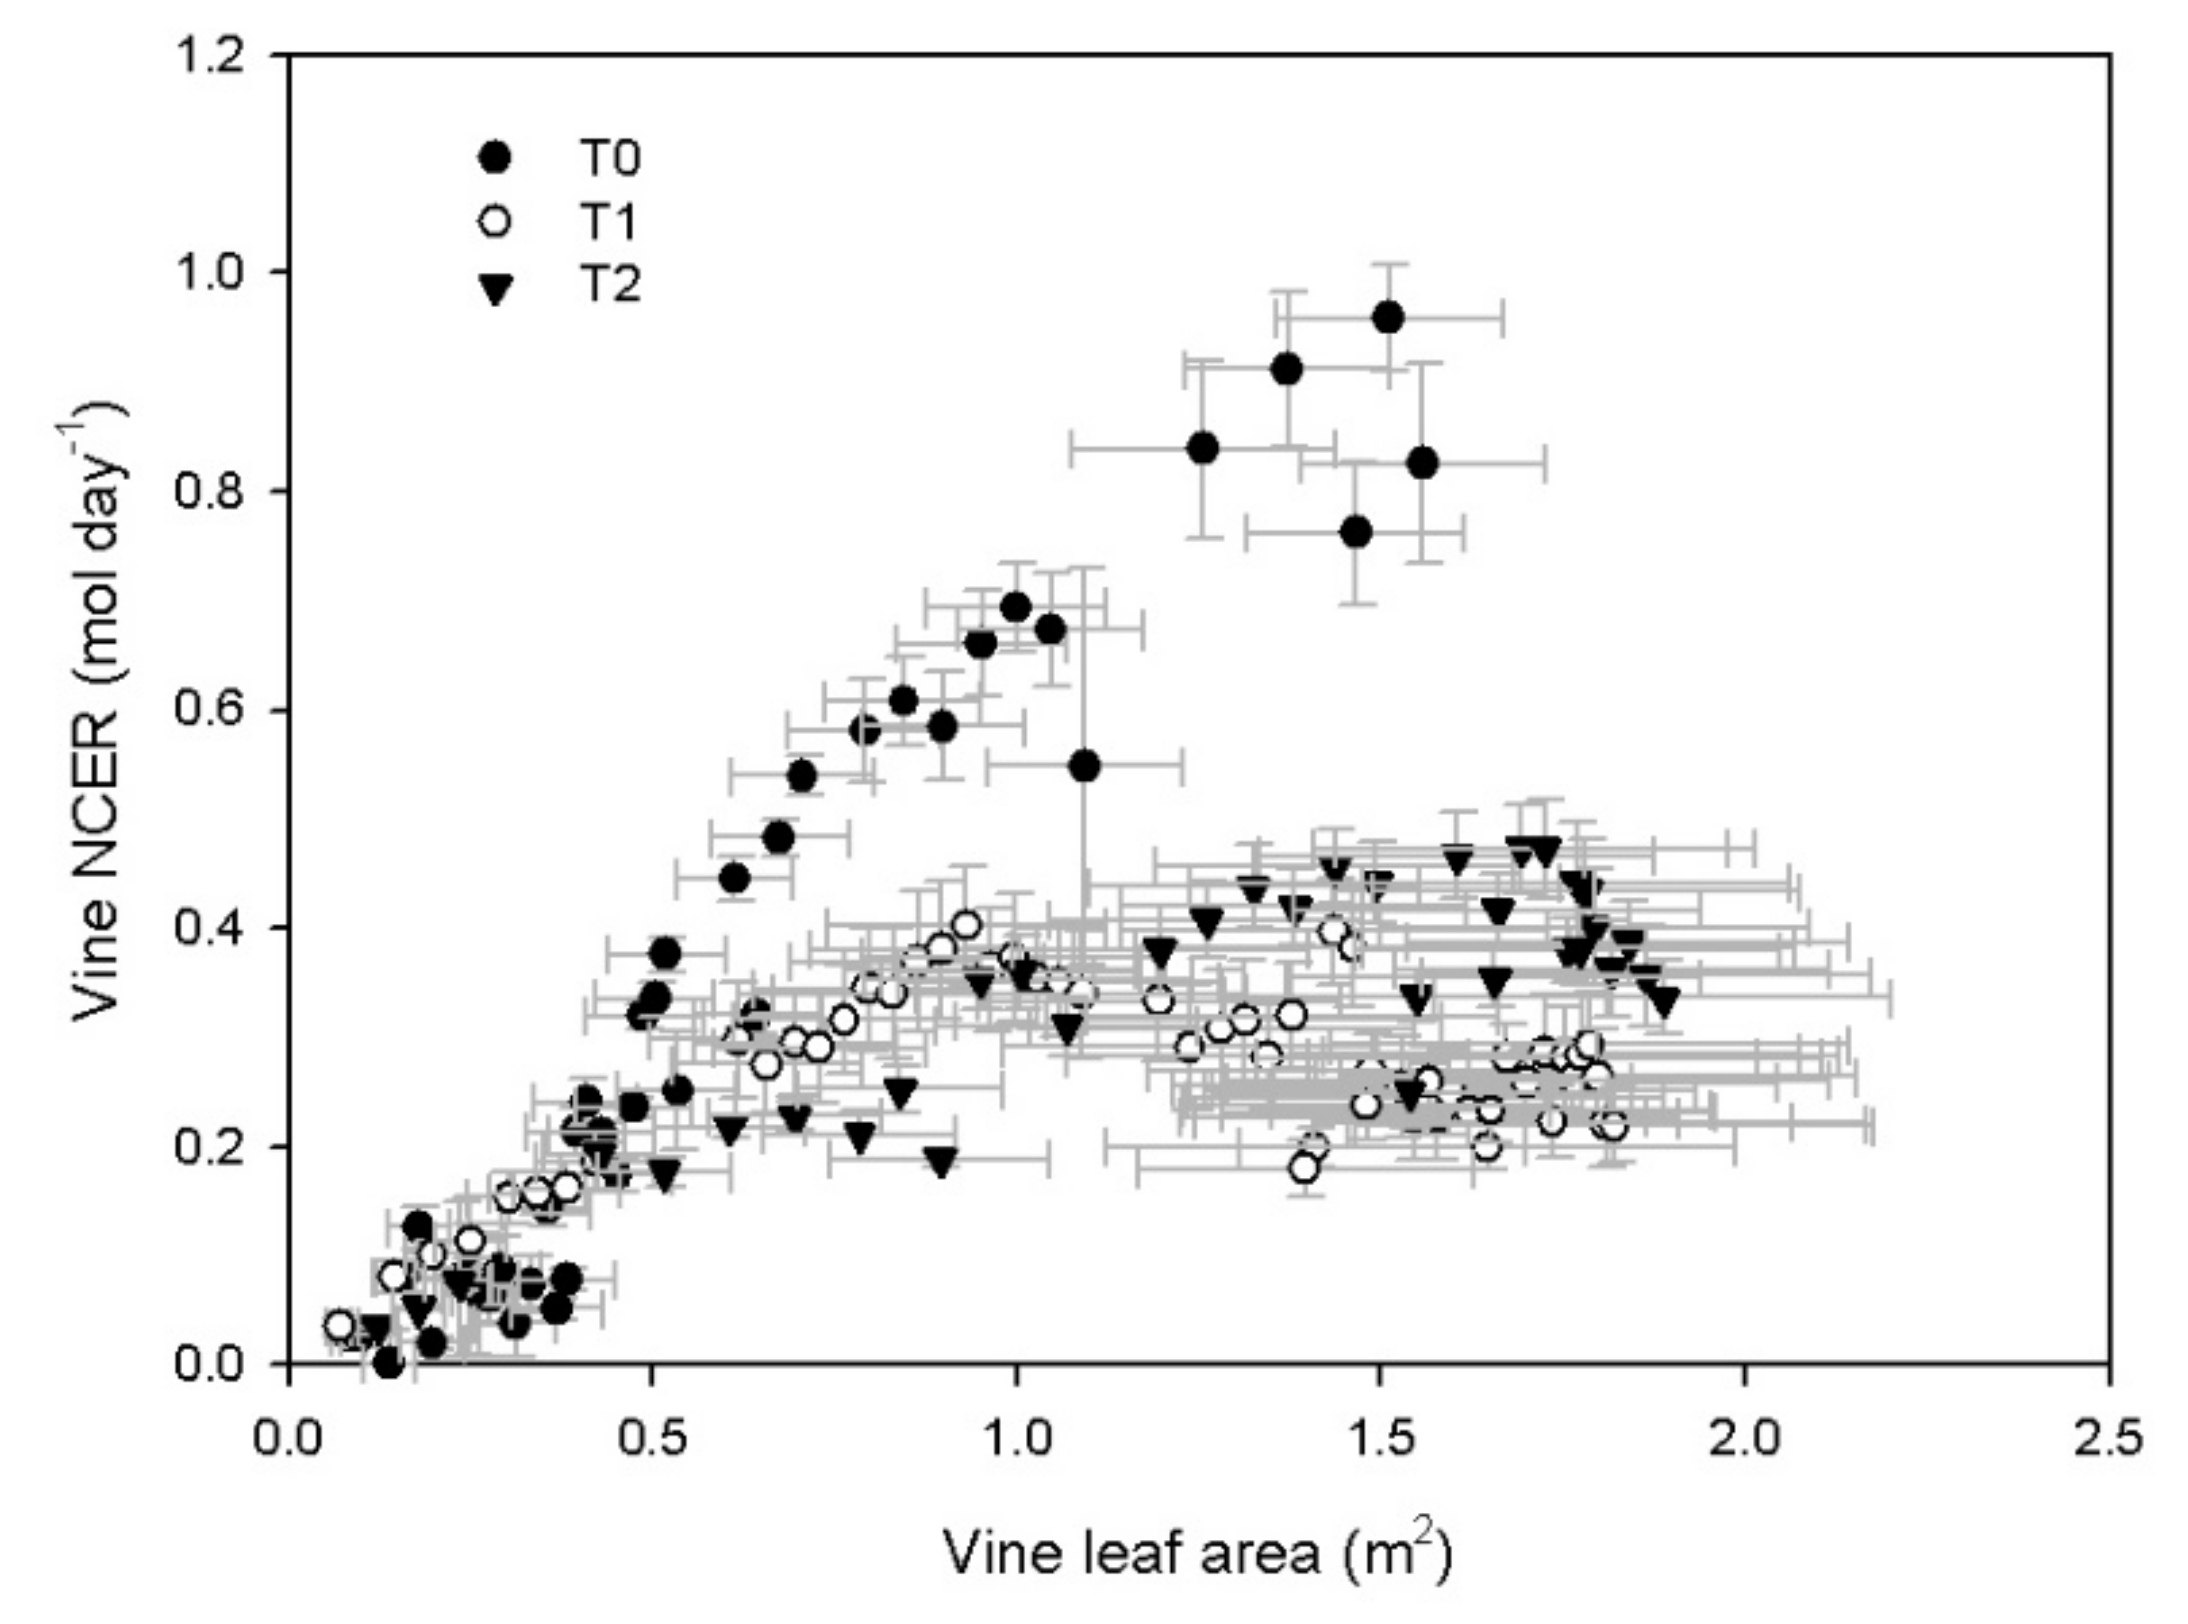
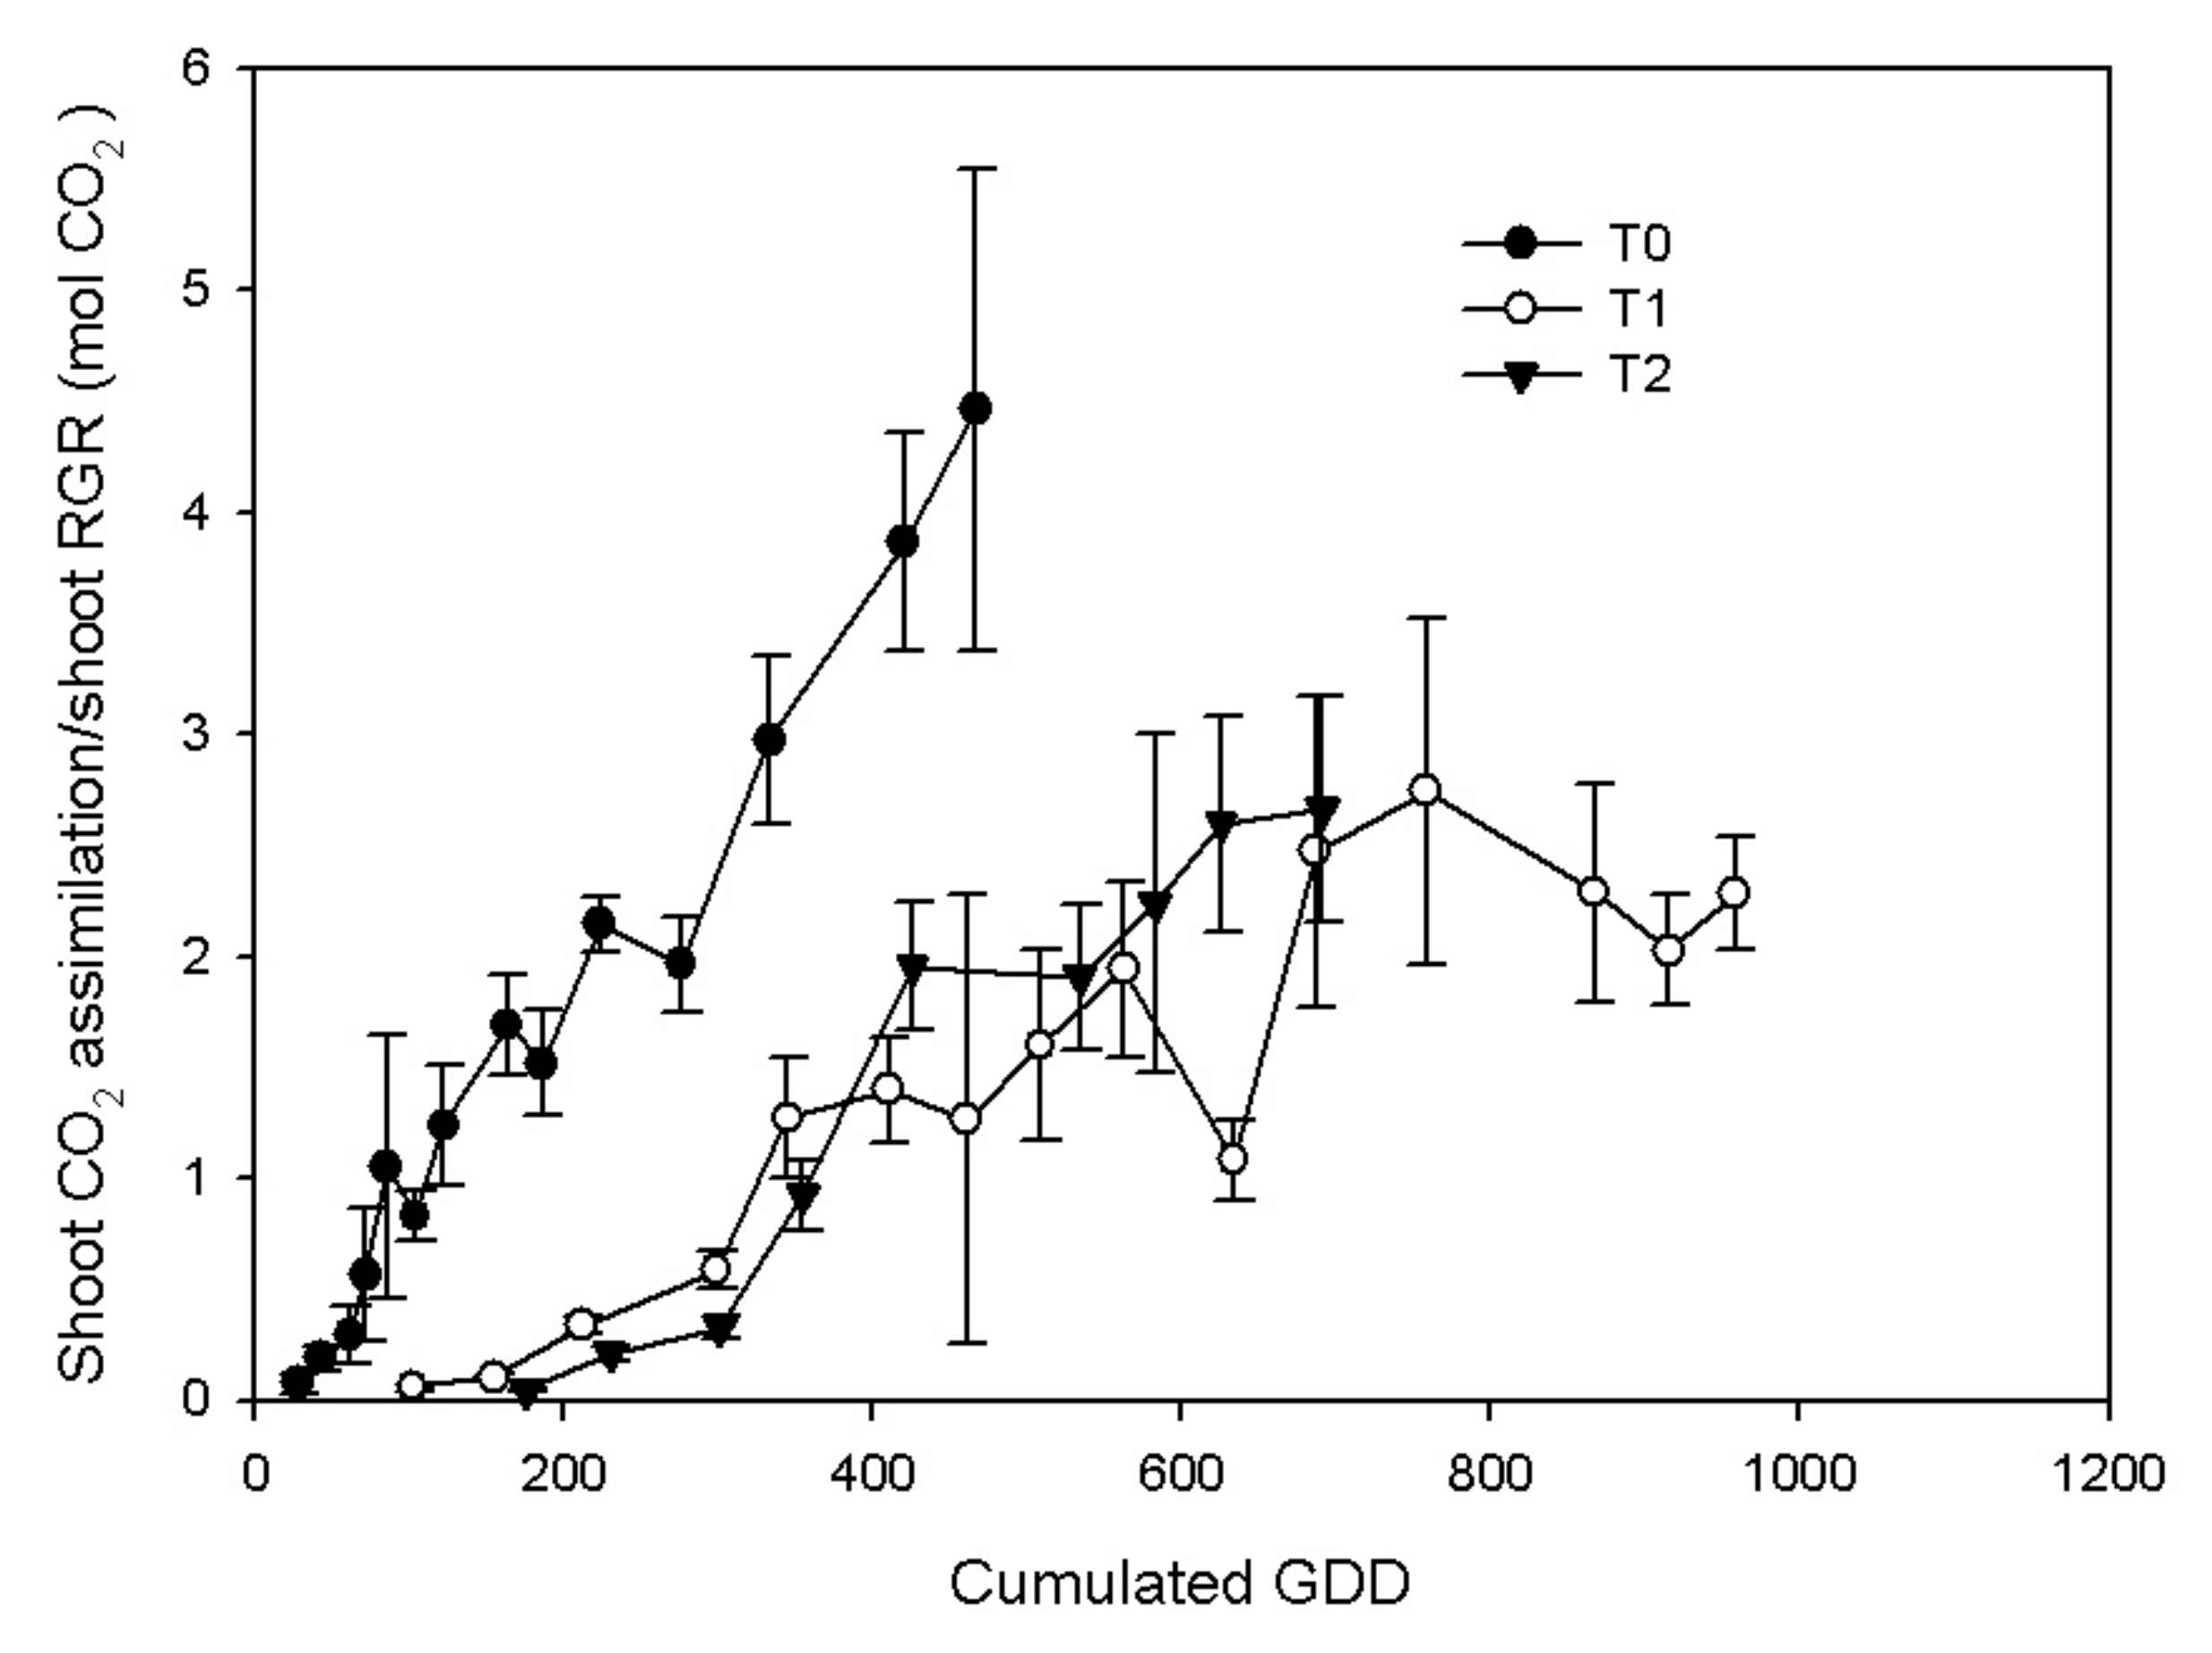
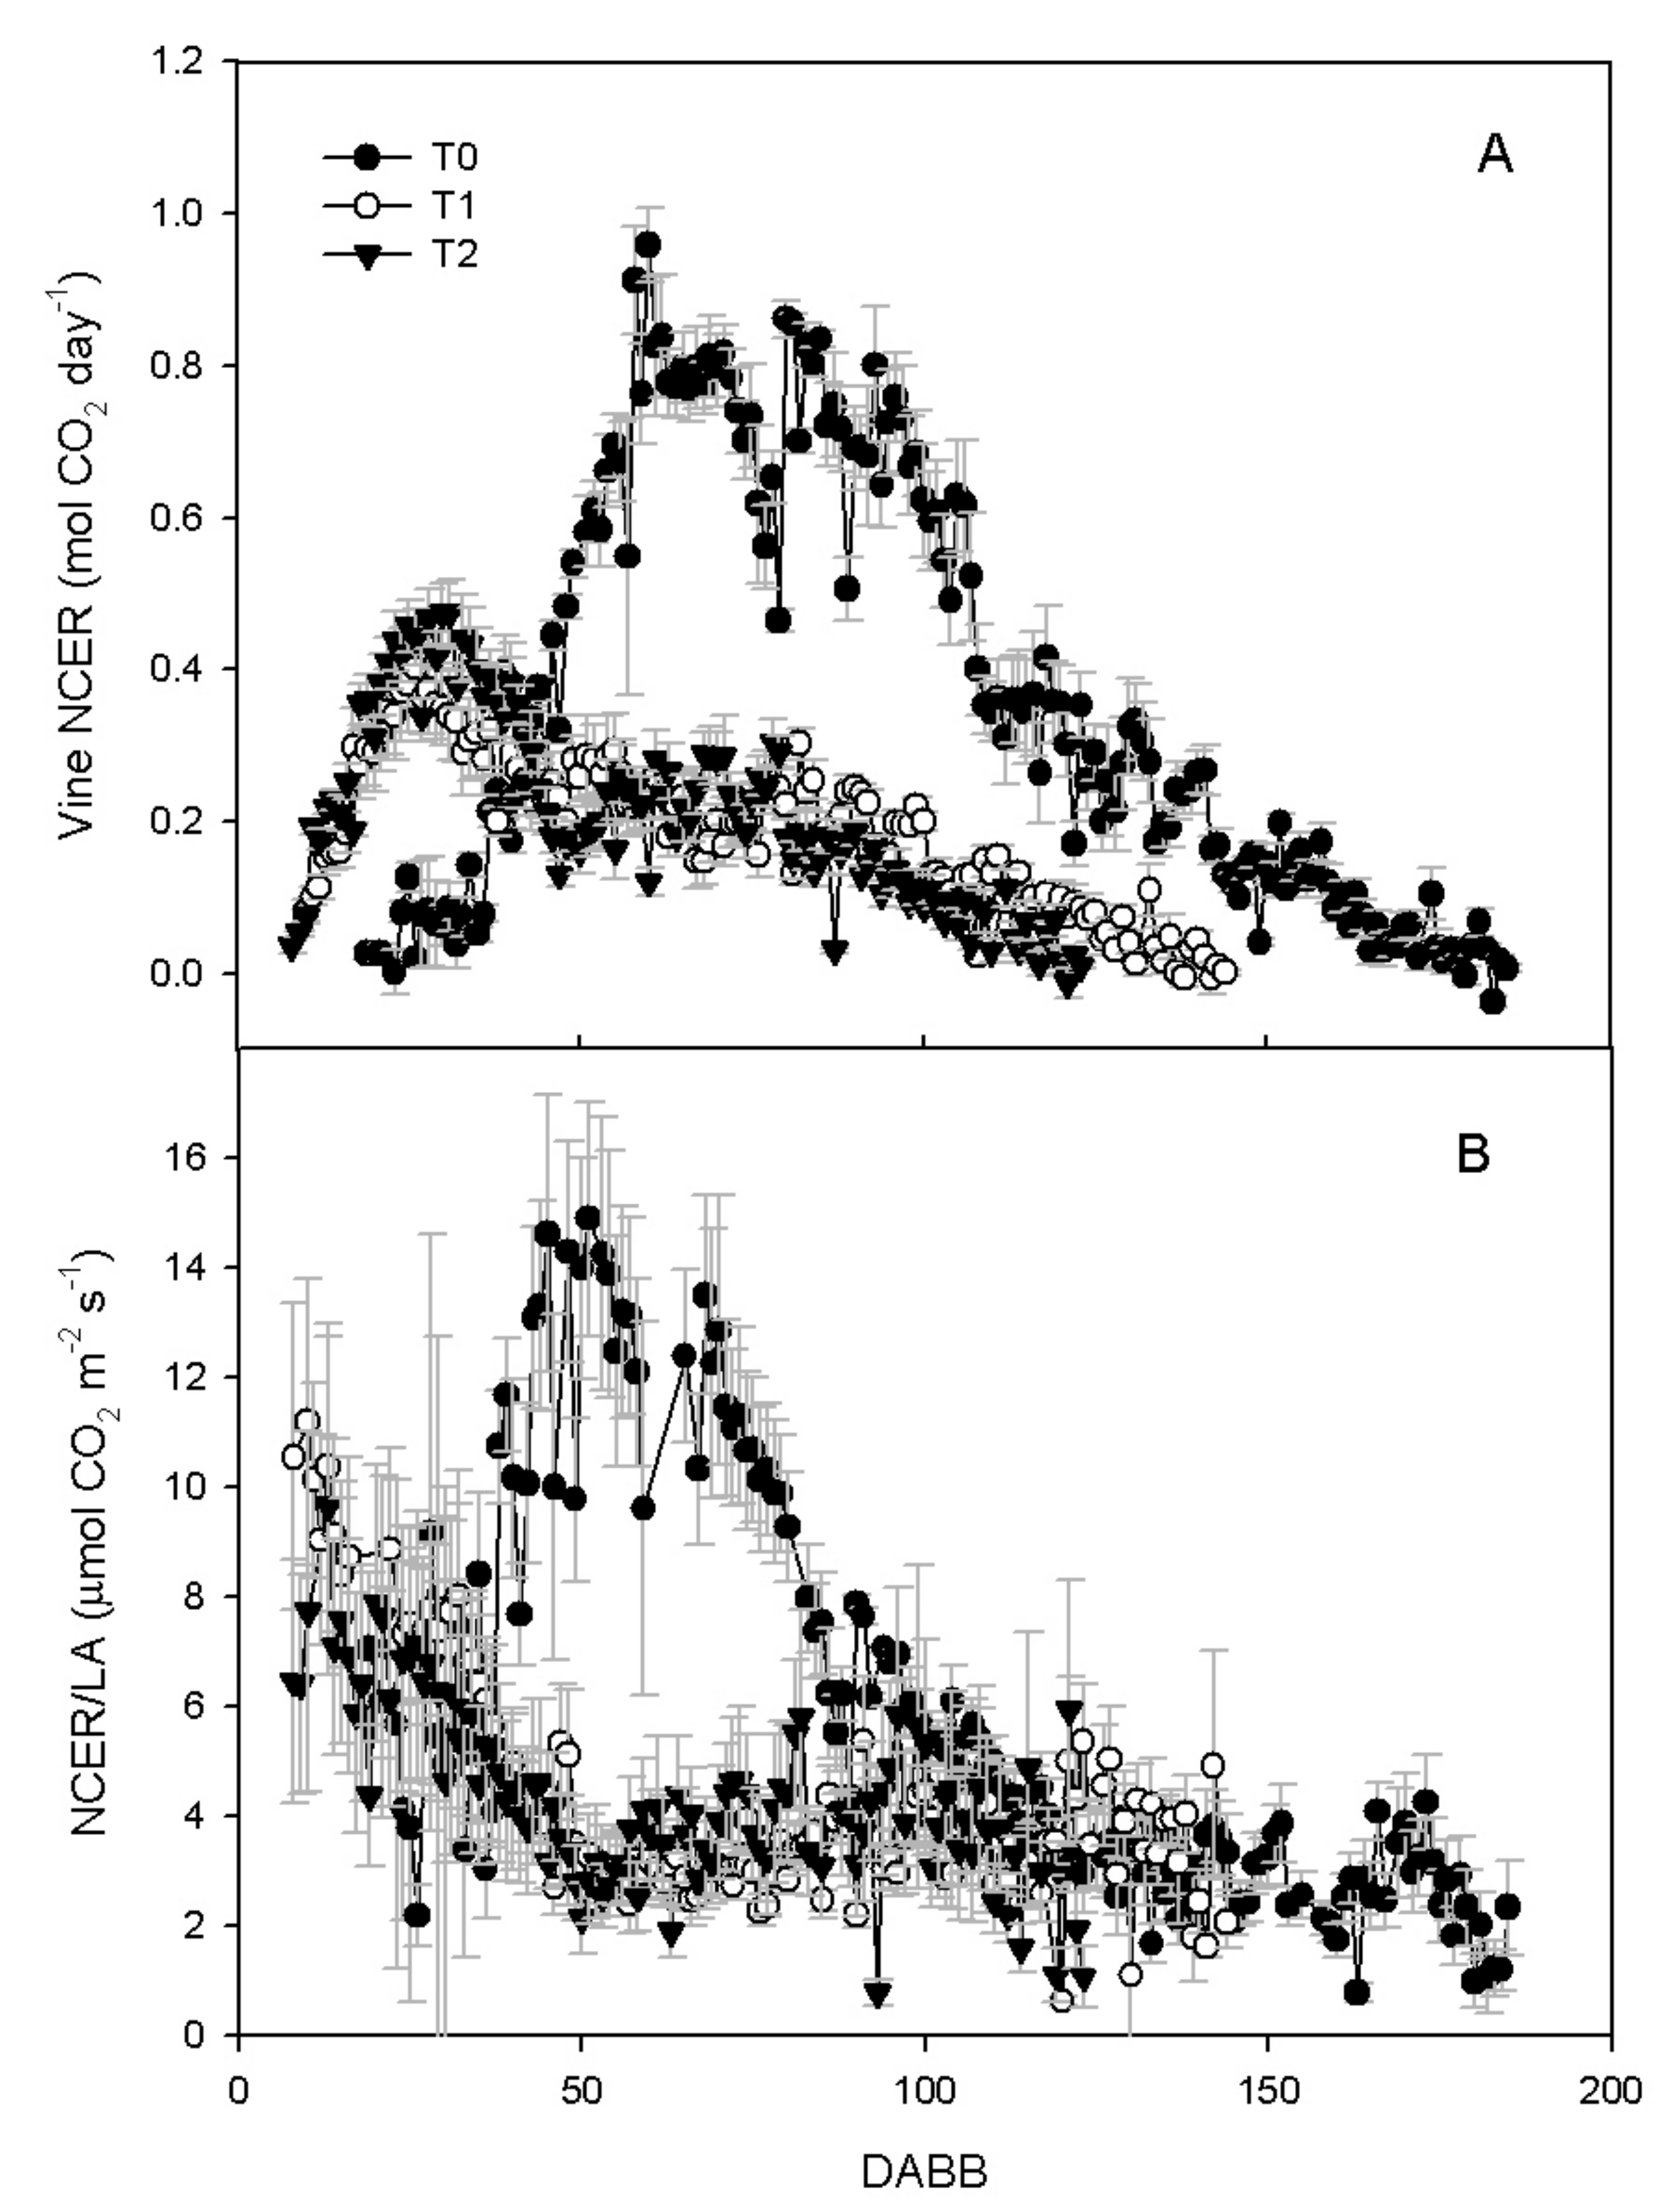
3.2. Vine Gas Exchange
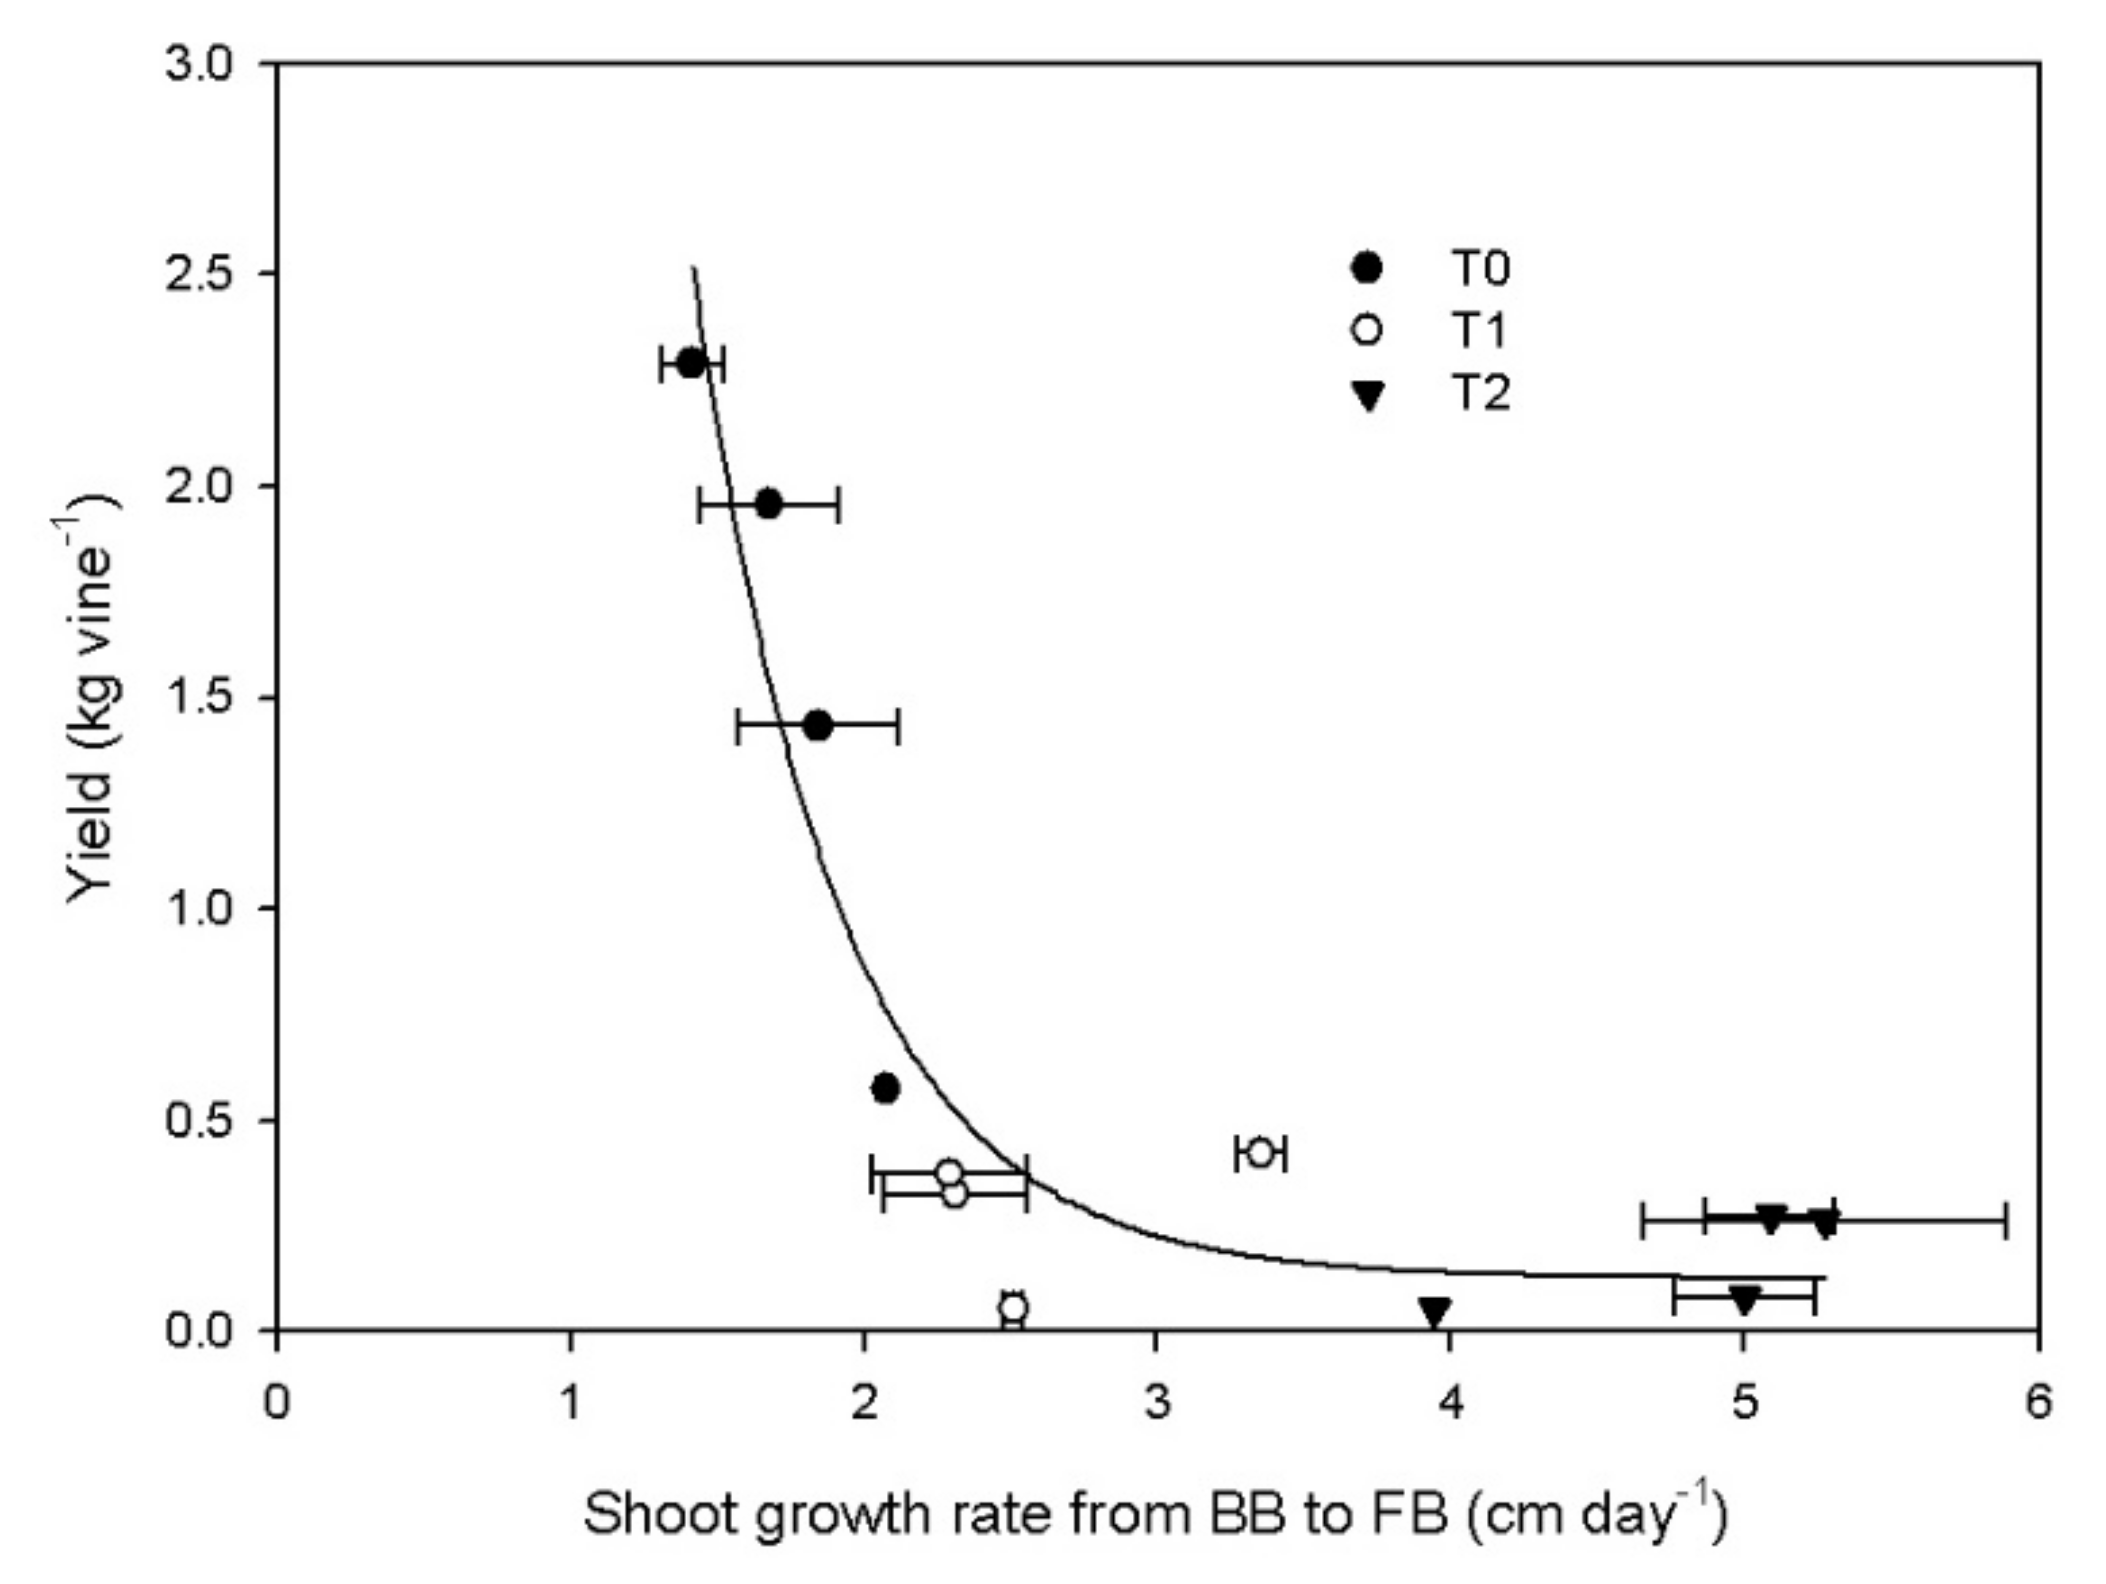
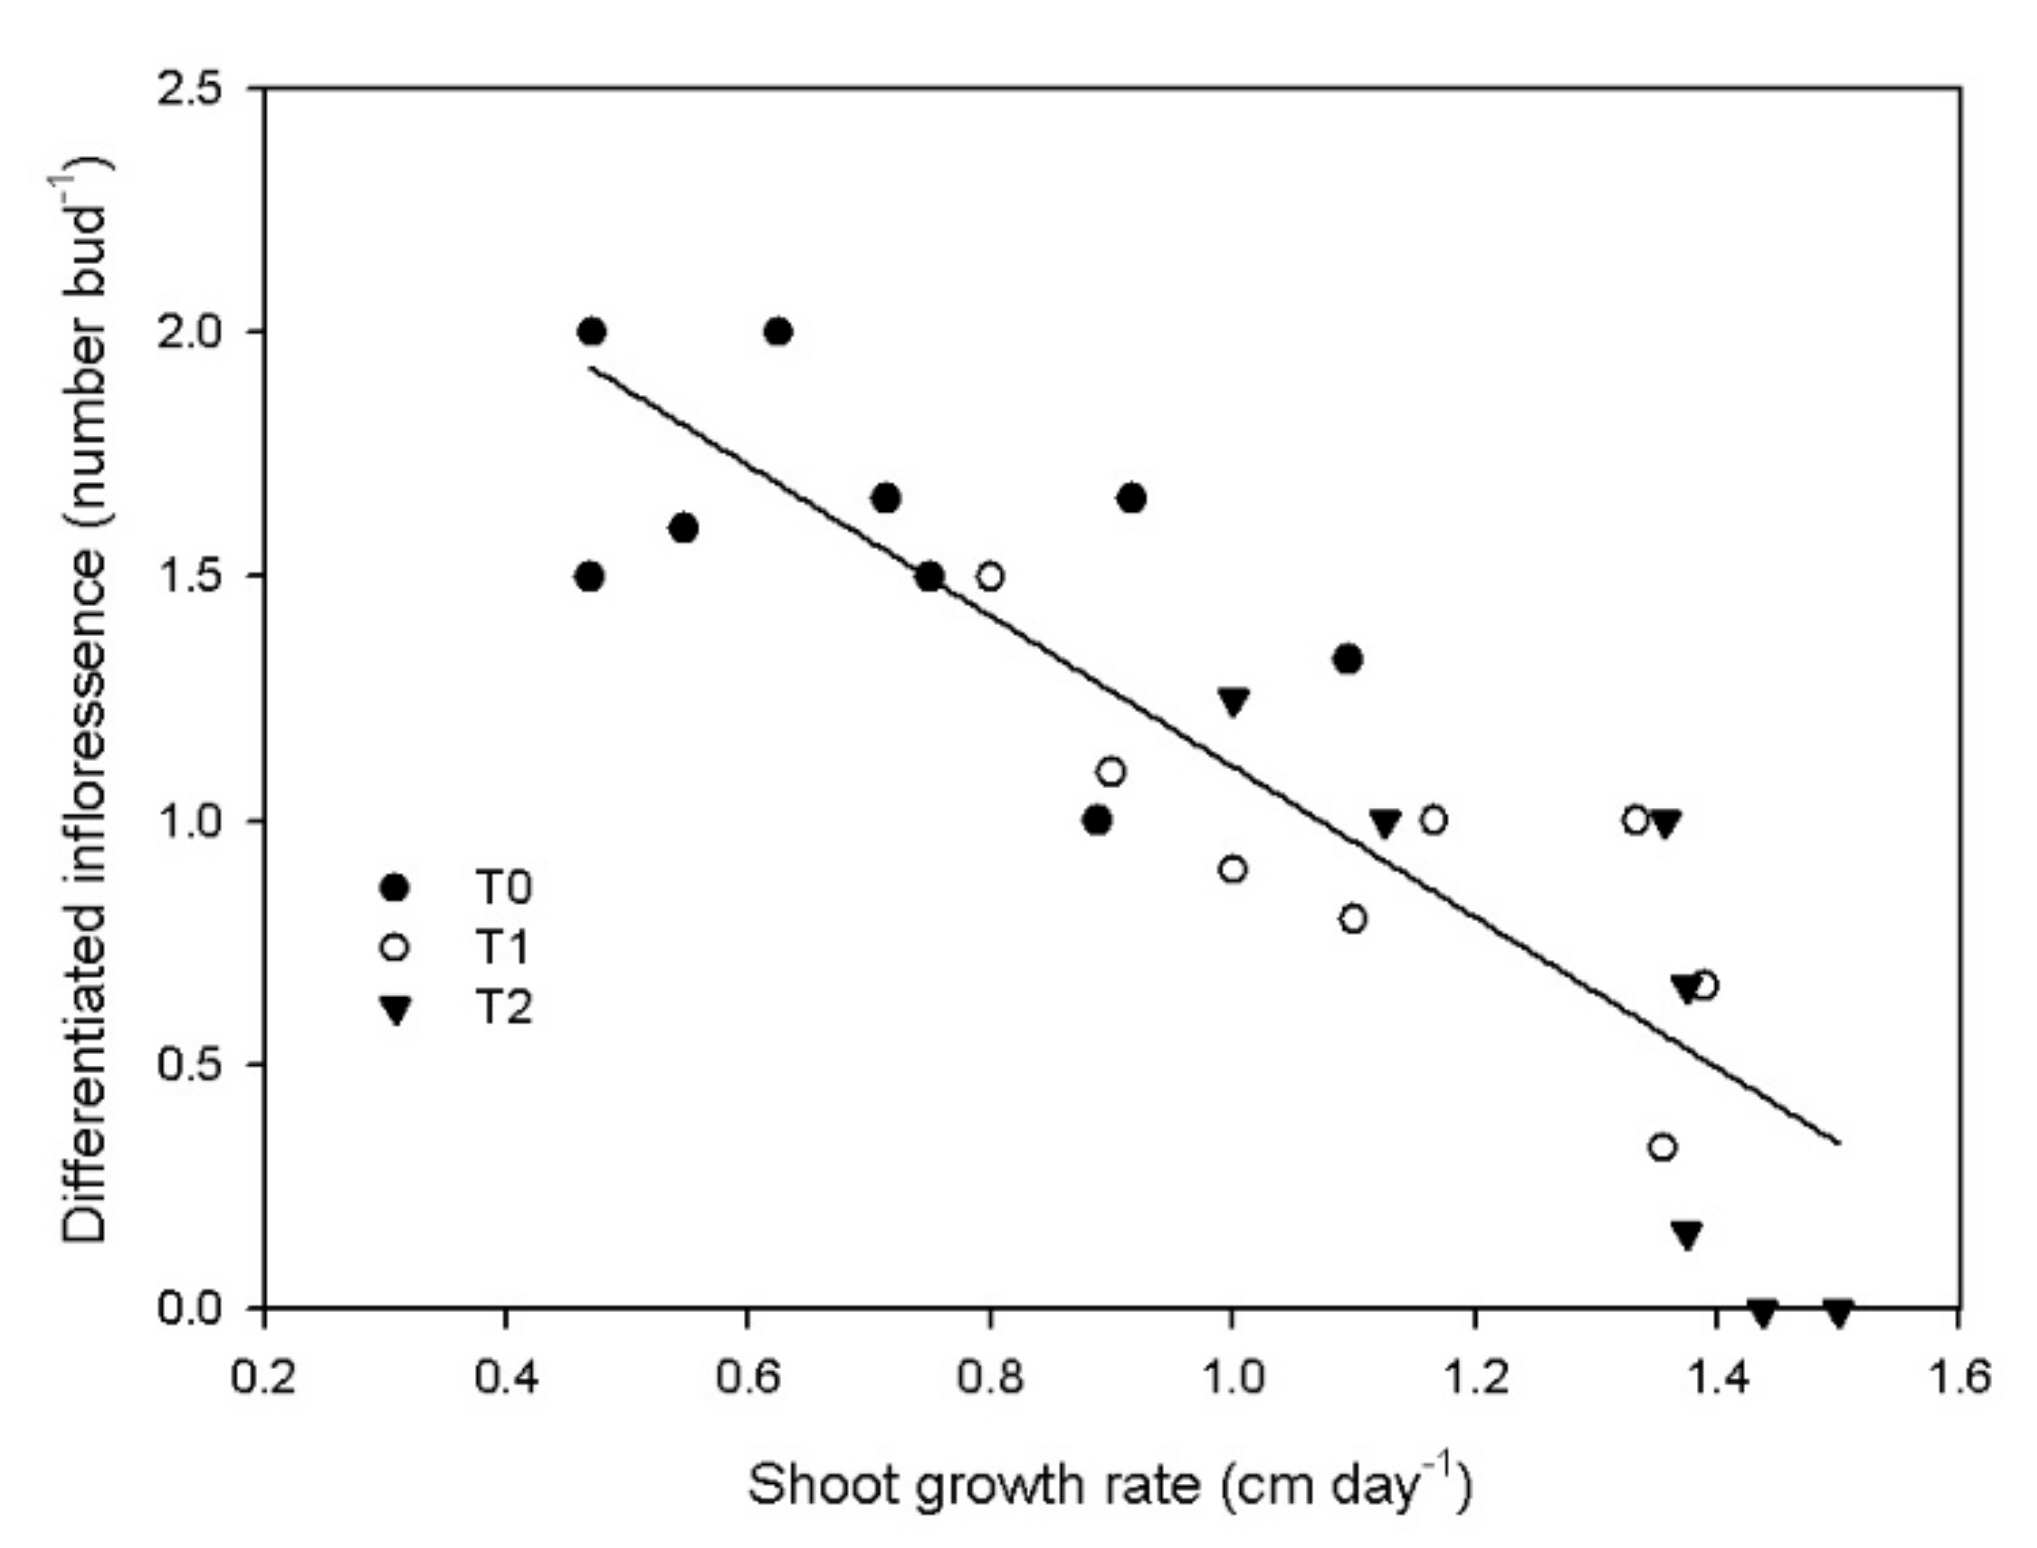
3.3. Reproductive Activity
4. Discussion
5. Conclusions
Author Contributions
Funding
Institutional Review Board Statement
Informed Consent Statement
Data Availability Statement
Acknowledgments
Conflicts of Interest
References
- Amerine, M.; Winkler, A. Composition and Quality of Musts and Wines of California Grapes. Hilgardia 1944, 15, 493–675. [Google Scholar] [CrossRef] [Green Version]
- Poni, S.; Intrieri, C.; Silvestroni, O. Interactions of leaf age, fruiting, and exogenous cytokinins in Sangiovese grapevines under non-irrigated conditions. I. Gas exchange. Am. J. Enol. Vitic. 1994, 45, 71–78. [Google Scholar]
- Lebon, E.; Pellegrino, A.; Tardieu, F.; Lecoeur, J. Shoot development in grapevine (Vitis vinifera) is affected by the modular branching pattern of the stem and intra- and inter-shoot trophic competition. Ann. Bot. 2004, 93, 263–274. [Google Scholar] [CrossRef] [PubMed] [Green Version]
- Poni, S.; Gatti, M.; Palliotti, A.; Dai, Z.; Duchêne, E.; Truong, T.T.; Ferrara, G.; Matarrese, A.M.S.; Gallotta, A.; Bellincontro, A.; et al. Grapevine quality: A multiple choice issue. Sci. Hortic. 2018, 234, 445–462. [Google Scholar] [CrossRef] [Green Version]
- Johnson, R.S.; Lakso, A.N. Carbon balance model of a growing apple shoot: I. Development of a model. J. Am. Soc. Hort. Sci. 1986, 111, 160–164. [Google Scholar]
- Greer, D.H.; Sicard, S.M. The net carbon balance in relation to growth and biomass accumulation of grapevines (Vitis vinifera cv. Semillon) grown in a controlled environment. Funct. Plant Biol. 2009, 36, 645–653. [Google Scholar] [CrossRef] [PubMed]
- Koblet, W. Translocation of photosynthate in grapevines. In Proceedings of the International Symposium on the Quality of the Vintage, Cape Town, South Africa, 14–21 February 1977; pp. 45–51. [Google Scholar]
- Quinlan, J.D.; Weaver, R. Modification of pattern of photosynthate movement within and between shoots of Vitis vinifera L. Plant Physiol. 1970, 46, 527–530. [Google Scholar] [CrossRef] [Green Version]
- Greer, D.H.; Weston, C. Effects of fruiting on vegetative growth and development dynamics of grapevines (Vitis vinifera cv. Semillon) can be traced back to events at or before budbreak. Funct. Plant Biol. 2010, 37, 756–766. [Google Scholar] [CrossRef]
- Tromp, J. Flower-bud formation and shoot growth in apple as affected by temperature. Sci. Hortic. 1976, 5, 331–338. [Google Scholar] [CrossRef]
- Tromp, J. Flower-bud formation in apple under various day and night temperature regimes. Sci. Hortic. 1980, 13, 235–243. [Google Scholar] [CrossRef]
- Webster, A.D. Rootstock and interstock effects on deciduous fruit tree vigour, precocity, and yield productivity. N. Z. J. Crop Hortic. Sci. 1995, 23, 373–382. [Google Scholar] [CrossRef]
- Basile, B.; Dejong, T.M. Control of fruit tree vigor induced by dwarfing rootstocks. Hortic. Rev. 2018, 46, 39–97. [Google Scholar]
- Tombesi, S.; Day, K.R.; Johnson, R.S.; Phene, R.; DeJong, T.M. Vigour reduction in girdled peach trees is related to lower midday stem water potentials. Funct. Plant Biol. 2014, 41, 1336–1341. [Google Scholar] [CrossRef] [Green Version]
- Davidson, A.; Da Silva, D.; DeJong, T.M. The phyllochron of well-watered and water deficit mature peach trees varies with shoot type and vigour. AoB PLANTS 2017, 9, plx042. [Google Scholar] [CrossRef] [Green Version]
- DeJong, T.M.; Day, K.R.; Johnson, R.S. Partitioning of leaf nitrogen with respect to within canopy light exposure and nitrogen availability in peach (Prunus persica). Trees 1989, 3, 89–95. [Google Scholar] [CrossRef]
- Weinbaum, S.A.; Johnson, R.S.; DeJong, T.M. Causes and consequences of overfertilization in orchards. HortTechnology 1991, 2, 112–121. [Google Scholar] [CrossRef]
- Hatfield, J.L.; Prueger, J.H. Temperature extremes: Effect on plant growth and development. Weather Clim. Extrem. 2015, 10, 4–10. [Google Scholar] [CrossRef] [Green Version]
- Greer, D.H.; Weedon, M.M. Modelling photosynthetic responses to temperature of grapevine (Vitis vinifera cv. Semillon) leaves on vines grown in a hot climate. Plant Cell Environ. 2012, 35, 1050–1064. [Google Scholar] [CrossRef]
- Bernardo, S.; Dinis, L.T.; Machado, N.; Moutinho-Pereira, J. Grapevine abiotic stress assessment and search for sustainable adaptation strategies in Mediterranean-like climates. A review. Agron. Sustain. 2018, 38, 66. [Google Scholar] [CrossRef] [Green Version]
- Calderón-Zavala, G.; Lakso, A.N.; Piccioni, R.M. Temperature effects on fruit and shoot growth in the apple (Malus domestica) early in the season. Acta Hortic. 2004, 636, 447–453. [Google Scholar] [CrossRef]
- Pouget, R. Etude du rythme vegetatif: Caracteres physiologiques lies a la precocite de debourrement chez la Vigne. Ann. Amelior. Plant. 1966, 16, 81–100. [Google Scholar]
- Keller, M.; Tarara, J.M.; Mills, L.J. Spring temperatures alter reproductive development in grapevines. Aust. J. Grape Wine Res. 2009, 16, 445–454. [Google Scholar] [CrossRef]
- Reich, P.B.; Yunjian, L.; Bradford, J.B.; Poorter, H.; Perry, C.H.; Oleksyn, J. Temperature drives forest biomass distribution. Proc. Natl. Acad. Sci. USA 2014, 111, 13721–13726. [Google Scholar] [CrossRef] [PubMed] [Green Version]
- IPCC. Climate Change 2013: The Physical Science Basis. Contribution of Working Group I to the Fifth Assessment Report of the Intergovernmental Panel on Climate Change; Cambridge University Press: Cambridge, UK, 2013. [Google Scholar]
- Chmielewski, F.M.; Rötzer, T. Response of tree phenology to climate change across Europe. Agric. For. Meteorol. 2001, 108, 101–112. [Google Scholar] [CrossRef]
- Piao, S.; Liu, Q.; Chen, A.; Janssens, I.A.; Fu, Y.; Dai, J.; Liu, L.; Lian, X.; Shen, M.; Zhu, X. Plant phenology and global climate change: Current progresses and challenges. Glob. Change Biol. 2019, 25, 1922–1940. [Google Scholar] [CrossRef] [PubMed]
- Hedhly, A. Sensitivity of flowering plant gametophytes to temperature fluctuations. Environ. Exp. Bot. 2011, 74, 9–16. [Google Scholar] [CrossRef] [Green Version]
- Poni, S.; Merli, M.C.; Magnanini, E.; Galbignani, M.; Bernizzoni, F.; Vercesi, A.; Gatti, M. An improved multichamber gas exchange system for determining whole-canopy water-use efficiency in grapevine. Am. J. Enol. Vitic. 2014, 65, 268–276. [Google Scholar] [CrossRef]
- Osborne, W.C. Fans, 2nd ed.; Pergamon Press: Oxford, UK, 1977; p. 228. [Google Scholar]
- Long, S.P.; Hällgren, J.E. Measurement of CO2 assimilation by plants in the field and the laboratory. In Photosynthesis and Production in a Changing Environment; Hall, D.O., Scurlock, J.M.O., Bolhàr-Nordenkampf, H.R., Leegood, R.C., Long, S.P., Eds.; Springer: Dordrecht, The Netherlands, 1993. [Google Scholar] [CrossRef]
- Sanchez, L.A.; Dokoozlian, N.K. Bud microclimate and fruitfullness in Vitis vinifera L. Am. J. Enol. Vitic. 2005, 56, 319–329. [Google Scholar]
- Greer, D.H. Canopy Growth and Development Processes in Apples and Grapevines: Responses to Temperature. Hortic. Rev. 2018, 45, 313–369. [Google Scholar]
- Scholefield, P.B.; Neales, T.F.; May, P. Carbon balance of the Sultana vine (Vitis vinifera L.) and the effects of autumn defoliation by harvest-pruning. Aust. J. Plant Physiol. 1978, 5, 561–570. [Google Scholar] [CrossRef]
- Yang, Y.S.; Hori, Y.; Ogata, R. Studies on retranslocation of accumulated assimilates in ‘Delaware’ grapevines. II. Retranslocation of assimilates accumulated during the previous growing season. Tohoku J. Agric. Res. 1980, 31, 109–119. [Google Scholar]
- Sadras, V.O.; Denison, R.F. Do plant parts compete for resources? An evolutionary viewpoint. New Phytol. 2009, 183, 565–574. [Google Scholar] [CrossRef]
- Keller, M.; Tarara, J.M. Warm spring temperatures induce persistent seasonlong changes in shoot development in grapevines. Ann. Bot. 2010, 106, 131–141. [Google Scholar] [CrossRef] [Green Version]
- Frioni, T.; Acimovic, D.; Vanderweide, J.; Tombesi, S.; Palliotti, A.; Gatti, M.; Poni, S.; Sabbatini, P. Whole-canopy source-sink balance at bloom dictates fruit set in cv. Pinot noir subjected to early leaf removal. Am. J. Enol. Vitic. 2019, 70, 411–419. [Google Scholar] [CrossRef]
- Friedman, J.; Rubin, M.J. All in good time: Understanding annual and perennial strategies in plants. Am. J. Bot. 2015, 102, 497–499. [Google Scholar] [CrossRef] [Green Version]
- May, P. Flowering and Fruitset in Grapevines; Lythrum Press: Adelaide, Australia, 2004. [Google Scholar]
- Edson, C.E.; Howell, G.S.; Flore, J.A. Influence of crop load on photosynthesis and dry matter partitioning of Seyval grapevines. III. Seasonal changes in dry matter partitioning, vine morphology, yield, and fruit composition. Am. J. Enol. Vitic. 1995, 46, 478–485. [Google Scholar]
- Buttrose, M.S. Vegetative growth of grapevine varieties under controlled temperatures and light intensity. Vitis 1969, 8, 280–285. [Google Scholar]
- Maguire, A.J.; Kobe, R.K. Drought and shade deplete nonstructural carbohydrate reserves in seedlings of five temperate tree species. Ecol. Evol. 2015, 5, 5711–5721. [Google Scholar] [CrossRef]


| Experiment Phases and Phenological Stages | DOY | Tmean (°C) | ||||
|---|---|---|---|---|---|---|
| T0 | T1 | T2 | T0 | T1 | T2 | |
| Vines removed from refrigerated chamber | 75 | 122 | 156 | |||
| Budburst (BBCH 05) | 90 | 133 | 160 | 14.45 | 15.79 | 22.94 |
| Full bloom (BBCH 65) | 142 | 158 | 181 | 16.02 | 22.29 | 25.9 |
| Shoot topping | 160 | 205 | 205 | 23.56 | 26.02 | 26.2 |
| Veraison (BBCH 83) | 186 | 212 | 236 | 26.17 | 26.65 | 26.27 |
| Harvest | 241 | 268 | 289 | 26.2 | 22.45 | 18.17 |
| T0 | T1 | T2 | ||||||||||
|---|---|---|---|---|---|---|---|---|---|---|---|---|
| Yield (kg vine−1) | 1.56 | ± | 0.37 | a | 0.29 | ± | 0.08 | b | 0.17 | ± | 0.06 | b |
| Clusters (n vine−1) | 10.00 | ± | 0.41 | a | 7.50 | ± | 1.71 | a | 9.75 | ± | 0.95 | a |
| Cluster weight (g) | 154.63 | ± | 36.63 | a | 36.28 | ± | 6.09 | b | 16.61 | ± | 5.22 | b |
| Berry weight (g) | 2.3 | ± | 0.25 | a | 0.99 | ± | 0.08 | b | 0.84 | ± | 0.09 | b |
| Berries per cluster (n) | 66.4 | 1.4 | a | 36.2 | 0.5 | b | 19.9 | 1.2 | b | |||
| Brix | 16.55 | ± | 0.68 | a | 14.58 | ± | 1.35 | ab | 14.76 | ± | 0.32 | b |
| pH | 3.26 | ± | 0.09 | a | 3.34 | ± | 0.06 | a | 3.40 | ± | 0.03 | a |
| Titratable acidity | 6.04 | ± | 1.59 | b | 6.80 | ± | 0.16 | b | 8.89 | ± | 0.47 | a |
| Pruning weight (g dw vine−1) | ||||||||||||
| Primary shoots | 155 | ± | 10.08 | a | 82.5 | ± | 8.98 | b | 96.25 | ± | 12.5 | b |
| Lateral shoots | 26.75 | ± | 5.02 | a | 3.62 | ± | 0.61 | c | 11.25 | ± | 3.64 | b |
| Total | 181.75 | ± | 6.41 | a | 86.12 | ± | 9.28 | c | 107.5 | ± | 13.4 | b |
Publisher’s Note: MDPI stays neutral with regard to jurisdictional claims in published maps and institutional affiliations. |
© 2022 by the authors. Licensee MDPI, Basel, Switzerland. This article is an open access article distributed under the terms and conditions of the Creative Commons Attribution (CC BY) license (https://creativecommons.org/licenses/by/4.0/).
Share and Cite
Tombesi, S.; Sabbatini, P.; Frioni, T.; Grisafi, F.; Barone, F.; Zani, P.; Palliotti, A.; Poni, S. Grapevine Response to Stress Generated by Excessive Temperatures during the Budburst. Horticulturae 2022, 8, 187. https://doi.org/10.3390/horticulturae8030187
Tombesi S, Sabbatini P, Frioni T, Grisafi F, Barone F, Zani P, Palliotti A, Poni S. Grapevine Response to Stress Generated by Excessive Temperatures during the Budburst. Horticulturae. 2022; 8(3):187. https://doi.org/10.3390/horticulturae8030187
Chicago/Turabian StyleTombesi, Sergio, Paolo Sabbatini, Tommaso Frioni, Francesca Grisafi, Federico Barone, Paolo Zani, Alberto Palliotti, and Stefano Poni. 2022. "Grapevine Response to Stress Generated by Excessive Temperatures during the Budburst" Horticulturae 8, no. 3: 187. https://doi.org/10.3390/horticulturae8030187
APA StyleTombesi, S., Sabbatini, P., Frioni, T., Grisafi, F., Barone, F., Zani, P., Palliotti, A., & Poni, S. (2022). Grapevine Response to Stress Generated by Excessive Temperatures during the Budburst. Horticulturae, 8(3), 187. https://doi.org/10.3390/horticulturae8030187