
Comparison of Risk Assessment Schemes in GHPs and HACCP, FSMA Preventive Controls for Human Food, ISO 22000, and GFSI Recognized Standards with Risk Scoring Guidance in General Use with Fresh Produce

 ,
,  , ,
, , 
Abstract
:1. Introduction
- Using improper risk assessment tools for food safety risk assessment. For example, using incident management risk assessment tools for food safety risk assessment. Moreover, it was found that some risk ratings from scientific references did not match the incident management risk definition;
- Using a scientific reference unrelated to intended score to avoid significant risk e.g., giving a low severity score for Salmonella spp., whereas the scientific reference gives a medium level risk;
- Confusing risk categories and being unable to design a proper risk management e.g., mixing food quality or undesirable qualities into a food safety or food hazard risk assessment;
- Some standards have their own requirements in some risk assessments, and this may cause confusion to entrepreneurs e.g., input materials risk assessments have differed from hazard analysis for some issues such as issues concerning detection of food quality fraud;
- Being unaware of the specific risk profiles available;
- Being unable to interpret scientific data to score risk e.g., lacking the knowledge that primary and transmitted sources can be linked to the risk occurrence score, or being unable to convert pathogenic data on severe or injury or illness into severity score.
2. Materials and Methods
2.1. Comparison of Food Risk Assessment Scheme in GHPs and HACCP, FSMA Preventive Controls for Human Food and Animal Food, ISO 22000, and GFSI Recognized Standards
2.2. Preparing Summary of Basic Food Risk
2.3. Preparing General Food Risk Scoring Guidance
2.4. Preparing Specific Fresh Produce Risk Scoring Guidance
2.4.1. Determining the Likelihood of Probability and Severity in Each Qualitative Risk Matrix Models
2.4.2. Selecting Related Simplify Justification Scientific Data for Fresh Produce Entrepreneur Group and Creating 3 × 3 Qualitative Food Safety Risk Matrix Model for Tables 16 and 17
2.4.3. Scoring Tables 16 and 17 into Other Common 3 × 3, 4 × 3, and 5 × 5 Qualitative Risk Matrix Models
2.4.4. Comparing Significant Hazards from all Fruit and Vegetable Qualitative Food Safety Risk Matrix Models with Tables 16 and 17
2.5. Preference Test for Fruit and Vegetable 3 × 3 Reference Qualitative Risk Matrix Model and Practical Fruit and Vegetable 3 × 3, 4 × 3, and 5 × 5 Qualitative Risk Matrix Models
2.6. Checking with Local Entrepreneur Test Results as per Thailand Fruit and Vegetable Testing Law
3. Results and Discussions
3.1. Comparison of Food Risk Assessment Scheme in GHPs and HACCP, FSMA Preventive Controls for Human Food and Animal Food, ISO 22000, and GFSI Recognized Standards
3.2. Summary of Basic Food Risk
3.3. General Food Risk Scoring Guidance
3.4. Specific Fresh Produce Risk Scoring Guidance
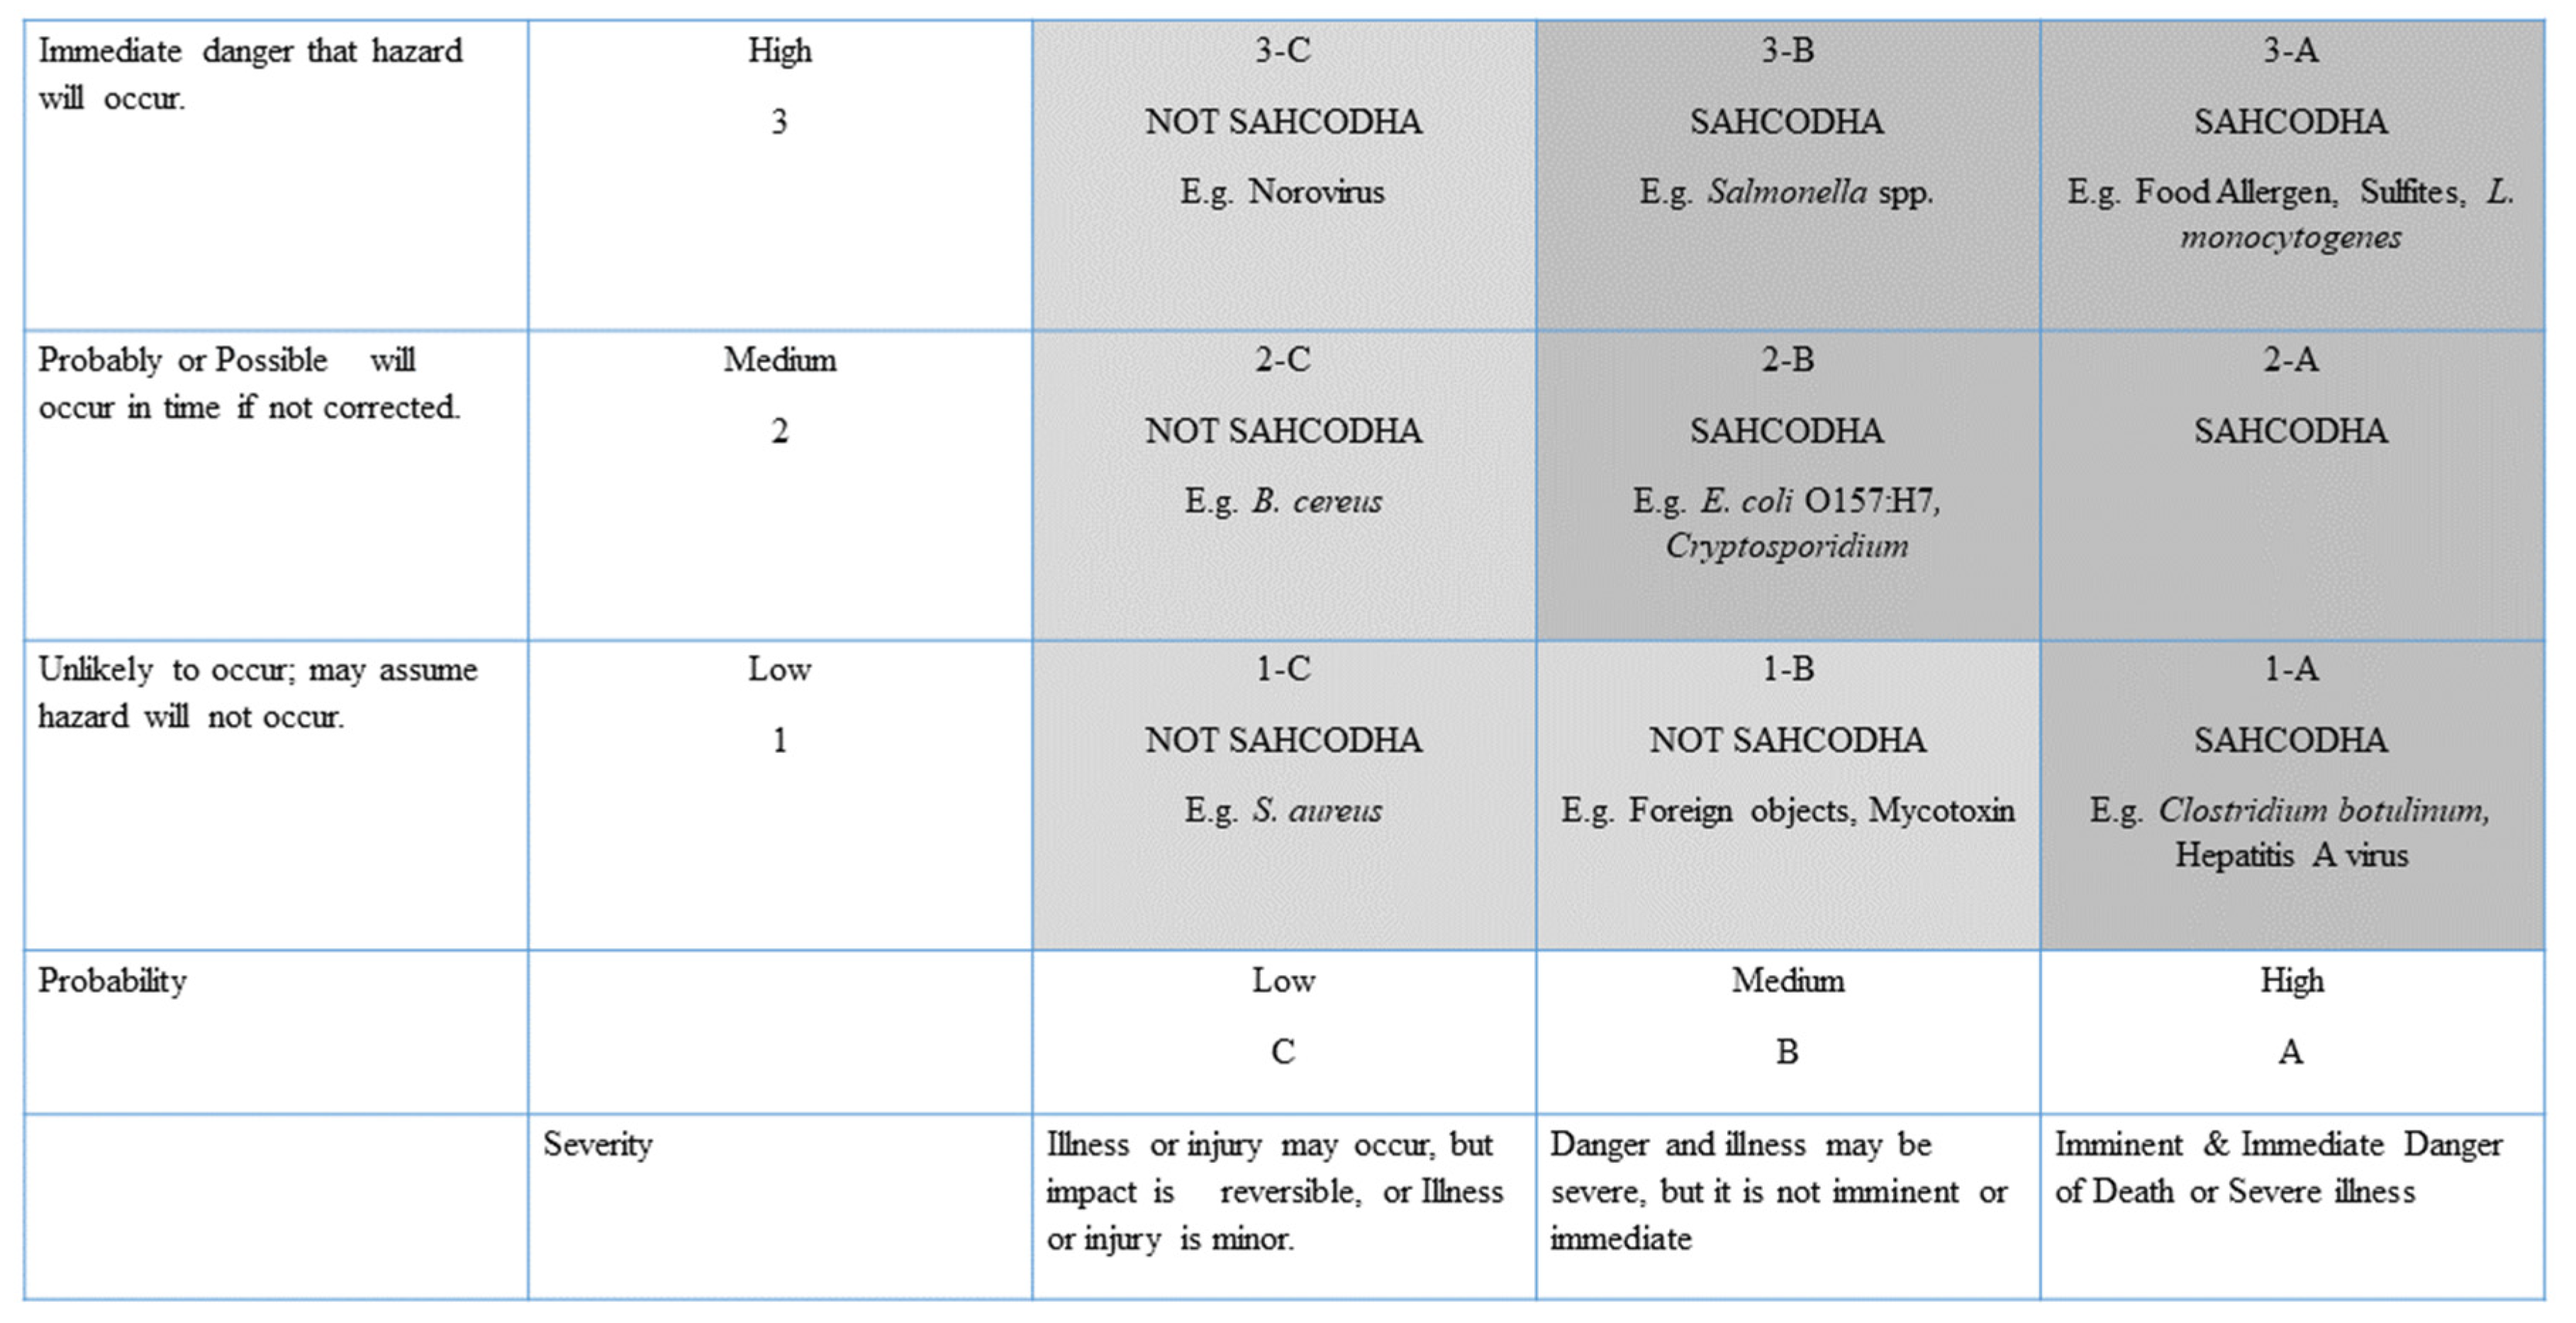
3.5. Creating Practical Fruit and Vegetable 3 × 3 Reference Qualitative Food Safety Risk Matrix Model as Tables 16 and 17 of FDA 2015
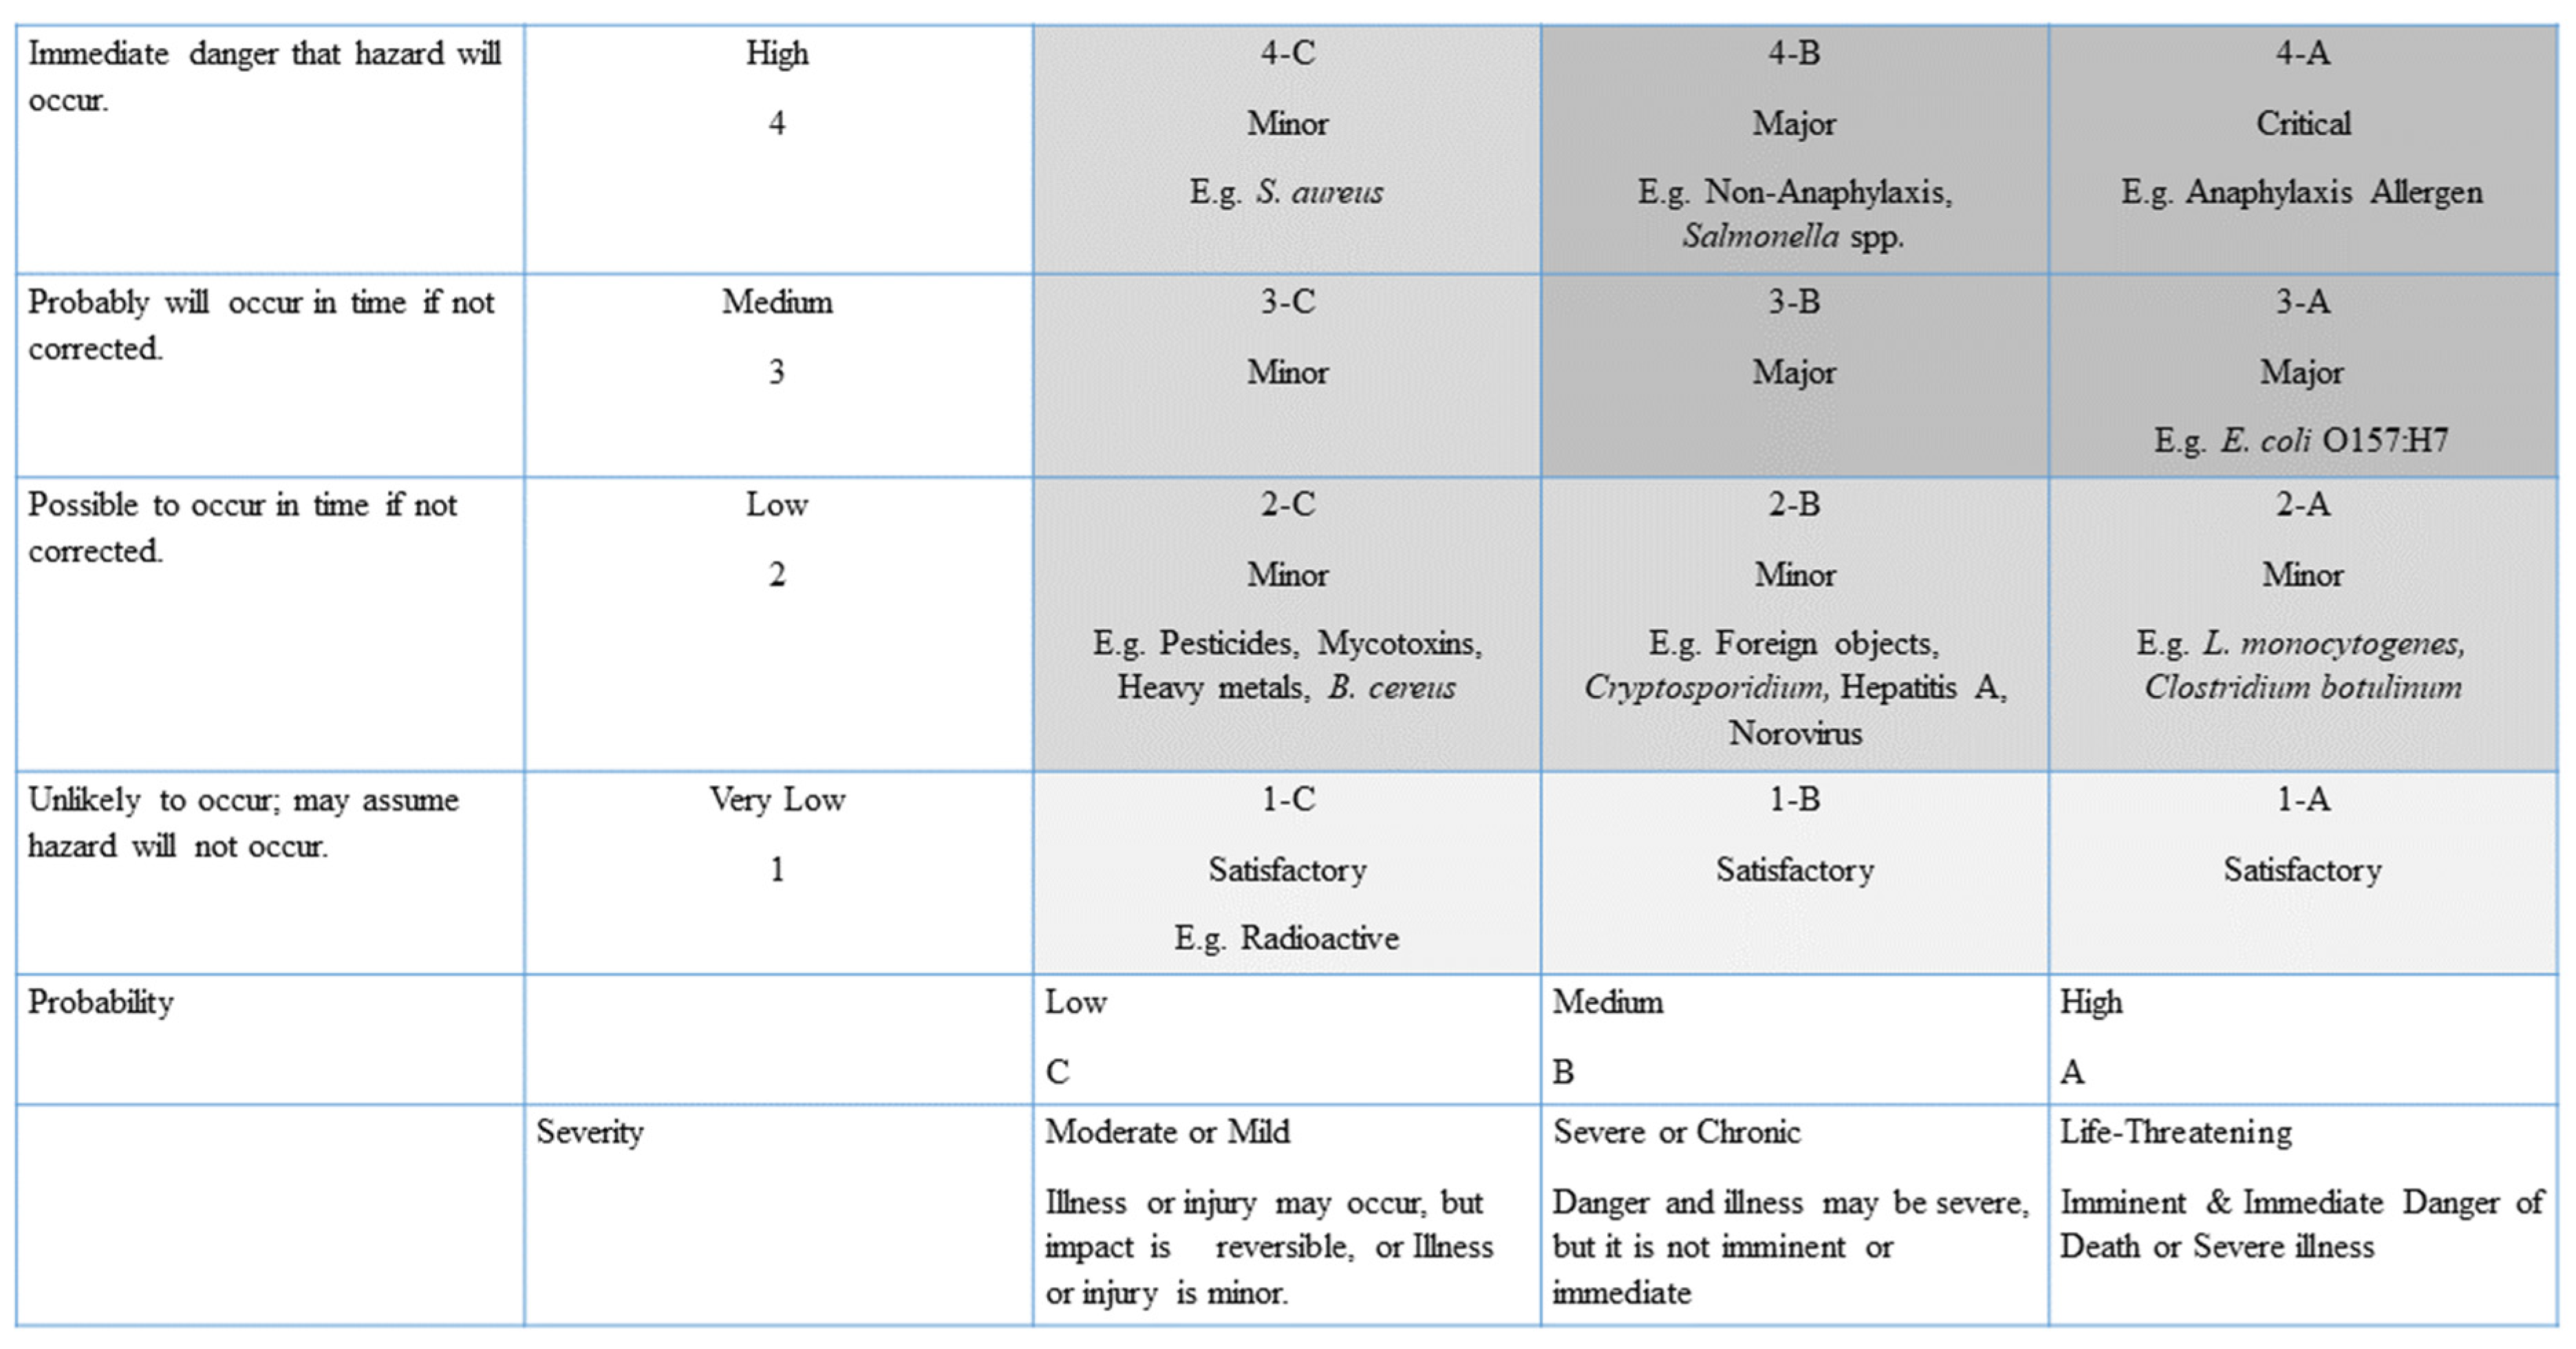
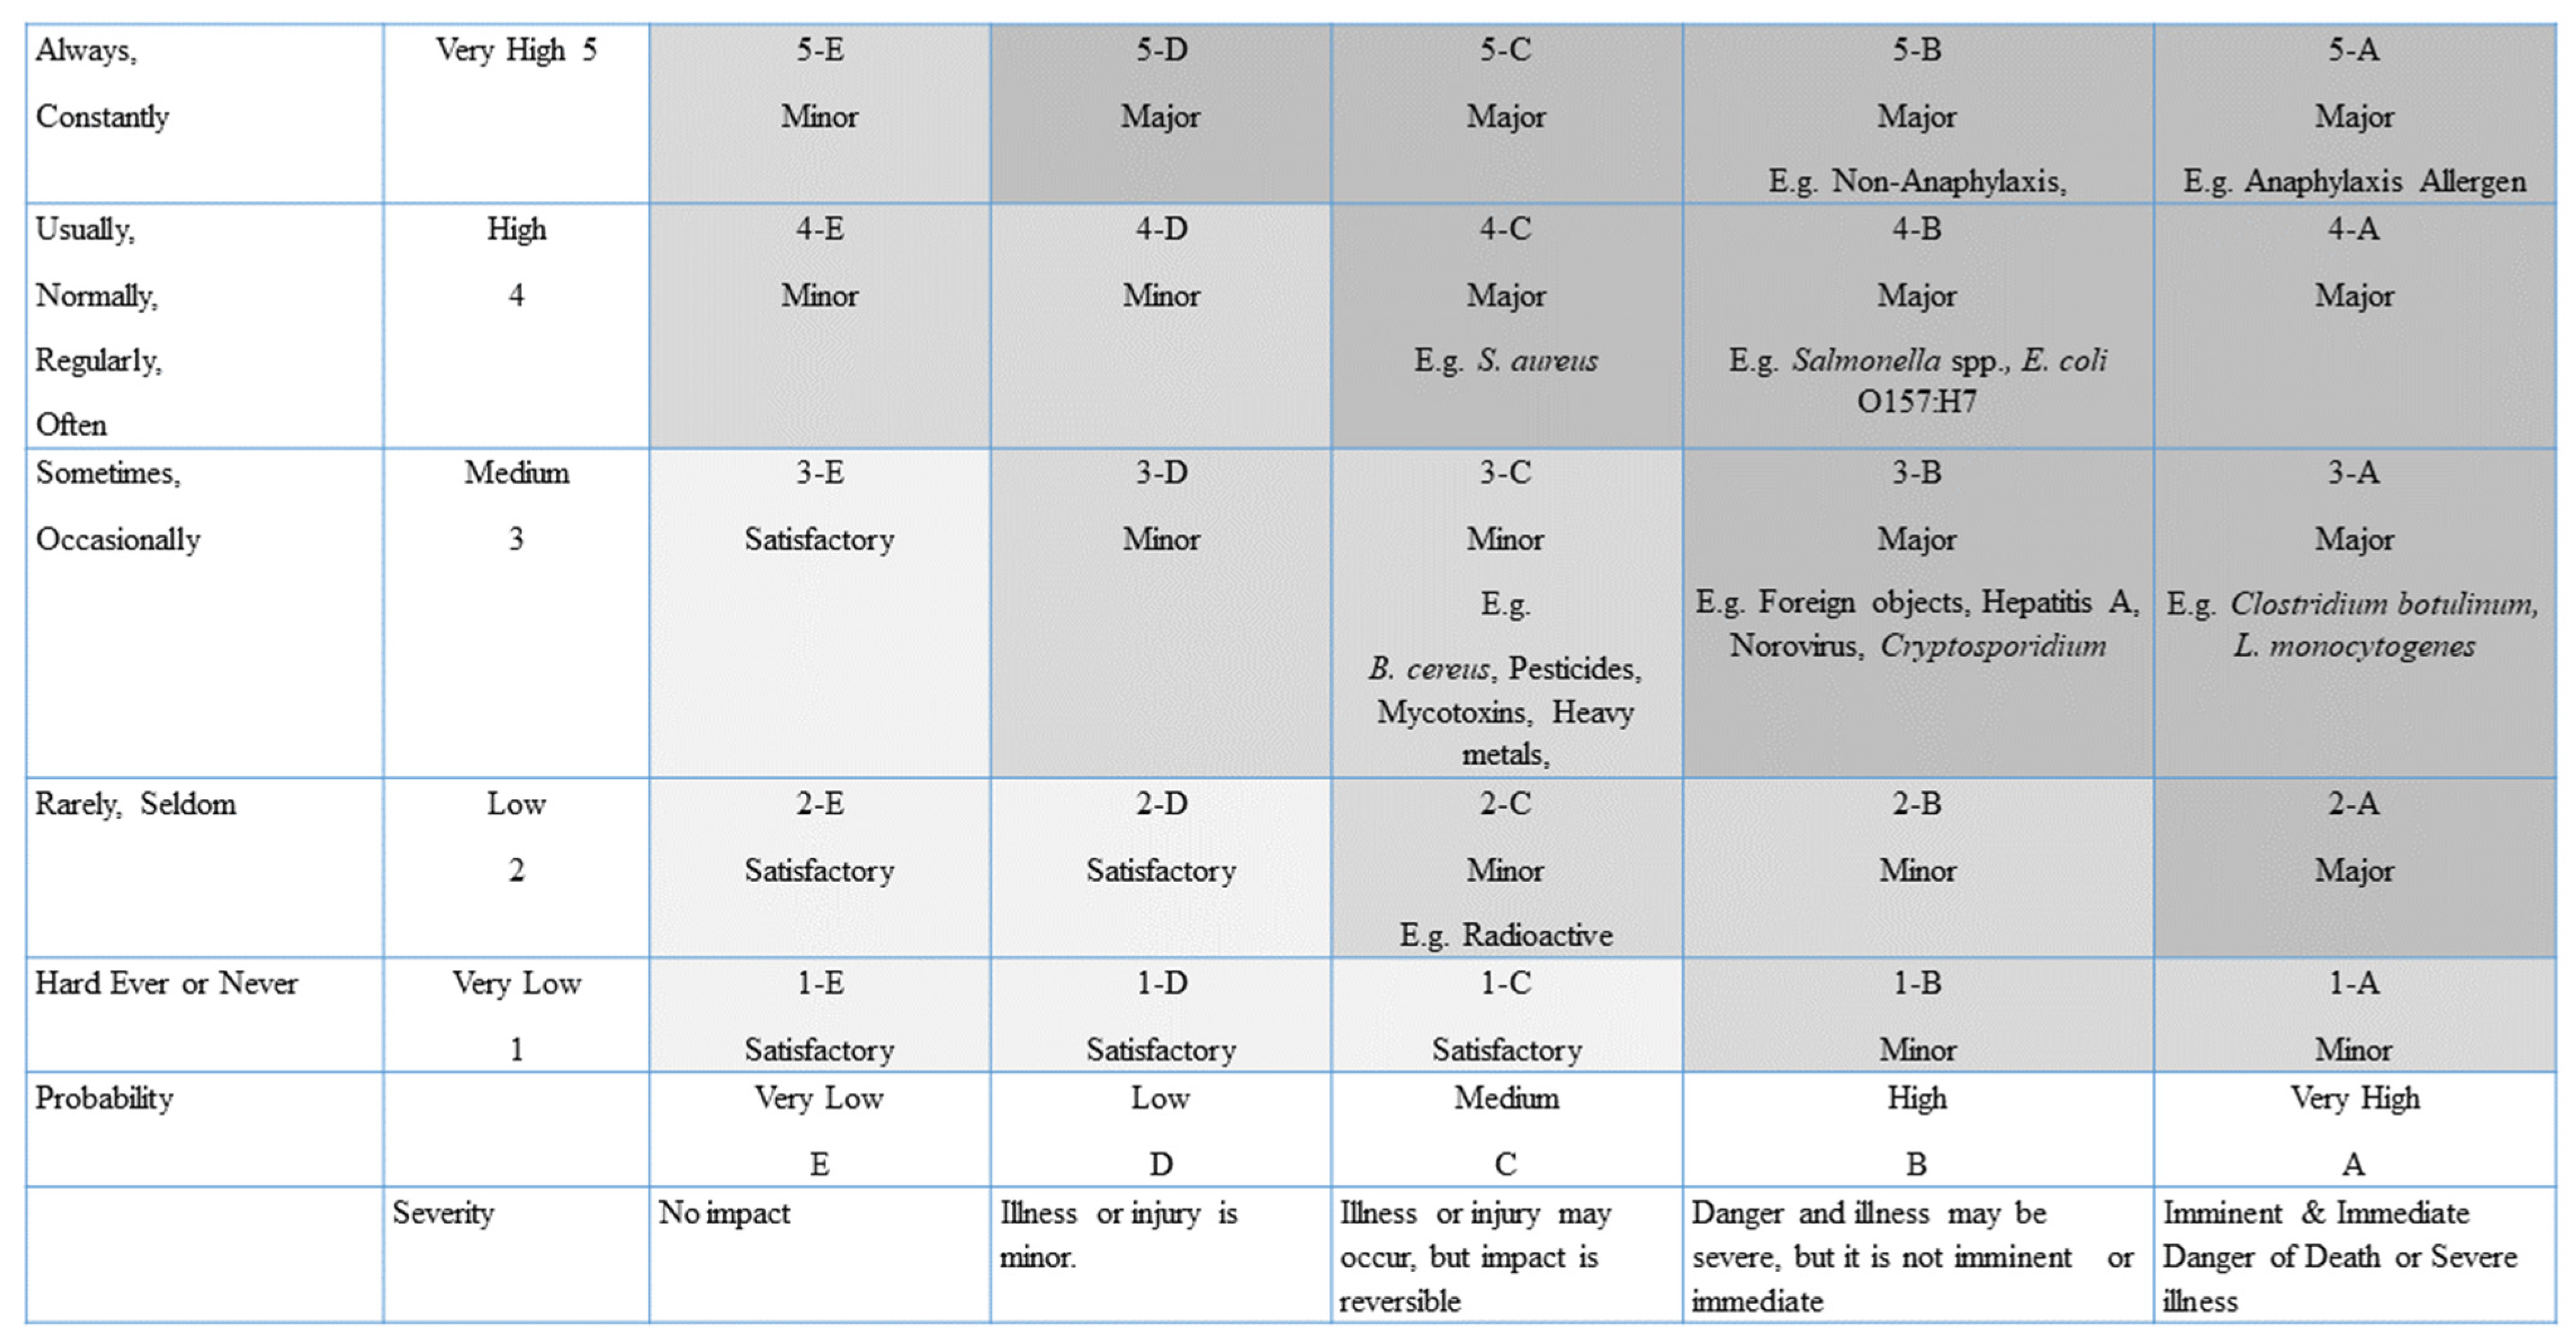
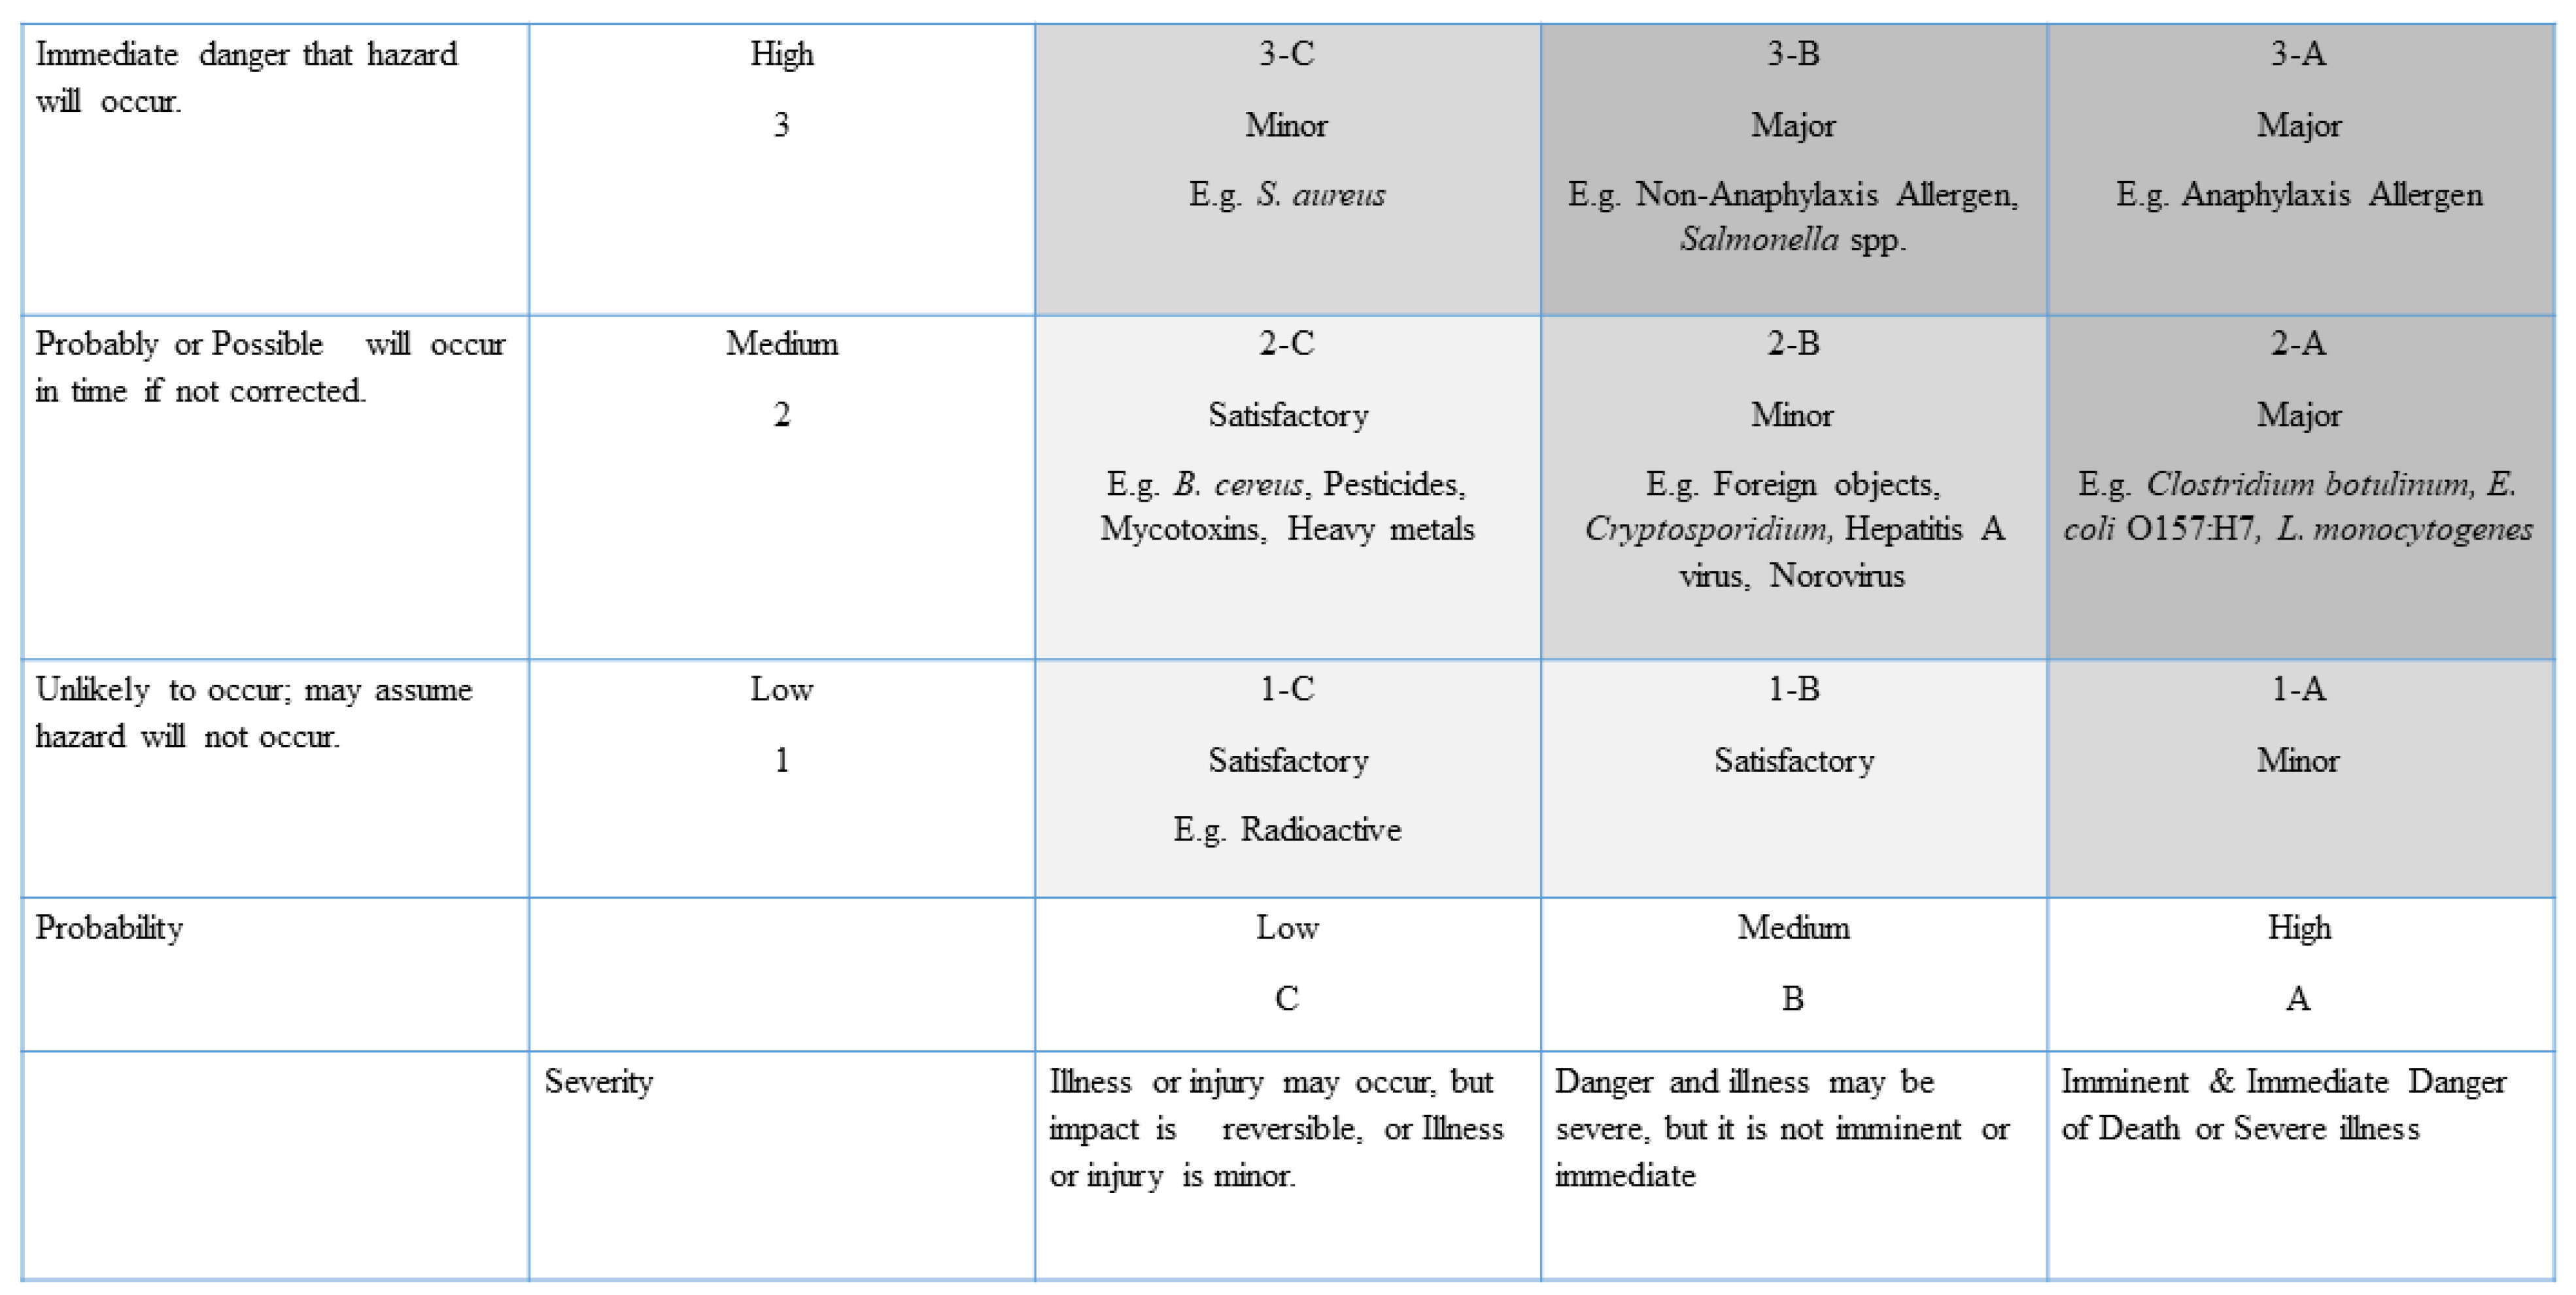
3.6. Scoring Tables 16 and 17 of FDA 2015 into Other Common 3 × 3, 4 × 3, and 5 × 5 Qualitative Food Safety Risk Matrix Models
3.7. Comparing Fruit and Vegetable 3 × 3 Reference Qualitative Food Safety Risk Matrix Model to Other Practical Fruit and vegetable 3 × 3, 4 × 3, and 5 × 5 Qualitative Food Safety Risk Matrix Models
3.8. Comparing Significant Hazards from all Fruit and Vegetable Qualitative Food Safety Risk Matrix Models with Tables 16 and 17 of FDA 2015
3.9. All Practical Fruit and Vegetable Food Safety Risk Matrix Models Preference Test
3.10. Checking with Local Entrepreneur Test Results as per Thailand Fruit and Vegetable Testing Law
4. Conclusions
Author Contributions
Funding
Institutional Review Board Statement
Informed Consent Statement
Acknowledgments
Conflicts of Interest
References
- Food and Agriculture Organization of the United Nations. Application of Risk Assessment in the Fish Industry (FAO Fisheries Technical Paper 442); Food and Agriculture Organization of the United Nations: Rome, Italy, 2004; p. 7. [Google Scholar]
- Aven, T. Risk assessment and risk management: Review of recent advances on their foundation. Eur. J. Oper. Res. 2016, 253, 1–13. [Google Scholar] [CrossRef] [Green Version]
- Weinroth, M.D.; Belk, A.D.; Belk, K.E. History, development, and current status of food safety systems worldwide. Anim. Front. 2018, 8, 9–15. [Google Scholar] [CrossRef] [PubMed]
- Ross, T.; Sumner, J. A simple, spreadsheet-based, food safety risk assessment tool. Int. J. Food Microbiol. 2002, 77, 39–53. [Google Scholar] [CrossRef]
- Elmontsri, M. Review of the strengths and weaknesses of qualitative risk matrices. J. Risk Anal. Crisis Response 2014, 4, 49–57. [Google Scholar] [CrossRef] [Green Version]
- Food and Agriculture Organization of The United Nations in Collaboration with the World Health Organization Consultation. Risk Management and Food Safety; FAO Food and Nutrition Paper Number 65 Report of a Joint, Rome, Italy, 27–31 January 1997; Food and Agriculture Organization, The United Nations in Collaboration with the World Health Organization Consultation: Rome, Italy, 1997; pp. 4–5. [Google Scholar]
- Food and Agriculture Organization of the United Nations. Animal Feeding and Food Safety (FAO Food and Nutrition Paper-69); Food and Agriculture Organization of the United Nations: Rome, Italy, 1998; p. 8. [Google Scholar]
- Food and Agriculture Organization of The United Nations in Collaboration with the World Health Organization Consultation. Food Safety Risk Analysis Part 1 An Overview and Framework Manual; Provisional Edition; Food and Agriculture Organization, The United Nations in Collaboration with the World Health Organization Consultation: Rome, Italy, 2005; pp. 9–38. [Google Scholar]
- Lang, T.; Sambey, K.; Fahner, K.; Yaschuk, M. Food Safety Guidebook. (Version 1.1); Alberta Agriculture and Rural Development: Edmonton, AB, Canada, 2014; pp. 370–378. [Google Scholar]
- Manning, L.; Soon, J.M. Mechanisms for assessing food safety risk. Br. Food J. 2013, 115, 460–484. [Google Scholar] [CrossRef]
- Murray, S.L.; Grantham, K.; Damle, S.B. Development of a Generic Qualitative risk matrix to Manage Project Risk. J. Ind. Syst. Eng. 2011, 5, 35–51. [Google Scholar]
- Food and Agriculture Organization of the United Nations. Food Quality and Safety Systems—A Training Manual on Food Hygiene and the Hazard Analysis and Critical Control Point (HACCP) System; Food and Agriculture Organization of the United Nations: Rome, Italy, 1998; pp. 118–120, 127–228. [Google Scholar]
- Food and Agriculture Organization of The United Nations in Collaboration with the World Health Organization Consultation. Risk Characterization of Microbiological Hazards in Food Guidelines; Food and Agriculture Organization of The United Nations in Collaboration with the World Health Organization Consultation: Rome, Italy, 2009; pp. 23–60. [Google Scholar]
- Food and Drug Administration. Bad Bug Book, Foodborne Pathogenic Microorganisms and Natural Toxins, 2nd ed.; Food and Drug Administration: Silver Spring, MD, USA, 2012; pp. 9, 75, 83–95, 99–103, 108–112, 117, 131, 168–177, 231. [Google Scholar]
- Food Safety Preventive Controls Alliance. FSPCA Preventive Controls for Human Food Participant Manual; Version 1.2; Food Safety Preventive Controls Alliance: Chicago, IL, USA, 2016; pp. 65–112, 485–490. [Google Scholar]
- McIntyre, L.; Cressey, P.; Lake, R. Discussion Document on Pathogens in Fruits and Vegetables in New Zealand; Institute of Environmental Science & Research Limited for New Zealand Food Safety Authority: Wellington, New Zealand, 2008; pp. 13–18, 64–71. [Google Scholar]
- Scientific Committee on Food. Risk Profile on the Microbiology Contamination of Fruits and Vegetables Eaten Raw; Report of the Scientific Committee on Food; European Commission Health and Consumer Protection Directorate-General: Brussels, Belgium, 2002; pp. 14–23. [Google Scholar]
- Bassett, J.; McClure, P. A risk assessment approach for fresh fruits. The Society for Applied Microbiology. J. Appl. Microbiol. 2008, 104, 925–943. [Google Scholar] [CrossRef] [PubMed]
- United Nations. Safety and Quality of Fresh Fruit and Vegetables: A Training Manual for Trainers; United Nations New York and Geneva: Geneva, Switzerland, 2007; pp. 18–49.
- Wallace, C.A.; Holyoak, L.; Powell, S.C.; Dykes, F.C. HACCP-The difficulty with Hazard Analysis. J. Food Control 2014, 35, 233–240. [Google Scholar] [CrossRef]
- Soon, J.M.; Davies, W.P.; Chadd, S.A.; Baines, R.N. A Delphi-based approach to developing and validating a farm food safety risk assessment tool by experts. Expert Syst. Appl. 2012, 39, 8325–8336. [Google Scholar] [CrossRef]
- Soon, J.M.; Davies, W.P.; Chadd, S.A.; Baines, R.N. Field application of farm-food safety risk assessment (FRAMp) tool for small and medium fresh produce farms. Food Chem. 2013, 136, 1603–1609. [Google Scholar] [CrossRef] [PubMed]
- Food and Drug Administration. Qualitative Risk Assessment: Risk of Activity/Food Combinations for Activities (Outside the Farm Definition) Conducted in a Facility Co-Located on a Farm: Response to Public Comments; Food and Drug Administration: Silver Spring, MD, USA, 2015; pp. 58–60. [Google Scholar]
- Food and Drug Administration. Methodological Approach to Developing a Risk-Ranking Model for Food Tracing FSMA Section 204 (21 U.S. Code § 2223), August 2020; Center for Food Safety and Applied Nutrition, Food and Drug Administration, U.S. Department of Health and Human Services: College Park, MD, USA, 2020; pp. 13–23. [Google Scholar]
- Codex Alimentarius. Discussion Paper on Food Integrity and Food Authenticity; CX/FICS 18/24/7; Codex Alimentarius: Rome, Italy, 2018; pp. 1–3. [Google Scholar]
- Food Safety Preventive Controls Alliance. FSPCA Preventive Controls for Animal Food Participant Manual; Version 1.1; Food Safety Preventive Controls Alliance: Chicago, IL, USA, 2017; p. 201. [Google Scholar]
- Onwuegbuzie, A.J.; Collins, K.M.T. A Typology of Mixed Methods Sampling Designs in Social Science Research. Qual. Rep. 2007, 12, 281–316. [Google Scholar] [CrossRef]
- Rowley, J. Designing and using research questionnaires. Manag. Res. Rev. 2012, 37, 308–330. [Google Scholar] [CrossRef]
- Codex Alimentarius. General Principles of Food Hygiene CXC 1–1969; Revision 5; Codex Alimentarius: Rome, Italy, 2020; pp. 2–6. [Google Scholar]
- Spink, J.; Moyer, D.C.; Speier-Pero, C. Introducing the Food Fraud Initial Screening model (FFIS). J. Food Control. 2016, 69, 306–314. [Google Scholar] [CrossRef]
- Nyumba, T.O.; Wilson, K.; Derrick, C.J.; Mukherjee, N. Qualitative method for eliciting judgements for decision making: The use of focus group discussion methodology: Insights from two decades of application in conservation. Methods Ecol. Evol. 2018, 9, 20–32. [Google Scholar] [CrossRef] [Green Version]
- Surareungchai, S.; Borompichaichartkul, C.; Rachtanapun, C.; Pongprasert, N.; Jitareerat, P.; Srilaong, V. Simplify product safety and quality risk analysis of raw materials for conventional, soilless culture and organic salads. J. Food Control 2021, 130, 108359. [Google Scholar] [CrossRef]


| Issues | GPFH (GHPs HACCP) Rev. 5 | PCHF | PCAF | BRCGS Food | IFS Food | SQF MFG | ISO 22000 | FSSC 22000 |
|---|---|---|---|---|---|---|---|---|
| Contaminants | Food Safety and Food Suitability in GHPs | Food Safety and Defect Action Level or Quality Undesirable in CGMPs | Food Safety and Defect Action Level or Quality Undesirable in CGMPs | Food Safety and Food Quality in PRPs | Food Safety and Food Quality in PRPs | Food Safety and Food Quality in PRPs | Food Safety and Food Quality in ISO 22002-X | Food Safety and Food Quality in ISO 22002-X |
| Cleaning and Sanitizing | GHPs and Greater Attention GHPs | CGMPs | CGMPs | PRPs | PRPs | PRPs | ISO 22002-X | ISO 22002-X |
| Product Description | GHPs | Food Safety Plan | Food Safety Plan | HACCP | HACCP | HACCP | Hazard Control Plan | Hazard Control Plan |
| Flow Diagram | GHPs | Food Safety Plan | Food Safety Plan | HACCP | HACCP | HACCP | Hazard Control Plan | Hazard Control Plan |
| Process Description | GHPs | Food Safety Plan | Food Safety Plan | HACCP | HACCP | HACCP | Hazard Control Plan | Hazard Control Plan |
| Operational Control | GHPs | CGMPs | CGMPs | PRPs | PRPs | PRPs | ISO 22002-X | ISO 22002-X |
| Monitoring | GHPs | CGMPs | CGMPs | PRPs | PRPs | PRPs | ISO 22002-X | ISO 22002-X |
| Corrective Action | GHPs | CGMPs | CGMPs | PRPs | PRPs | PRPs | ISO 22002-X | ISO 22002-X |
| Validation | GHPs; Cleaning | CGMPs; Basic Sanitation | CGMPs; Basic Sanitation | PRPs; Cleaning | PRPs; Cleaning | PRPs; Cleaning | ISO 22002-X; Cleaning | ISO 22002-X; Cleaning |
| Verification | GHPs | CGMPs | CGMPs | PRPs | PRPs | PRPs | ISO 22002-X | ISO 22002-X |
| Record | GHPs | CGMPs | CGMPs | PRPs | PRPs | PRPs | ISO 22002-X | ISO 22002-X |
| Hazards |
|
|
|
|
|
|
|
|
| Hazard Sources |
|
|
|
|
|
|
|
|
| Occurrence in absence control | Hazard Analysis | Simplest Qualitative Hazard Analysis with Justification Example | Rubric Score Hazard Analysis with Justification Example | Hazard Analysis as HACCP Codex Alimentarius | Hazard Analysis as HACCP Codex Alimentarius | Hazard Analysis as HACCP Codex Alimentarius | Hazard Analysis as ISO 22000 Questions | Hazard Analysis as ISO 22000 Questions |
| Severity in absence control | Hazard Analysis | Simplest Qualitative Hazard Analysis with Justification Example | Rubric Score Hazard Analysis with Justification Example | Hazard Analysis as HACCP Codex Alimentarius | Hazard Analysis as HACCP Codex Alimentarius | Hazard Analysis as HACCP Codex Alimentarius | Hazard Analysis as ISO 22000 Questions | Hazard Analysis as ISO 22000 Questions |
| Significant hazard | Hazard Analysis | Simplest Qualitative Hazard Analysis with Justification Example | Rubric Score Hazard Analysis with Justification Example | Hazard Analysis as HACCP Codex Alimentarius | Hazard Analysis as HACCP Codex Alimentarius | Hazard Analysis as HACCP Codex Alimentarius | Hazard Analysis as ISO 22000 Questions | Hazard Analysis as ISO 22000 Questions |
| Control measure | Critical Control Point | Preventive Controls.
| Preventive Controls.
|
|
|
|
|
|
| Control Limit |
|
|
|
|
|
|
|
|
| Limit Control Name | Critical Limit |
|
| Critical Limit | Critical Limit | Critical Limit |
|
|
| Monitoring | Critical Control Point | Preventive Controls
| Preventive Controls
| Critical Limit | Critical Limit | Critical Limit |
|
|
| Correction | During Production Preventive Controls
| During Production Preventive Controls
| Immediately action | Immediately action | Immediately action | Timely action for critical control point | Timely action for critical control point | |
| Corrective Action | Critical Control Point | Root cause analysis, prevent recurrence and prevent affected product entering to commerce Production Preventive Controls
| Root cause analysis, prevent recurrence and prevent affected product entering to commerce Production Preventive Controls
| Root cause analysis and prevent recurrence | Root cause analysis and prevent recurrence | Root cause analysis and prevent recurrence | Root cause analysis and prevent recurrence | Root cause analysis and prevent recurrence |
| Validation | Critical Control Point | Preventive Controls.
| Preventive Controls.
| Critical Control Point | Critical Control Point | Critical Control Point |
|
|
| Verification |
|
|
|
|
|
|
|
|
| Reanalysis |
|
|
|
|
|
|
|
|
| Records | Appropriate period | At least 2 years | At least 2 years | Shelf life plus 1 year | Shelf life plus 1 year | Shelf life plus 1 year | Shelf life plus 1 year | Shelf life plus 1 year |
| Recall | GHPs | Linked to preventive controls Recall
| Linked to preventive controls Recall
| Linked to incident management | In management system part | In management system part | In management system part | In management system part |
| Input Materials Risk Assessment | Hazard Analysis at receiving step | Hazard Analysis at receiving step | Hazard Analysis at receiving step |
| Hazard Analysis at receiving step | Hazard Analysis at receiving step | Hazard Analysis at receiving step | Hazard Analysis at receiving step |
| Fraud Assessment |
|
|
|
| ||||
| Supplier Control | GHPs or HACCP | Supplier chain program for raw materials risk handled by supplier
| Supplier chain program for raw materials risk handled by supplier
| Overall input materials risk rating as
| Supplier selection and evaluation or HACCP | Supplier selection and evaluation or HACCP | Supplier selection and evaluation or HACCP | Supplier selection and evaluation or HACCP |
| Incoming Inspection | GHPs or HACCP | Supplier chain program for raw materials risk handled by supplier
| Supplier chain program for raw materials risk handled by supplier
| Each risk of input materials linked to testing requirement
| Incoming inspection | Incoming inspection | Incoming inspection | Incoming inspection |
| Quality Control | GHPs | CGMPs
| CGMPs |
|
| Critical Quality Point | PRPs ISO 22002-X | As ISO 9001 |
| Threat Assessment | Not mention | Not in Preventive Controls Final Rule, but put in Intentional Adulteration Final Rule for Human Food Simple tool is key activity types in area and processing step and vulnerable assessment or CARVER + shock | No requirement for Animal Food | Focus on area assessment for probability and impact when success is focused on production stop, property loss and consumer health impact. For malicious in processing step were mentioned in HACCP part as combining from hazard analysis and intentional adulteration vulnerable assessment in each processing step. | Focus on area assessment and impact when success; production stop, property loss and consumer health impact. | Focus on area assessment and impact when success; production stop, property loss and consumer health impact. | Focus on area assessment and impact when success; production stop, property loss and consumer health impact. | Focus on area assessment and impact when success; production stop, property loss and consumer health impact. |
| Incident management | Not mention | Not mention | Not mention | Focus on disruption, event, sabotage, and cyber-attack then link to recall procedure. | Similarly, to BRCGS Food. | Similarly, to BRCGS Food. | Referred in emergency preparedness and response requirement. | As ISO 22000. |
| Food Risk Sources | Food Risk Forms Example | Food Risk Group | Food Integrity | |||||
|---|---|---|---|---|---|---|---|---|
| Physical | Chemical | Biological | Food Safety | Food Quality | Food Safety | Food Quality | Food Authenticity | |
| Unintentional | Metal, Glass, Plastic, Wood | Natural occurring; Mycotoxins, Formulating, Accident; Dioxin | Pathogenic group | ✓ | ✓ | |||
| Hairs, Insects | Sensory | Microbial indicators group; TPC, Coliforms, Yeast, Molds, E. coli | ✓ | ✓ | ||||
| Intentional—Food fraud | Melamine, Sudan Red | ✓ | ✓ | |||||
| Organic, Non-GMO, Global GAP | ✓ | ✓ | ||||||
| Intentional—Food malicious | Needles | Arsenic | Clostridium botulinum toxin | ✓ | ✓ | |||
Risk Forms
| Risk Sources | Hazard Assessment | Justification for Hazard Assessment | Fraud Assessment | Justification for Fraud Assessment | |||||||
|---|---|---|---|---|---|---|---|---|---|---|---|---|
| Unintentional | Intentional | Occurrence | Severity | Occurrence | Severity | Fraud Occurrence | Fraud Detection | Fraud Occurrence | Fraud Detection | ||
| Malicious | Product Safety Fraud | Quality/Technical Fraud | |||||||||
| B Pathogenic Bacteria in High Severity Group; Clostridium botulinum, Pathogenic E. coli, Listeria monocytogenes | ✓ | Depend on source/facility/process | H | FSPCA Preventive Controls for Human Food Chapter 4 and A4-4 | FSPCA Preventive Controls for Human Food Chapter 4 and A4-4 | |||||||
| B Pathogenic Bacteria in Moderate Severity Group; Salmonella spp. | ✓ | Depend on source/facility/process | M | FSPCA Preventive Controls for Human Food Chapter 4 and A4-4 | FSPCA Preventive Controls for Human Food Chapter 4 and A4-4 | |||||||
| B Pathogenic Bacteria in Low Severity Group; Staphyloccocus aureus | ✓ | Depend on source/facility/process | L | FSPCA Preventive Controls for Human Food Chapter 4 and A4-4 | FSPCA Preventive Controls for Human Food Chapter 4 and A4-4 | |||||||
| B Adding Pathogenic Bacteria in High Severity Group; Clostridium botulinum | ✓ | Depend on source/facility/process | H | FSPCA Preventive Controls for Human Food Chapter 4 and A4-4 | FSPCA Preventive Controls for Human Food Chapter 4 and A4-4 | |||||||
| B Quality Undesirable or Indicator Microbials; TPC, Yeast, Molds, Enterobacteriaceae, Coliforms, E. coli | ✓ | Depend on source/facility/process | No score in hazard term for quality fraud, but it can be score as quality impact at M or it can impact as rejection by customers. | FSPCA Preventive Controls for Human Food Chapter 4 | FSPCA Preventive Controls for Human Food Chapter 4 | |||||||
| C Natural Occurring; Mycotoxins | ✓ | Depend on source/facility/process | L or M depend on type | FSPCA Preventive Controls for Human Food Chapter 5 | FSPCA Preventive Controls for Human Food Chapter 5 | |||||||
| C Natural Occurring; Heavy metals | ✓ | Depend on source/facility/process | L or M depend on type | FSPCA Preventive Controls for Human Food Chapter 5 | FSPCA Preventive Controls for Human Food Chapter 5 | |||||||
| C Formulating: antibiotics, pesticides, preservatives | ✓ | Depend on source/facility/process | L or M depend on type | FSPCA Preventive Controls for Human Food Chapter 5 | FSPCA Preventive Controls for Human Food Chapter 5 | |||||||
| C Incident; Cleaning agent residues; NaOH | ✓ | Depend on source/facility/process | H | FSPCA Preventive Controls for Human Food Chapter 5 | FSPCA Preventive Controls for Human Food Chapter 5 | |||||||
| C Industrial Contamination; PCBs, Dioxin | ✓ | Depend on source/facility/process | L or M depend on type | FSPCA Preventive Controls for Human Food Chapter 5 | FSPCA Preventive Controls for Human Food Chapter 5 | |||||||
| C Adding Toxic Substances | ✓ | Depend on Food Defense Measures | M or H depend on chemical substance type | Potential Malicious Data | EPA | |||||||
| C Allergen Itself Anaphylaxis Group; Peanut, Tree nuts, Crustaceans | ✓ | H | H | FSPCA Preventive Controls for Human Food Chapter 5 | FSPCA Preventive Controls for Human Food Chapter 5 | |||||||
| C Allergen Itself Non-Anaphylaxis Group | ✓ | H | M | FSPCA Preventive Controls for Human Food Chapter 5 | FSPCA Preventive Controls for Human Food Chapter 5 | |||||||
| C Allergen Cross-contact Anaphylaxis Group; Peanut, Tree nuts, Crustaceans | ✓ | Depend on source/facility/process/human | H | FSPCA Preventive Controls for Human Food Chapter 5 | FSPCA Preventive Controls for Human Food Chapter 5 | |||||||
| C Allergen Cross-contact Non-Anaphylaxis Group | ✓ | Depend on source/facility/process/human | M | FSPCA Preventive Controls for Human Food Chapter 5 | FSPCA Preventive Controls for Human Food Chapter 5 | |||||||
| C Adding Allergen Itself Anaphylaxis Group; Peanut, Tree nuts, Crustaceans | ✓ | Depend on Food Defense Measures | H | Potential Malicious Data | FSPCA Preventive Controls for Human Food Chapter 5 | |||||||
| C Radioactive | ✓ | Depend on sources/process | M or H depend on type | FSPCA Preventive Controls for Human Food Chapter 5 and EPA | FSPCA Preventive Controls for Human Food Chapter 5 and EPA | |||||||
| C Adding Radioactive | ✓ | Depend on Food Defense Measures | M or H depend on type | Potential Malicious Data | FSPCA Preventive Controls for Human Food Chapter 5 and EPA | |||||||
| C Food Safety Fraud | ✓ | Depend on sources/process | L, M, or H depend on chemical substance replacement | FSPCA Preventive Controls for Human Food Chapter 5 and Food Fraud Database | FSPCA Preventive Controls for Human Food Chapter 5 and Food Fraud Database | |||||||
| C Food Safety Fraud | ✓ | Depend on sources/process | L, M, or H depend on sophisticated detection | Food Fraud Database | Food Fraud Database | |||||||
| C Quality undesirable; Off-odour, off-taste | ✓ | Depend on source/facility/process | No score in hazard term for quality fraud, but it can be score as quality impact at M or it can impact as rejection by customers. | FSPCA Preventive Controls for Human Food Chapter 5 | FSPCA Preventive Controls for Human Food Chapter 5 | |||||||
| C Quality Fraud; Non-toxic species switching, Organics, Non-GMO, Halal, Kosher, Global GAP | ✓ | Depend on sources/process/history/nature | No score in hazard term for quality fraud, but it can be score as quality impact at H or it can impact as recall class 3 level defined by FDA. | Food Fraud Database | Food Fraud Database | |||||||
| C Quality Fraud; Non-toxic species switching, Organics, Non-GMO, Halal, Kosher, Global GAP | ✓ | Depend on sources/process | L, M, or H depend on sophisticated detection | Food Fraud Database | Food Fraud Database | |||||||
| P Glass, Plastic, Bone, Wood, Metal | ✓ | Depend on source/facility/process/human | M or H depend on target group | FSPCA Preventive Controls for Human Food Chapter 5 | FSPCA Preventive Controls for Human Food Chapter 5 | |||||||
| P Adding Bones, Glasses, Plastics, Metals | ✓ | Depend on Food Defense Measures | M or H depend on target group | Potential Malicious Data | FSPCA Preventive Controls for Human Food Chapter 5 | |||||||
| P Quality Undesirable; Hair, Insect | ✓ | Depend on source/facility/process | No score in hazard term for quality fraud, but it can be score as quality impact at M or it can impact as rejection by customers. | FSPCA Preventive Controls for Human Food Chapter 5 | FSPCA Preventive Controls for Human Food Chapter 5 | |||||||
| Occurrence 5 × 5 Modified from Adverb of Frequency Scales | Occurrence 4 × 4 Reference from 4 × 4 Rubric Score Definition in FSPCA Preventive Control for Animal Food | Occurrence 3 × 3 Modified from 4 × 4 Rubric Score Definition in FSPCA Preventive Control for Animal Food | Occurrence 4 × 3 Reference from FAO HACCP System and Modified from 4 × 4 Rubric Score Definition in FSPCA Preventive Control for Animal Food |
|---|---|---|---|
| Very High—5 Always, Constantly | High—4 Immediate danger that hazard will occur | High—3 Immediate danger that hazard will occur | High—4 Immediate danger that hazard will occur |
| High—4 Usually, Normally, Regularly, Often | Medium—3 Probably to occur in time if not corrected | Medium—2 Probably or possible to occur in time if not corrected | Medium—3 Probably to occur in time if not corrected |
| Medium—3 Sometimes, Occasionally | Low—2 Possible to occur in time if not corrected | Medium—2 Probably or possible to occur in time if not corrected | Low—2 Possible to occur in time if not corrected |
| Low—2 Rarely, Seldom | Very Low—1 Unlikely to occur; may assume hazards will not occur | Low—1 Unlikely to occur; may assume hazards will not occur | Very Low/Negligible—1 Unlikely to occur; may assume hazards will not occur |
| Very Low—1 Hard ever, Never | Very Low—1 Unlikely to occur; may assume hazards will not occur | Low—1 Unlikely to occur; may assume hazards will not occur | Very Low/Negligible—1 Unlikely to occur; may assume hazards will not occur |
| Severity 5 × 5 Modified from 4 × 4 Rubric Score Definition in FSPCA Preventive Control for Animal Food | Severity 4 × 4 Reference from 4 × 4 Rubric Score Definition in FSPCA Preventive Control for Animal Food | Severity 3 × 3 Modified from 4 × 4 Rubric Score Definition in FSPCA Preventive Control for Animal Food | Severity 4 × 3 Reference from FAO HACCP System | Example Severity Score from FAO HACCP System |
|---|---|---|---|---|
| Very high—An imminent and immediate danger of death or severe illness | High—An imminent and immediate danger of death or severe illness | High—An imminent andimmediate danger of death or severe illness | High—A life threatening | Clostridium botulinum, Salmonella typhi, Listeria monocytogenes, Escherichia coli O157:H7, Vibrio cholerae, Vibrio vulnificus, Paralytic shellfish poisoning, Amnesic shellfish poisoning |
| High—B Danger or illness may be severe, but it is not imminent or immediate | Medium—B Danger or illness may be severe, but it is not imminent or immediate | Medium—B Danger or illness may be severe, but it is not imminent or immediate | Medium—B Severe or chronic | Brucella spp., Campylobacter spp., Salmonella spp., Streptococcus type A, Yersinia enterocolitica, Hepatitis A virus, Mycotoxins, Ciguatera toxin |
| Medium—C Illness or injury may occur, but impact is reversible | Low—C Illness or injury may occur, but impact is reversible | Low—C Illness or injury may occur, but impact is reversible, or illness or injury is minor | Low—C Moderate or mild | Bacillus spp., Clostridium perfringens, Staphylococcus aureus, Norwalk virus, most parasites, Histamine-like substances, and most heavy metals that cause mild acute illness. |
| Low—D Illness or injury is minor | Very Low—D Illness or injury is minor | Low—C Illness or injury may occur, but impact is reversible, or illness or injury is minor | Low—C Moderate or mild | Bacillus spp., Clostridium perfringens, Staphylococcus aureus, Norwalk virus, most parasites, Histamine-like substances, and most heavy metals that cause mild acute illness. |
| Very low—E No impact | Very low—D Illness or injury is minor | Low—C Illness or injury may occur, but impact is reversible, or illness or injury is minor | Low—C Moderate or mild | Bacillus spp., Clostridium perfringens, Staphylococcus aureus, Norwalk virus, most parasites, Histamine-like substances, and most heavy metals that cause mild acute illness. |
| Hazards | SAHCODHA List as FDA Aug 2015 | 4 × 3 Food Safety Risk Matrix Model Significant | 3 × 3 Food Safety Risk Matrix Model Significant | 5 × 5 Food Safety Risk Matrix Model Significant |
|---|---|---|---|---|
| Food allergens | Yes | Yes | Yes | Yes |
| Salmonella spp. | Yes | Yes | Yes | Yes |
| L. monocytogenes | Yes | No | Yes | Yes |
| E. coli O157:H7 | Yes | Yes | Yes | Yes |
| Clostridium botulinum | Yes | No | Yes | Yes |
| Hepatitis A | Yes | No | No | Yes |
| Cryptosporidium | Yes | No | No | Yes |
| Norovirus | No | No | No | Yes |
| Bacillus cereus | No | No | No | No |
| Staphylococcus aureus | No | No | No | Yes |
| Mycotoxins | No | No | No | No |
| Foreign objects | No | No | No | Yes |
| Pesticides | Not mention | No | No | No |
| Heavy metals | Not mention | No | No | No |
| Radioactive | Not mention | No | No | No |
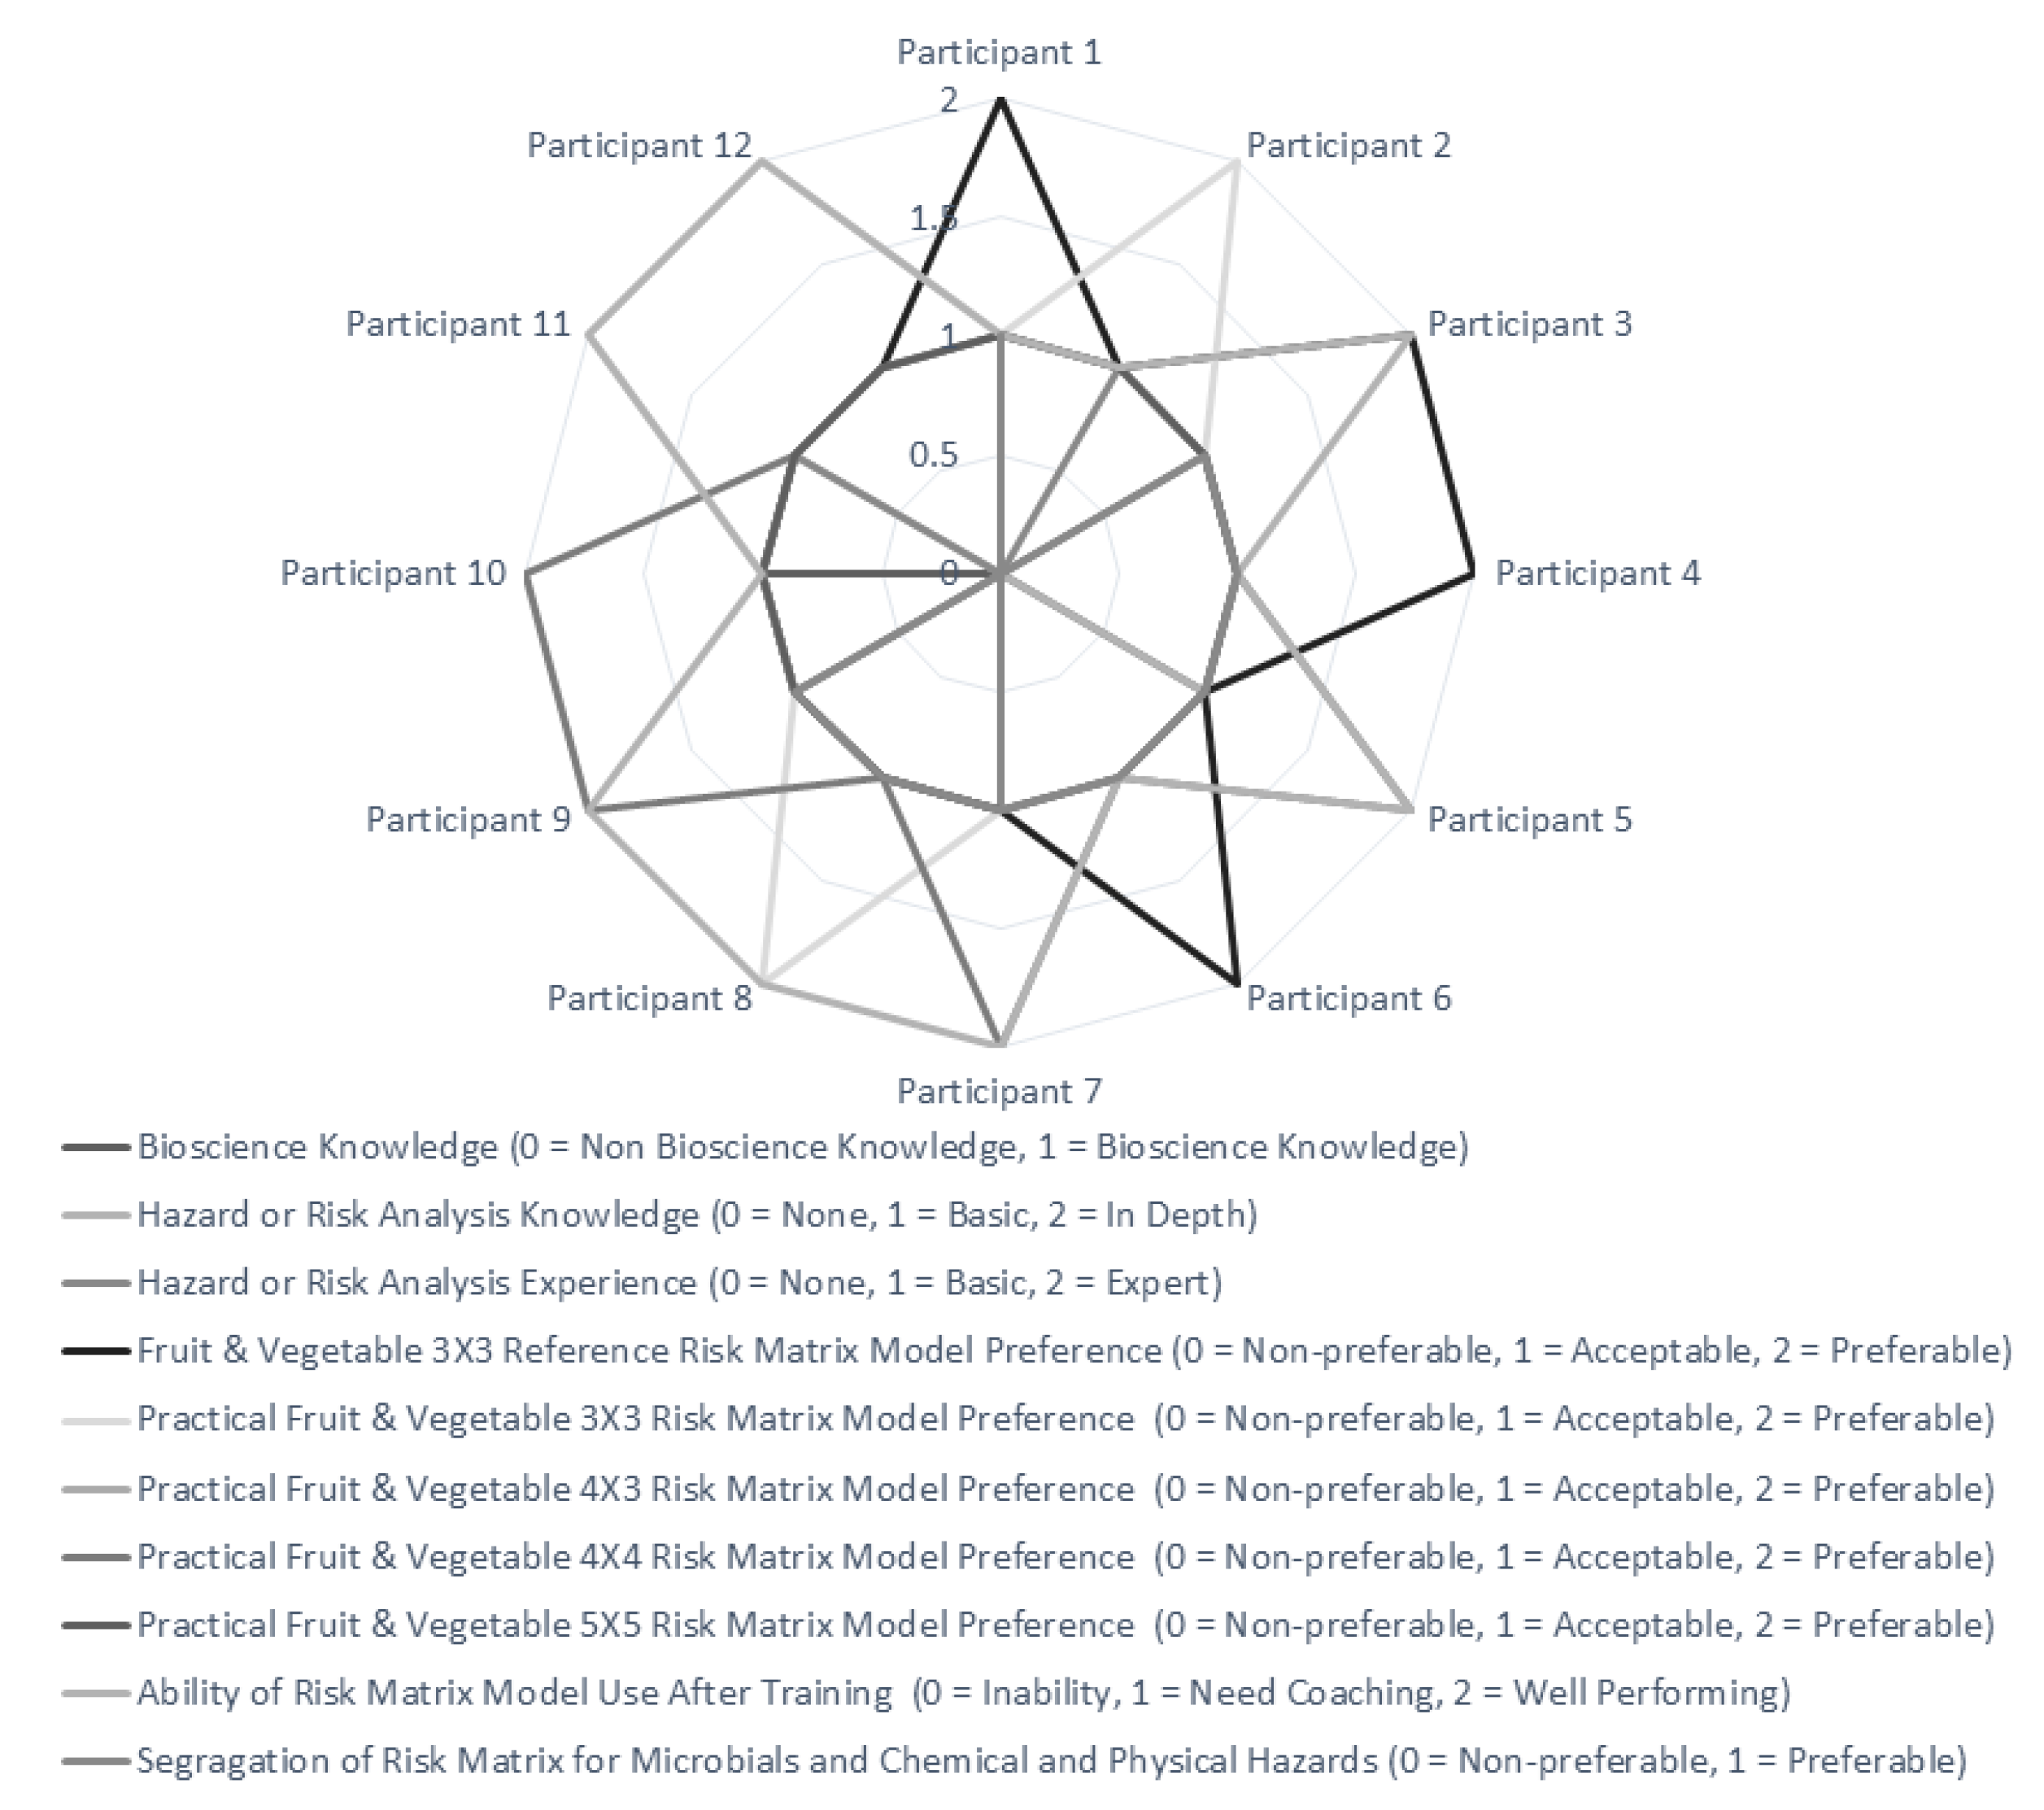
| Factors | Participant 1 | Participant 2 | Participant 3 | Participant 4 | Participant 5 | Participant 6 | Participant 7 | Participant 8 | Participant 9 | Participant 10 | Participant 11 | Participant 12 |
|---|---|---|---|---|---|---|---|---|---|---|---|---|
| Bioscience knowledge (0 = Non-bioscience knowledge, 1 = Bioscience knowledge) | 0 | 0 | 1 | 1 | 1 | 0 | 1 | 0 | 1 | 1 | 0 | 0 |
| Hazard analysis knowledge (0 = None, 1 = Basic, 2 = In Depth) | 1 | 1 | 1 | 1 | 1 | 0 | 1 | 1 | 1 | 1 | 1 | 0 |
| Hazard analysis experience (0 = None, 1 = Basic, 2 = In Depth) | 0 | 1 | 0 | 0 | 0 | 0 | 1 | 0 | 1 | 1 | 1 | 0 |
| Practical fruit and vegetable 3 × 3 reference qualitative food safety risk matrix model preference (0 = Non-preferable, 1 = Acceptable, 2 = Preferable) | 2 | 1 | 2 | 2 | 1 | 2 | 1 | 1 | 1 | 1 | 1 | 1 |
| Practical fruit and vegetable 3 × 3 qualitative food safety risk matrix model preference (0 = Non-preferable, 1 = Acceptable, 2 = Preferable) | 1 | 2 | 1 | 1 | 1 | 1 | 1 | 2 | 1 | 1 | 2 | 2 |
| Practical fruit and vegetable 4 × 3 qualitative food safety risk matrix model reference (0 = Non-preferable, 1 = Acceptable, 2 = Preferable) | 1 | 1 | 1 | 1 | 1 | 1 | 1 | 1 | 1 | 1 | 1 | 1 |
| Practical fruit and vegetable 4 × 4 qualitative food safety risk matrix model preference (0 = Non-preferable, 1 = Acceptable, 2 = Preferable) | 1 | 1 | 1 | 1 | 2 | 1 | 2 | 1 | 2 | 2 | 1 | 1 |
| Practical fruit and vegetable 5 × 5 qualitative food safety risk matrix model preference (0 = Non-preferable, 1 = Acceptable, 2 = Preferable) | 1 | 1 | 1 | 1 | 1 | 1 | 1 | 1 | 1 | 1 | 1 | 1 |
| Ease of qualitative food safety risk matrix model use after training (0 = Inability, 1 = Need coaching, 2 = Well performing) | 1 | 1 | 2 | 1 | 2 | 1 | 2 | 2 | 2 | 1 | 2 | 2 |
| Segregation of food safety risk matrix for biological, chemical and physical Hazards (0 = Non-preferable, 1 = Preferable) | 1 | 0 | 1 | 1 | 1 | 1 | 1 | 1 | 1 | 0 | 0 | 0 |
| Items | References | Criteria | Before Rinsing in Water with 150 ppm Chlorine Residue | After Rinsing in Water with 150 ppm Chlorine Residue | ||||
|---|---|---|---|---|---|---|---|---|
| Sample 1 | Sample 2 | Sample 3 | Sample 1 | Sample 2 | Sample 3 | |||
| TPC | Microbiological criteria in food and food contact materials no. 3 B. E. 2560 by Department of Medical Science, Thailand | <1 × 10⁶ cfu/g | 3.3 × 10⁶ | 1.8 × 10⁶ | 9.8 × 10⁶ | 3.7 × 10⁵ | 6.4 × 10⁴ | 5.8 × 10⁴ |
| E. coli | <100 cfu/g | <3.0 | <3.0 | <3.0 | <3.0 | <3.0 | <3.0 | |
| Salmonella spp. | Not detected in 25 g | Not detected | Not detected | Not detected | Not detected | Not detected | Not detected | |
| Listeria monocytogenes | Not detected in 25 g | Not detected | Not detected | Not detected | Not detected | Not detected | Not detected | |
| Staphylococcus aureus | <100 cfu/g | <10 | <10 | <10 | <10 | <10 | <10 | |
| 4 Groups Pesticide | The Notification of Ministry of Public Health, Thailand no. 387 B. E. 2560 | Not over maximum residues level | Not detected | Not detected | Not detected | Not detected | Not detected | Not detected |
| Physical | Entrepreneur’s criteria | No filth | None | None | None | None | None | None |
Publisher’s Note: MDPI stays neutral with regard to jurisdictional claims in published maps and institutional affiliations. |
© 2022 by the authors. Licensee MDPI, Basel, Switzerland. This article is an open access article distributed under the terms and conditions of the Creative Commons Attribution (CC BY) license (https://creativecommons.org/licenses/by/4.0/).
Share and Cite
Surareungchai, S.; Borompichaichartkul, C.; Rachtanapun, C.; Pongprasert, N.; Jitareerat, P.; Srilaong, V. Comparison of Risk Assessment Schemes in GHPs and HACCP, FSMA Preventive Controls for Human Food, ISO 22000, and GFSI Recognized Standards with Risk Scoring Guidance in General Use with Fresh Produce. Horticulturae 2022, 8, 181. https://doi.org/10.3390/horticulturae8020181
Surareungchai S, Borompichaichartkul C, Rachtanapun C, Pongprasert N, Jitareerat P, Srilaong V. Comparison of Risk Assessment Schemes in GHPs and HACCP, FSMA Preventive Controls for Human Food, ISO 22000, and GFSI Recognized Standards with Risk Scoring Guidance in General Use with Fresh Produce. Horticulturae. 2022; 8(2):181. https://doi.org/10.3390/horticulturae8020181
Chicago/Turabian StyleSurareungchai, Suwimol, Chaleeda Borompichaichartkul, Chitsiri Rachtanapun, Nutthachai Pongprasert, Pongphen Jitareerat, and Varit Srilaong. 2022. "Comparison of Risk Assessment Schemes in GHPs and HACCP, FSMA Preventive Controls for Human Food, ISO 22000, and GFSI Recognized Standards with Risk Scoring Guidance in General Use with Fresh Produce" Horticulturae 8, no. 2: 181. https://doi.org/10.3390/horticulturae8020181
APA StyleSurareungchai, S., Borompichaichartkul, C., Rachtanapun, C., Pongprasert, N., Jitareerat, P., & Srilaong, V. (2022). Comparison of Risk Assessment Schemes in GHPs and HACCP, FSMA Preventive Controls for Human Food, ISO 22000, and GFSI Recognized Standards with Risk Scoring Guidance in General Use with Fresh Produce. Horticulturae, 8(2), 181. https://doi.org/10.3390/horticulturae8020181