Article

Metabolic Profiling of Organic Acids Reveals the Involvement of HuIPMS2 in Citramalic Acid Synthesis in Pitaya

1
Guangdong Provincial Key Laboratory of Postharvest Science of Fruits and Vegetables/Key Laboratory of Biology and Genetic Improvement of Horticultural Crops (South China), Ministry of Agriculture and Rural Affairs, College of Horticulture, South China Agricultural University, Guangzhou 510642, China
2
Zhanjiang Research Center, Institute of Nanfan & Seed Industry, Guangdong Academy of Sciences, Zhanjiang 524300, China
*
Author to whom correspondence should be addressed.
These authors contribute equally to this work.
Horticulturae 2022, 8(2), 167; https://doi.org/10.3390/horticulturae8020167
Submission received: 11 December 2021 / Revised: 13 February 2022 / Accepted: 14 February 2022 / Published: 16 February 2022
(This article belongs to the Collection Advances in Fruit Quality Formation and Regulation)

Abstract

:
Pitayas are rich in organic acids, especially citramalic acid, which is significantly higher than the plants. However, the mechanism of citramalic acid biosynthesis remains to be fully elucidated. In this study, organic acid compositions and contents, as well as expression patterns of key genes related to organic acid metabolism were analyzed during fruit maturation of four different pitaya cultivars i.e., ‘Guanhuabai’ (GHB), ‘Guanhuahong’ (GHH), ‘Wucihuanglong’ (WCHL), and ‘Youcihuanglong’ (YCHL). The total organic acid contents increased first and then declined during fruit maturation. The main organic acids were citramalic acid during the early stages of GHB, GHH, and WCHL pitayas, and dominated by malic acid as fruit maturation. In comparison, citric acid and malic acid were main organic acid for ‘YCHL’ pitaya. Citramalate synthase (IPMS) was involved in the synthesis of citramalic acid, and three types of HuIPMS i.e., HuIPMS1, HuIPMS2, and HuIPMS3, were obtained in our study. Highest expression levels of HuIPMS1 were detected in sepals, while HuIPMS2 and HuIPMS3 exhibited preferential expression in tender stems and ovaries. The expression levels of HuIPMS2 and HuIPMS3 were positively correlated with the content of citramalic acid in the four pitaya cultivars. HuIPMS2 was a chloroplast-localized protein, while HuIPMS3 presented a cytoplasmic-like and nuclear subcellular localization. These findings provide an important basis for further understanding of the molecular mechanism that leads to citramalic acid metabolism during pitaya fruit maturation.

1. Introduction

Organic acids are important components of fruit flavor and nutritional quality which plays key roles in digestion and appetite. The types and ratios of organic acid components are responsible for fruit sourness and taste, and their differences contribute to unique flavors. Organic acids participate in the tricarboxylic acid cycle (TCA) and amino acid metabolism, and are further converted into sugars and esters [1]. The content of organic acids is usually higher in the early stages of fruit development, and is consumed as a respiratory substrate during fruit ripening [2]. Citric acid and malic acid are the main types of organic acids in most fruits [3,4]. The organic acid metabolism of fruits is relatively complex, involving a multi-enzyme system such as citrate synthase (CS, EC 4.1.3.7), aconitase (ACO, EC 4.2.1.3), NAD-isocitrate dehydrogenase (NAD-IDH, EC 1.1.1.41), NAD-malate dehydrogenase (NAD-MDH, EC 1.1.1.37), malate synthetase (MS, EC 4.1.3.2), phosphoenolpyruvate carboxylase (PEPC, EC 4.1.1.31), and NADP-malic enzyme (NADP-ME, EC 1.1.1.40) [3,5].
Citramalic acid (citramalate), an uncommon organic acid in plants, was first discovered in apple peel in 1953 [6]. Citramalic acid is derived from acetyl-CoA and pyruvate with a condensation reaction catalyzed by citramalate synthase (IPMS/CIMA, EC 4.1.3.22) both in plants and bacteria [7,8], or through the methylation of malic acid [9]. The first CIMA was cloned from Methanocaldococcus jannaschii, which is likely involved in the biosynthesis of isoleucine [10]. Citramalic acid serves as a five-carbon precursor for the chemical synthesis of methacrylic acid. It can be converted into methacrylic acid by catalytic decarboxylation and dehydration reactions [11], which can be polymerized into polymer materials which are widely used in the manufacture of building materials and medical equipment [12,13,14,15]. Citramalic acid can also be used as a suitable raw material for pharmaceutical production to synthesize 15-deoxy-16(S)-hydroxy-16-prostaglandin [16]. In the food industry, citramalic acid is used as an acidulant for soft drinks and production of citraconic acid [17]. High citramalic acid concentration is responsible for the unique sensory properties of industrial sake brewed with the Km67 yeast strain [18]. However, the pathway of citramalic acid synthesis remains to be fully elucidated.
Pitaya (pitahaya or dragon fruit) belonging to the genus Hylocereus or Selenicereus of the Cactaceae family, originates from North, Central, and South America [19]. It is rich in dietary fiber, proteins, vitamins, minerals, organic acids, polyphenols, and betalains [20]. Citramalic acid was identified for the first time in the pulp of Hylocereus species [21]. Citramalic acid is the main organic acid with high content at the early fruit development stage of pitaya, suggesting the possibility of pitaya to become a natural source of citramalic acid [22]. However, no information is available about citramalic acid synthesis in pitaya. In this study, compositions of organic acids were assayed in different fruit developmental stages of ‘Guanhuabai’, ‘Guanhuahong’, ‘Wucihuanglong’, and ‘Youcihuanglong’ pitayas. Moreover, genes related to organic acid metabolism and subcellular localization of various HuIPMSs were analyzed. The present study provides insights of the key candidate genes involved in organic acid metabolism which can be used for fruit quality improvement in pitaya.

2. Materials and Methods

2.1. Plant Materials

In this study, four pitaya cultivars with different peel or pulp colors i.e., ‘Guanhuabai’ (‘GHB’, red peel with white pulp, H. undatus), ‘Guanhuahong’ (‘GHH’, red peel with red pulp, H. monacanthus), ‘Wucihuanglong’ (‘WCHL’, no thorns, yellow peel with white pulp, H. undatus), and ‘Youcihuanglong’ (‘YCHL’, thorns, yellow peel with white pulp, H. megalanthus) pitaya cultivars (Figure S1) were used as materials. Plants were cultivated in a commercial orchard from Madong Village, Baiyun District, Guangzhou City, Guangdong Province, China. In total, seven fruit developmental stages (S1–S7) of ‘GHH’ and ‘GHB’ (15, 17, 19, 23, 25, 27, and 32 days after artificial pollination, DAAP), ‘WCHL’ (14, 17, 19, 23, 25, 27, and 29 DAAP), and ‘YCHL’ (23, 35, 45, 55, 65, 70, and 75 DAAP) pitayas were collected with three biological repeats. Peels and pulps were separately collected and frozen in liquid nitrogen, then stored at −80 °C until use.
In addition, Nicotiana benthamiana used for subcellular localization were cultivated in a greenroom at 23 °C with a 16 h/8 h day/night photoperiod.

2.2. Determination of Organic Acids

Organic acids were extracted according to the method of Hu et al. [23]. Samples (400 mg) were dissolved in 10 mL 0.2% metaphosphoric acid (pre-cooled at 4 °C) and disposed with ultrasonic concussion for 15 min, then centrifuged at 5000× g at 4 °C for 15 min. The supernatant (1 mL) was filtered through a 0.45 µm microporous membrane, then transferred to an injection bottle for HPLC analysis using an Agilent HPLC series chromatograph equipped with a UV detector (Agilent Technologies, Palo Alto, CA, USA). A Shim-packVP-ODSC18 column (5 μm particle size, 4.6 mm × 150 mm) was used with a mobile phase of 0.2% metaphosphoric acid at a flow rate of 1.0 mL/min. The column temperature was 35 °C, with an injection volume of 10 µL. Standard samples were produced with malic acid, citric acid, citramalic acid, oxalic acid, and ascorbic acid mixed with 0.2% metaphosphoric acid at gradient concentrations. The types and contents of organic acids were identified through a comparison of retention time and quantified by peak area.

2.3. RNA Extraction and cDNA Synthesis

Total RNA was extracted using the EASYspin Plus polysaccharide polyphenol complex plant RNA rapid extraction kit (RN53) (Aidlab, Beijing, China) according to the manufacturer’s instructions. RNA integrity and concentration were checked by 1.0% agarose gel and a ScanDrop2 nucleic acid detector (Analytik Jena, Jena, Germany), respectively. Qualified RNA was reverse-transcribed to cDNA using the Evo M-MLV RT Kit (AG11705) (Accurate Biology, Changsha, China).

2.4. Gene Expression Analyses

The RNA-Seq data (PRJNA704510) from four fruit developmental stages of ‘GHH’ and ‘GHB’ pitayas (S2, S4, S5 and S7) were used to draw the heatmap of transcript abundance by TBtools [24]. Specific primers (Table S1) were designed according to the selected sequence of pitaya organic acid metabolism-related enzyme genes using online software BatchPrimer3 v1.0 (http://wheat.pw.usda.gov/demos/BatchPrimer3/; accessed on 12 April 2019). The pitaya Actin(1) was used as the internal reference gene [25], and qRT-PCR analyses were performed on a CFX Connect™ Real-Time PCR Detection System (Bio-Rad, Hercules, CA, USA) using SuperReal Color PreMix (SYBR Green) (FP215) (Tiangen Biotech, Beijing, China) with specific primers (Table S1). All experiments were repeated in triplicate. Gene expression was evaluated by the 2−ΔΔCT method [26].

2.5. Gene Isolation and Sequence Analyses

Based on the annotation files of pitaya genome and transcriptome databases, three candidate IPMS genes i.e., HuIPMS1 (HU06G01828.1), HuIPMS2 (HU08G00711.1), and HuIPMS3 (HU01G02605.1), involved in citramalic acid synthase were obtained. The full length of HuIPMS1, HuIPMS2, and HuIPMS3 were cloned from ‘GHH’ and ‘GHB’ cDNA using pEASY-Blunt Cloning Kits (TransGen Biotech, Beijing, China). DNAMAN 8 (Lynnon Biosoft, Pointe-Claire, QC, Canada) was used to design the amplification primers (Table S1). The basic physical and chemical properties of proteins were predicted using ProtParam (https://web.expasy.org/protparam/; accessed on 20 December 2019) and Pfam database (https://pfam.xfam.org/, accessed on 20 December 2019). Multiple alignments of deduced amino acid sequences were performed using DNAMAN8 software. Phylogenetic trees were constructed by MEGAX using the NJ (Neighbor-Joining) method with 1000 bootstrap replications.

2.6. Subcellular Localization

The PSORT online tool (https://wolfpsort.hgc.jp, accessed on 20 December 2019) was used to predict the subcellular localization of the HuIPMS proteins. The full-length cDNAs of HuIPMS2 and HuIPMS3 were cloned into pC18-35S::eGFP vector (Table S1), introduced into Agrobacterium tumefaciens strain GV3101 (pSoup-p19), and infiltrated into the leaves of N. benthamiana expressing a red fluorescent nuclear marker (Nucleus–RFP) or cell membrane marker (Membrane-RFP). Protoplasts were isolated from injected leaves of N. benthamiana plants after 2 d of cultivation in dark, and the fluorescence was observed by ZEISS LCM-800 confocal microscope (Carl Zeiss, Oberkochen, Germany).

2.7. Statistical Analysis

Statistical significance was determined by Duncan’s multiple comparison tests at p < 0.05 or p < 0.01 using SPSS 26.0 (IBM, Chicago, IL, USA). Graphpad Prism 8.0 (GraphPad, Bethesda, MD, USA) was used for statistical analyses and plot graphs.

3. Results

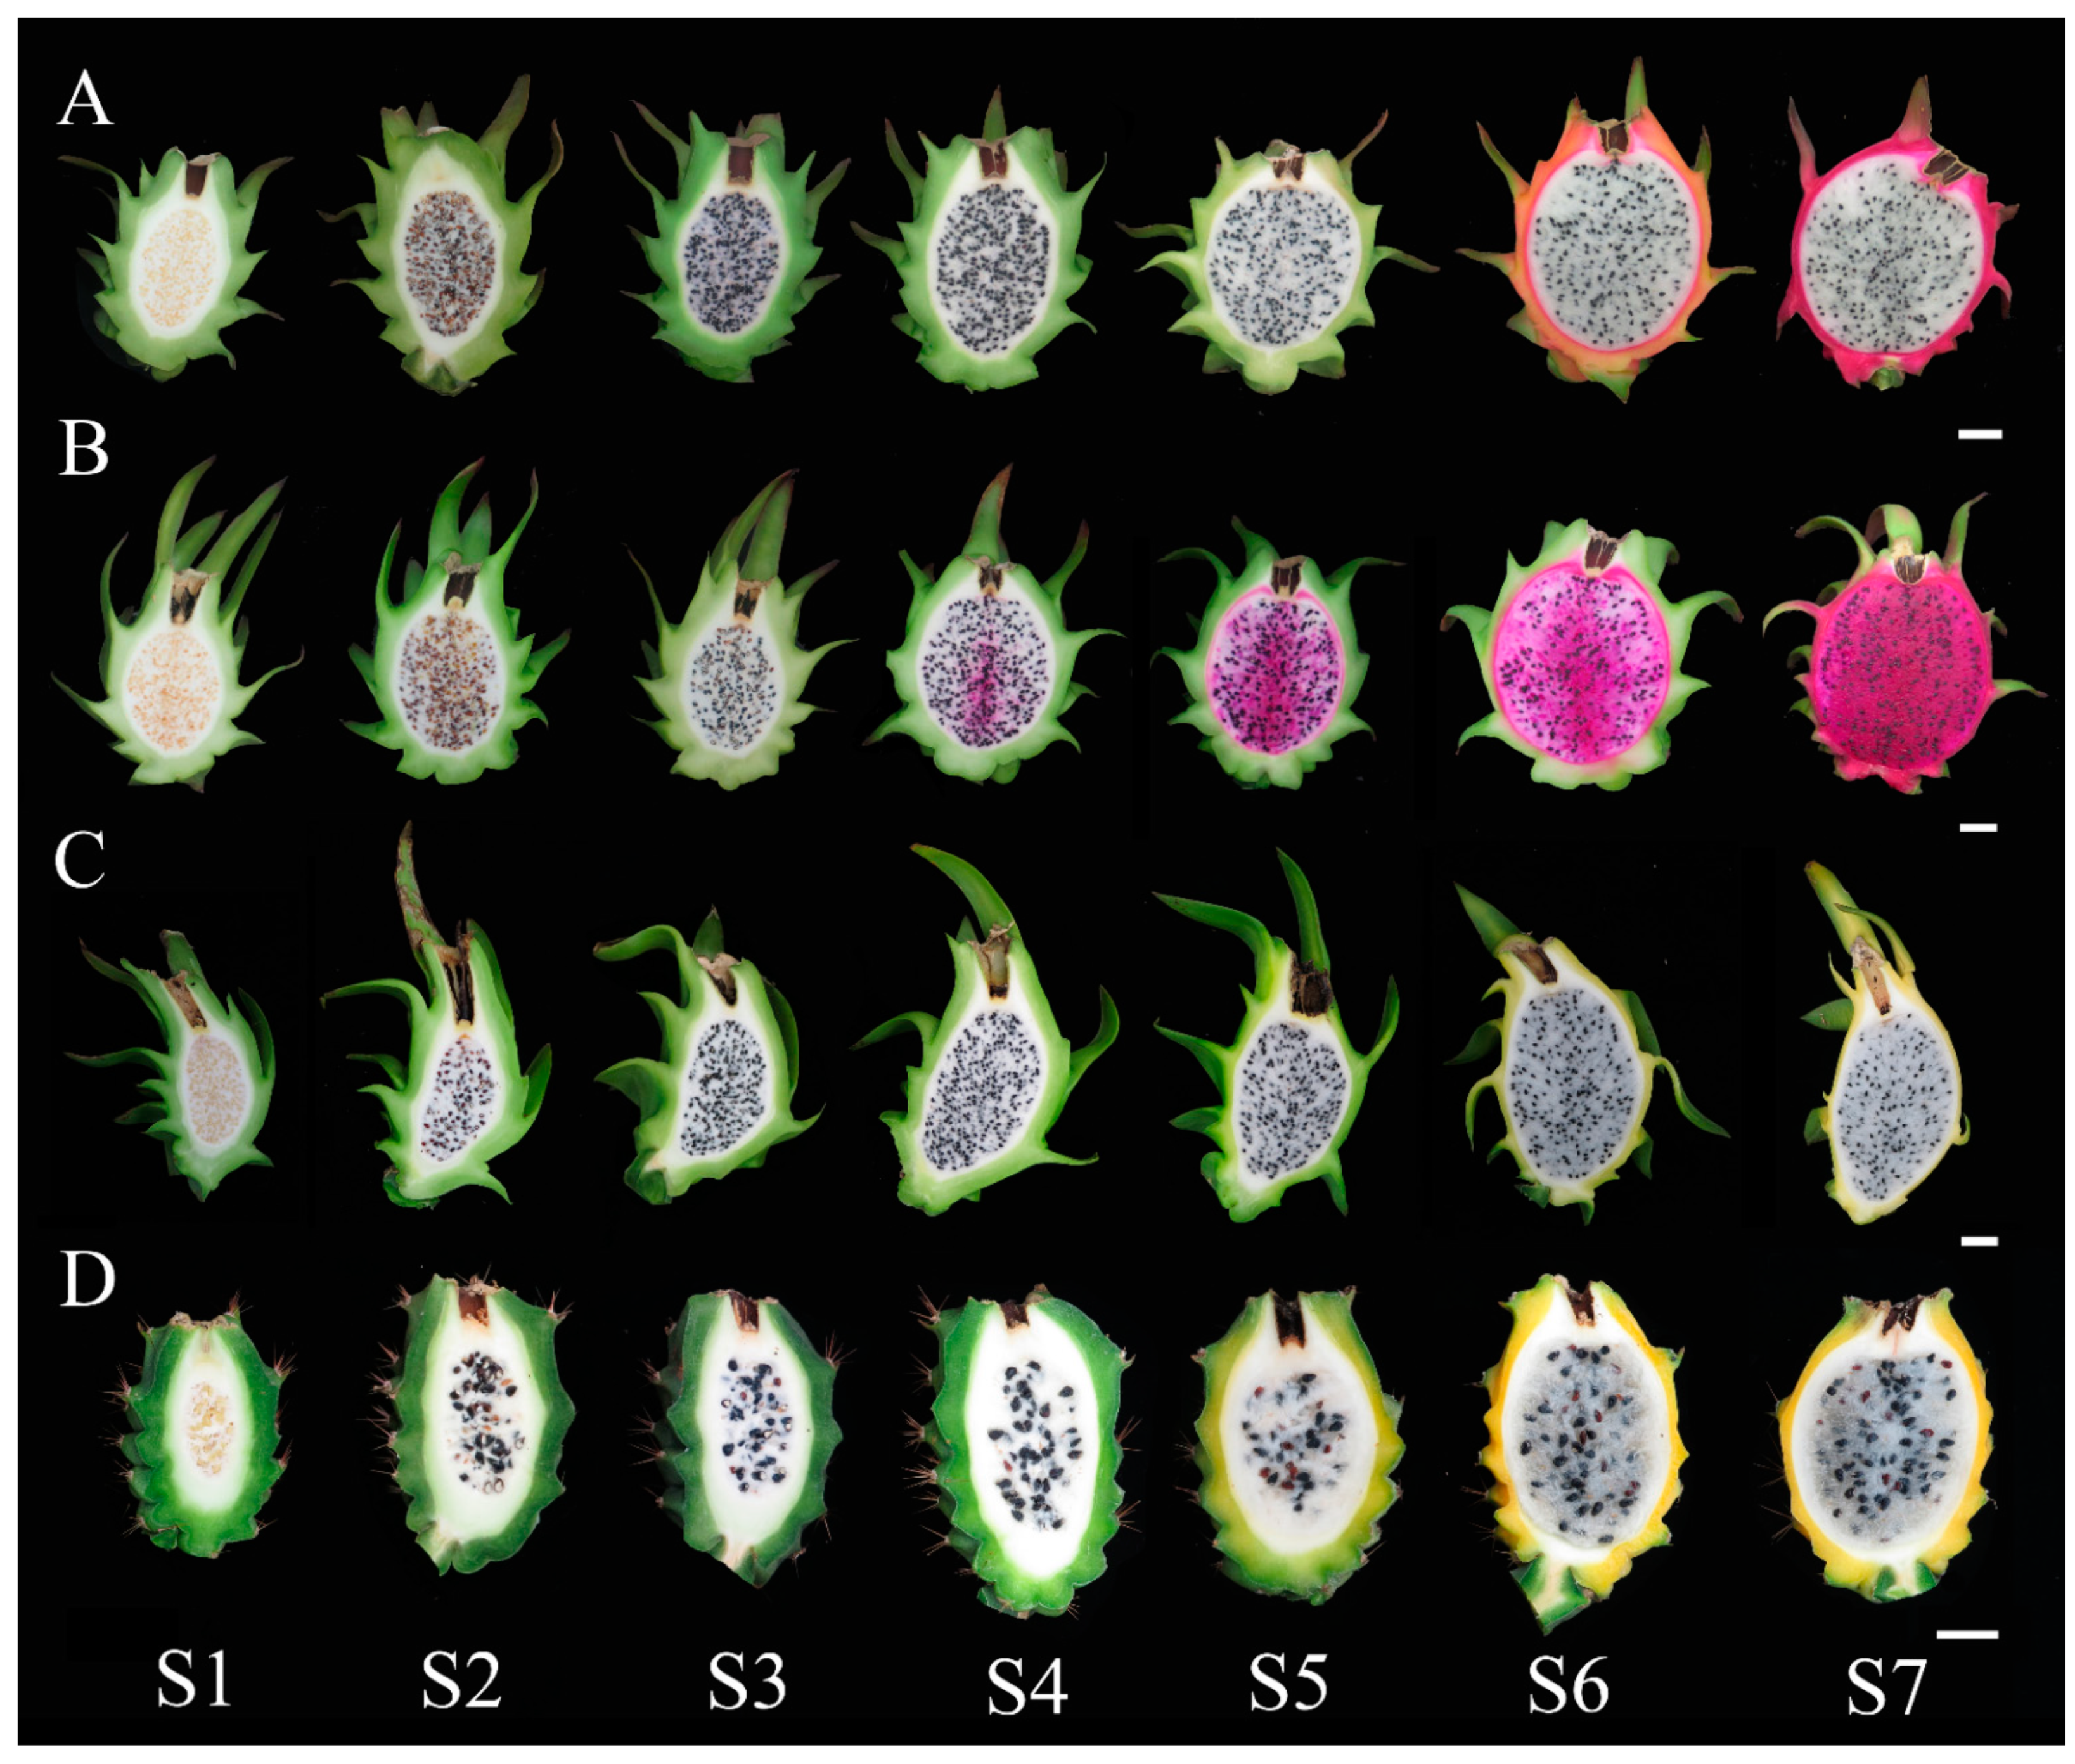
3.1. Changes of Organic Acid Contents during Fruit Development of Pitayas

The organic acid contents were analyzed in pulps from seven fruit developmental stages of ‘GHH’, ‘GHB’ ‘WCHL’, and ‘YCHL’ pitayas (Figure 1). Malic acid contents in the pulps showed a trend of first rising and then falling during fruit development of the four pitaya cultivars (Table 1). In the white pulp cultivars, the malic acid content showed a slowly increasing trend in the early fruit developmental stage (S1–S3), while it decreased slightly in the red pulp cultivars.
During fruit development, the citric acid contents in pulps of the ‘YCHL’ pitaya were significantly higher than that of ‘GHH’, ‘GHB’, and ‘WCHL’ pitayas. However, no citric acid was detected in pulps during the early fruit development stages of ‘GHB’ and ‘WCHL’ pitayas compared with ‘GHB’ and ‘WCHL’ pitayas, which peaked at S6 and S4 DAAP, respectively. With the exception of ‘GHB’ pitaya, citric acid was consistent with that of malic acid in ‘GHH’, ‘YCHL’, and ‘WCHL’ pitayas, which was possibly correlated (Table 1).
Contents of citramalic acid showed an upward trend in the early stage of fruit development of the four cultivars. The highest contents of citramalic acid i.e., 5.93 mg/g and 5.82 mg/g were detected at S3 in ‘GHB’ and ‘WCHL’ pitayas, respectively, and declined thereafter. Citramalic acid in the ‘GHH’ pitaya reached its maximum (4.38 mg/g) at S4. Compared with ‘GHH’, ‘GHB’, and ‘WCHL’ pitayas, lower contents of citramalic acid were detected throughout the fruit development of the ‘YCHL’ pitaya. The highest content of citramalic acid (1.94 mg/g) was obtained at S2 of the ‘YCHL’ pitaya, and then gradually declined thereafter until disappeared after S5 (Table 1).
‘GHH’, ‘GHB’, ‘YCHL’, and ‘WCHL’ pitayas had relatively high levels of oxalic acid at early fruit development, and gradually decreased during fruit maturation. Ascorbic acid showed a downward trend during the fruit development of the four pitaya cultivars (Table 1).

3.2. Changes of Total Organic and Composition Ratios

During the fruit development of the four pitaya cultivars, the total organic acid content in the pulp showed a trend of first rising and then falling, which was similar to that of malic acid. During the first three developmental stages (S1–S3) of ‘GHB’, ‘GHH’, and ‘WCHL’ pitayas, the predominant organic acid was citramalic acid, followed by malic acid. During the mature stage of ‘GHB’, ‘GHH’, and ‘WCHL’ pitayas, the main organic acid was malic acid (accounting for 88.64%, 82.36% and 89.63% of the total acid), followed by citramalic acid (9.93%), citric acid (12.03%), and citric acid (6.83%), respectively (Table 1). Regarding the ‘YCHL’ pitaya, malic acid (37.30%), citric acid (28.00%), and citramalic acid (24.04%) were mainly accumulated at the early stage. The highest content of total organic acids (13.11 mg/g) was detected at S4, and decreased thereafter. Citric acid was the main organic acid during fruit development. During the mature stage, the main organic acids were citric acid (64.67%) and malic acid (28.75%). In the mature fruit, the order of the total organic acid content from high to low was: ‘GHB’ > ‘GHH’ > ‘WCHL’ > ‘YCHL’ (Table 1).

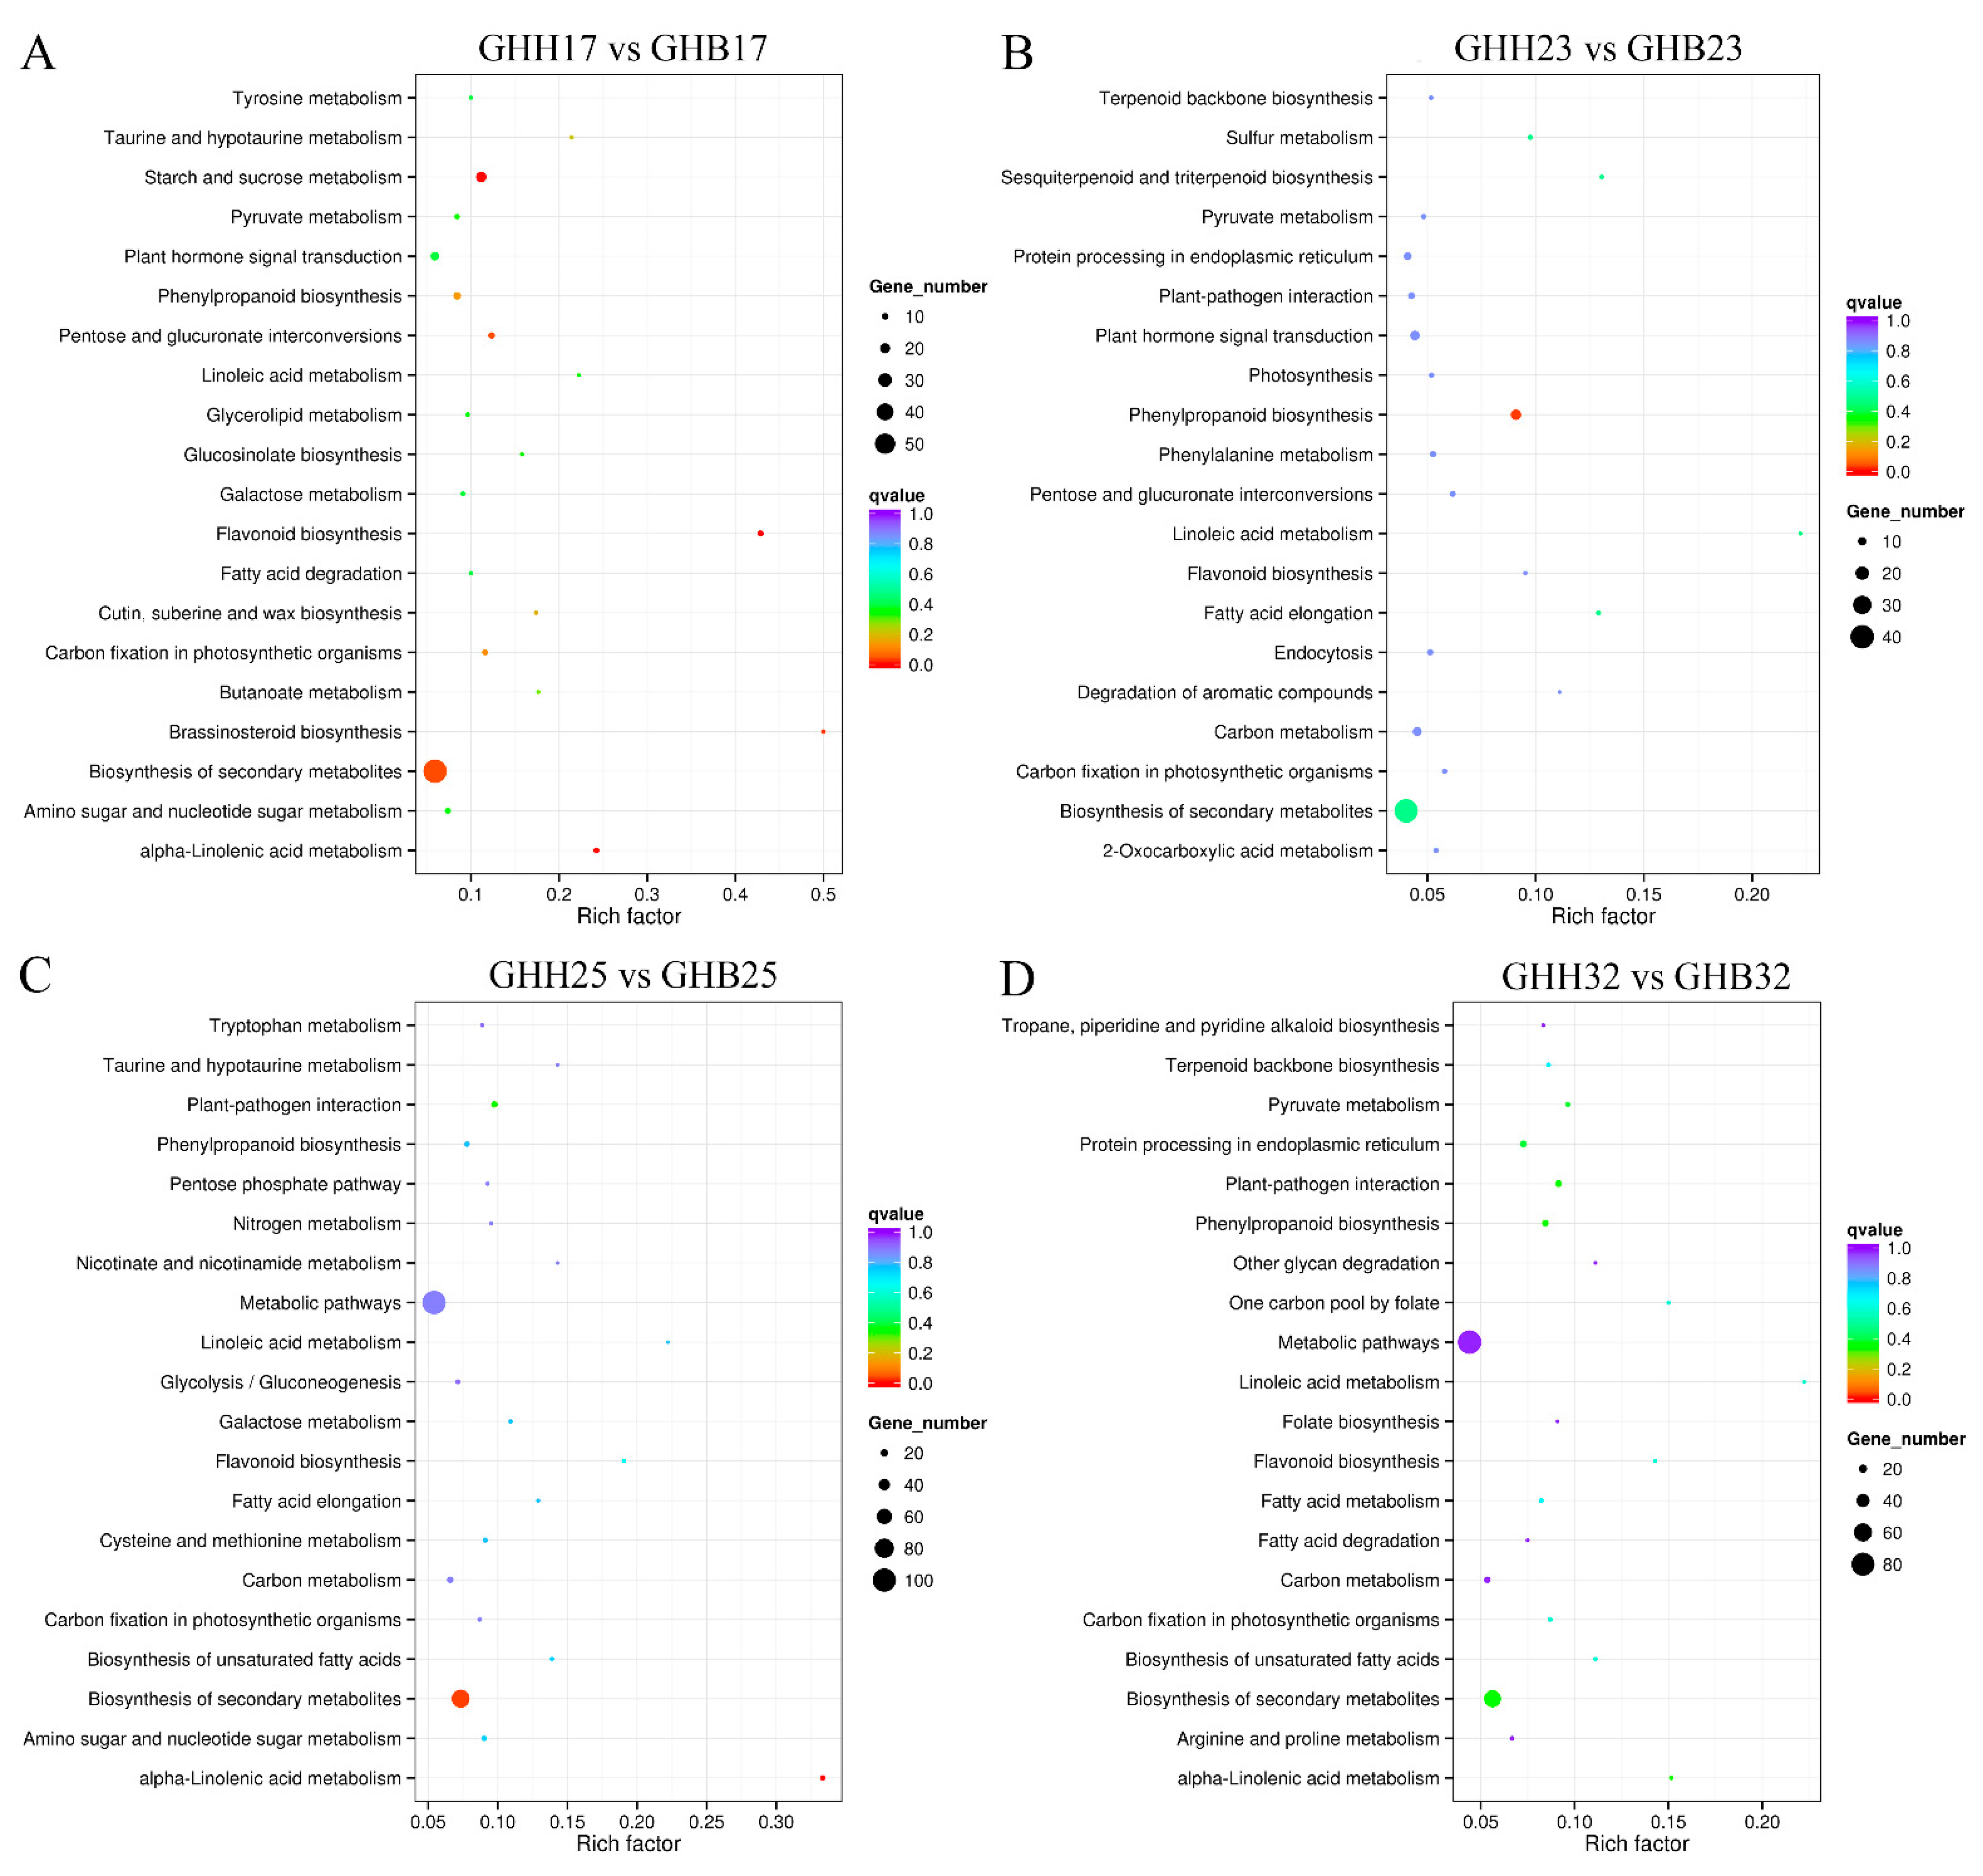
3.3. Analyses of Transcriptome Data of ‘GHB’ and ‘GHH’ Pitayas

Overall, eight transcriptome databases, from GHH17, GHH23, GHH25, and GHH32 (‘Guanhuahong’ at S2, S4, S5, and S7) and GHB17, GHB23, GHB25, and GHB32 (‘Guanhuabai’ at S2, S4, S5, and S7) were constructed. In total, 99.32%, 99.27%, 99.02%, 99.66%, 98.87%, 99.72%, 99.51%, and 99.80% clean reads were respectively achieved after filtering out low-quality, contaminated joints and high unknown bases (Table S2).
In the pitaya transcriptome data, padj < 0.05 was used as the standard to screen differentially expressed genes (DEGs). The comparison between GHB23 vs. GHB17 and GHH23 vs. GHH17 resulted in a total of 581 DEGs (299 up-regulated genes and 282 down-regulated genes), and 1131 DEGs (713 up-regulated genes and 418 down-regulated genes), respectively (Figure S2A,B). Only 75 DEGs (38 up-regulated genes and 37 down-regulated genes) were detected in GHB25 vs. GHB23, while 1256 DEGs (953 up-regulated genes and 303 down-regulated genes) were found in GHH25 vs. GHH23 (Figure S2C,D). A total of 2427 and 1386 genes were differentially expressed in the GHB32 vs. GHB25 and GHH32 vs. GHH25, respectively, among which 941/358 genes were up-regulated, and 1486/1028 genes were down-regulated (Figure S2E,F).
To further study those DEGs involved in biological pathways, the Kyoto Gene and Genome Encyclopedia (KEGG) database was used for DEG classification. The 20 top-ranked pathways were listed in Figure 2. In comparisons of GHH17 vs. GHB17, GHH23 vs. GHB23, GHH25 vs. GHB25, and GHH32 vs. GHB32, the highest number of enriched DEGs referred to metabolic pathways and biosynthesis of secondary metabolites. Pyruvate metabolism and carbon metabolism including synthesis of acetyl-CoA, malic acid, and citric acid were found, indicating differences in organic acid metabolism between ‘GHH’ and ‘GHB’ pitaya fruit at different stages.

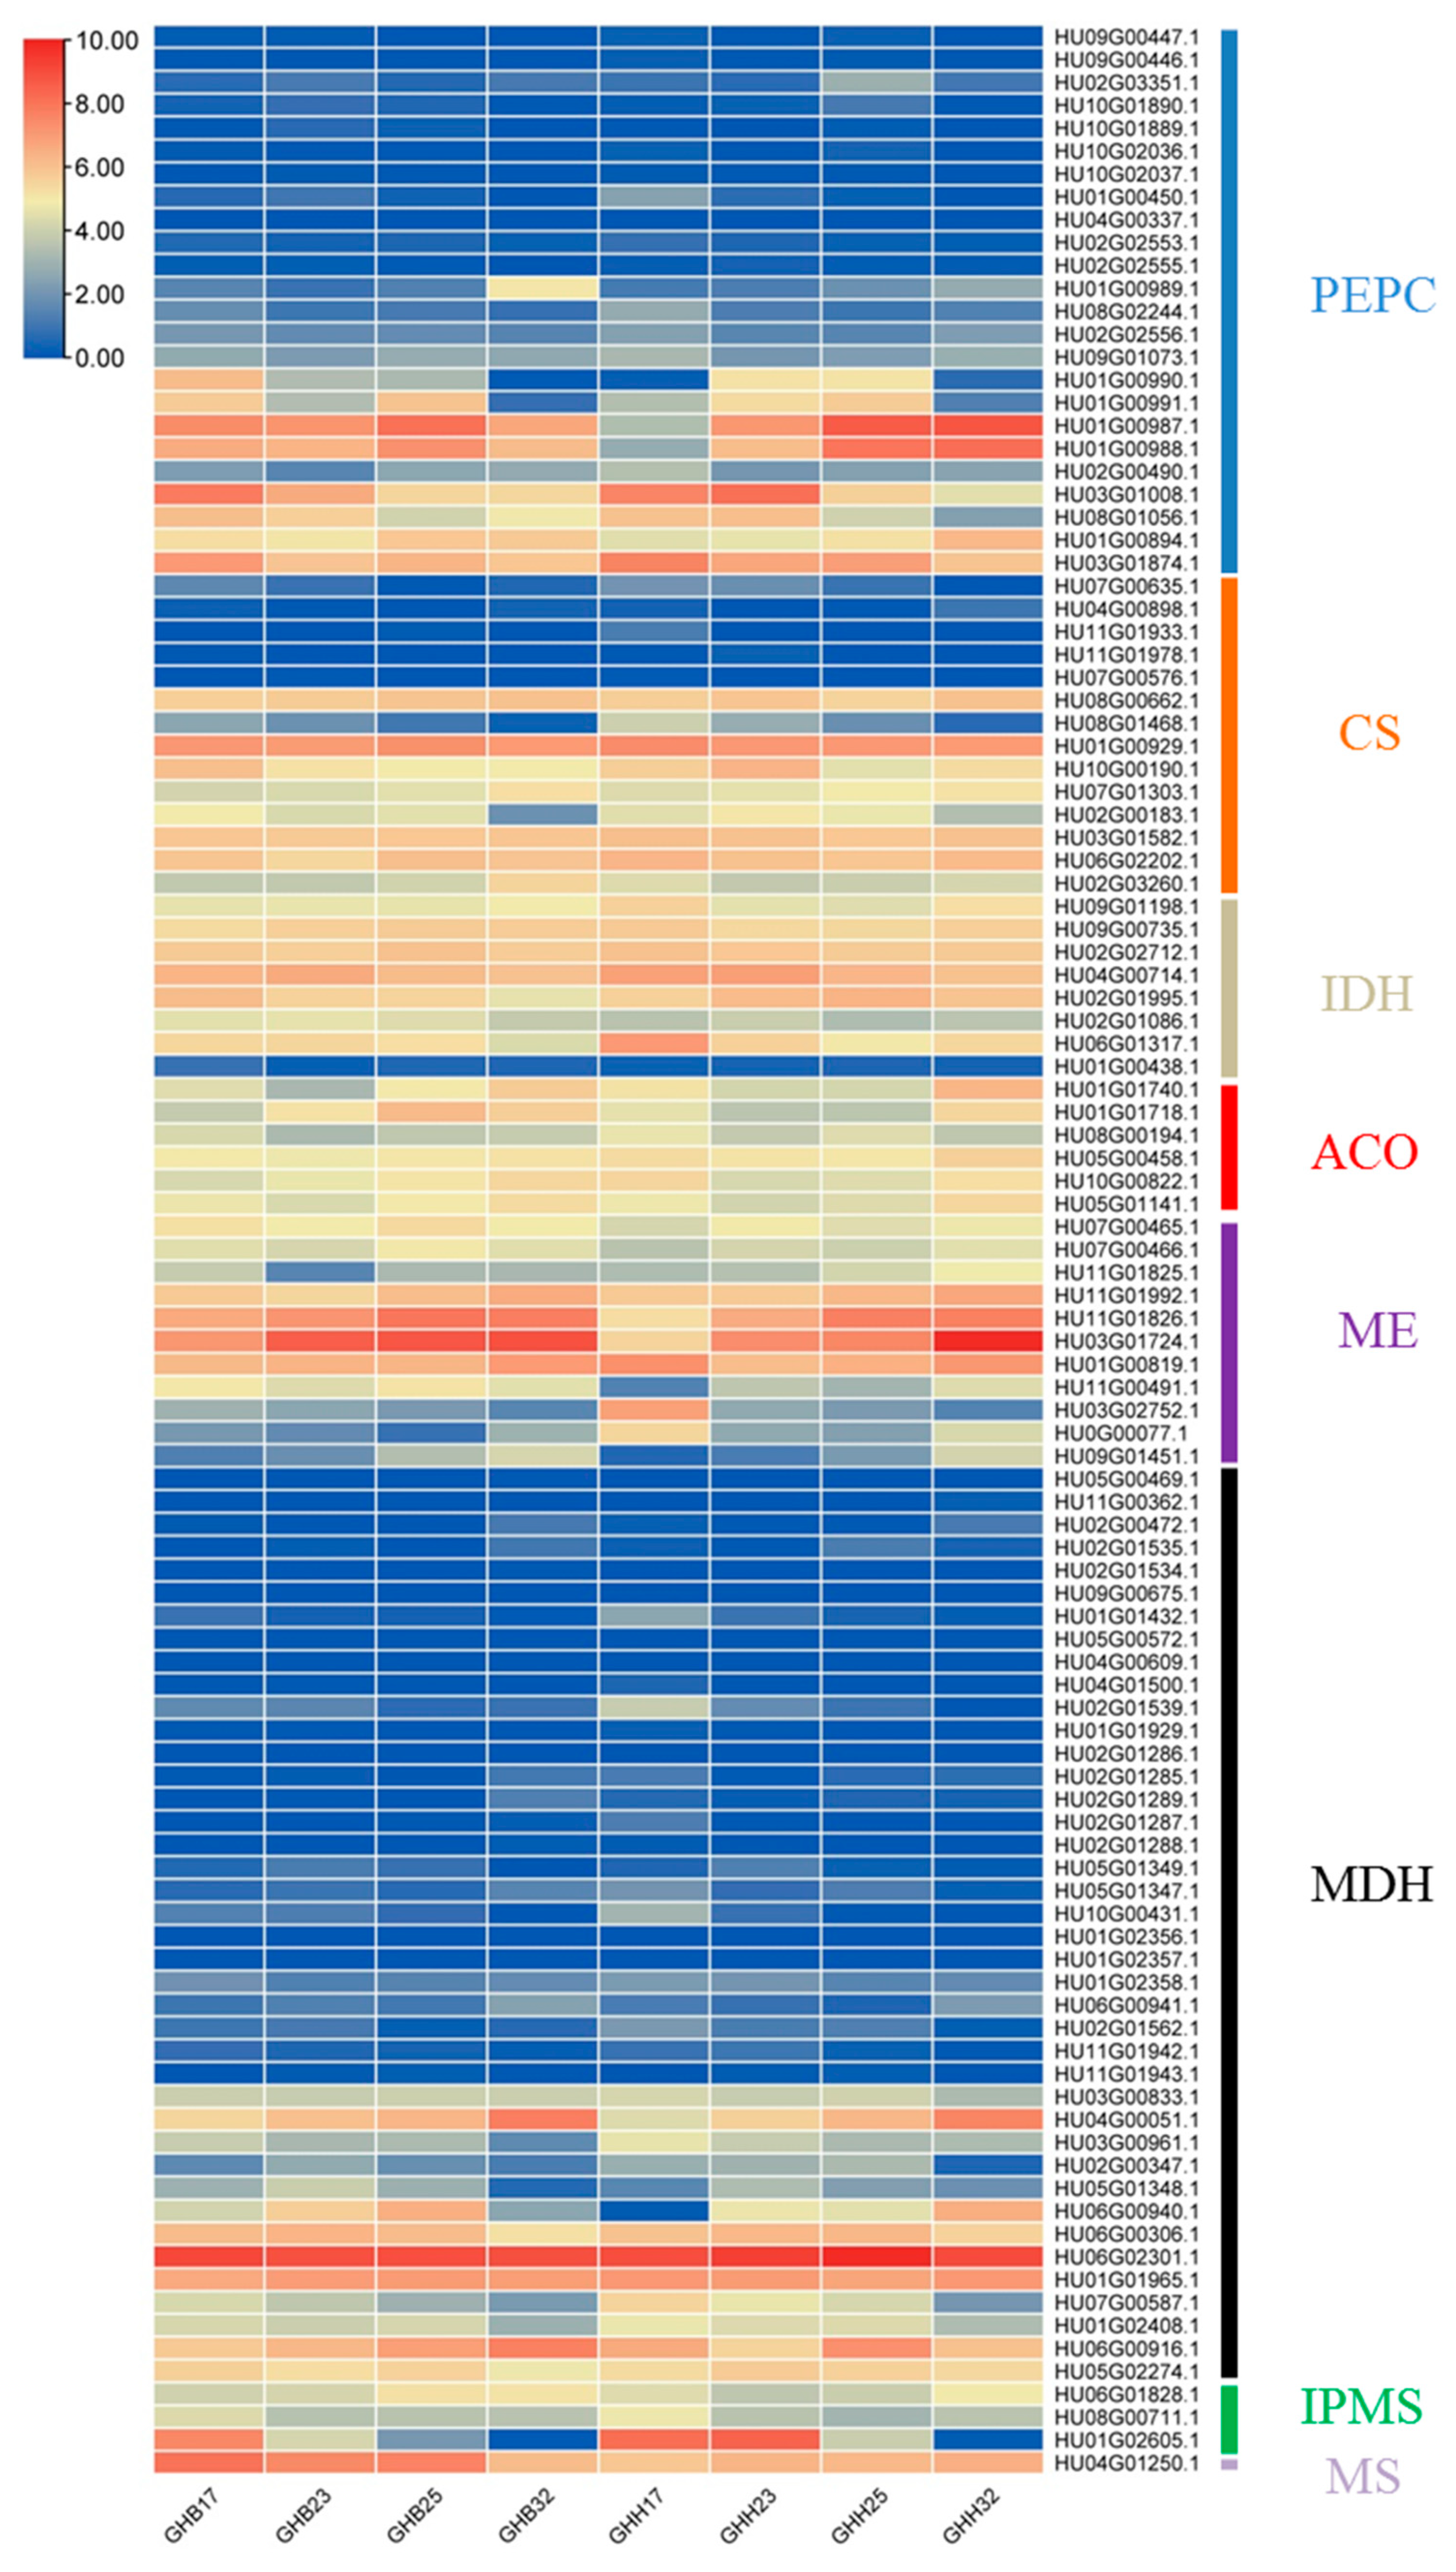
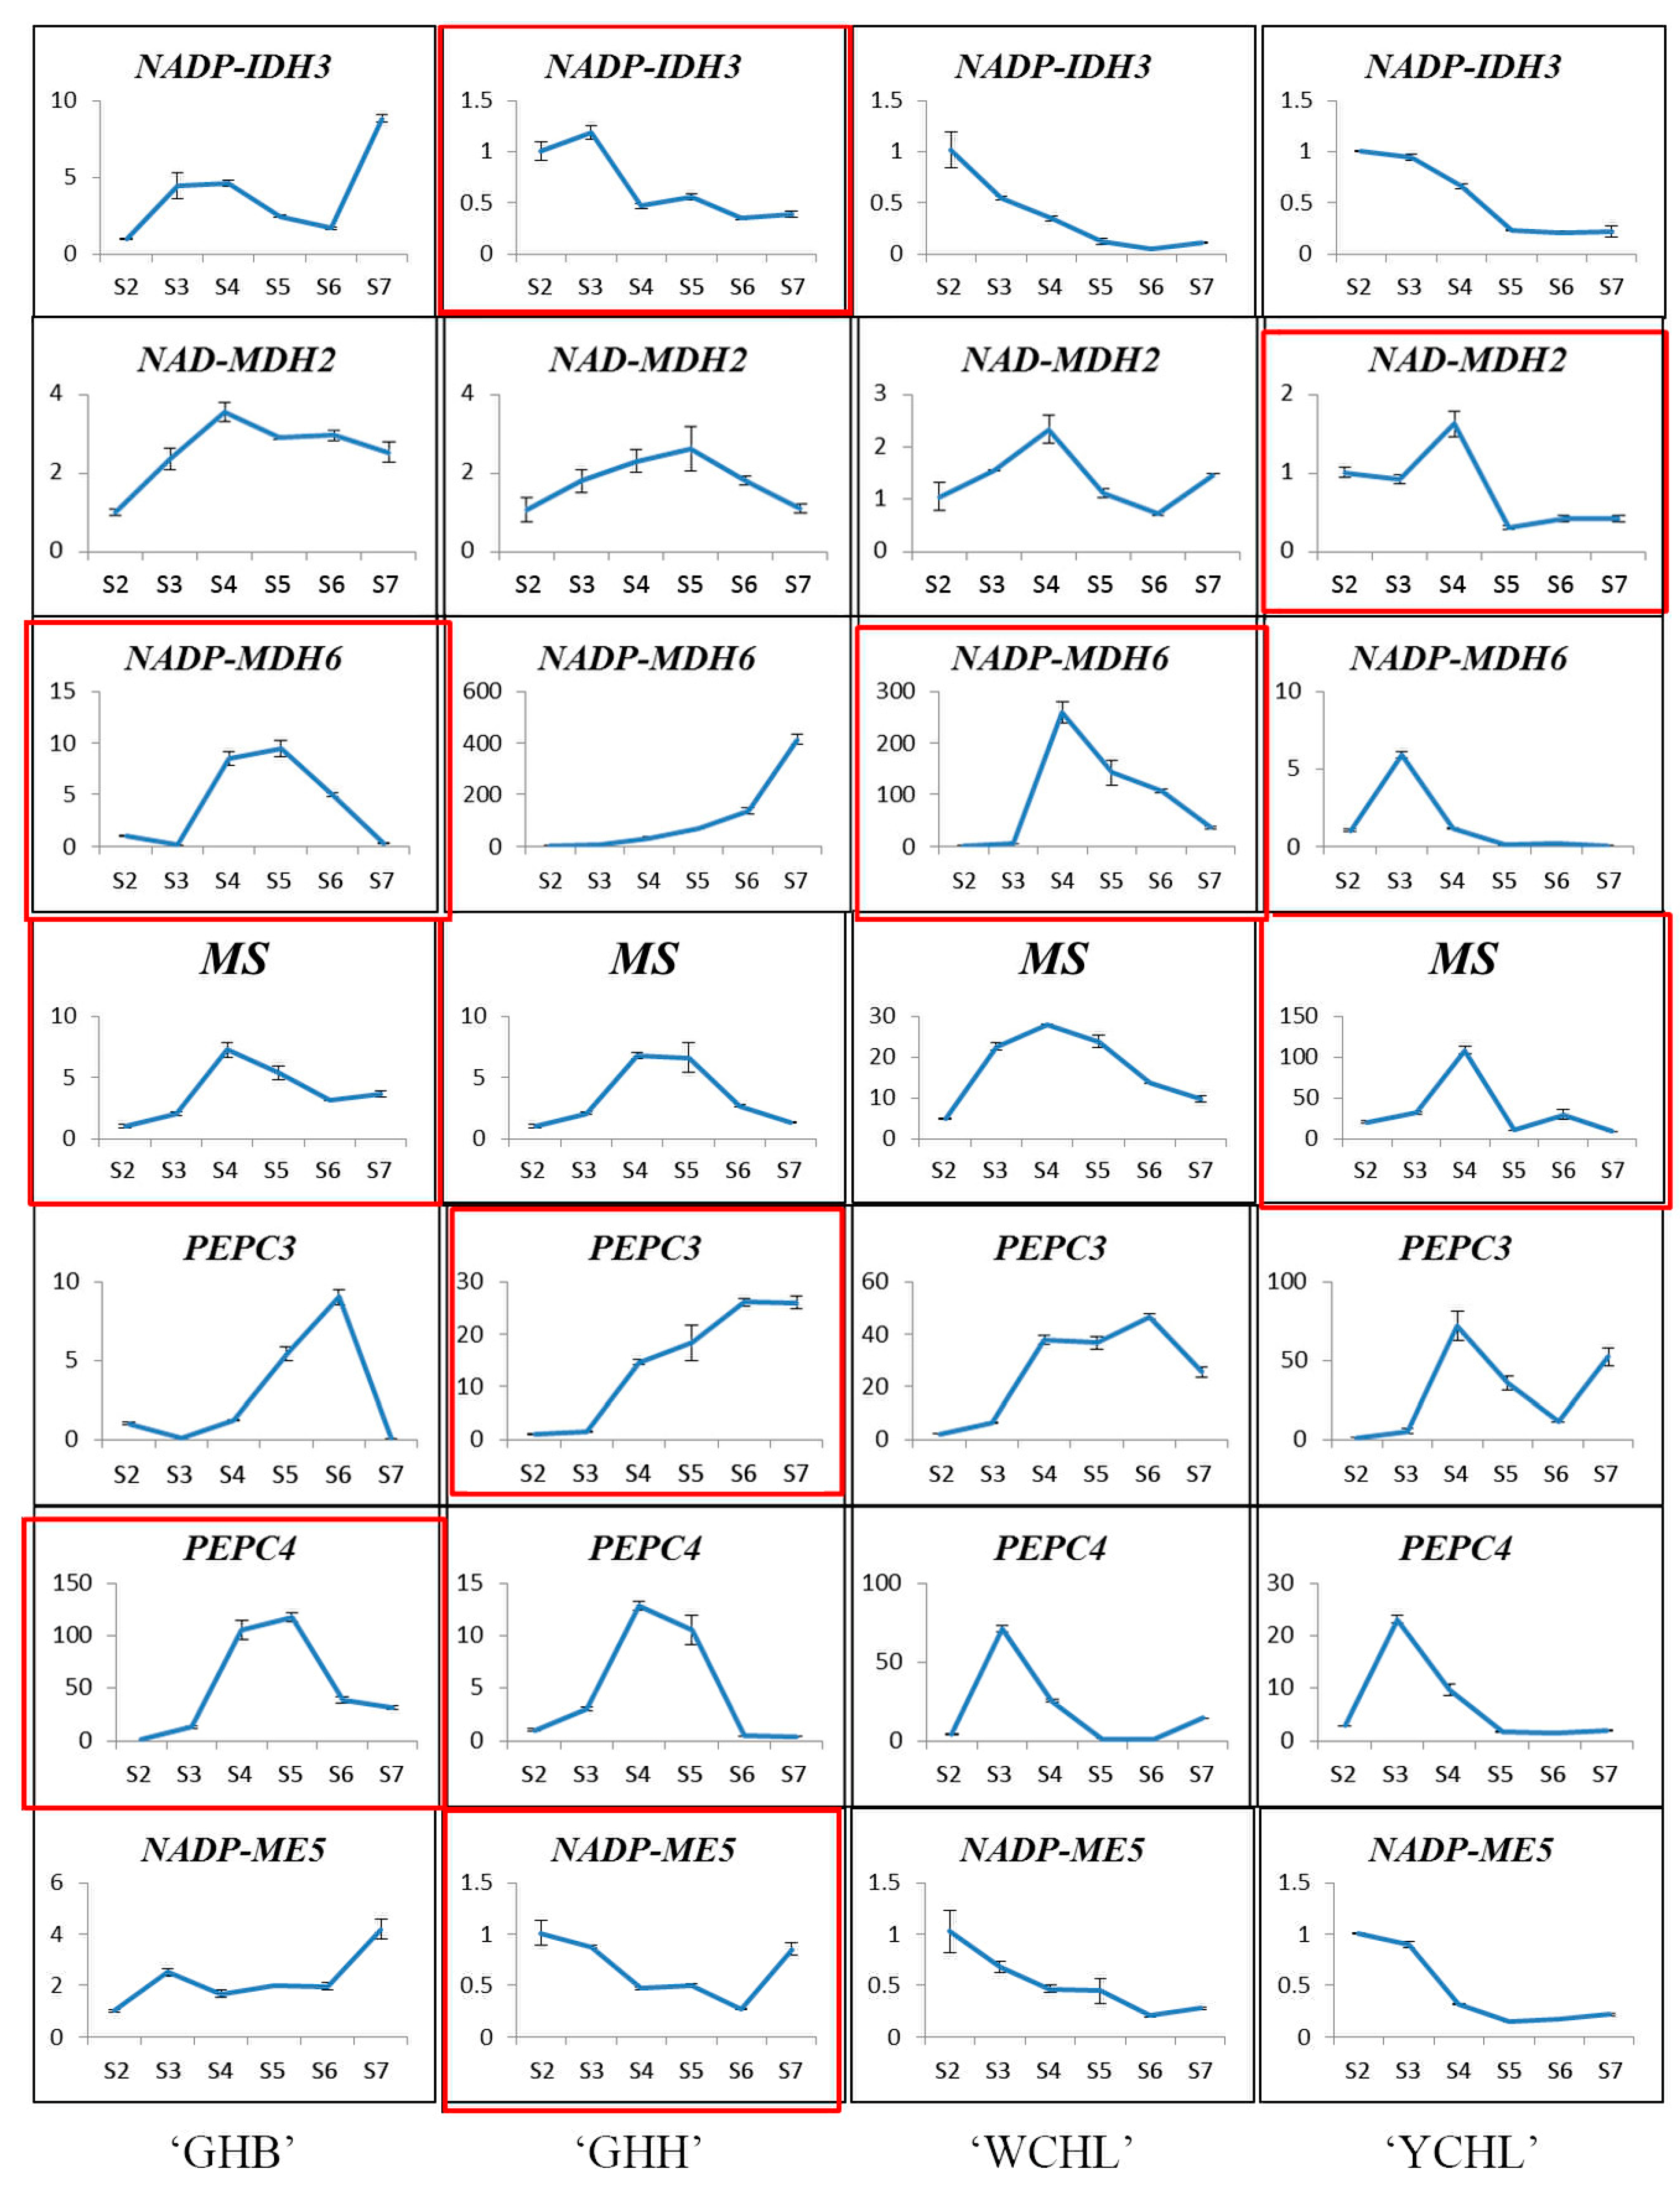
3.4. Expression Analyses of Organic Acid Metabolism-Related Genes

To explore the mechanism of organic acid accumulation in pitaya, 14 citrate synthase (CS) genes, eight isocitrate dehydrogenase (IDH) genes, six aconitase (ACO) genes, 40 malate dehydrogenase (MDH) genes, 11 malic enzymes (ME) genes, 24 phosphoenolpyruvate carboxykinase (PEPC) genes, one malate synthase (MS) gene, and three 2-isopropylmalate synthase (IPMS) genes were identified based on the functional annotations of the pitaya genome and transcriptome database. A heatmap was drawn according to the FPKM value of the corresponding gene in the transcriptome database at different fruit developmental stages (Figure 3).
After removal of low expressed genes in the ‘GHB’ and ‘GHH’ pitaya transcriptome database, nine CSs, five ACOs, three NAD-IDHs, three NADP-IDHs, seven NAD-MDHs, six NADP-MDHs, five NAD-MEs, six NADP-Mes, seven PEPCs, one MS, and three IPMSs were selected for further analyses. The citric acid content in the ‘GHH’ pulp was significantly negatively correlated with NADP-IDH3 gene expression, while malic acid content was significantly negatively correlated with NADP-ME5 and PEPC3 expression during fruit maturation. In the ‘GHB’ pitaya, the changes of NADP-MDH6 and PEPC4 were significantly positively correlated with malic acid, while MS positively correlated with citric acid. In the ‘YCHL’ pitaya, NAD-MDH2 and MS demonstrated significant positive correlation with malic acid, and the expression of NADP-MDH6 in the ‘WCHL’ pitaya also showed a positive correlation. However, no significant correlation was found for NAD-MDHs, NADP-MDHs, MS, PEPCs, and NAD-MEs (Figure 4, Tables S3 and S4).

3.5. Cloning, Sequence and Evolutionary Analyses of HuIPMS

To explore the functions of HuIPMS1, HuIPMS2, and HuIPMS3 in citramalic acid synthesis in pitaya, their full-length cDNAs were cloned. The complete open reading frames (ORFs) of HuIPMS1, HuIPMS2, and HuIPMS3 were 1911 bp, 1911 bp, and 921 bp, respectively, and the amino acid sequences encoded by these three genes were identical to each other in the transcriptome databases of ‘GHB’ and ‘GHH’ pitayas. HuIPMS1 had 82.34% sequence identity to HuIPMS2, but only 26.53% to HuIPMS3, and HuIPMS2 showed 27% identity to HuIPMS3. HuIPMS1 and HuIPMS2 both encoded a protein composed of 636 amino acids with molecular weights of 68.57 kDa and 68.42 kDa, and pIs of 6.43 and 7.25, respectively. HuIPMS3 encoded a protein containing 306 amino acids with a molecular weight of 33.95 kDa and a pI of 6.47. The instability indexes of HuIPMS1, HuIPMS2, and HuIPMS3 were respectively 35.25, 39.04, and 24.59, and classified as stable proteins (Less than 40). The average hydropathicity for HuIPMS1, HuIPMS2, and HuIPMS3 were respectively −0.141, −0.159, and −0.274, which shows a hydrophilic nature (less than 0) (Table S5).
HuIPMS1 and HuIPMS2 both contained HMGL-like and LeuA_dimer domains, while HuIPMS3 only contained an HMGL-like domain (Figure S2). Moreover, the phylogenetic tree of IPMS proteins showed that HuIPMS1 and HuIMPS2 shared a closer phylogenetic relationship with IPMSs from Beta vulgaris, Chenopodium quinoa, and Spinacia oleracea, while HuIPMS3 was closely related to Malus Domestica (Figure S3).

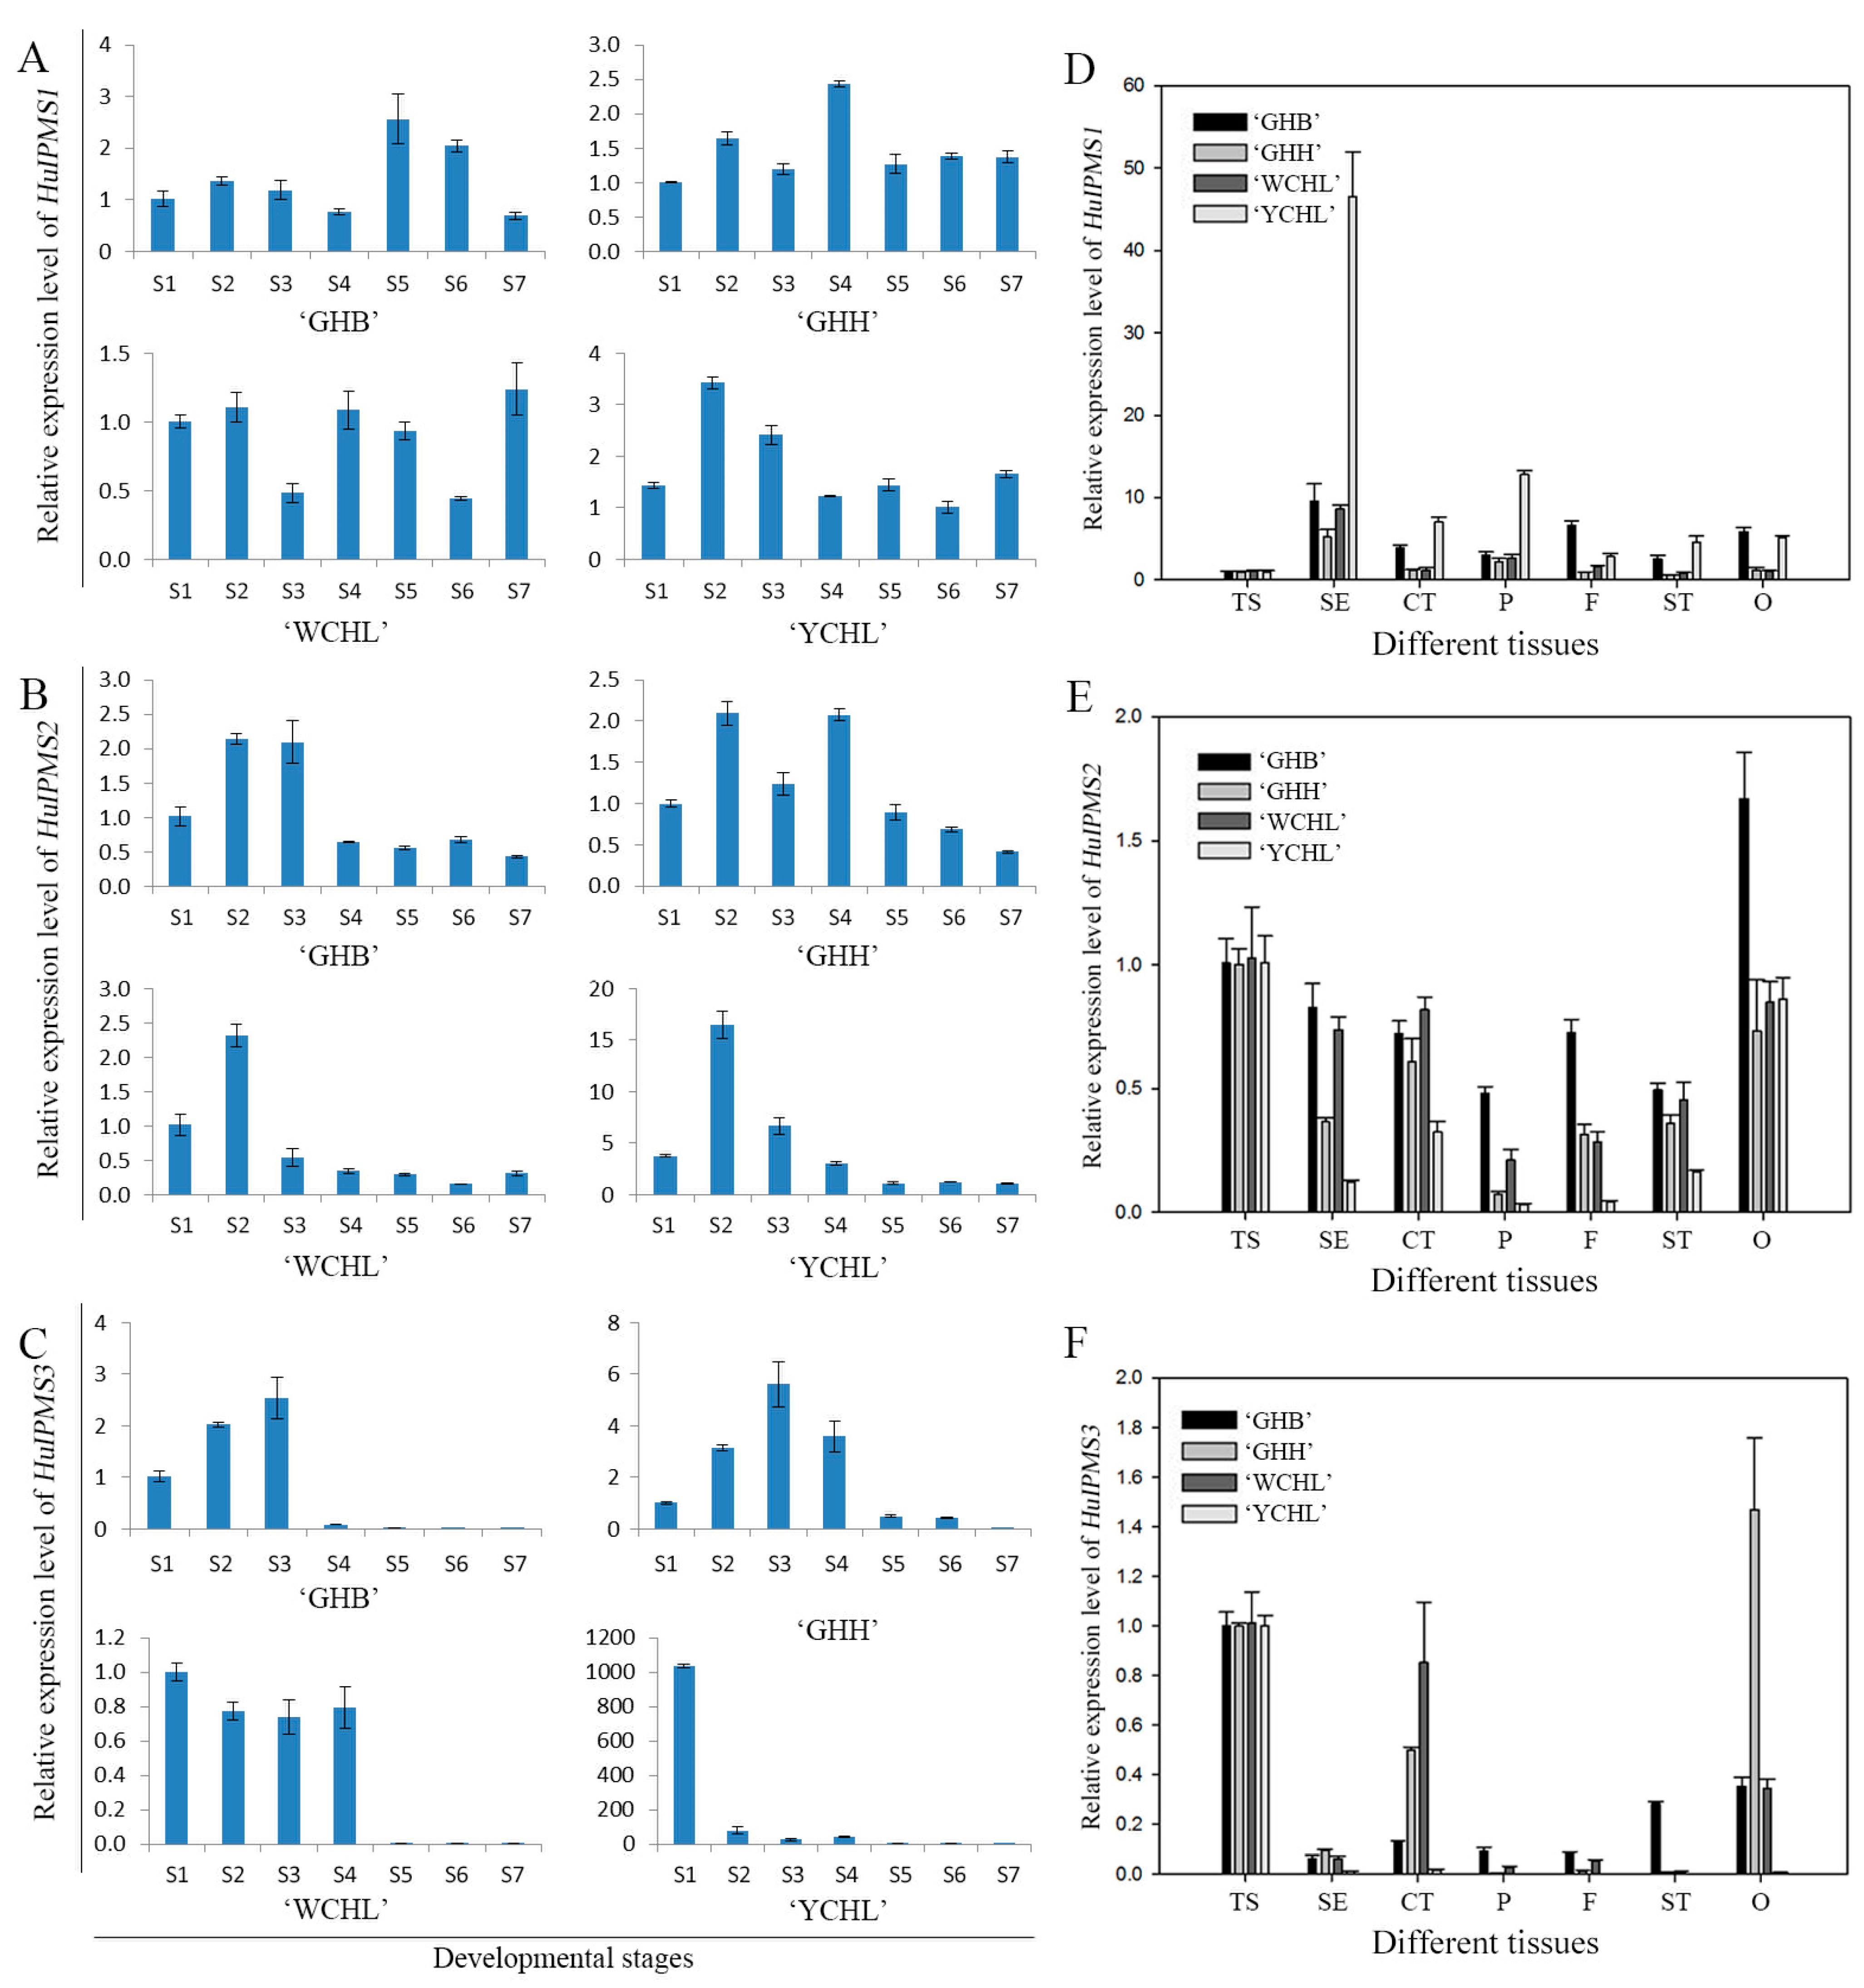
3.6. Expression Analyses of HuIPMSs

The expression patterns of HuIPMSs were analyzed at different fruit development stages of ‘GHH’, ‘GHB’, ‘YCHL’, and ‘WCHL’ pitayas. HuIPMS1 was irregularly expressed in the four pitaya cultivars, and the correlation between expression level of HuIPMSs and the citramalic acid content at different fruit development stages showed similar changing patterns (Figure 5A). The relative expression level of HuIPMS2 generally increased first, and then decreased in the three white pulp cultivars i.e., ‘GHB’, ‘YCHL’, and ‘WCHL’ pitayas, which was positively related to the changing trend of citramalic acid in the red pulp cultivar ‘GHH’ pitaya (Figure 5B). During fruit development of the four pitaya cultivars, HuIPMS3 showed a trend of high expression during the early stages, and extremely low at later stages. Among them, the relative expression level of ‘YCHL’ at S1 was significantly higher than the other stages (Figure 5C).
The expression levels of HuIPMS1, HuIPMS2 and HuIPMS3 were analyzed in various tissues of ‘GHH’, ‘GHB’, ‘YCHL’, and ‘WCHL’ pitayas. HuIPMS1 was predominantly expressed in the sepals of the four pitaya cultivars, the petals of ‘YCHL’, and the filaments and ovaries of the ‘GHB’ pitaya (Figure 5D). The highest expression level of HuIPMS2 was detected in the ovaries of the ‘GHB’ pitaya, followed by the tender stems and calyx tubes (Figure 5E). HuIPMS3 showed high expression levels in the tender stems of four pitaya cultivars, compared with the highest expression level in the ovaries of the ‘GHH’ pitaya (Figure 5F).
Pearson’s correlation test was used to analyze the correlation between citramalic acid contents and HuIPMSs gene expression in the four pitaya cultivars. No significant correlation was found between citramalic acid contents and HuIPMS1. The expression level of HuIPMS2 was positively correlated with the four pitaya cultivars with correlation coefficients of 0.871, 0.786, 0.473, and 0.811, respectively. A similar correlation was detected between citramalic acid contents and HuIPMS3 with the correlation coefficients of 0.848, 0.590, 0.886, and 0.453, respectively (Table 2).

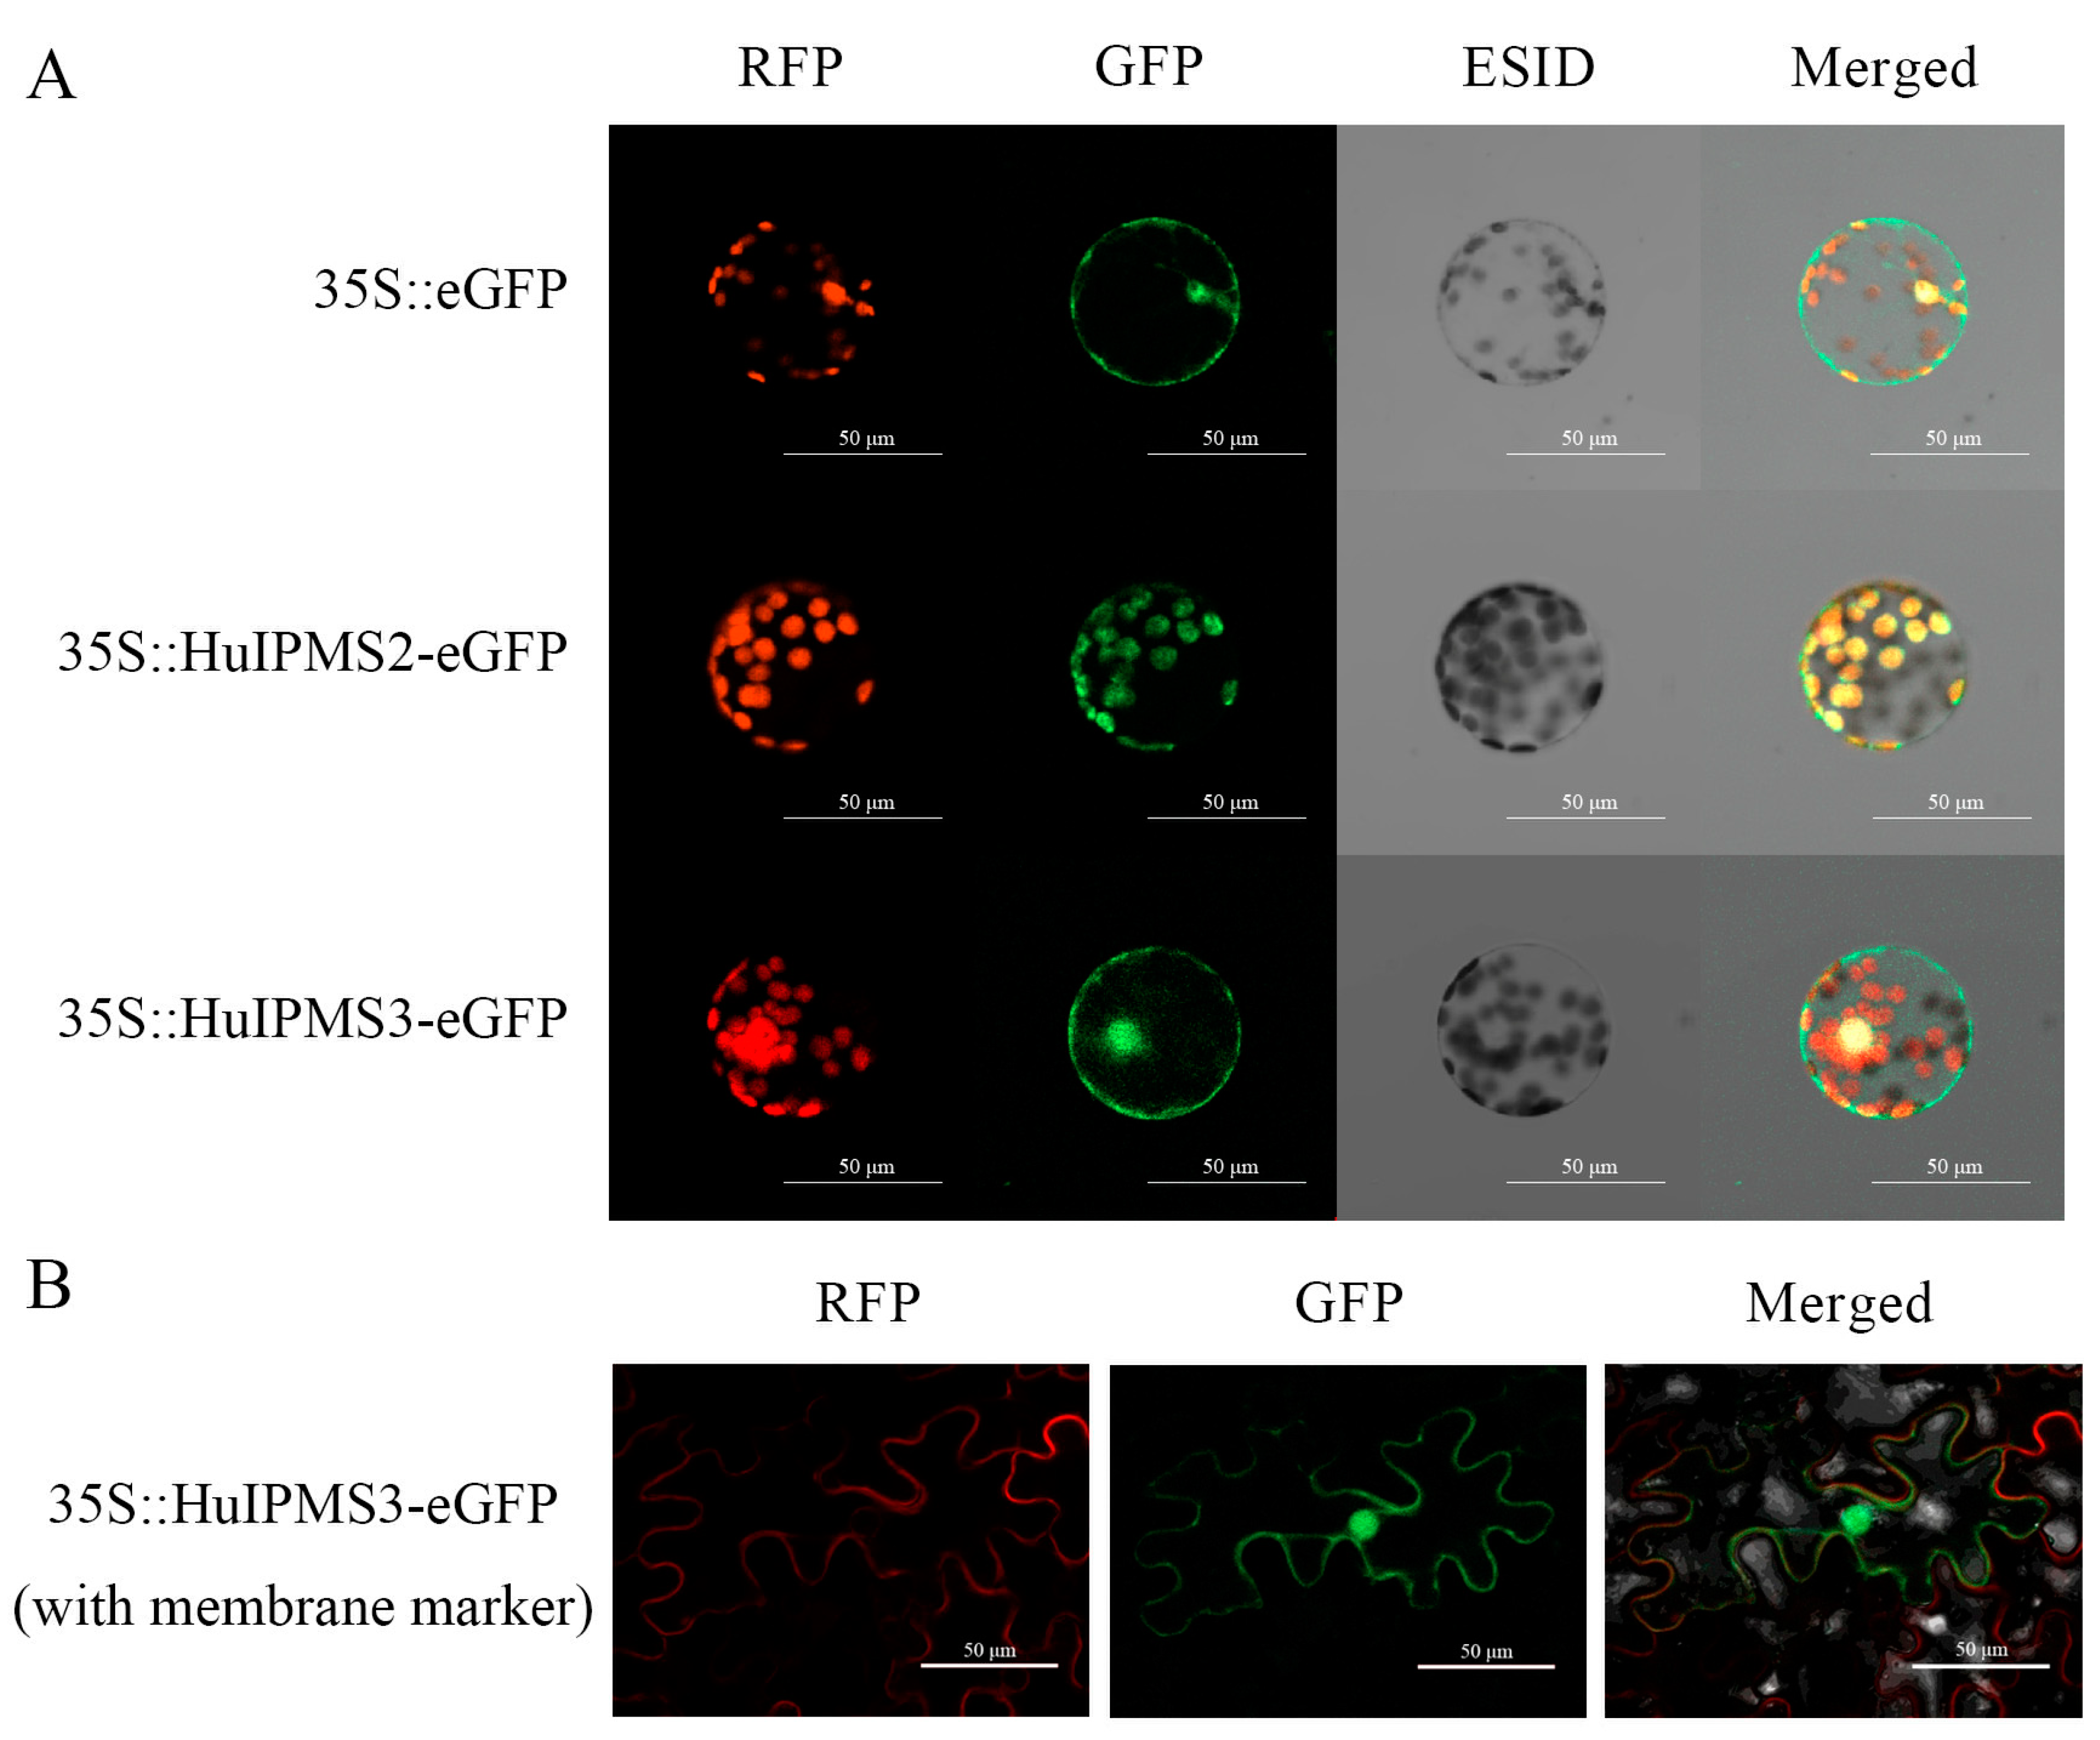
3.7. Subcellular Localization of HuIPMSs Protein

The PSORT online tool was used to predict the subcellular localization of HuIPMSs protein. HuIPMS2 was located in the chloroplast, while HuIPMS3 was located in the cytoplasm and mitochondria. To further verify the subcellular localization of HuIPMS2 and HuIPMS3 in pitaya, transient expression vectors of 35S-IPMS2-GFP and 35S-IPMS3-GFP were constructed and transiently expressed in N. benthamiana leaves. The results showed that HuIPMS2 was localized in the chloroplast, while HuIPMS3 appeared to be localized in the cell membrane, cytoplasm, and nucleus (Figure 6A).
To further determine the localization of HuIPMS3, 35S-IPMS3-GFP was transiently expressed in the leaves of N. benthamiana, expressing a red fluorescent membrane marker. The results indicated that HuIPMS3 presented a cytoplasmic-like and nuclear subcellular localization (Figure 6B).

4. Discussion

4.1. Accumulation of Organic Acids in the Four Pitaya Cultivars

Organic acids in fruits are generally divided into two types: citric acid- and malic acid-accumulated patterns [3]. In this study, ‘GHB’, ‘GHH’, and ‘WCHL’ pitayas mainly accumulated malic acid during the mature stage (S6–S7), which was consistent with previous studies [21,22], whereas the ‘YCHL’ pitaya mainly accumulated citric acid in mature fruits (Table 1). The type and content of organic acids and the sugar/acid ratio are the important basis for the form of fruit flavor. Sugars affect the degree of sweetness, while organic acids are responsible for the sour taste [27]. In terms of flavor, the taste of the ‘WCHL’ pitaya was better and sweeter, consistent with its lowest total acid content in mature fruit pulp among the four pitaya cultivars. During the fruit development of many types of fruits, the content of organic acids shows an increase during the early stages, and gradually decreases as the fruit matures [28,29,30]. At different stages of fruit development, significant differences in the types and ratios of organic acids can be detected. For example, the contents of chlorogenic acid and ascorbic acid are significantly higher in semi-matured mulberry fruits (Morus alba Linnaeus) [31]. Kiwifruit (Actinidia chinensis) is rich in quinic acid in the young fruit stage, and gradually proceeded to malic acid- and citric acid-dominant phase as fruit matures [32]. Citramalic acid content reached its maximum during the fruit coloring-onset stage of the pitaya (H. polyrhizus cv. Zihonglong) suggesting that it was associated with betalain synthesis [22]. In this study, citramalic acid was the main organic acid during the early fruit stages (S1-S3) of ‘WCHL’, ‘GHH’, and ‘GHB’ pitayas, and decreased gradually thereafter, finally dominated by malic acid or citric acid at a more mature stage (Table 1). The highest contents of citramalic acid were observed during the early fruit developmental stage (S3) to the pulp coloring-onset stage (S4), which is consistent with previous findings in the pitaya fruit [22]. In fruit cells, pyruvate is catalyzed by the pyruvate dehydrogenase complex to produce acetyl-CoA, and citrate synthase (CS) catalyzes the synthesis of citric acid from acetyl-CoA and oxaloacetate. Therefore, there may be a competition relationship between IPMS and CS for the same reaction substrate [33]. Moreover, pyruvate is another substrate for the synthesis of citramalic acid, which can be obtained from the degradation of malic acid. In this study, citramalic acid mainly accumulated during the early fruit developmental stage of the four pitaya cultivars. However, levels of citric acid and malic acid content were lower at these stages. These results indicated that citramalic acid may affect the accumulation of citric acid and malic acid in pitayas, thus involved in improving the flavor. (Table 1).

4.2. The Relationship between Organic Acid Contents and Metabolism-Associated Genes

PEPC mainly catalyzes phosphoenolpyruvate (PEP) to generate oxaloacetate (OAA) and inorganic phosphorus, and PEPC regulates its activity through phosphorylation-dephosphorylation [34]. PEPC can regulate the malic acid content during fruit development of loquat (Eriobotrya japonica) [3]. In this study, PEPC4 and MS in the ‘GHB’ pitaya, and PEPC3 in the ‘GHH’ pitaya were significantly positively correlated with the content of malic acid (Figure 4 and Table S3). Moreover, a positive correlation was observed between malic acid and MS and NAD-MDH2 in the ‘YCHL’ pitaya. These results suggested that PEPC4, MS, and NAD-MDH2 may be involved in the positive regulation of malic acid metabolism. MDH mainly catalyzes the formation of malic acid from OAA in the TCA cycle of fruits, which is the most likely route of malate formation [35]. In apples, the MdcyMDH gene mainly plays a role in the synthesis of malic acid [36]. In the present study, the expression levels of NADP-MDH6 were significantly positively correlated with the dynamic trend of malic acid content during the fruit development of ‘GHB’ and ‘WCHL’ pitayas, indicating that NADP-MDH6 positively regulated the accumulation of malic acid in the two pitaya cultivars. Afterward, NADP-ME catalyzes a reversible oxidative decarboxylation of malic acid to produce pyruvate [37]. The expression level of NADP-ME decreased in the ‘Huang guan’ pear (Pyrus pyrifolia Nakai) which was treated with CaCl2, accompanied by weakness of malic acid degradation [38]. A similar expression pattern of NADP-ME5 was found in pitaya, suggesting that NADP-ME5 could promote the NADP-ME synthesis involving malic acid degradation.
CS directly controls citric acid synthesis [39]. However, no significant correlation was found between the CS gene expression and the citric acid contents during the different fruit developmental stages of the four pitaya cultivars (Figure 4 and Table S4), which was different from the recently published results of citric acid in passion fruits [40].

4.3. Role of HuIPMS2 in Citramalic Acid Synthesis of Pitaya

Citramalate synthase belongs to the 2-isopropylmalate synthase family [41]. Genes in this family have a conserved C-terminal (βββα)2 LeuA dimer domain connected by a flexible linker region. Moreover, their 3D structures and catalytic mechanism are similar [8]. Enzymes related to the catalytic domain of the N-terminal TIM barrel (Pfam ID: PF00682) include 2-isopropylmalate synthase, citramalate synthase, homocitrate synthase, pyruvate carboxylase, 4-hydroxy-2-oxvalerate aldolase and hydroxymethylglutaryl-CoA lyase, while the activity of the enzymes containing the C-terminal LeuA dimer domain is limited to 2-isopropylmalate synthase and citramalate synthase only, which catalyzes the first step of the biosynthesis of L-leucine and L-isoleucine, respectively [8]. In this study, three IPMS genes were identified according to structural domain annotation in the pitaya genome and transcriptome database. Both HuIPMS1 and HuIPMS2 contained HMGL-like and LeuA_dimer domains (Figure S3B), the same as MJ1392 [10], whose corresponding function of catalyzing the synthesis of citramalic acid has been verified by transforming into E. coli [13,42,43]. HuIPMS3 only contained the HMGL-like domain. HuIPMS1 was preferentially expressed in the sepals, while the highest expression levels of HuIPMS2 and HuIPMS3 were detected in tender stems and ovaries, indicating that HuIPMSs genes have different expression patterns in various pitaya tissues and organs (Figure 5D–F). In the four cultivars of pitaya, the changing tendency of HuIPMS2 expression level was significantly positively correlated with the dynamic changes of citramalic acid content (Table 2). HuIPMS2 protein localized to chloroplasts, while HuIPMS3 protein appeared to have accumulated in the cytoplasm and nucleus (Figure 6). Recently, the IPMS gene MdCMS, previously only described in microorganisms, was first cloned and verified to participate in citramalic pathway in apple [7]. In Arabidopsis thaliana, the AtMAM3 protein has been proven that can condense various 2-oxo acids with an acyl-CoA ester [44]. A common gene family, conserved domains, and subcellular localization among HuIPMS2, AtMAM3 and MdCMS proteins may predict their functional consistency.

5. Conclusions

In this study, organic acid compositions and contents, as well as expression patterns of key genes related to organic acid metabolism were analyzed during fruit maturation of ‘Guanhuabai’ (GHB), ‘Guanhuahong’ (GHH), ‘Wucihuanglong’ (WCHL), and ‘Youcihuanglong’ (YCHL) pitayas. ‘GHB’, ‘GHH’, and ‘WCHL’ were malic acid-accumulating fruits, while ‘YCHL’ was citric acid-accumulating fruit. The highest content of citramalic acid was detected from the early fruit developmental stage (S3) to the coloring-onset stage (S4). PEPC4, MS, and NADP-MDH6 are the key genes involved in regulating malic acid metabolism in the ‘GHB’ pitaya, while NADP-ME5, and PEPC3 are important in the ‘GHH’ pitaya. The NADP-MDH6 gene plays a major role in malic acid synthesis in the ‘WCHL’ pitaya. MS and NAD-MDH2 are involved in the regulation of malic acid in the ‘YCHL’ pitaya. HuIPMSs had obvious expression differences in different tissues and organs, of which HuIPMS1 had highest expression level in sepals, compared with highest expression levels of HuIPMS2 and HuIPMS3 in tender stems and ovaries. HuIPMS2 was located in the chloroplast with HMGL-like and LeuA_dimer conserved domains. The relative expression of HuIPMS2 gene was positively correlated with the content of citramalic acid.

Supplementary Materials

The following supporting information can be downloaded at: https://www.mdpi.com/article/10.3390/horticulturae8020167/s1, Figure S1: Four different peel and pulp pitaya cultivars used in this study, Figure S2: Comparison of gene regulation at different fruit stages in ‘GHB’ and ‘GHH’ pitayas, Figure S3: Cloning, sequence and evolutionary analyses of HuIPMSs, Table S1: Table S1 Primers used for RT-qPCR and gene cloning, Table S2: Statistical analyses of transcriptome data, Table S3: Correlation analyses between malic acid contents and expression levels of related-genes, Table S4: Correlation analyses between citric acid contents and expression levels of related-genes, Table S5: Physical and chemical properties of HuIPMS1, HuIPMS2 and HuIPMS3.

Author Contributions

Conceptualization, Y.Q.; Methodology and validation, J.C. (Jiaxuan Chen) and Y.Y.; Formal analysis, investigation, resources, data curation and visualization, J.C. (Jiaxuan Chen), Y.Y., F.X., J.C. (Jianye Chen), Z.Z., R.Z., J.Z. and G.H.; Writing—original draft preparation, J.C. (Jiaxuan Chen) and Y.Y.; Supervision, Y.Q.; Project administration, G.H. and Y.Q.; Funding acquisition, J.C. (Jianye Chen), G.H. and Y.Q. All authors have read and agreed to the published version of the manuscript.

Funding

This research was funded by the Key Science and Technology Planning Project of Guangzhou (grant no. 201904020015), Science and Technology Program of Guangzhou (grant no. 202002020060) and Zhanjiang (grant no. 2019A01003).

Institutional Review Board Statement

Not applicable.

Informed Consent Statement

Not applicable.

Data Availability Statement

Data is contained within the article. Accession Numbers: Sequence data from this article can be found in the pitaya genome (http://www.pitayagenomic.com/, accessed on 20 December 2019) or NCBI GenBank databases under the following accession numbers: HuIPMS1, OM505029; HuIPMS2, OM505030; HuIPMS3, OM505031.

Conflicts of Interest

The authors declare no conflict of interest.

References

  1. Yin, X.; Li, J.H.; Shin, H.D.; Du, G.C.; Liu, L.; Chen, J. Metabolic engineering in the biotechnological production of organic acids in the tricarboxylic acid cycle of microorganisms: Advances and prospects. Biotechnol. Adv. 2015, 33, 830–841. [Google Scholar] [CrossRef] [PubMed]
  2. Batista-Silva, W.; Nascimento, V.L.; Medeiros, D.B.; Nunes-Nesi, A.; Ribeiro, D.M.; Zsögön, A.; Araújo, W.L. Modifications in organic acid profiles during fruit development and ripening: Correlation or causation? Front Plant Sci. 2018, 9, 1689. [Google Scholar] [CrossRef] [PubMed]
  3. Chen, F.X.; Liu, X.H.; Chen, L.S. Developmental changes in pulp organic acid concentration and activities of acid-metabolising enzymes during the fruit development of two loquat (Eriobotrya japonica Lindl.) cultivars differing in fruit acidity. Food Chem. 2009, 114, 657–664. [Google Scholar] [CrossRef]
  4. Ma, B.Q.; Yuan, Y.Y.; Gao, M.; Li, C.Y.; Ogutu, C.; Li, M.J.; Ma, F.W. Determination of predominant organic acid components in Malus species: Correlation with apple domestication. Metabolites 2018, 8, 74. [Google Scholar] [CrossRef] [Green Version]
  5. Sha, S.F.; Li, J.C.; Wu, J.; Zhang, S.L. Changes in the organic acid content and related metabolic enzyme activities in developing ‘Xinping’ pear fruit. Afr. J. Agric. Res. 2011, 6, 3560–3567. [Google Scholar]
  6. Hulme, A.C. A New Hydroxy-acid in the Peel of Apple Fruits. Nature 1953, 172, 346. [Google Scholar] [CrossRef]
  7. Sugimoto, N.; Engelgau, P.; Jones, A.D.; Song, J.; Beaudry, R. Citramalate synthase yields a biosynthetic pathway for isoleucine and straight- and branched-chain ester formation in ripening apple fruit. Proc. Natl. Acad. Sci USA 2021, 118, e2009988118. [Google Scholar] [CrossRef]
  8. Frantom, P.A. Structural and functional characterization of alpha-isopropylmalate synthase and citramalate synthase, members of the LeuA dimer superfamily. Arch. Biochem. Biophys. 2012, 519, 202–209. [Google Scholar] [CrossRef]
  9. Hulme, A.C.; Wooltorton, L.S.C. Determination and isolation of the non-volatile acids of pome fruits and a study of acid changes in apples during storage. J. Sci. Food Agric. 1958, 9, 150–158. [Google Scholar] [CrossRef]
  10. Howell, D.M.; Xu, H.; White, R.H. (R)-citramalate synthase in methanogenic archaea. J. Bacteriol. 1999, 181, 331–333. [Google Scholar] [CrossRef] [Green Version]
  11. Johnson, D.W.; Eastham, G.R.; Poliakoff, M.; Huddle, T.A. Method of Producing Arcylic and Methacrylic Acid. U.S. Patent 8,933,179, 13 January 2015. [Google Scholar]
  12. Webb, J.; Springthorpe, V.; Rossoni, L.; Minde, D.P.; Langer, S.; Walker, H.; Alstrom-Moore, A.; Larson, T.; Lilley, K.; Eastham, G.; et al. Systems analyses reveal the resilience of Escherichia coli physiology during accumulation and export of the nonnative organic acid citramalate. Msystems 2019, 4, e00187-19. [Google Scholar] [CrossRef] [PubMed] [Green Version]
  13. Webb, J.P.; Arnold, S.A.; Baxter, S.; Hall, S.J.; Eastham, G.; Stephens, G. Efficient bio-production of citramalate using an engineered Escherichia coli strain. Microbiology 2018, 164, 133–141. [Google Scholar] [CrossRef]
  14. Zhang, K.C.; Woodruff, A.P.; Xiong, M.; Zhou, J.; Dhande, Y.K. A synthetic metabolic pathway for production of the platform chemical isobutyric acid. ChemSusChem 2011, 4, 1068–1070. [Google Scholar] [CrossRef] [PubMed]
  15. Hossain, A.H.; Hendrikx, A.; Punt, P.J. Identification of novel citramalate biosynthesis pathways in Aspergillus niger. Fungal Biol. Biotechnol. 2019, 6, 19. [Google Scholar] [CrossRef] [PubMed]
  16. Fujimoto, Y.; Yadav, J.S.; Sih, C.J. (S)-citramalic acid, a useful chiral synthon for the synthesis of 15-deoxy-16(S)-hydroxy-16-methylprostaglandins. Tetrahedron Lett. 1980, 21, 2481–2482. [Google Scholar] [CrossRef]
  17. Wilkes, J.B.; Wall, R.G. Citric Acid and Citramalic Acid Preparation. U.S. Patent 4,022,823, 10 May 1977. [Google Scholar]
  18. Takao, Y.; Takahashi, T.; Yamada, T.; Goshima, T.; Isogai, A.; Sueno, K.; Fujii, T.; Akao, T. Characteristic features of the unique house sake yeast strain Saccharomyces cerevisiae Km67 used for industrial sake brewing. J. Biosci. Bioeng. 2018, 126, 617–623. [Google Scholar] [CrossRef] [PubMed]
  19. Le Bellec, F.; Vaillant, F. Pitahaya (pitaya) (Hylocereus spp.). In Postharvest Biology and Technology of Tropical and Subtropical Fruits; Woodhead Publishing: Cambridge, UK, 2011; pp. 247–273e. ISBN 978-0-85709-090-4. [Google Scholar]
  20. Zhang, Z.K.; Xing, Y.M.; Ramakrishnan, M.; Chen, C.B.; Xie, F.F.; Hua, Q.Z.; Chen, J.Y.; Zhang, R.; Zhao, J.T.; Hu, G.B.; et al. Transcriptomics-based identification and characterization of genes related to sugar metabolism in ‘Hongshuijing’ pitaya. Hortic. Plant J. 2021; in press. [Google Scholar] [CrossRef]
  21. Hua, Q.Z.; Chen, C.B.; Tel Zur, N.; Wang, H.C.; Wu, J.Y.; Chen, J.Y.; Zhang, Z.K.; Zhao, J.T.; Hu, G.B.; Qin, Y.H. Metabolomic characterization of pitaya fruit from three red-skinned cultivars with different pulp colors. Plant Physiol. Biochem. 2018, 126, 117–125. [Google Scholar] [CrossRef]
  22. Wu, Y.W.; Xu, J.; Shi, M.Y.; Han, X.M.; Li, W.Y.; Zhang, X.W.; Wen, X.P. Pitaya: A potential plant resource of citramalic acid. CyTA-J. Food 2020, 18, 249–256. [Google Scholar] [CrossRef] [Green Version]
  23. Hu, Z.; Wang, H.; Hu, G.B. Measurement of sugars, organic acids and vitamin C in litchi fruit by performance liquid chromatography. J. Fruit Sci. 2005, 22, 582–585. [Google Scholar]
  24. Chen, C.J.; Chen, H.; Zhang, Y.; Thomas, H.R.; Frank, M.H.; He, Y.H.; Xia, R. TBtools: An integrative toolkit developed for interactive analyses of big biological data. Mol. Plant 2020, 13, 1194–1202. [Google Scholar] [CrossRef]
  25. Chen, C.B.; Wu, J.Y.; Hua, Q.Z.; Tel-Zur, N.; Xie, F.F.; Zhang, Z.K.; Chen, J.Y.; Zhang, R.; Hu, G.B.; Zhao, J.T.; et al. Identification of reliable reference genes for quantitative real-time PCR normalization in pitaya. Plant Methods 2019, 15, 70. [Google Scholar] [CrossRef] [Green Version]
  26. Livak, K.J.; Schmittgen, T.D. Analysis of relative gene expression data using real-time quantitative PCR and the 2−ΔΔCT method. Methods 2001, 25, 402–408. [Google Scholar] [CrossRef]
  27. Fan, X.G.; Zhao, H.D.; Wang, X.M.; Cao, J.K.; Jiang, W.B. Sugar and organic acid composition of apricot and their contribution to sensory quality and consumer satisfaction. Sci. Hortic. 2017, 225, 553–560. [Google Scholar] [CrossRef]
  28. Minamikawa, M.F.; Nonaka, K.; Kaminuma, E.; Kajiya-Kanegae, H.; Onogi, A.; Goto, S.; Yoshioka, T.; Imai, A.; Hamada, H.; Hayashi, T.; et al. Genome-wide association study and genomic prediction in citrus: Potential of genomics-assisted breeding for fruit quality traits. Sci. Rep. 2017, 7, 4721. [Google Scholar] [CrossRef]
  29. Ramadan, N.S.; Wessjohann, L.A.; Mocan, A.; Vodnar, D.C.; El-Sayed, N.H.; El-Toumy, S.A.; Mohamed, D.A.; Aziz, Z.A.; Ehrlich, A.; Farag, M.A. Nutrient and sensory metabolites profiling of Averrhoa carambola L. (Starfruit) in the context of its origin and ripening stage by GC/MS and chemometric analysis. Molecules 2020, 25, 2423. [Google Scholar] [CrossRef]
  30. Xu, J.D.; Yan, J.J.; Li, W.J.; Wang, Q.Y.; Wang, C.X.; Guo, J.X.; Geng, D.L.; Guan, Q.M.; Ma, F.W. Integrative analyses of widely targeted metabolic profiling and transcriptome data reveals molecular insight into metabolomic variations during apple (Malus domestica) fruit development and ripening. Int. J. Mol. Sci. 2020, 21, 4797. [Google Scholar] [CrossRef] [PubMed]
  31. Lee, K.M.; Oh, T.J.; Kim, S.H.; Kim, H.Y.; Chung, H.; Min, D.S.; Auh, J.H.; Lee, H.J.; Lee, J.; Choi, H.K. Comprehensive metabolic profiles of mulberry fruit (Morus alba Linnaeus) according to maturation stage. Food Sci. Biotechnol. 2016, 25, 1035–1041. [Google Scholar] [CrossRef] [PubMed]
  32. Qiu, G.L.; Zhuang, Q.G.; Li, Y.F.; Li, S.Y.; Chen, C.; Li, Z.H.; Zhao, Y.Y.; Yang, Y.; Liu, Z.B. Correlation between fruit weight and nutritional metabolism during development in CPPU-treated Actinidia chinensis ‘Hongyang’. PeerJ 2020, 8, e9724. [Google Scholar] [CrossRef]
  33. Wu, X.H.; Tovilla-Coutino, D.B.; Eiteman, M.A. Engineered citrate synthase improves citramalic acid generation in Escherichia coli. Biotechnol. Bioeng. 2020, 117, 2781–2790. [Google Scholar] [CrossRef]
  34. Walker, R.P.; Paoletti, A.; Leegood, R.C.; Famiani, F. Phosphorylation of phosphoenolpyruvate carboxykinase (PEPCK) and phosphoenolpyruvate carboxylase (PEPC) in the flesh of fruits. Plant Physiol. Biochem. 2016, 108, 323–327. [Google Scholar] [CrossRef]
  35. Yao, Y.X.; Li, M.; Zhai, H.; You, C.X.; Hao, Y.J. Isolation and characterization of an apple Cytosolic malate dehydrogenase gene reveal its function in malate synthesis. J. Plant Physiol. 2011, 168, 474–480. [Google Scholar] [CrossRef] [PubMed]
  36. Yao, Y.X.; Dong, Q.L.; Zhai, H.; You, C.X.; Hao, Y.J. The functions of an apple Cytosolic malate dehydrogenase gene in growth and tolerance to cold and salt stresses. Plant Physiol. Biochem. 2011, 49, 257–264. [Google Scholar] [CrossRef]
  37. Chen, Q.Q.; Wang, B.P.; Ding, H.Y.; Zhang, J.; Li, S.C. Review: The role of NADP-malic enzyme in plants under stress. Plant Sci. 2019, 281, 206–212. [Google Scholar] [CrossRef] [PubMed]
  38. Kou, X.H.; Wang, S.; Zhang, Y.; Guo, R.Z.; Wu, M.S.; Chen, Q.; Xue, Z.H. Effects of chitosan and calcium chloride treatments on malic acid-metabolizing enzymes and the related gene expression in post-harvest pear cv. ‘Huang guan’. Sci. Hortic. 2014, 165, 252–259. [Google Scholar] [CrossRef]
  39. Gao, L.; Zhao, S.J.; Lu, X.Q.; He, N.; Zhu, H.J.; Dou, J.L.; Liu, W.G. Comparative transcriptome analysis reveals key genes potentially related to soluble sugar and organic acid accumulation in watermelon. PLoS ONE 2018, 13, e0190096. [Google Scholar] [CrossRef] [PubMed]
  40. Zhang, X.X.; Wei, X.X.; Ali, M.M.; Rizwan, H.M.; Li, B.Q.; Li, H.; Jia, K.J.; Yang, X.L.; Ma, S.F.; Li, S.J.; et al. Changes in the content of organic acids and expression analysis of citric acid accumulation-related genes during fruit development of yellow (Passiflora edulis F. Flavicarpa) and purple (Passiflora edulis F. Edulis) passion fruits. Int. J. Mol. Sci. 2021, 22, 5765. [Google Scholar] [CrossRef] [PubMed]
  41. Leroy, B.; De Meur, Q.; Moulin, C.; Wegria, G.; Ruddy, W. New insight into the photoheterotrophic growth of the isocytrate lyase-lacking purple bacterium Rhodospirillum rubrum on acetate. Microbiology 2015, 161, 1061–1072. [Google Scholar] [CrossRef]
  42. Atsumi, S.; Liao, J.C. Directed evolution of Methanococcus jannaschii citramalate synthase for biosynthesis of 1-propanol and 1-butanol by Escherichia coli. Appl. Environ. Microbiol. 2008, 74, 7802–7808. [Google Scholar] [CrossRef] [Green Version]
  43. Wu, X.H.; Eiteman, M.A. Synthesis of citramalic acid from glycerol by metabolically engineered Escherichia coli. J. Ind. Microbiol. Biotechnol. 2017, 44, 1483–1490. [Google Scholar] [CrossRef]
  44. Textor, S.; de Kraker, J.W.; Hause, B.; Gershenzon, J.; Tokuhisa, J. MAM3 catalyzes the formation of all aliphatic glucosinolate chain lengths in Arabidopsis. Plant Physiol. 2007, 144, 60–71. [Google Scholar] [CrossRef] [Green Version]
Figure 1. Pulp and peel coloration at different developmental stages of four pitaya cultivars. (A) ‘Guanhuabai’; (B) ‘Guanhuahong’; (C) ‘Wucihuanglong’; (D) ‘Youcihuanglong’. Bars = 2 cm.
Horticulturae 08 00167 g001
Figure 2. KEGG enrichment of DEGs in (A) GHH17 vs. GHB17, (B) GHH23 vs. GHB23, (C) GHH25 vs. GHB25, and (D) GHH32 vs. GHB32. The X axis is the Rich Ratio (Rich Ratio is calculated as candidate gene number in a specific term/total gene numbers), and the Y axis represents KEGG pathway. The size of the bubble indicates the number of genes annotated to KEGG pathway. The color represents the enriched Q-value ranges from red (low value) to blue (high value).
Horticulturae 08 00167 g002
Figure 3. The expression heatmap of genes related to organic acid metabolism according to the RNA-Seq datasets of ‘GHB’ and ‘GHH’ pitaya pulps. The color bar represents the log2 (FPKM) and ranges from blue (low expression) to red (high expression).
Horticulturae 08 00167 g003
Figure 4. Expression analyses of genes related to organic acid metabolism at different fruit developmental stages of four pitaya cultivars by qRT-PCR. The X axis represents six fruit developmental stages of four pitaya cultivars. The Y axis represents relative expression level. The red boxes represent expression level of genes significantly associated with citric or malic acid contents. All data are normalized by Actin(1).
Horticulturae 08 00167 g004
Figure 5. Expression analyses of HuIPMSs by qRT-PCR. The expression of HuIPMS1 (A), HuIPMS2 (B), and HuIPMS3 (C) in fruit development of four pitaya cultivars, and HuIPMS1 (D), HuIPMS2, (E), HuIPMS3 (F) in different pitaya tissues. The X axis for (AC) represents seven fruit developmental stages of four pitaya cultivars. The X axis for (DF) represent different pitaya tissues. TS, Tender stem; SE, Sepal; CT, Calyx tube; P, Petal; F, Filament; ST, Style; O, Ovary. All data are normalized by Actin(1).
Horticulturae 08 00167 g005
Figure 6. Subcellular location analyses of (A) HuIPMS2 and HuIPMS3 in the protoplasts, and (B) HuIPMS3 in the leaves of N. benthamiana. Green and red signals represent green fluorescent protein and red fluorescent protein, respectively. ESID, bright field. Scale bars = 50 µm.
Horticulturae 08 00167 g006
Table 1. Compositions of organic acids in four different pitaya cultivars.
Cultivars (n = 3)StagesContents (mg/g)
Malic AcidCitric AcidCitramalic AcidOxalic AcidAscorbic Acid
‘GHH’S12.177 ± 0.064 d0.481 ± 0.018 b3.136 ± 0.609 bc0.515 ± 0.077 b0.123 ± 0.004 a
S21.753 ± 0.326 d0.377 ± 0.063 b3.997 ± 0.309 ab0.713 ± 0.087 a0.105 ± 0.015 bc
S31.638 ± 0.460 d0.385 ± 0.106 b3.542 ± 0.856 abc0.514 ± 0.040 b0.067 ± 0.024 b
S45.487 ± 0.984 c0.543 ± 0.100 b4.380 ± 0.306 a0.434 ± 0.036 bc0.065 ± 0.021 b
S511.133 ± 0.729 b0.849 ± 0.13 ab3.662 ± 0.28 abc0.451 ± 0.131 bc0.066 ± 0.018 b
S613.493 ± 1.430 a1.218 ± 0.375 a2.609 ± 0.192 c0.413 ± 0.040 bc0.066 ± 0.007 b
S77.228 ± 0.523 c1.055 ± 0.090 a0.209 ± 0.061 d0.283 ± 0.056 c0.022 ± 0.011 c
‘GHB’S12.922 ± 0.247 d0.000 ± 0.000 b4.062 ± 0.699 b0.054 ± 0.018 c0.179 ± 0.016 a
S23.990 ± 0.646 cd0.000 ± 0.000 b5.597 ± 0.000 a0.095 ± 0.021 b0.203 ± 0.013 a
S34.449 ± 0.062 cd0.000 ± 0.000 b5.931 ± 0.880 a0.139 ± 0.009 a0.178 ± 0.030 a
S415.196 ± 1.500 a0.165 ± 0.030 a4.295 ± 0.187 b0.073 ± 0.024 bc0.090 ± 0.006 b
S518.116 ± 2.735 a0.122 ± 0.030 a3.160 ± 0.228 bc0.072 ± 0.014 bc0.048 ± 0.006 c
S67.159 ± 0.204 c0.202 ± 0.023 a2.693 ± 0.283 c0.036 ± 0.011 c0.034 ± 0.002 c
S711.072 ± 1.226 b0.138 ± 0.018 a1.241 ± 0.071 d0.041 ± 0.003 c0.052 ± 0.003 c
‘WCHL’S10.848 ± 0.0140 e0.000 ± 0.000 d4.045 ± 0.059 b0.582 ± 0.012 a0.280 ± 0.007 a
S21.489 ± 0.152 e0.000 ± 0.000 d4.499 ± 0.406 b0.526 ± 0.155 a0.185 ± 0.034 b
S33.379 ± 1.076 d0.433 ± 0.210 c5.815 ± 0.310 a0.323 ± 0.067 b0.154 ± 0.003 b
S413.997 ± 1.095 a1.704 ± 0.219 a4.021 ± 0.205 b0.256 ± 0.071 bc0.185 ± 0.004 b
S510.183 ± 0.507 b0.952 ± 0.083 b1.437 ± 0.078 c0.248 ± 0.067 bc0.093 ± 0.003 c
S65.624 ± 0.313 c0.451 ± 0.018 c0.910 ± 0.000 d0.154 ± 0.033 c0.058 ± 0.001 d
S75.945 ± 0.950 c0.569 ± 0.110 c0.293 ± 0.010 e0.189 ± 0.029 bc0.047 ± 0.009 d
‘YCHL’S12.422 ± 0.140 de1.818 ± 0.237 f1.561 ± 0.237 b0.692 ± 0.022 a0.220 ± 0.012 a
S22.698 ± 0.140 cd2.503 ± 0.135 e1.935 ± 0.260 a0.653 ± 0.021 a0.177 ± 0.015 a
S33.058 ± 0.071 c3.060 ± 0.126 de1.498 ± 0.092 b0.690 ± 0.005 a0.196 ± 0.014 a
S45.122 ± 0.275 a6.736 ± 0.418 a0.632 ± 0.054 c0.617 ± 0.036 a0.120 ± 0.039 b
S53.837 ± 0.400 b5.125 ± 0.224 b0.000 ± 0.000 d0.458 ± 0.003 b0.006 ± 0.001 c
S62.138 ± 0.162 e4.185 ± 0.261 c0.000 ± 0.000 d0.331 ± 0.040 c0.003 ± 0.000 c
S71.576 ± 0.202 f3.620 ± 0.298 cd0.000 ± 0.000 d0.263 ± 0.075 c0.015 ± 0.001 c
Each sample is repeated three times. The different lowercase letters following the numbers indicate a significant difference (p < 0.05) between the cultivars.
Table 2. Correlation analysis between citramalic acid contents and expression levels of HuIPMSs.
CultivarsHuIPMS1HuIPMS2HuIPMS3
‘GHB’−0.0830.871 *0.848 *
‘GHH’0.3500.786 *0.590
‘WCHL’−0.0720.4730.886 **
‘YCHL’0.7820.811 *0.453
* and ** represent significantly difference at p < 0.05 and p < 0.01, respectively.
Publisher’s Note: MDPI stays neutral with regard to jurisdictional claims in published maps and institutional affiliations.

