Article

Effect of Harvesting Time Variations on Essential Oil Yield and Composition of Sage (Salvia officinalis)

by
Saeid Hazrati
1,*,
Pouya Beidaghi
1,
Arman Beyraghdar Kashkooli
2,
Seyyed Jaber Hosseini
3 and
Silvana Nicola
4,*
1
Department of Agronomy, Faculty of Agriculture, Azarbaijan Shahid Madani University, Tabriz 53714-161, Iran
2
Department of Horticultural Science, Faculty of Agriculture, Tarbiat Modares University, Tehran 14115-336, Iran
3
Department of Agronomy, Faculty of Agriculture, Tarbiat Modares University, Tehran 14115-336, Iran
4
Department of Agricultural, Forest, and Food Sciences—DISAFA, Horticultural Sciences—INHORTOSANITAS, Vegetable Crops and Medicinal and Aromatic Plants—VEGMAP, University of Torino, 10095 Grugliasco, Italy
*
Authors to whom correspondence should be addressed.
Horticulturae 2022, 8(2), 149; https://doi.org/10.3390/horticulturae8020149
Submission received: 14 January 2022 / Revised: 7 February 2022 / Accepted: 8 February 2022 / Published: 10 February 2022
(This article belongs to the Special Issue Production and Quality of Medicinal and Aromatic Plants)

Abstract

:
The objective of this study was to evaluate the production, contents, and essential oil (EO) components of sage as a function of the diurnal variation. The EOs from the aerial parts of the plant harvested at different day/night times were extracted by hydro-distillation. Plants were harvested in 2 h intervals (twelve harvesting times during each 24-h day). Harvesting between 4:00 and 6:00 p.m. revealed the highest EO percentage (1.14%), whereas harvesting between 04:00 and 06:00 a.m. indicated the minimum EO percentage (0.599%). The analysis of the EO identified 32 components. The major identified EO compounds were cis-thujone (34.38–46.18%), 1,8-cineol (8.70–11.07%), camphor (9.65–14.38%), and trans-thujone (9.43–14.19%). The highest value of cis-thujone (46.18%) was related to the harvest time of 04:00–06:00 a.m., and the lowest value (34.38%) was recorded at the harvest time of 00:00–02:00 a.m. The highest value of trans-thujone (14.19%) was obtained between 10:00–00:00 p.m., and the lowest value (9.43%) was obtained between 10:00–12:00 a.m. Camphor was another dominant compound where the highest (14.38%) was observed at 00:00–2:00 a.m. Our findings in sage, for the first time, may pave the route towards the optimization of sage EO quality and quantity by selecting the best harvesting time of the plants.

1. Introduction

Salvia spp., with more than 900 species, is categorized as the largest genus of the Lamiaceae family. Plants of this genus grow all over the world and S. officinalis is native to the Middle East and the Mediterranean region. It is a perennial plant and is one of the most important and oldest medicinal plants of the Lamiaceae family [1,2]. This plant has a long history in traditional and culinary medicine and as a flavoring and seasoning and is widely used [3]. A wide range of phytochemicals is well identified in the sage plant. These compounds include alkaloids, carbohydrates, fatty acids, glycoside derivatives, phenolics, such as coumarins and flavonoids, as well as polystylenes, steroids, and essential oils (EOs) [4,5,6]. The aerial parts of this plant, especially the leaves, contain EO widely used as a raw material in various food, cosmetics, and pharmaceutical industries [7]. Numerous studies have reported the EO compositions of different species of sage as follows: ß-pinene, borneol, α-humulene, α-thujene, α-pinene, and camphene [8,9,10,11]. Sage EO has a wide range of medicinal and aromatherapy applications and is traditionally used to treat more than 60 diseases, including colds, bronchitis, tuberculosis, bleeding, and menstrual disorders [12]. According to the reviewed literature, the sage plant has also a great potential to be used as anticholinesterase [13], against diabetes [14], has anti-inflammatory and antispasmodic properties [15], and is also known for its antioxidant and antimicrobial characteristics [16,17,18,19].
Sage is one of the most valuable medicinal plants in terms of EO richness and has EOs with very complex chemical compositions. Recent research in medicine and pharmacy has focused on the development of new drugs and biological materials based on EOs or plant extracts, which will be a new way to treat diseases [20,21,22]. EOs are one of the best bio-preservatives obtained from aromatic plants and important spices and have different levels of antifungal and bacterial activity [23]. Due to the fact that most medicinal plants are cultivated for the production of EOs, the quality of EOs is one of the most important components of the production of these plants, which affects their biological properties. Although the synthesis of EOs of aromatic and medicinal plants is controlled by genetic factors, it is strongly influenced by various factors, such as the physiological stages, agronomic conditions, harvest time, and post-harvest cultivation methods. The percentage and composition of EOs of medicinal plants are strongly influenced by environmental factors, such as day/night temperature, relative humidity, and light conditions (quantity and quality) [24,25].
In some species, the composition of the EO varies with harvest time during the day, and this harvest time may be of great agricultural and economic importance. Therefore, in order to predict the best harvest time, it is necessary to consider a combination of the EO content, yield, composition, and organoleptic properties of EO and reciprocally pay attention to the economic aspects [26]. Changes in the composition and content of EOs at different times of the day and night have been less studied. By reviewing the literature, it becomes obvious that most of the conducted studies in the field are related to the effect of harvest time at different hours of the day (for example for Matricaria chamomile [27], Hypericum species [28], and Laurus nobilis [29]), while less studies have been focused on the overnight harvesting times. Because the main purpose of sage cultivation is to use its EO in various industries, evaluating the amount of EO and its quality at the harvest time is very important for producers. However, daily changes in the phytochemical composition of sage EO have not yet been extensively studied.
Many environmental factors, such as light, humidity, temperature, altitude, and numerous others, alone or together, may result in many biochemical, physiological, and even phenotypical variations, which are ultimately responsible for the alterations occurring in the secondary metabolite content and composition. It is very well known that these factors directly affect the EO content and composition as well [30]. Scientists have already studied many environmental factors, including the photoperiod, day/night temperature, relative humidity, precipitation and/or irrigation conditions, and soil profile, that influence the metabolism of EOs in medicinal plants. For example, one of the factors that greatly affects the EO of medicinal plants is the temperature. The temperature of the air is variable during the day and night, and this causes changes in the EO during the day and night [31]. Studies on eucalyptus, white cedar, and rosemary by Ramezani and colleagues confirm this [32]. Moreover, previous studies on various medicinal plants, such as basil (Ocimum gratissimum) [33], different species of geranium (Pelargonium spp.) [34], lavender (Lavandula angustifolia Mill.) [35], and different species of savory (Satureja spp.) [36], show the significant effect of different harvest hours during the day on the yield and percentage of EO. Studies by [32] regarding the effect of different harvest hours on the percentage of coriander EO (Coriandrum sativum L.) showed that the highest percentage of EO was at 12 noon and then at 6 a.m., 6 p.m., and 12 p.m., respectively [32].
By reviewing a large number of studies on medicinal plants (and, more specifically, the ones which were conducted on EO-bearing plants), it has been seen that the information on the harvest time and diurnal variation of EOs in these plants is very limited. Therefore, identifying the best harvesting time in regard to the maximum EO content, as well as its correlation to the best quality terms of that specific EO, has been considered highly relevant. These terms can be identified according to the pharmacognostic and therapeutic functions of medicinal plants, which are often very well described in the national and international pharmacopeia. Hence, regarding the commercialization aspects of sage collection and harvest and its importance for medicinal plants producers, the present research was performed to identify the changes that occur during the day in the EO content and composition of sage plants. Hence, to better predict the best time to harvest sage plants according to the EO content and composition, several statistical analyses, such as cluster and principal component analyses, were carried out in order to identify the changes that occur during the day and night in the EO content and composition of sage plants. Thus, the main objective of this study was to determine the optimal harvest time for sage EO production by observing the various changes that occur during the day and night.

2. Materials and Methods

2.1. Field Study and Plant Material

The experiment was carried out in the farm of Shahid Madani University (Tabriz, East Azerbaijan, Iran) with the geographical coordinates of 35° 84′ N, 51° 81′ E (1215 m above sea level) in 2018. This area is considered a semi-arid region (mean yearly rainfall of 298 mm), where the majority of rainfalls occurring in autumn and winter. According to the soil analysis, the soil at the experimental site was categorized as a sandy loam (based on the soil texture triangle). Other detailed information regarding the soil and climatic conditions of the experimental site is presented in Table 1 and Figure 1 and Figure 2. During the last week of February, the seedbed was prepared by plow and disk (30 cm). Each plot consisted of five rows, and the experimental unit was 2 m long and consisted of five spaced rows (0.4 m distance between the rows). The sage plant material was supplied by the Research Institute of Forests and Rangelands (RIFR), Iran. The transplanting in the field was performed on 10 May 2018, when the seedlings contained eight true leaves and their heights were about 15 cm. During the growth time, irrigation was performed according to the crop’s needs in relation to the soil properties. Weeding was performed by hand. There were no pests or diseases observed during the plant growth. At the full flowering stage (140 days after planting), the aerial fresh part of the sage plants (10 plants per replication) was collected at twelve different time points (on three different days) of 6:00–8:00 a.m., 8:00–10:00 a.m., 10:00–12:00 a.m., 12:00–2:00 p.m., 2:00–4:00 p.m., 4:00–6:00 p.m., 6:00–8:00 p.m., 8:00–10:00 p.m., 10:00–00:00 p.m., 00:00–2:00 a.m., 2:00–4:00 a.m., and 4:00–6:00 a.m., which were counted as twelve different treatments.

2.2. Essential Oil Extraction

In order to measure the EO content of the harvested material, the aerial parts of the plants were dried under shade for 10 days and powdered using an electric blender. The extraction of EO was conducted using the hydrodistillation method. The extraction of sage EO has been performed using microwave hydrodiffusion and gravity (MHG), as well as microwave-generated hydrodistillation (MGH), by Binello et al. 2014. However, hydrodistillation was suggested as the best and most efficient method [37]. Therefore, the EO of the obtained samples (50 g with 3 replicates for each harvest time) were extracted for 3 h using a Clevenger-type apparatus. The obtained EO was then dried by anhydrous sodium sulphate (British Pharmacopoeia, 1988), and the EO content (w/w %) was determined on an EO weight to dry weight basis. In order to analyze the EO components, coupled gas chromatography and mass spectrometry were used. The obtained spectra and chromatograms were compared with standard spectra (provided by the library), and the relative percentage of each component was calculated using the area under the curve function, as well as the area normalization method described by Kapoor et al. [38].

2.3. Identification of Essential Oil Compositions

After the injection of the extracted EOs into the gas chromatograph and the selection of the best-running column program, the EO samples were diluted with acetone and 1 μL was injected into the gas chromatograph coupled with a mass spectrometer. Individual molecules were spotted and recognized by linking the retention indices (RI) and Kovats Index (KI), as well as the careful alignment of the recorded mass spectra with the ones reported in the National Institute of Standards and Technology (NIST 11.0) mass-spectral library, the Wiley MS data system library (Wiley, Chichester, UK), and the previous literature. In order to calculate the inhibition index, normal hydrocarbons (9–25 °C) under exactly similar thermal conditions as the injected samples were used.

2.4. GC and GC/MS

For the GC and GC/MS analysis, a Thermo-UFM gas chromatograph (Model 9A) with an Hp-5 column was used. The dimensions of the applied column were 10 m × 0.1 mm with 0.4 μm. The temperature program had an initial temperature of 60 °C (3 min), then increased to 285 °C (increasing at a rate of 5.8 °C per min). The apparatus injector and the FID detector temperatures were set at 280 °C. Helium was used as the carrier gas for the GC/FID analysis, with a pressure of 3 kg per cm2. The percentage of each compound was calculated by the electronic integration of the FID peak areas without the use of a response factor correlation. A Varian 3400 GC/MS, connected to an ion trap mass spectrophotometer, was used. The column used was a DB-5 (30 m × 0.25 mm i.d., film thickness 0.25 μm). A similar temperature program was used; however, the final column temperature was 250 °C. The injector temperature was set at 260 °C. Helium gas was used as the carrier gas, with the flow rate of 31.5 cm per second. The scanning time was 1 s, the ionization voltage was 70 eV, and the mass range analyzed was 40–340 amu. The components were identified by comparing their retention time and indices, as well as mass spectra, with those of the authentic standards. The percentage evaluation of the oil components was made by area normalization.

2.5. Statistical Design and Analysis

To assess the influence of the diurnal harvesting time on the EO content and composition and the relationship between EO composition, a variance analysis (a one-way ANOVA based on the randomized complete block design (RCBD)) with 12 treatments, a comparison of means, a principal component analysis (PCA), and a cluster analysis were performed. The blocks (replications) were planned according to the slope of the field. Each block included 12 plots (harvest times). The treatments in each block were randomly selected, there were three blocks in total, and the results were calculated as mean values ± standard error (SE). The variations (standard error of means, SE) and the significances of the treatment effects (F-test) were calculated and tested using the general linear model procedure of SAS. The means of the obtained data were compared using Duncan’s multiple range test at a probability level of p ≥ 0.05.

3. Results and Discussions

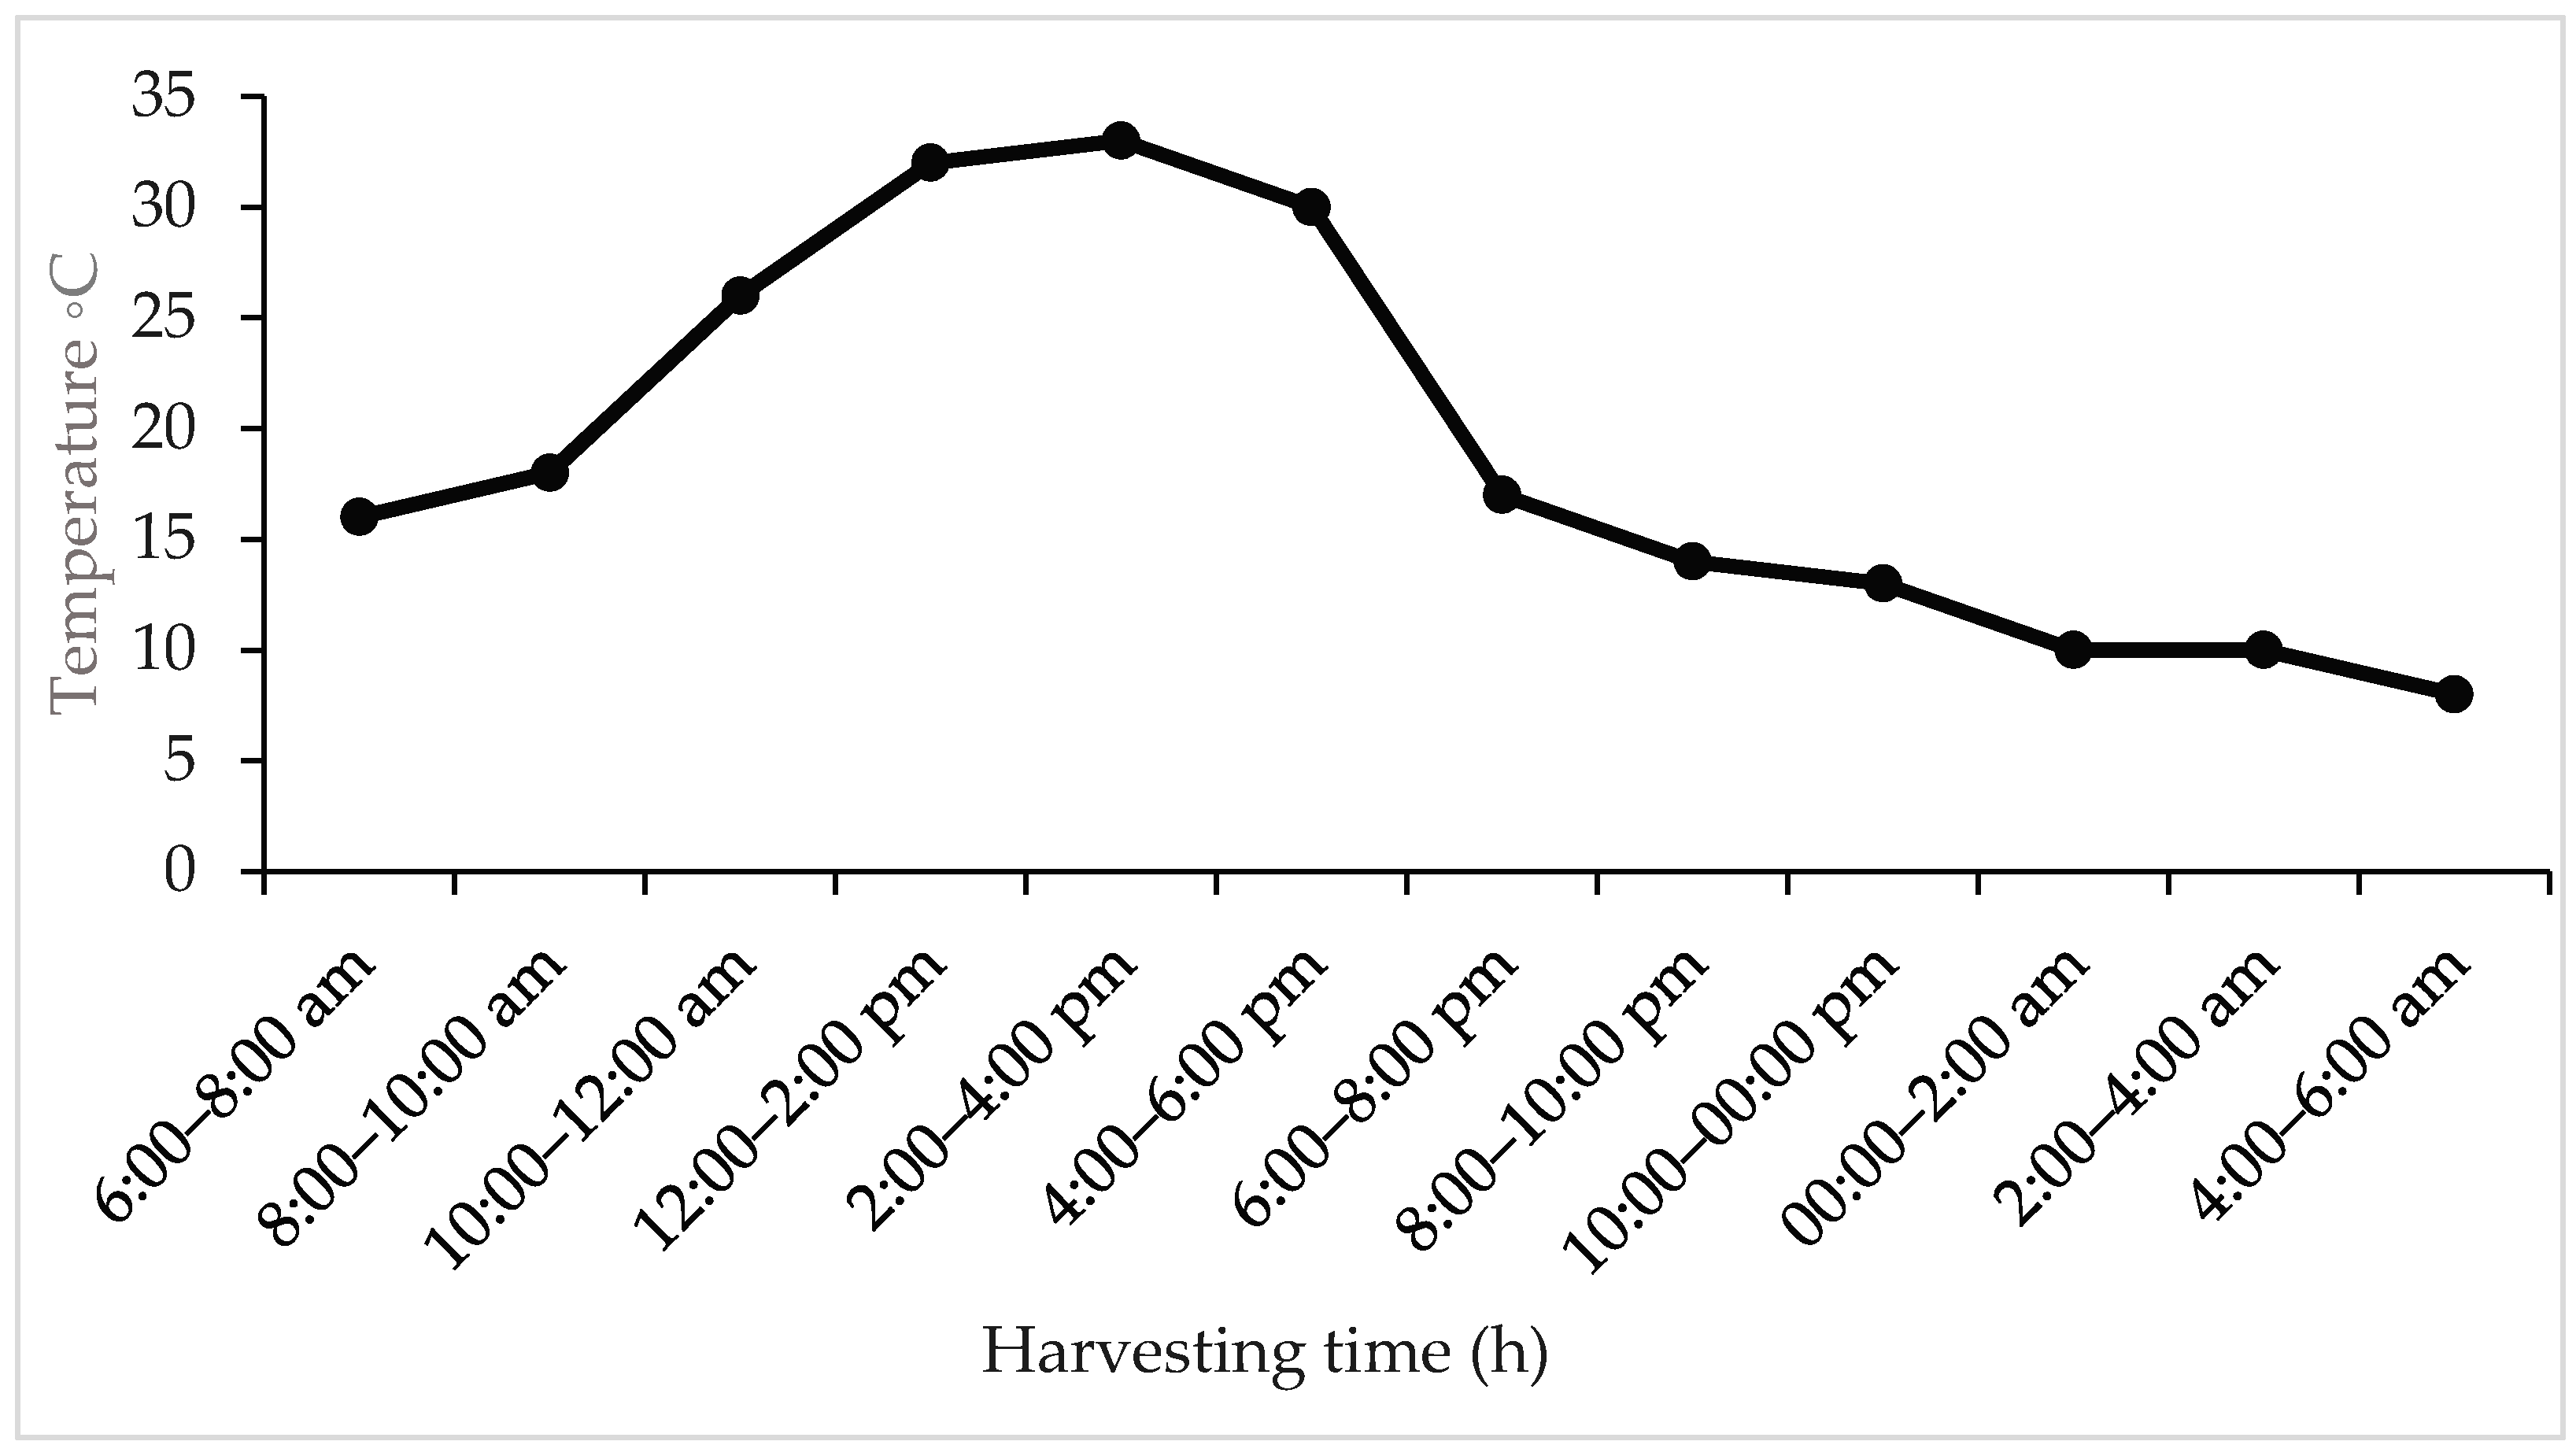
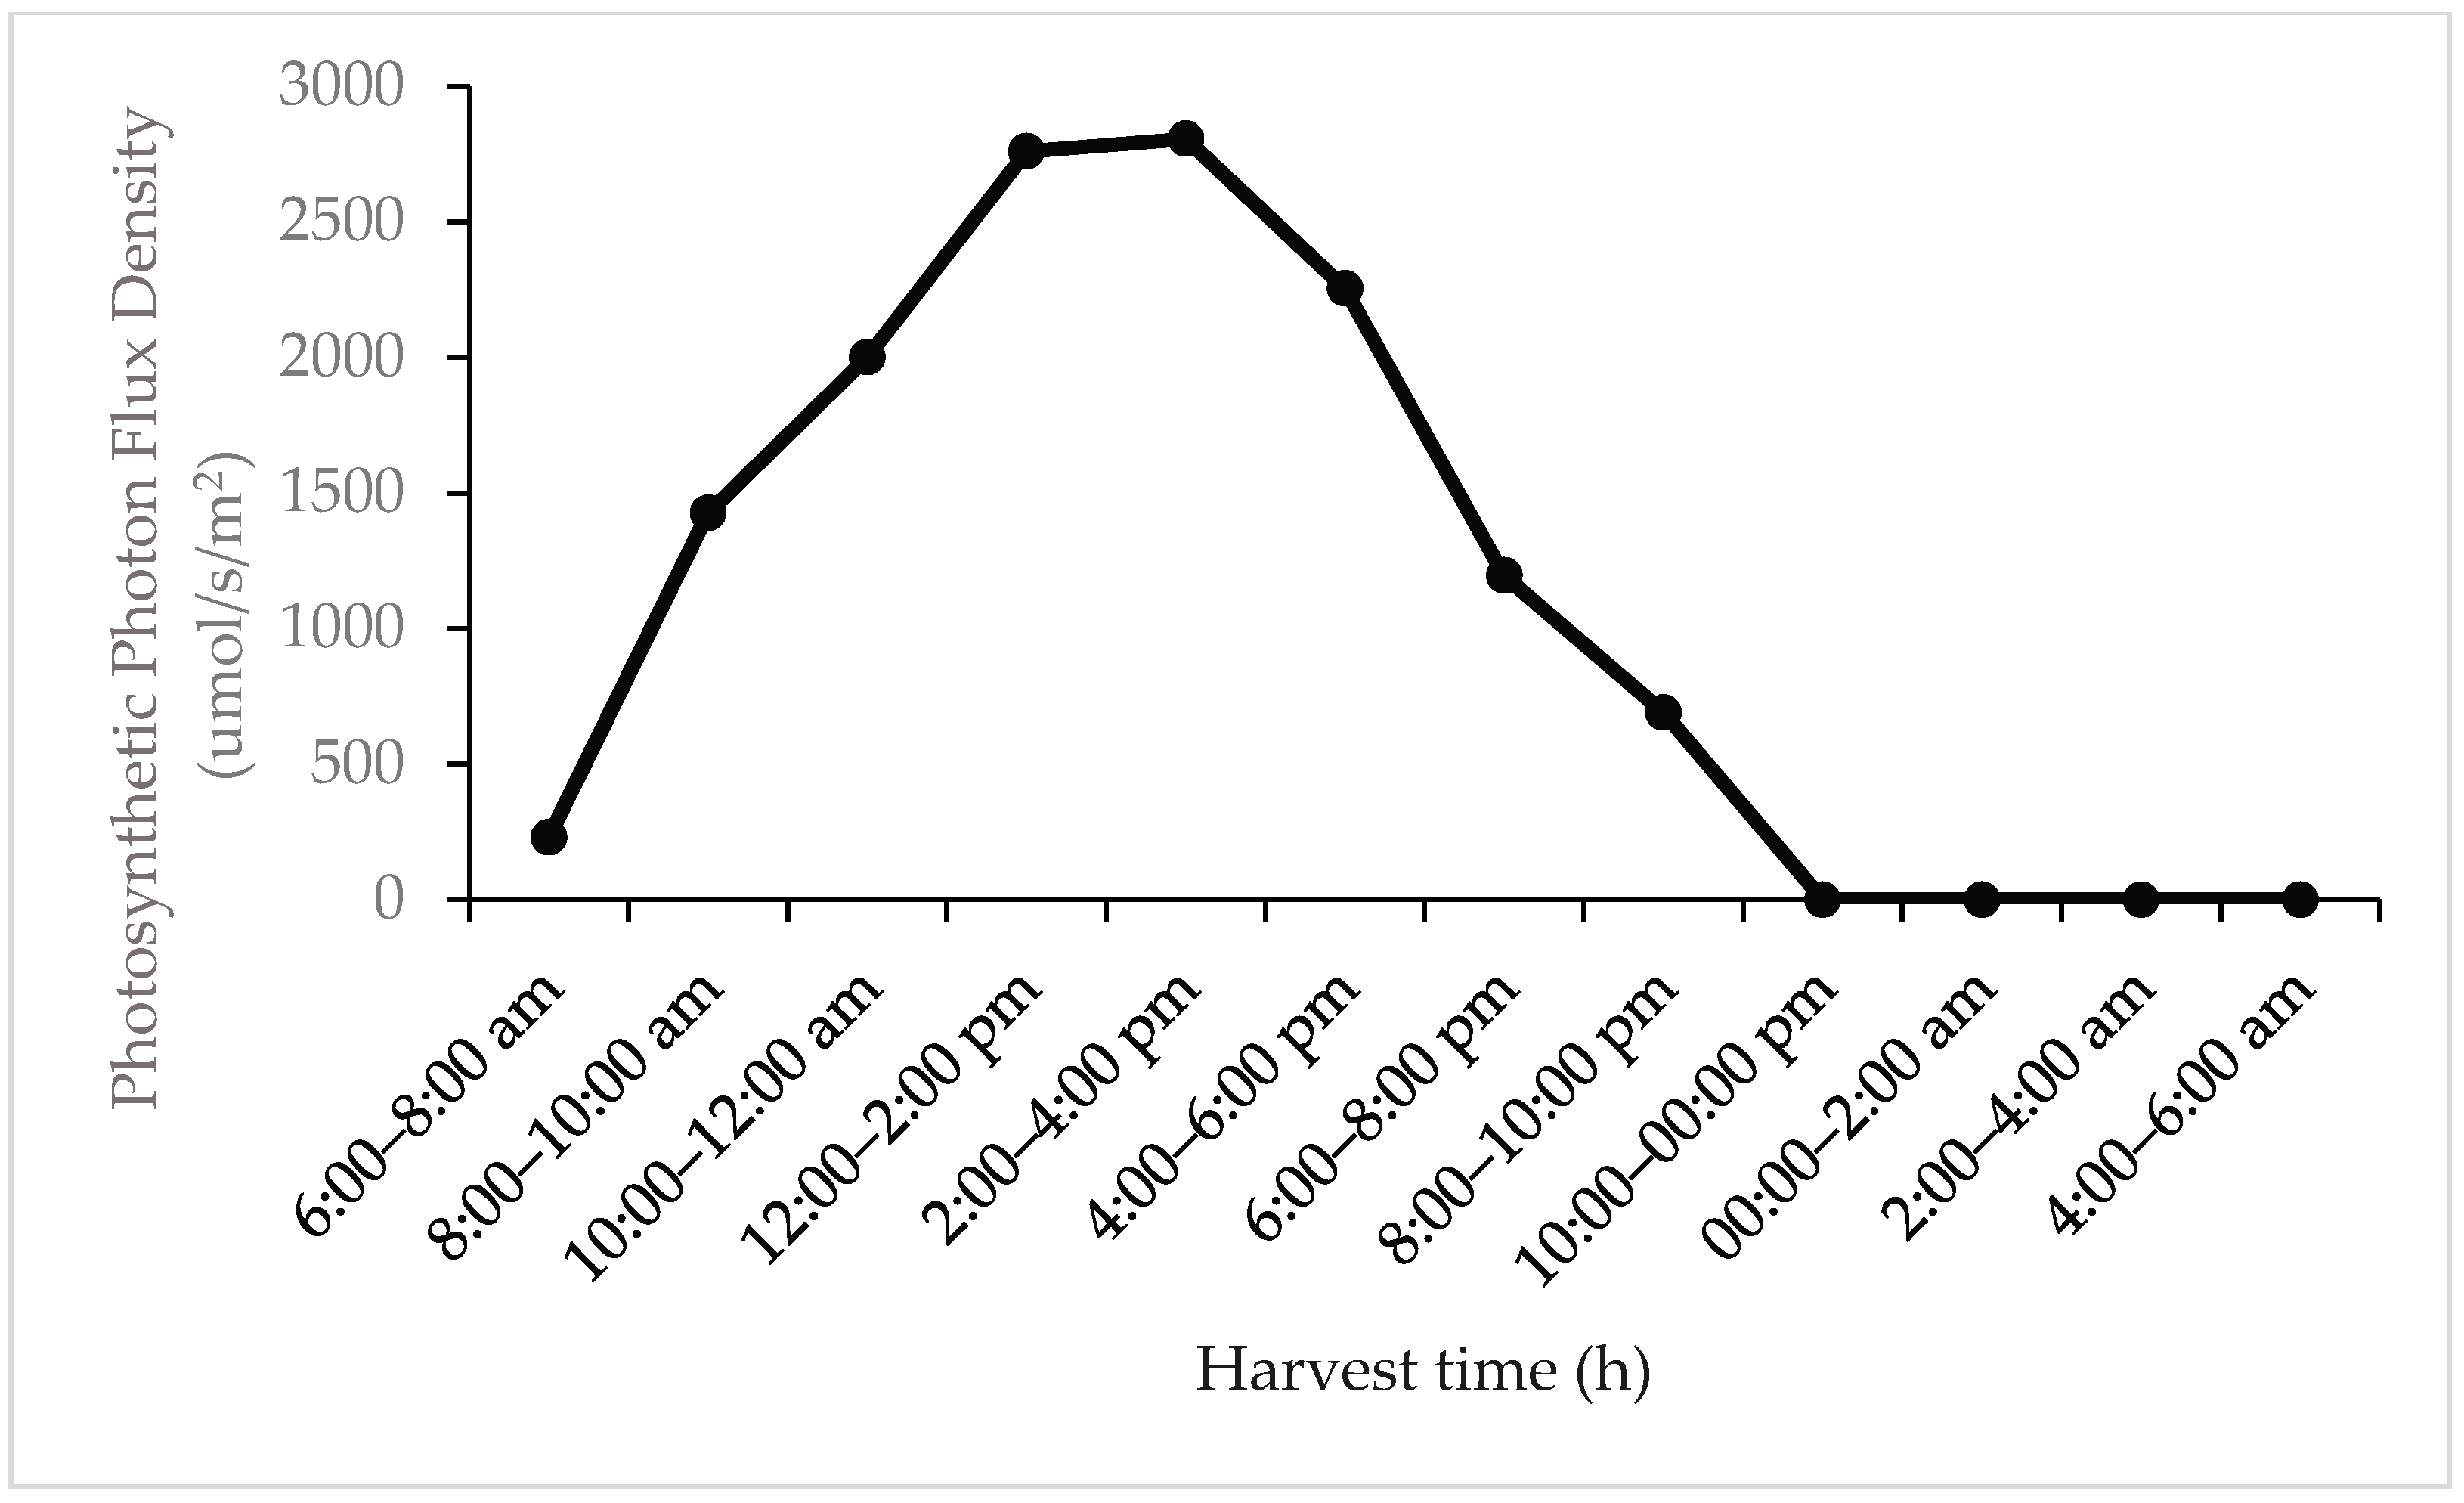
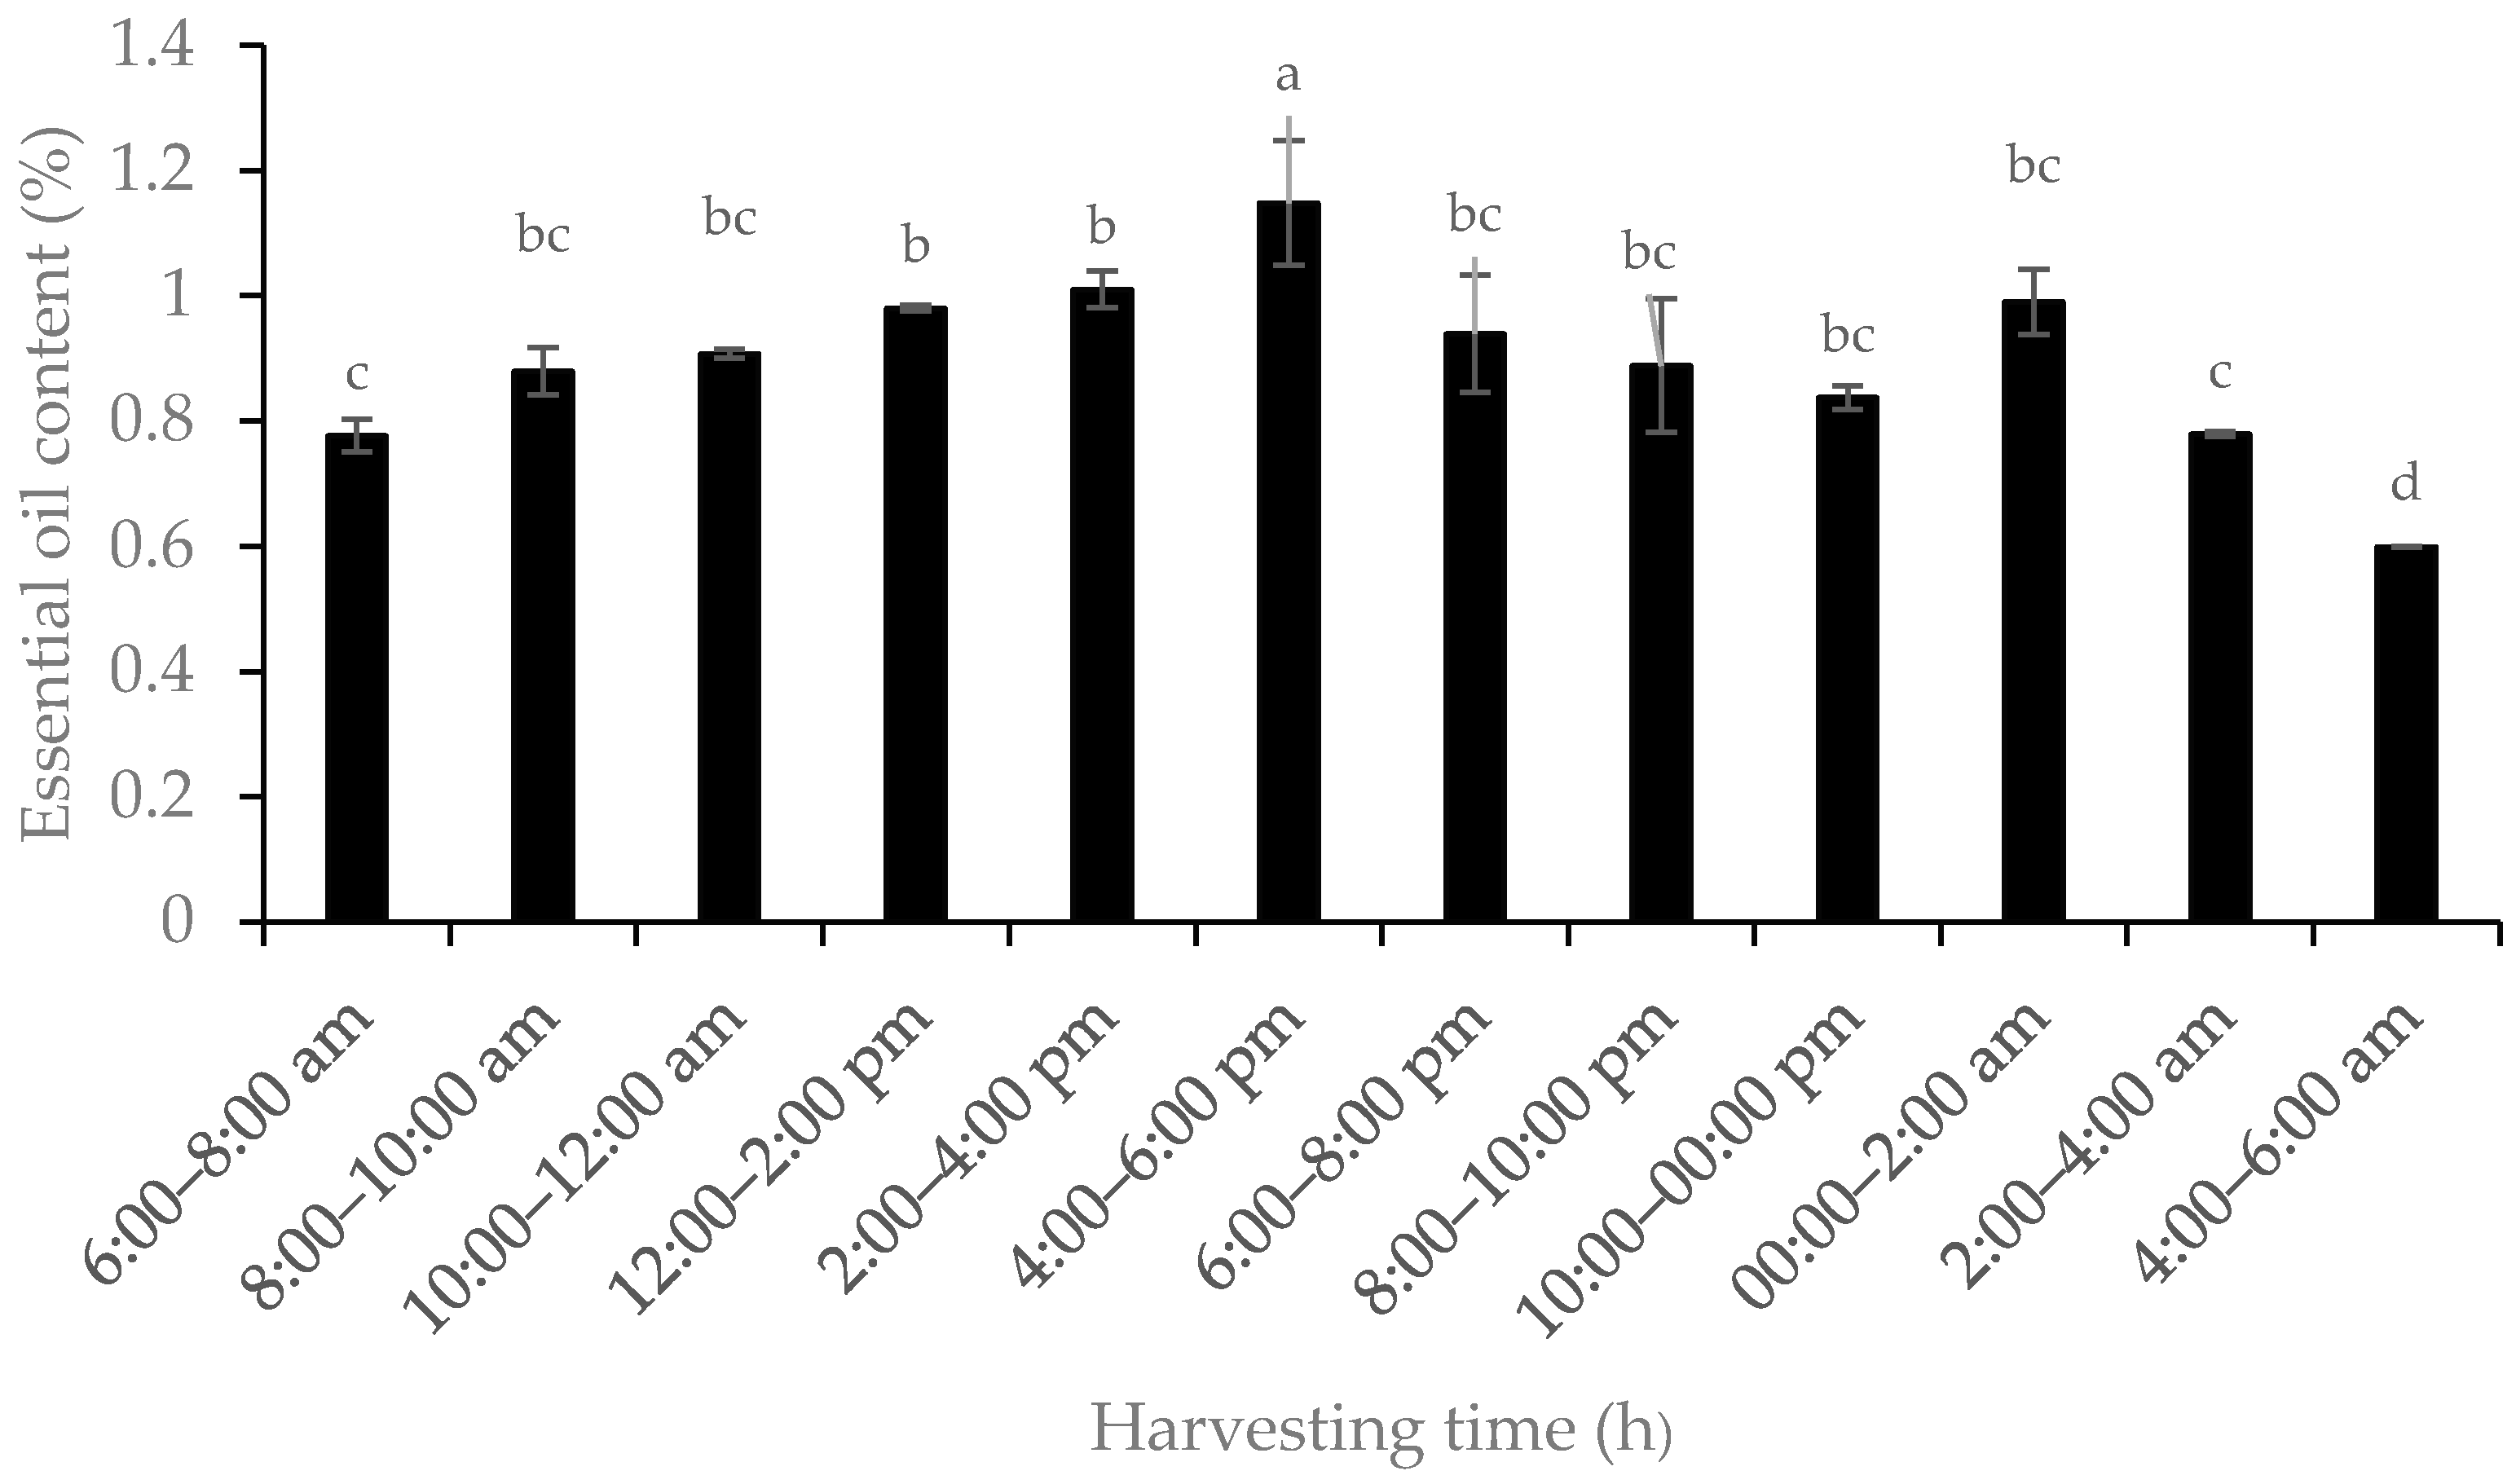
3.1. Essential Oil Content

The essential oil extracted from the sage aerial parts was colorless or pale yellow, with a pleasant smell and the characteristic aroma of the plant. Therefore, based on the extraction of EOs by the hydrodistillation method with a Clevenger-type apparatus, a significant difference was observed in the amount of EO yielded in different hours of the day and night. The higher yield of EO was observed from 10 a.m. to 6 p.m.; among these time periods, the highest level was observed between 4 p.m. and 6 p.m. (1.14%) (Figure 3). On the other hand, the lowest amount of EO was observed at 4:00–6:00 a.m. Our results showed that the EO content is affected by the oscillations occurring in the temperature and relative humidity throughout the day and night patterns. Two of the probable reasons for the high levels of EO during the day compared to night are the light intensity and high temperature. In our study, at 2–4 p.m., when the temperature and light intensity were at their maximum, the highest essential oil yield was obtained. In addition, the quantity and quality of the volatile compounds produced during this period were also high. As a result, high and optimal temperature and light intensity had a great impact on the performance and production of the volatile compounds in this study. Some researchers have reported that at higher light intensities the synthesis of secondary metabolites in medicinal and aromatic plants increases [39].
The results showed that the percentage of EO increased from 6 a.m. to 4 p.m., then showed a slight decrease but returning to increase slightly at 00:00 to 02:00 a.m. This increase was not significantly different compared to the 2 h time courses of before and after the recorded time. The day and nighttime variation of medicinal plants is a very important factor in determining the quantity of the EO produced. This phenomenon directly influences the plant growth and, subsequently, the EO content and composition of medicinal plants (as a result of changed metabolism by, for example, affecting the efficiency/speed of modification of the enzymes activity) [40]. Light is a very important factor involved in glandular trichome development and plant structure in the synthesis and accumulation of EO [41]. In this study, we observed that there was a significant variation during the circadian cycle. We did not investigate the effects of individual factors influencing the circadian cycle, which are subsequently expected to affect the EO content and could be of great interest during future studies. A lower production of EOs under low light conditions can be correlated to the reactions related to carbon synthesis because the production of EO compounds is regulated by photosynthetic processes and increases the production of secondary metabolites under high light conditions, which needs to be carefully investigated. The best harvesting time, which provides the maximum EO content in this research, was established to be in the evening hours after the noontime period, when the sage plants were covered in dew and the temperatures dropped. This temperature is presumed to preserve the volatile organic compounds from vaporization. On the other hand, it is known that the photoperiod can directly influence the EO content and composition, so that the leaf number, as well as the EO content, gradually increased with an increasing the photoperiod (time), where the shorter days (12 h) lead to a reduction in areal part growth and EO content. Although we did not control or perform experiments to understand the effect of photoperiod on the sage EO, there are reports in which the photoperiod role is emphasized as critical in the final EO content (for example, in Cannabis sativa [42] and Mentha species [43]).
A similar variation of the EO percentage, depending on the harvesting time of the day, has been found in Matricaria chamomile [44], Lavandula officinalis [45], Ocimum x citriodorum [39], and Mentha piperita [46].

3.2. Constituents of the EO

The results of the analysis of the constituents of the EO are reported in Table 2. Based on the results, 32 different compounds were identified at different harvest hours. The results of the experiment showed that the quality of the EO was affected by the harvest time at different hours of the day. The major EO compounds were cis-thujone (34.38–46.18%), 1,8-cineol (8.70–11.07), camphor (9.65–14.38), and trans-thujone (9.43–14.19%).
Cis-thujone had the highest value among the identified compounds. Among the harvest hours, the highest (46.18%) and lowest (34.38%) values of cis-thujone were related to 04:00–06:00 a.m. and 00:00–02:00 a.m., respectively. In addition, trans-thujone was another dominant compound in all stages of the harvesting times. The highest (14.19%) and lowest (9.43%) values of this compound were obtained between 10:00–00:00 p.m. and 10:00–12:00 a.m., respectively. Many environmental factors, such as the light intensity (and quality) and diurnal temperature, as well as some abiotic stresses, can play an important role in changing the composition of the extracted EOs from medicinal plants [47]. The greater accumulation of trans-thujone at noon may be due to the intensity of light at this time (Figure 2). Camphor was another dominant compound, and the highest amount (14.38%) was observed at 00:00–2:00 a.m. Another dominant compound was 1,8-cineol, according to results showing the highest (11.07%) and lowest (8.70%) amounts at 02:00–04:00 a.m. and 2:00–4:00 p.m., respectively.
α-pinene, camphene and β-pinene were other compounds whose highest values were obtained at 00:00–2:00 a.m., with 4.32%, 3.05%, and 4.82% values, respectively. (E)-caryophyllene, α-humulene, viridiflorol, and manool were other important compounds that did not differ significantly between treatments in terms of percentage. To the best of our knowledge, three harvest times in sage, including 12:00–2:00 p.m., 2:00–4:00 p.m., and 4:00–6:00 p.m. are suggested, considering the yield, quantity, and quality of the EO.
It is known that the genetic background of plants plays an important role in the chemodiversity of the produced specialized metabolites. However, the combined effect of light, temperature, and relative humidity in a real situation is required to identify the best harvest time for industrial purposes. Factors such as temperature, intensity, the duration of sunlight, and the relative humidity are the main independent variables affecting the composition of EOs in medicinal plants [39,40,41,42,43,44,45,46]. Among the variables, temperature has a substantial effect on plant physiological processes, especially the photosynthetic pathway and the biochemical and phytochemical compounds produced in this process. The results showed that the synthesis of EO compounds is strongly influenced by environmental factors, especially temperature and radiation intensity. The production and function of EO compounds are strongly influenced by genetics, environment, anthogenesis, and daily changes, and changes in EO compounds may occur overnight [48]. Changes in the composition of EOs may be due to the changes in environmental factors that occur during the day, which determine the physiology of the plant that affects the enzyme involved in the synthesis of mono and sesquiterpenes. Although the effect of preharvest and postharvest time of sage plants at the EO level was previously reported and the effect of agricultural practices on the EO content was not significant [49], in this report we reported an additional factor, which is the harvest time effect on the sage EO content and composition. From our analysis, it is not very obvious whether this compound is converted or degraded. Further study is required to identify the molecular changes occurring in the diterpenoid biosynthetic pathway. The variation among the oxygenated EOs and, e.g., 1,8-cineol and cis-thujone, and the sesquiterpenes, e.g., viridiflorol, not only indicates the activity of certain terpene synthases but also a putative cytochrome P450, which acts as an oxygenating agent on terpenoids, sitting on the endoplasmic reticulum membrane. The intrinsic activity of monoterpenoid synthase enzymes in the plastids and oxygenation in the cytosol, therefore, suggests the potential involvement of carrier proteins from and to the cytosol.

3.3. Correlation Analysis

The purpose of the correlation analysis was to determine whether there is a relationship between two phytochemical compounds that are related, whether it is positive or negative, or no correlation exists. The results of the correlation analysis revealed that the combination of 1,8-cineol with camphene (0.40), β-Pinene (0.47), ρ-cymene (0.42), camphor (0.52), borneol (0.38), carvacrol (0.34), and α-humulene (0.36) had positive and significant correlations. On the other hand, the correlation analysis revealed that sabinene (−0.43), cis-sabinene hydrate (−0.34), trans-thujone (−0.33), cis-carveol (−0.64), (E)-caryophyllene (−0.58), β-gurjunene (−0.45), α-humulene (−0.60), and ledene (−0.41) have a significant negative correlations with 1,8-cineol. In addition, a significant positive correlation was noted between the cis-thujone compound with myrcene (0.63) and α-terpineol (0.43), while cis-thujone showed significant negative correlations with α-pinene (−0.45), camphor (−0.36), bornyl acetate (−0.37), δ -cadinene (−0.33), spathulenol (−0.49), caryophyllene oxide (−0.49), viridiflorol (−0.52), ledol (−0.49), and manool (−0.51). The results of the correlation analysis revealed that the trans-thujone correlations with sabinene (0.44), γ-terpinene (0.35), cis-sabinene hydrate (0.45), cis-carveol (0.70), (E)-caryophyllene (0.35), α-humulene (0.52), ledene (0.38), δ-cadinene (0.47), and manool (0.34) were positive and significant, while it had a significant negative correlation with camphene (−0.33), 1,8-cineol (−0.33), camphor (−0.40), and α-humulene (−0.52).
Camphor had positive correlations with α-pinene (0.37), camphene (0.84), β-pinene (0.57), ρ-cymene (0.58), 1,8-cineol (0.52), terpinolene (0.40), borneol (0.85), and α-humulene (0.42), while it had negative correlations with sabinene (−0.42), myrcene (−0.47), cis-thujone (−0.36), trans-thujone (−0.40), cis-carveol (−0.53), δ-cadinene (−0.37), and 13-epi-manool (−0.44) (Table S1). In EO volatile compounds, a positive correlation between compounds means that the amount and production of these components are related to each other, with a relationship between the two variables in which both variables move in the same direction, in a way that by increasing the production of one of them the production of another one is increased, or one variable decreases while the other decreases. On the other hand, negative coefficients show an inverse correlation between compounds [50].

3.4. Cluster Analysis and Principal Component Analysis (PCA)

The cluster analysis was conducted to monitor the differences and similarities between the different harvesting times in order to find the effect of the studied harvesting times on the extracted phytochemicals in S. officinalis. The results of the cluster analysis showed that the 12 treatments were divided into 6 separate groups (G1, G2, G3, G4, G5, and G6) (Figure 4) that were identified by the similarity of their essential oil composition. Based on the dendrogram acquired from the cluster analysis, it was observed that treatments 2:00–4:00 p.m., 4:00–6:00 p.m., 6:00–8:00 p.m., 8:00–10:00 p.m., and 10:00–00:00 p.m. were in the same group (G3), while the 8:00–10:00 a.m., 10:00–12:00 a.m., and 12:00–2:00 p.m. treatments were in Group 2 (G2). The other studied treatments were each represented individually by a group. Hence, the importance of the cluster analysis, in addition to grouping, is to determine which groups are more or less spaced apart. Groups that are separated by a short distance from this study suggest that the quality and quantity of the active ingredients are largely similar. However, in groups separated by long distances, this similarity is low and there are radical differences in terms of the types and amounts of the effective substances. The results of Table S2 show that there is a significant difference between the groups obtained from the cluster analysis based on all the studied compounds, and these confirmatory results are in line with the proper grouping of the dendrogram obtained from the cluster analysis.
The results of the PCA are shown in Table 3. Based on the obtained results, it was observed that 5 components that had specific values higher than 1 accounted for 82.24% of the total calculated variance. The first and the second PCA components, with 29.18 and 25.30%, respectively, had the highest amount of variance among the obtained components. The fourth and fifth components, although having a specific value above 1, accounted for a very small share of the total variance and were, therefore, less important. In addition, the results of the PCA showed that the compounds sabinene (0.57), myrcene (−0.60), 1,8-cineol (−0.60), trans-thujone (0.62), α-terpineol (−0.62), cis-carveol (0.59), bornyl acetate (0.61), (E)-caryophyllene (0.74), β-gurjunene (0.75), α-humulene (0.88), ledene (0.77), δ-cadinene (0.540), spathulenol (0.61), caryophyllene oxide (0.77), viridiflorol (0.72), ledol (0.75), and manool (0.79) had the highest factor loads in the first component. It was also observed that in the second component the compounds α-pinene (0.60), camphene (0.94), β-pinene (0.79), ρ-cymene (0.80), cis-sabinene hydrate (−0.60), terpinolene (0.59), cis-thujone (−0.66), camphor (0.93), and borneol (0.91) had the highest operating loads. On the other hand, in the third component, phellandrene (0.74), α-terpinene (0.73), γ-terpinene (0.78), trans-carveol (0.73), and carvacrol (−0.70) had the highest factor loading.
In the Ferulago angulata plant, a PCA showed that the first two components accounted for 76% of the total variance [51]. Moreover, the authors also showed that eight compounds contributed most of the loading factor for the first component. In the same work, an investigation of Heracleum persicum phytochemical compounds, based on the PCA method, exhibited that the first two components accounted for 78.80% of the total variance. In addition, the 3 components that had the highest eigenvalues accounted for 89.45% of the variance. The relative variances of the first, second, and third components were, respectively, 55.52%, 23.28%, and 10.65% [51]. The study demonstrated that there were differences between the treatments in terms of the phytochemical compounds measured. Esmaeili et al. (2018) showed that the first two components accounted for 95% of the total variance using the principal component analysis based on the phytochemical compounds of Oliveria decumbens [52]. Accordingly, the first and second components, respectively, had the 12 and 7 compounds with the highest factor loadings, respectively. The principal component analysis has been used by other researchers to identify the dominant compounds in other medicinal plants, such as Satureja pilosa [53] and Mentha species [54]. In general, the principal component analysis method is one of the statistical methods that is used to reduce the data and can express a large amount of data in the form of clear results for researchers, and, therefore, in biology and phytochemistry, it is widely used [54,55].
Since 54.48% of the total variance was allocated to the first and second components, they were used for the biplot diagram obtained from the PCA. The biplot diagram of the first and second components is shown in Figure 5. Based on the biplot of the first and second components, the compounds p-cymene, α-pinene, carveol, phellandrene, terpinolene, γ-terpinene, bornyl acetate, spathulenol, caryophyllene oxide, viridiflorol, ledol, β-gurjunene, ledene, and manool were in the same group and showed a strong relationship with the 08:00–10:00 a.m. and 10:00–12:00 a.m. treatments. Camphene, borneol, 1,8-cineol, β-pinene, α-humulene, and carvacrol were also separated independently in the other group and showed strong correlations with the 8:00–10:00 p.m., 10:00–00:00 p.m., 12:00–2:00 p.m., and 00:00–2:00 a.m. treatments. In addition, the biplot results showed that the 2:00–4:00 a.m. treatment had high correlations with α-terpineol, myrcene, and cis-thujone. The biplot results showed that other compounds were strongly associated with the 6:00–8:00 a.m., 2:00–4:00 p.m., 4:00–6:00 p.m., 6:00–8:00 p.m., and 4:00–6:00 a.m. treatments.

4. Conclusions

The current study presents the diurnal variation of the EO content and composition of Salvia officinalis. The results showed that the harvesting time may have a significant effect on the EO yield and composition of sage. Our results clearly give evidence that the quantitative and qualitative properties of EO in sage are subjected to significant hourly changes (different hours of the day and night) during the day/night time. To gain the highest EO yield, the best harvesting time was found to be between 4:00 and 6:00 p.m., whereas between 04:00 and 06:00 a.m. the minimum EO percentage was indicated. Our results also indicate a very interesting pattern of accumulation and then degradation (or conversion) of certain metabolites during the 24 h daytime. Such a variation would potentially provide a basis to study the in-plant conversion of, for example, α-pinene to β-pinene. Another interesting compound that was detected in the EO of sage plants, is manool, which is a labdane-type diterpenoid and is subjected to approximately 80% diurnal variation. Cis-thujone was detected at the highest amount when the plants were collected at 04:00–06:00 a.m. In addition, trans-thujone was another dominant compound, and the highest amount of this compound was obtained between 10:00 and 00:00 p.m. and lowest value was obtained between 10:00 and 12:00 a.m. The obtained results can be associated with several factors that influence secondary metabolite biosynthesis, including light intensity, temperature, and humidity. To the best of our knowledge, three harvest times, including 04:00–06:00 a.m., 2:00–4:00 p.m., and 4:00–6:00 p.m., are suggested as appropriate harvest times, considering the EO yield, quantity, and quality of sage.

Supplementary Materials

The following are available online at https://www.mdpi.com/article/10.3390/horticulturae8020149/s1, Table S1. Correlation between essential oil compounds. Table S2. Mean comparison between different groups derived from cluster analysis in S. officinalis plants.

Author Contributions

Conceptualization, S.H.; methodology, P.B., S.J.H., S.N. and S.H.; validation, S.H. and S.N.; formal analysis, S.H. and S.J.H.; investigation, S.H., S.N. and P.B.; resources, S.H.; data curation, S.H., S.J.H. and A.B.K.; writing—original draft preparation, S.H., S.J.H., P.B. and A.B.K.; writing—review and editing, S.H., A.B.K. and S.N.; visualization, S.N.; supervision, S.H.; project administration, S.H. All authors have read and agreed to the published version of the manuscript.

Funding

This research was funded by Azarbaijan Shahid Madani University, grant number 1400/1510.

Institutional Review Board Statement

Not applicable.

Informed Consent Statement

Not applicable.

Data Availability Statement

The data presented in this study are available upon request from the corresponding author.

Acknowledgments

The support of Azarbaijan Shahid Madani University is greatly appreciated.

Conflicts of Interest

The authors declare no conflict of interest.

References

  1. Bisset, N.; Wichtl, M. Herbal Drugs and Phytopharmaceuticals: A Handbook for Practice on a Scientific Basis with Reference to German Commission E Monographs, 2nd ed.; CRC Press: Boca Raton, FL, USA, 2001; pp. 440–443. [Google Scholar]
  2. Miura, K.; Kikuzaki, H.; Nakatani, N. Apianane terpenoids from Salvia officinalis. Phytochemistry 2001, 58, 1171–1175. [Google Scholar] [CrossRef]
  3. Sharifi-Rad, M.; Ozcelik, B.; Altın, G.; Daşkaya-Dikmen, C.; Martorell, M.; Ramírez-Alarcón, K.; Alarcón-Zapata, P.; Morais-Braga, M.F.B.; Carneiro, J.N.P.; Leal, A.L.A.B.; et al. Salvia spp. plants-from farm to food applications and phytopharmacotherapy. Trends Food Sci. Technol. 2018, 80, 242–263. [Google Scholar] [CrossRef]
  4. Lu, Y.; Foo, L. Flavonoid and phenolic glycosides from Salvia officinalis. Phytochemistry 2000, 55, 263–267. [Google Scholar] [CrossRef]
  5. Veličković, D.T.; Randjelović, N.V.; Ristić, M.S.; Veličković, A.S.; Šmelcerović, A.A. Chemical constituents and antimicrobial activity of the ethanol extracts obtained from the flower, leaf and stem of Salvia officinalis L. J. Serbian Chem. Soc. 2003, 68, 17–24. [Google Scholar] [CrossRef]
  6. Capek, P.; Hříbalová, V. Water-soluble polysaccharides from Salvia officinalis L. possessing immunomodulatory activity. Phytochemistry 2004, 65, 1983–1992. [Google Scholar] [CrossRef] [PubMed]
  7. Laborda, R.; Manzano, I.; Gamón, M.; Gavidia, I.; Pérez-Bermúdez, P.; Boluda, R. Effects of Rosmarinus officinalis and Salvia officinalis essential oils on Tetranychus urticae Koch (Acari: Tetranychidae). Ind. Crops Prod. 2013, 48, 106–110. [Google Scholar] [CrossRef]
  8. Delamare, A.P.L.; Moschen-Pistorello, I.T.; Artico, L.; Atti-Serafini, L.; Echeverrigaray, S. Antibacterial activity of the essential oils of Salvia officinalis L. and Salvia triloba L. cultivated in South Brazil. Food Chem. 2007, 100, 603–608. [Google Scholar] [CrossRef]
  9. Perry, N.B.; Anderson, R.E.; Brennan, N.J.; Douglas, M.H.; Heaney, A.J.; McGimpsey, J.A.; Smallfield, B.M. Essential oils from Dalmatian sage (Salvia officinalis L.): Variations among individuals, plant parts, seasons, and sites. J. Agric. Food Chem. 1999, 47, 2048–2054. [Google Scholar] [CrossRef]
  10. Rguez, S.; Msaada, K.; Daami-Remadi, M.; Chayeb, I.; Rebey, I.B.; Hammami, M.; Laarif, A.; Hamrouni-Sellami, I. Chemical composition and biological activities of essential oils of Salvia officinalis aerial parts as affected by diurnal variations. Plant Biosyst. 2019, 153, 264–272. [Google Scholar] [CrossRef]
  11. Kulak, M.; Gul, F.; Sekeroglu, N. Changes in growth parameter and essential oil composition of sage (Salvia officinalis L.) leaves in response to various salt stresses. Ind. Crops Prod. 2020, 145. [Google Scholar] [CrossRef]
  12. Topçu, G. Bioactive triterpenoids from Salvia species. J. Nat. Prod. 2006, 69, 482–487. [Google Scholar] [CrossRef] [PubMed]
  13. Kennedy, D.O.; Pace, S.; Haskell, C.; Okello, E.J.; Milne, A.; Scholey, A.B. Effects of cholinesterase inhibiting sage (Salvia officinalis) on mood, anxiety and performance on a psychological stressor battery. Neuropsychopharmacology 2006, 31, 845–852. [Google Scholar] [CrossRef] [PubMed]
  14. Eidi, A.; Eidi, M. Antidiabetic effects of sage (Salvia officinalis L.) leaves in normal and streptozotocin-induced diabetic rats. Diabetes Metab. Syndr. Clin. Res. Rev. 2009, 3, 40–44. [Google Scholar] [CrossRef]
  15. Abu-Darwish, M.S.; Cabral, C.; Ferreira, I.V.; Gonçalves, M.J.; Cavaleiro, C.; Cruz, M.T.; Al-Bdour, T.H.; Salgueiro, L. Essential oil of common sage (Salvia officinalis L.) from Jordan: Assessment of safety in mammalian cells and its antifungal and anti-inflammatory potential. BioMed Res. Int. 2013, 2013. [Google Scholar] [CrossRef] [PubMed] [Green Version]
  16. Loizzo, M.R.; Tundis, R.; Menichini, F.; Saab, A.M.; Statti, G.A.; Menichini, F. Cytotoxic activity of essential oils from Labiatae and Lauraceae families against in vitro human tumor models. Anticancer Res. 2007, 27, 3293–3299. [Google Scholar]
  17. Sertel, S.; Eichhorn, T.; Plinkert, P.K.; Efferth, T. Chemical composition and antiproliferative activity of essential oil from the leaves of a medicinal herb, Levisticum officinale, against UMSCC1 head and neck squamous carcinoma cells. Anticancer Res. 2011, 31, 185–191. [Google Scholar]
  18. Kontogianni, V.G.; Tomic, G.; Nikolic, I.; Nerantzaki, A.A.; Sayyad, N.; Stosic-Grujicic, S.; Stojanovic, I.; Gerothanassis, I.P.; Tzakos, A.G. Phytochemical profile of Rosmarinus officinalis and Salvia officinalis extracts and correlation to their antioxidant and anti-proliferative activity. Food Chem. 2013, 136, 120–129. [Google Scholar] [CrossRef]
  19. Russo, A.; Formisano, C.; Rigano, D.; Senatore, F.; Delfine, S.; Cardile, V.; Rosselli, S.; Bruno, M. Chemical composition and anticancer activity of essential oils of Mediterranean sage (Salvia officinalis L.) grown in different environmental conditions. Food Chem. Toxicol. 2013, 55, 42–47. [Google Scholar] [CrossRef]
  20. Şulea, D.; Albu, M.G.; Leca, M.; Mihalache, M.; Popa, L.; Ghica, M.V. Collagen-Thuja tincture biomaterials for wound treatment. 4. Porous matrices containing Thuja tincture and chlorhexidine digluconate. Rev. Roum. Chim. 2012, 57, 569–575. [Google Scholar]
  21. Şulea, D.; Micutz, M.; Albu, M.G.; Staicu, T.; Leca, M.; Popa, L.; Ghica, M.V. Collagen-Thuja tincture biomaterials for wound treatment. 3. Hydrogels containing thuja tincture and chlorhexidine digluconate. Rev. Roum. Chim. 2011, 56, 811–817. [Google Scholar]
  22. Albu, M.G.; Ferdes, M.; Kaya, D.A.; Ghica, M.V.; Titorencu, I.; Popa, L.; Albu, L. Collagen wound dressings with anti-inflammatory activity. Mol. Cryst. Liq. Cryst. 2012, 555, 271–279. [Google Scholar] [CrossRef]
  23. Burt, S. Essential oils: Their antibacterial properties and potential applications in foods—A review. Int. J. Food Microbiol. 2004, 94, 223–253. [Google Scholar] [CrossRef] [PubMed]
  24. Asghari, G.; Houshfar, G.; Mahmoudi, Z.; Asghari, M. Diurnal variation of essential of the oil components of pycnocycla spinosa decne. ex boiss. Jundishapur J. Nat. Pharm. Prod. 2014, 9, 35–38. [Google Scholar] [CrossRef] [PubMed] [Green Version]
  25. Baricevic, T.; Bartol, T. The biological/pharmacological activity of the Salvia genus. Sage the Genus Salvia. Harwood Acad. Publ. Amst. 2000, 11, 143–184. [Google Scholar]
  26. Šalamon, I. Effect of the internal and external factors on yield and qualitative quantitative characteristics of chamomile essential oil. Acta Hortic. 2006, 749, 45–65. [Google Scholar] [CrossRef]
  27. Salehi, A.; Hazrati, S. How essential oil content and composition fluctuate in German Chamomile flowers during the day? J. Essent. Oil-Bearing Plants 2017, 20, 622–631. [Google Scholar] [CrossRef]
  28. Çirak, C.; Saǧlam, B.; Ayan, A.K.; Kevseroǧlu, K. Morphogenetic and diurnal variation of hypericin in some Hypericum species from Turkey during the course of ontogenesis. Biochem. Syst. Ecol. 2006, 34, 1–13. [Google Scholar] [CrossRef]
  29. Kevseroğlu, K.; Çirak, C.; Özyazici, G. A study on ontogenetic and diurnal variability of Laurel (Laurus nobilis L.) Leaves. Turkish J. F. Crop. 2003, 8, 29–32. [Google Scholar] [CrossRef]
  30. Figueiredo, A.; Barroso, J.; Pedro, L.; Salgueiro, L.; Miguel, M.; Faleiro, M. Portuguese thymbra and Thymus Species volatiles: Chemical composition and biological activities. Curr. Pharm. Des. 2008, 14, 3120–3140. [Google Scholar] [CrossRef]
  31. Bufalo, J.; Zheljazkov, V.D.; Cantrell, C.L.; Astatkie, T.; Ciampa, L.; Jeliazkova, E. Diurnal effects on spearmint oil yields and composition. Sci. Hortic. (Amst.) 2015, 182, 73–76. [Google Scholar] [CrossRef]
  32. Ramezani, S.; Rahmanian, M.; Jahanbin, R.; Mohajeri, F.; Reza Rezaei, M.; Solaimani, B. Diurnal Changes in essential oil content of Coriander (Coriandrum sativum L.) aerial parts from Iran. Res. J. Biol. Sci. 2009, 4, 277–281. [Google Scholar]
  33. Silva, M.G.d.V.; Craveiro, A.A.; Matos, F.J.A.; MacHado, M.I.L.; Alencar, J.W. Chemical variation during daytime of constituents of the essential oil of Ocimum gratissimum leaves. Fitoterapia 1999, 70, 32–34. [Google Scholar] [CrossRef]
  34. Rao, B.R.; Bhattacharya, A.; Kaul, P.; Ramesh, S. Yield and chemical composition of rose-scented Geranium (Pelargonium species) oil at different times of harvesting. J. Essent. Oil Res. 2001, 13, 456–459. [Google Scholar] [CrossRef]
  35. Hassiotis, C.N.; Lazari, D.M.; Vlachonasios, K.E. The effects of habitat type and diurnal harvest on essential oil yield and composition of Lavandula angustifolia Mill. Fresenius Environ. Bull. 2010, 19, 1491–1498. [Google Scholar]
  36. Genova, E. Changes in the essential oil content of some Bulgarian Satureja specie. Fitologiya 1980, 14. [Google Scholar]
  37. Binello, A.; Orio, L.; Pignata, G.; Nicola, S.; Chemat, F.; Cravotto, G. Effect of microwaves on the in situ hydrodistillation of four different Lamiaceae. Comptes Rendus Chim. 2014, 17, 181–186. [Google Scholar] [CrossRef]
  38. Kapoor, R.; Giri, B.; Mukerji, K.G. Improved growth and essential oil yield and quality in Foeniculum vulgare Mill on mycorrhizal inoculation supplemented with P-fertilizer. Bioresour. Technol. 2004, 93, 307–311. [Google Scholar] [CrossRef]
  39. Paulus, D.; Valmorbida, R.; Ramos, C.E.P. Productivity and chemical composition of the essential oil of Ocimum x citriodorum Vis. according to ontogenetic and diurnal variation. J. Appl. Res. Med. Aromat. Plants 2019, 12, 59–65. [Google Scholar] [CrossRef]
  40. Melo, F.H.C.; Moura, B.A.; de Sousa, D.P.; de Vasconcelos, S.M.M.; Macedo, D.S.; Fonteles, M.M.d.F.; Viana, G.S.d.B.; de Sousa, F.C.F. Antidepressant-like effect of carvacrol (5-Isopropyl-2-methylphenol) in mice: Involvement of dopaminergic system. Fundam. Clin. Pharmacol. 2011, 25, 362–367. [Google Scholar] [CrossRef]
  41. Morais, L.A.S.M. Influence of abiotic factors on the chemical composition of the essential oils. Braz. Hortic. 2009, 27, 4050–4063. [Google Scholar]
  42. Zhang, M.; Anderson, S.L.; Brym, Z.T.; Pearson, B.J. Photoperiodic flowering response of essential oil, grain, and fiber Hemp (Cannabis sativa L.) Cultivars. Front. Plant Sci. 2021, 12. [Google Scholar] [CrossRef]
  43. Farooqi, A.H.A.; Sangwan, N.S.; Sangwan, R.S. Effect of different photoperiodic regimes-on growth, flowering and essential oil in Mentha species. Plant Growth Regul. 1999, 29, 181–187. [Google Scholar] [CrossRef]
  44. Fatthi Siahkamari, S.; Ghojehbegloo, A.; Salehi Sardoei, H.; Khairullah, A. Evaluation of the effects of drought stress and salicylic acid on some growth traits, photosynthetic pigments and yield of peppermint essential oil (Mentha piperita L.). New Agric. Find. 2017, 11, 125–137. [Google Scholar]
  45. Yalcin, H.; Kavuncuoğlu, H.; Tulukcu, E.; Eroğlu, Z. The effect of harvest time on the bioactive properties and volatile components of Lavender (Lavandula officinalis). Qual. Assur. Saf. Crop. Foods 2017, 9, 275–283. [Google Scholar] [CrossRef]
  46. De Oliveira, A.R.M.F.; Jezler, C.N.; Oliveira, R.A.; Costa, L.C.d.B. Influence of plant age on production and quality of essential oil of peppermint. Rev. Ceres 2012, 59, 241–245. [Google Scholar] [CrossRef]
  47. Tounekti, T.; Khemira, H. NaCl stress-induced changes in the essential oil quality and abietane diterpene yield and composition in common sage. J. Intercult. Ethnopharmacol. 2015, 4, 208. [Google Scholar] [CrossRef] [PubMed]
  48. Toncer, O.; Karaman, S.; Diraz, E. An annual variation in essential oil composition of Origanum syriacum from Southeast Anatolia of Turkey. J. Med. Plants Res. 2010, 4, 1059–1064. [Google Scholar] [CrossRef]
  49. Tibaldi, G.; Fontana, E.; Nicola, S. Cultivation practices do not change the Salvia sclarea L. essential oil but drying process does. J. Food Agric. Environ. 2010, 8, 790–794. [Google Scholar]
  50. Farmanpour-Kalalagh, K.; Mohebodini, M.; Sabaghnia, N. Comparison and correlation of the compositions in volatile constituents from different parts of summer Savory (Satureja hortensis L.). Int. J. Hortic. Sci. Technol. 2020, 7, 295–304. [Google Scholar] [CrossRef]
  51. Hazrati, S.; Mollaei, S.; Angourani, H.R.; Hosseini, S.J.; Sedaghat, M.; Nicola, S. How do essential oil composition and phenolic acid profile of Heracleum persicum fluctuate at different phenological stages? Food Sci. Nutr. 2020, 8, 6192–6206. [Google Scholar] [CrossRef]
  52. Esmaeili, H.; Karami, A.; Maggi, F. Essential oil composition, total phenolic and flavonoids contents, and antioxidant activity of Oliveria decumbens Vent. (Apiaceae) at different phenological stages. J. Clean. Prod. 2018, 198, 91–95. [Google Scholar] [CrossRef]
  53. Dardioti, A.; Karousou, R.; Lanaras, T.; Kokkini, S. Diversity of Satureja pilosa subsp. origanita essential oils: A new “oregano” from East Mediterranean. Biochem. Syst. Ecol. 2012, 40, 178–183. [Google Scholar] [CrossRef]
  54. Hosseini, S.J.; Tahmasebi-Sarvestani, Z.; Pirdashti, H.; Modarres-Sanavy, S.A.M.; Mokhtassi-Bidgoli, A.; Hazrati, S.; Nicola, S. Investigation of yield, phytochemical composition, and photosynthetic pigments in different mint ecotypes under salinity stress. Food Sci. Nutr. 2021, 9, 2620–2643. [Google Scholar] [CrossRef] [PubMed]
  55. Ringnér, M. What is principal component analysis? Nat. Biotechnol. 2008, 26, 303–304. [Google Scholar] [CrossRef] [PubMed]
Figure 1. Averages of the air temperatures during the collecting times of S. officinalis.
Horticulturae 08 00149 g001
Figure 2. Averages of the light intensities during the collecting times of S. officinalis.
Horticulturae 08 00149 g002
Figure 3. Changes in the essential oil percentage of S. officinalis during the day and night. Means followed by common letter are not significantly different at the level of 5% (Duncan’s multiple range test).
Horticulturae 08 00149 g003
Figure 4. Hierarchical cluster analysis based on all studied traits during the day and night of S. officinalis. (G1 (group 1), G2 (group 2), G3 (group 3), G4 (group 4), G5 (group 5), and G6 (group 6)). The dashed line in the dendrogram was inserted automatically using the partitioning algorithm by the XLSTAT software.
Horticulturae 08 00149 g004
Figure 5. Biplot based on the first and second principal components (PC) during the day and night of S. officinalis. (a) Grouping of different treatments studied based on the first and second components. (b) Grouping of phytochemical compounds obtained from essential oils according to their first and second components and (c) Scree plot obtained by principal components analysis, which represents the eigenvalue values of each component. The compounds codes are reported in Table 2.
Horticulturae 08 00149 g005aHorticulturae 08 00149 g005b
Table 1. Physicochemical properties of the soil.
Soil TextureElectrical Conductivity (dS. m−1)Soil AcidityOrganic MatterTotal NAvailable PAvailable KAvailable ZnAvailable CuAvailable P FeAvailable P Mn
%mg kg−1
sandy loam5.557.971.150.1128.58200.520.541.23
Table 2. Chemical composition of the essential oil components of S. officinalis obtained at different times of the day and night.
Part A: from 6 a.m. to 6 p.m.
NoRIAdams (RI)Compounds6:00–8:00 a.m.8:00–10:00 a.m.10:00–12:00 a.m.12:00–2:00 p.m.2:00–4:00 p.m.4:00–6:00 p.m.
1928932α-Pinene 3.70 ± 0.08 cd3.94 ± 0.09 b3.66 ± 0.03 cd3.54 ± 0.04 d4.16 ± 0.03 ab3.09 ± 0.05 e
2943946Camphene3.11 ± 0.22 de4.02 ± 0.22 b3.83 ± 0.01 cd3.85 ± 0.03 c3.91 ± 0.11 bc3.19 ± 0.05 de
3967969Sabinene0.24 ± 0.03 ab0.25 ± 0.01 ab0.28 ± 0.02 a0.25 ± 0.01 ab0.24 ± 0.01 ab0.29 ± 0.01 a
4971974β-Pinene 2.43 ± 0.01 d2.81 ± 0.02 ab2.52 ± 0.03 cd2.77 ± 0.13 bc2.54 ± 0.06 cd2.62 ± 0.05 b-d
5992988Myrcene1.94 ± 0.08 c1.60 ± 0.01 d1.50 ± 0.03 d1.95 ± 0.03 c2.22 ± 0.04 b2.51 ± 0.05 a
610011002Phellandrene0.00 ± 0.00 c0.05 ± 0.00 b0.00 ± 0.00 c0.00 ± 0.00 c0.00 ± 0.00 c0.00 ± 0.00 c
710121014α-Terpinene 0.19 ± 0.01 ab0.21 ± 0.01 ab0.20 ± 0.02 ab0.24 ± 0.02 a0.19 ± 0.01 ab0.17 ± 0.01 b
810191020p-Cymene 0.28 ± 0.01 c0.31 ± 0.00 bc0.30 ± 0.02 bc0.32 ± 0.01 a–c0.29 ± 0.01 c0.29 ± 0.00 c
9102710261,8-cineol9.63 ± 0.21 ef10.38 ± 0.14 ab9.87 ± 0.13 c–e10.35 ± 0.38 b–d8.70 ± 0.17 g9.81 ± 0.01 de
1010521054γ-Terpinene0.41 ± 0.01 a–c0.46 ± 0.03 a–c0.43 ± 0.02 a–c0.47 ± 0.01 a0.42 ± 0.01 a–c0.37 ± 0.01 cd
1110661065cis-Sabinene hydrate0.21 ± 0.03 ab0.17 ± 0.01 b–e0.18 ± 0.01 b–d0.17 ± 0.01 b–e0.16 ± 0.00 de0.18 ± 0.01 b–d
1210831086Terpinolene0.20 ± 0.02 c0.25 ± 0.00 a0.23 ± 0.01 a–c0.25 ± 0.01 a0.21 ± 0.01 a–c0.20 ± 0.01 c
1311071101cis-Thujone 42.22 ± 2.27 b37.04 ± 1.05 fg37.82 ± 1.16 d–f40.65 ± 0.20 bc40.90 ± 0.64 bc39.29 ± 0.41 c–e
1411151112trans-Thujone10.38 ± 0.10 c11.30 ± 0.30 b9.43 ± 0.37 d10.13 ± 0.39 cd10.57 ± 0.25 c10.59 ± 0.27 c
1511401141Camphor9.65 ± 0.25 g12.88 ± 0.90 ab13.04 ± 0.55 bc12.23 ± 0.14 cd11.02 ± 0.13 ef10.61 ± 0.23 e
1611681165Borneol1.18 ± 0.00 f1.48 ± 0.04 a–c1.48 ± 0.08 a–e1.50 ± 0.05 a–d1.50 ± 0.05 a–d1.25 ± 0.03 ef
1711871186α-Terpineol 0.68 ± 0.01 c0.52 ± 0.01 d0.51 ± 0.01 d0.71 ± 0.02 c0.90 ± 0.05 b1.08 ± 0.04 a
1812161215trans-Carveol0.00 ± 0.00 c0.05 ± 0.00 b0.00 ± 0.00 c0.00 ± 0.00 c0.00 ± 0.00 c0.00 ± 0.00 c
1912301226cis-Carveol0.07 ± 0.01 a0.07 ± 0.00 b0.00 ± 0.00 b0.00 ± 0.00 b0.07 ± 0.00 b0.06 ± 0.00 b
2012861284Bornyl acetate0.84 ± 0.02 c0.94 ± 0.00 ab0.94 ± 0.02 ab0.81 ± 0.01 a–c1.02 ± 0.07 a0.91 ± 0.04 ab
2113931298Carvacrol0.22 ± 0.00 a0.18 ± 0.03 b0.12 ± 0.00 b0.22 ± 0.01 ab0.31 ± 0.01 ab0.42 ± 0.01 ab
2214171417(E)-Caryophyllene 1.91 ± 0.05 bc1.84 ± 0.12 ab2.13 ± 0.03 a1.37 ± 0.04 bc1.74 ± 0.03 ab2.05 ± 0.09 a
2314361431β-Gurjunene0.24 ± 0.02 a–c0.25 ± 0.01 ab0.25 ± 0.03 a0.14 ± 0.00 bc0.25 ± 0.03 a0.21 ± 0.01 a–c
2414521452α-Humulene2.48 ± 0.31 b–d2.59 ± 0.17 a–d2.74 ± 0.14 ab1.78 ± 0.01 cd2.67 ± 0.07 a–c2.71 ± 0.01 ab
2514921496Ledene0.19 ± 0.01 d0.24 ± 0.01 ab0.21 ± 0.02 a–c0.20 ± 0.01 a–d0.19 ± 0.01 a–d0.18 ± 0.01 b–d
2615201522δ-Cadinene0.00 ± 0.00 ab0.00 ± 0.00 b0.00 ± 0.00 b0.00 ± 0.00 b0.00 ± 0.00 b0.00 ± 0.00 b
2715751577Spathulenol0.16 ± 0.01 a0.18 ± 0.01 a–c0.20 ± 0.01 ab0.16 ± 0.01 a–c0.12 ± 0.01 bc0.17 ± 0.00 a–c
2815821582Caryophyllene oxide0.45 ± 0.03 a0.48 ± 0.02 b0.61 ± 0.01 ab0.47 ± 0.01 b0.45 ± 0.03 b0.52 ± 0.03 ab
2915911592Viridiflorol2.04 ± 0.21 ef2.21 ± 0.15 d–f2.81 ± 0.02 ab2.39 ± 0.02 a–d2.17 ± 0.04 c–f2.75 ± 0.14 a–c
3015971602Ledol0.66 ± 0.03 a0.66 ± 0.03 ab0.77 ± 0.01 ab0.62 ± 0.02 ab0.75 ± 0.03 ab0.78 ± 0.07 ab
3120542056Manool2.74 ± 0.15 bc2.24 ± 0.07 bc3.18 ± 0.02 a2.21 ± 0.12 bc1.87 ± 0.08 bc3.14 ± 0.08 a
322066205913-epi-Manool1.10 ± 0.06 a0.00 ± 0.00 b0.00 ± 0.00 b0.00 ± 0.00 b0.00 ± 0.00 b0.00 ± 0.00 b
Part B: from 6 p.m. to 6 a.m.
NoRIAdams (RI)Compounds6:00–8:00 p.m.8:00–10:00 p.m.10:00–00:00 p.m.00:00–2:00 a.m.2:00–4:00 a.m.4:00–6:00 a.m.
1928932α-Pinene09 ± 0.05 e06 ± 0.02 e17 ± 0.04 e32 ± 0.11 a76 ± 0.03 c99 ± 0.05 e
294394Camphene37 ± 0.13 d83 ± 0.10 c01 ± 0.01 e82 ± 0.11 a15 ± 0.04 bc10 ± 0.06 de
3967969Sabinene28 ± 01 a19 ± 01 c29 ± 01 a22 ± 01 bc20 ± 01 bc25 ± 03 ab
4971974β-Pinene57 ± 0.04 cd52 ± 0.13 cd55 ± 0.03 cd05 ± 0.03 a70 ± 0.06 bc54 ± 0.14 cd
5992988Myrcene58 ± 0.05 d22 ± 0.12 b68 ± 0.04 d53 ± 0.02 d68 ± 0.01 d32 ± 0.04 b
610011002Phellandrene06 ± 01 a00 ± 00 c00 ± 00 c00 ± 00 c06 ± 00 a00 ± 00 c
710121014α-Terpinene23 ± 03 ab08 ± 01 c20 ± 00 ab00 ± 00 d22 ± 00 ab22 ± 04 ab
810191020p-Cymene31 ± 04 bc27 ± 02 c30 ± 01 bc37 ± 01 a36 ± 03 ab29 ± 01 c
9102710261,8-cineol20 ± 0.12 fg42 ± 0.19 bc37 ± 0.08 ef85 ± 0.09 ab80 ± 0.12 ab07 ± 0.30 a
1010521054γ-Terpinene47 ± 02 a33 ± 01 d45 ± 03 ab39 ± 01 bc46 ± 02 ab41 ± 04 a–c
1110661065cis-Sabinene hydrate24 ± 02 a18 ± 01 b–d21 ± 01 a–c16 ± 01 de14 ± 01 e17 ± 01 c–e
1210831086Terpinolene24 ± 00 ab20 ± 01 bc23 ± 01 a–c23 ± 01 a–c26 ± 02 a20 ± 01 c
1311071101cis-Thujone26 ± 0.50 b–d44 ± 0.25 b–d93 ± 0.04 e–g38 ± 0.10 g52 ± 0.21 c–f18 ± 0.34 a
1411151112trans-Thujone45 ± 0.31 b43 ± 0.04 d19 ± 0.47 a29 ± 0.16 cd89 ± 0.12 cd28 ± 0.05 cd
1511401141Camphor80 ± 0.29 de45 ± 0.26 b10 ± 0.17 fg38 ± 0.10 a49 ± 0.23 b34 ± 0.20 fg
1611681165Borneol41 ± 0.05 b–f64 ± 0.04 ab32 ± 0.04 c–f70 ± 0.06 a67 ± 0.19 a26 ± 0.02 d–f
1711871186α-Terpineol49 ± 01 d99 ± 00 ab55 ± 03 d67 ± 01 c57 ± 02 d90 ± 06 b
1812161215trans-Carveol05 ± 00 ab00 ± 00 c00 ± 00 c00 ± 00 c06 ± 00 a00 ± 00 c
1912301226cis-Carveol04 ± 02 b00 ± 00 b09 ± 01 b00 ± 00 b00 ± 00 b00 ± 00 b
2012861284Bornyl acetate91 ± 05 ab83 ± 01 a–c92 ± 04 ab91 ± 01 ab00 ± 0.12 ab75 ± 03 bc
2113931298Carvacrol13 ± 01 b35 ± 03 ab15 ± 00 b54 ± 03 ab17 ± 01 b32 ± 02 ab
2214171417(E)-Caryophyllene11 ± 0.06 a31 ± 0.05 bc00 ± 0.06 a10 ± 0.12 c62 ± 0.05 a–c31 ± 0.07 bc
2314361431β-Gurjunene24 ± 02 ab21 ± 01 a–c24 ± 01 ab23 ± 01 ab18 ± 01 a–c12 ± 00 c
2414521452α-Humulene81 ± 0.11 a90 ± 0.06 b–d86 ± 0.03 a17 ± 0.01 a–d98 ± 0.01 a–d55 ± 0.03 d
2514921496Ledene21 ± 01 a–c21 ± 01 a–c25 ± 00 a18 ± 01 b–d17 ± 01 b–d14 ± 01 cd
2615201522δ–Cadinene00 ± 00 b00 ± 00 b07 ± 00 a00 ± 00 b00 ± 00 b00 ± 00 b
2715751577Spathulenol15 ± 03 a–c18 ± 01 a–c19 ± 01 a–c18 ± 01 a–c15 ± 00 a–c11 ± 01 c
2815821582Caryophyllene oxide46 ± 03 b45 ± 00 b56 ± 02 ab49 ± 01 ab54 ± 03 ab31 ± 01 b
2915911592Viridiflorol41 ± 0.12 a–d24 ± 0.14 b–e98 ± 0.01 a79 ± 0.02 ab30 ± 0.11 b–e59 ± 0.18 f
3015971602Ledol64 ± 02 ab66 ± 03 ab80 ± 00 ab72 ± 01 ab68 ± 05 ab34 ± 02 b
3120542056Manool43 ± 0.04 b90 ± 0.06 bc67 ± 0.04 a06 ± 0.03 a72 ± 0.05 c82 ± 04 d
322066205913-epi-Manool00 ± 00 b00 ± 00 b00 ± 00 b00 ± 00 b00 ± 00 b00 ± 00 b
Means followed by common letter are not significantly different at the level of 5% (Duncan’s multiple range test).
Table 3. Principal component analysis (PCA) of the main phytochemical compounds for different times of the day and night of S. officinalis.
CompoundsComponent
PC1PC2PC3PC4PC5
α-Pinene 0.1550.606−0.1070.320−0.601
Camphene−0.0770.946−0.1270.153−0.175
Sabinene0.579−0.5390.043−0.299−0.218
β-Pinene−0.0150.797−0.068−0.320−0.380
Myrcene−0.600−0.541−0.3210.1620.001
Phellandrene0.2480.3120.7410.2740.117
α-Terpinene 0.196−0.4770.7340.0130.024
ρ-Cymene 0.1010.8090.190−0.250−0.337
1,8-cineol−0.6010.4960.102−0.4000.149
γ-Terpinene 0.4330.0890.780−0.204−0.296
cis-Sabinene hydrate0.425−0.6020.026−0.0900.169
Terpinolene0.4470.5960.584−0.1730.049
cis-Thujone −0.653−0.6630.3110.1010.019
trans-Thujone 0.621−0.3300.089−0.394−0.117
Camphor−0.0560.936−0.0360.0600.235
Borneol−0.0820.918−0.0440.1390.177
α-Terpineol −0.629−0.313−0.5480.1620.019
trans-Carveol 0.2390.3360.7390.2790.116
cis-Carveol 0.597−0.531−0.0650.211−0.293
Bornyl acetate0.6120.3800.0120.509−0.173
Carvacrol−0.4910.216−0.700−0.064−0.319
E-Caryophyllene 0.746−0.4730.1570.2680.091
β-Gurjunene 0.7550.018−0.2960.475−0.065
α-Humulene 0.880−0.250−0.1570.273−0.124
Ledene0.774−0.010−0.017−0.1010.281
δ-Cadinene 0.540−0.259−0.109−0.4980.141
Spathulenol0.6180.296−0.389−0.1950.437
Caryophyllene oxide0.7750.320−0.2030.0220.248
Viridiflorol0.7280.283−0.450−0.2820.117
Ledol0.7570.212−0.4870.2380.051
Manool0.794−0.002−0.494−0.229−0.005
13-epi-Manool −0.009−0.410−0.0660.249−0.154
Eigenvalue9.6308.3504.6992.3362.127
Variability (%)29.18125.30314.2397.0796.447
Cumulative %29.18154.48468.72375.80282.249
Publisher’s Note: MDPI stays neutral with regard to jurisdictional claims in published maps and institutional affiliations.

