Article

In-Orchard Sizing of Mango Fruit: 1. Comparison of Machine Vision Based Methods for On-The-Go Estimation

Institute for Future Farming Systems, Central Queensland University, Rockhampton 4701, Australia
*
Author to whom correspondence should be addressed.
Horticulturae 2022, 8(12), 1223; https://doi.org/10.3390/horticulturae8121223
Submission received: 1 November 2022 / Revised: 25 November 2022 / Accepted: 29 November 2022 / Published: 19 December 2022

Abstract

:
Estimation of fruit size on-tree is useful for yield estimation, harvest timing and market planning. Automation of measurement of fruit size on-tree is possible using RGB-depth (RGB-D) cameras, if partly occluded fruit can be removed from consideration. An RGB-D Time of Flight camera was used in an imaging system that can be driven through an orchard. Three approaches were compared, being: (i) refined bounding box dimensions of a YOLO object detector; (ii) bounding box dimensions of an instance segmentation model (Mask R-CNN) applied to canopy images, and (iii) instance segmentation applied to extracted bounding boxes from a YOLO detection model. YOLO versions 3, 4 and 7 and their tiny variants were compared to an in-house variant, MangoYOLO, for this application, with YOLO v4-tiny adopted. Criteria developed to exclude occluded fruit by filtering based on depth, mask size, ellipse to mask area ratio and difference between refined bounding box height and ellipse major axis. The lowest root mean square error (RMSE) of 4.7 mm and 5.1 mm on the lineal length dimensions of a population (n = 104) of Honey Gold and Keitt varieties of mango fruit, respectively, and the lowest fruit exclusion rate was achieved using method (ii), while the RMSE on estimated fruit weight was 113 g on a population weight range between 180 and 1130 g. An example use is provided, with the method applied to video of an orchard row to produce a weight frequency distribution related to packing tray size.

1. Introduction

1.1. Context

Mango fruit harvest and marketing planning requires information on crop load, both in terms of fruit number and size [1]. Several research groups have attempted estimation of lineal dimensions of fruit on-tree using machine vision, as reviewed by [2]. In some work, fruit are positioned at a known distance from the camera, e.g., [3], while in other work, a reference scale is placed in the image plane, e.g., Apolo-Apolo et al. [4]. However, camera to fruit distances will vary between 1 and 3 m in a practical application of imaging from a farm vehicle driven between orchard rows. Depth cameras can be used to assess camera to fruit distance, as employed for size estimation by Kurtser et al. [5] for grape clusters, Gené-Mola et al. [6] for apple fruit, Lin et al. [7] for citrus fruit, Zheng et al. [8] for cucumber, eggplant, tomato and pepper fruit, and Wang et al. [9] for mango fruit.
These reports, however, deal with non-occluded fruit only. For non-occluded fruit, estimation of fruit lineal dimensions using machine vision is primarily determined by error in the camera to fruit distance measurement, and by the resolution of the fruit boundary in the image, which is impacted by image resolution. Measurement of partly occluded fruit introduces another error, with under-estimation of fruit dimensions. In previous work by our group [9], fruit detection was based on a cascade detector with a histogram of oriented gradients (HOG) features, followed by Otsu’s thresholding [10] that uses a grey-level histogram to threshold images. It was proposed that partly occluded fruit be removed from consideration by a specification on the ratio of the length of the major to minor axis of an ellipse fit within the bounding box boundaries. A custom defined kernel filter was also applied for removal of linear features such as fruit stalks and panicles.

1.2. Object Detectors

In recent years Convolutional Neural Network (CNN) based detectors have replaced the cascade detector method of fruit detection (as reviewed in [11]) and therefore the previous method [9] stands to be improved by adoption of a CNN based technique. ‘State of art’ CNN based options relevant for fruit detection and fruit sizing are object detectors and instance segmentation. For object detection with bounding box, single stage models such as SSD, YOLO and RetinaNet are used for real-time applications while two-stage detection models such as R-CNN, SPPNet, Faster R-CNN, Mask R-CNN are also in use for object detection and segmentation tasks.
The CNN based single stage object detector YOLO, generates a bounding box around detected objects, with a confidence score and class id. The YOLO detector divides images into several grids of equal dimensions where the probability of each grid cell containing an object is calculated and bounding box coordinates and object classes are predicted for each cell. Once a bounding box containing object is obtained, further processing can be undertaken to segment object pixels within each bounding box, e.g., using Otsu’s thresholding or instance segmentation. A refined bounding box can then be fit, corresponding to the maximum pixel width of segmented pixels in the vertical and horizontal directions. The dimensions of this box can be used to estimate the lineal dimensions of the fruit.
The first YOLO model was released in 2016 by [12], with versions 2 and 3 following in 2018. The backbone network was replaced with Darknet-53 in YOLOv3. Our group [13] developed MangoYOLO from features of YOLOv3 and YOLOv2 (tiny) for detection of mango fruit in images of tree canopies. MangoYOLO was benchmarked to be superior to the dual stage detector Faster R-CNN and the single stage detector SSD based on prediction accuracy, speed and required computing resource in the application of mango fruit detection. YOLOv4, released in April 2020 by [14] as an improvement on v3, consists of CSPDarknet53 (Cross Stage Partial Darknet53) as a network backbone, Spatial Pyramid Pooling (SPP) and Path Aggregation Network (PANet) as neck and YOLO detector head (same as YOLOv3). YOLOv4-tiny (Figure 1) is a scaled version of YOLOv4 with a reduced number of convolution layers, only two YOLO detection heads and fewer anchor boxes used for generating bounding boxes. This model was optimised for machines with low compute capability. There are several customised versions of YOLOv4 available with more CNN and detection layers, different backbones and activation functions. Following YOLOv5 and YOLOv6, which were unofficial versions in that they were not described in a refereed journal article, Bochkovskiy and colleagues released v7 in 2022, with the claim of higher speed and accuracy of “all known object detectors” [15]. All versions except v5 and v6 are available in a Darknet framework.
Whether the recent YOLO versions provide a performance improvement for the mango fruit detection application has not been evaluated.
Comparisons of model performance across published studies are compromised by use of different image sets in respective studies. Our group has made publicly available a data set of mango fruit on-tree as used in the development of the MangoYOLO architecture, with >400 downloads to date [13]. This dataset was used by [16] for creation of customised detection models, benchmarked to MangoYOLO. The data set is used in the current study for comparison of new YOLO deep learning models (v4 and 7), relative to MangoYOLO.
Object detectors such as YOLO provide higher inference speed but produce individual bounding boxes around the detected object. Depending on the shape and orientation of the object the boxes can include part of the background along with the detected object. Indeed, such background is typically included in training snips. Such a method is suited to object detection, localisation and counting however, tasks such as fruit sizing require further processing on the bounding box region of interests (RoIs) to segment fruit only pixels. Post processing on individual ROIs increases the computation cost.

1.3. Segmentation

CNN based image segmentation methods are broadly categorized into semantic and instance segmentation. Semantic segmentation methods such as UNet [17] are designed to classify pixels into individual classes, therefore segmenting out objects of interest on images. Although quite good in terms of processing speed, the semantic method becomes useless in applications where the objects are clustered (overlapping), where overlapping objects merge into one segment.
Instance segmentation methods on the other hand produce a segmentation mask for each object, eliminating the problem of fruit clustering to some extent. An instance segmentation model applies an object class label to each pixel in an image, with multiple objects of the same class treated as individual objects. Mask R-CNN is a commonly employed instance segmentation model which generates separate instances with masked regions and is recommended for separation of overlapped objects [18]. Mask R-CNN is an extension of Faster R-CNN [19], where a fully convolution network (FCN) [20] branch is added on each region of interest (ROI) that predicts segmentation masks in parallel with classification and bounding box regression branches. Mask R-CNN first generates candidate region of interests (ROIs) using a Region Proposal Network (RPN), then ROIs are pooled into fixed size in feature maps with the help of a ROIAlign layer, which makes it a two stage detection/segmentation model. A fully convolutional network is then used in the mask branch to segment the image at pixel level within each ROI and the model classifies the identified ROIs [18]. Being a two-stage approach and requiring feature extraction operations on each ROI at the second stage, Mask R-CNN is computationally expensive and often unable to process images at higher frame rates as compared to the YOLO based object detection models. However, higher mask accuracy means Mask R-CNN can be beneficial for applications that do not require real time operation.
Mask R-CNN has been used in several fruit on-tree classification applications, e.g., for apple fruit [21], and mature and immature tomatoes [22]. Mask R-CNN has also been used in fruit sizing. Using a RGB camera with inclusion of a reference scale in the image, [23] reported use of Mask R-CNN to segment tomato fruit in estimation of lineal dimensions which were then used in estimation of fruit mass. A mean average error of 2.4 and 2.6 mm on fruit length and width, respectively, and a mean average percentage error of 7.1% for weight estimation, was achieved for images of non-occluded fruit on an artificial background. [24] used Mask R-CNN segmentation on images acquired using a ZED mini stereo camera in estimation of on-plant tomato fruit dimensions, reporting a R2 of 0.90 and 0.93 on height and width predictions, respectively (estimation error was not reported). These studies did not consider the treatment of occluded fruit.
The current study considers the use of instance segmentation models as an alternative to Otsu’s thresholding as used in fruit sizing by [12].

1.4. Objectives

This study was undertaken to improve the estimation of mass of on-tree fruit from RGB-D imagery. The study extends the earlier work of our group [12] on shape fitting for removal of occluded fruit in a fruit sizing application, through use of a CNN based detection and/or segmentation network rather than use of cascade detector for fruit detection and Otsu’s thresholding. The current work is also based on our earlier work recommending use of the time of flight (ToF) based Azure Kinect (Microsoft, Redmond, WA, USA) over a number of depth cameras, for the fruit sizing application, based on accuracy on object size measurement, use in daylight and cost [25].
Two tasks were set: (i) documentation of the detection performance of the key versions of YOLO object detectors, for the mango sizing application; and (ii) a comparison of the use of a YOLO object detector followed by fitting of a refined bounding box to object pixels as segmented by Otsu’s thresholding or by instance segmentation, in comparison to direct use of an instance segmentation model on the entire image, with recommendation of a method for use in sizing of fruit on-tree. Criteria for removal of partly occluded fruit were also compared.

2. Materials and Methods
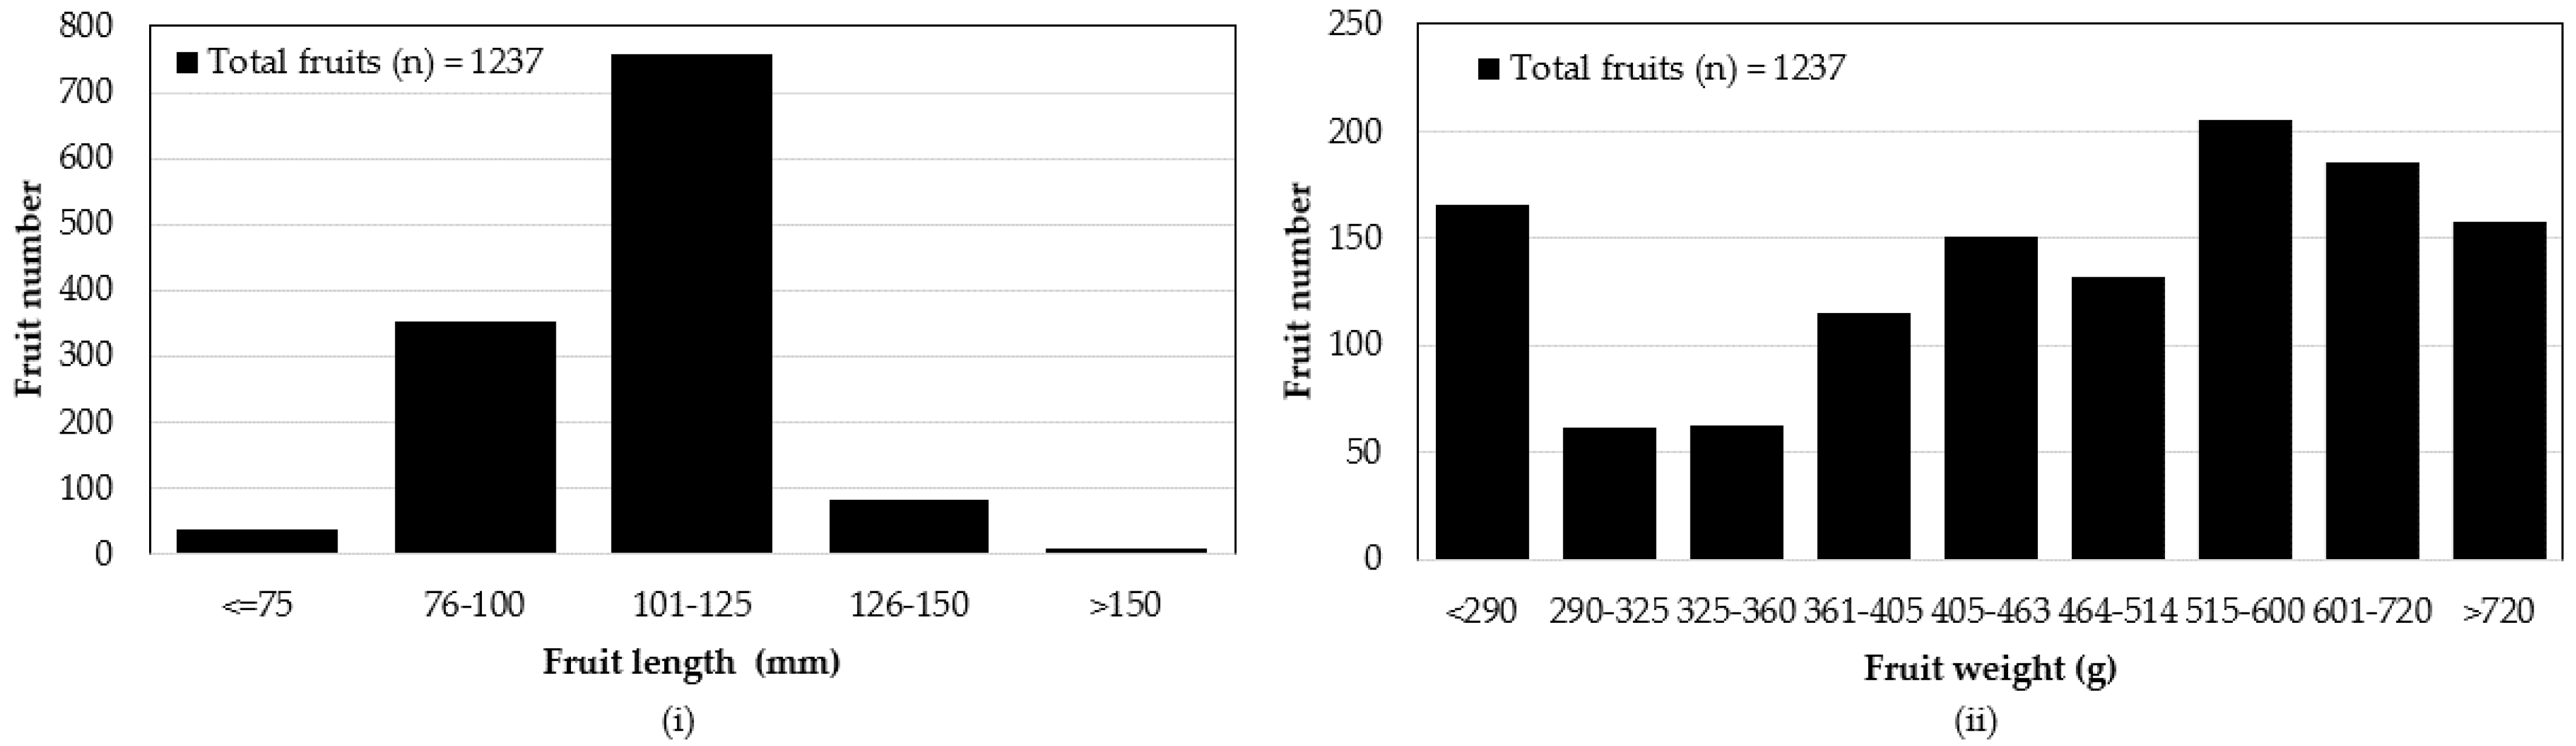
2.1. Image Sets

Three data sets were used in training and testing the object detection and instance segmentation models (Table 1). Data set A was used in the context of the YOLO models, allowing direct comparison to the results of Koirala, et al. [13]. Data set B was used for the Mask R-CNN instance segmentation models. All images in Dataset B and Dataset C used in this study are available at https://doi.org/10.25946/21655628 (accessed on 15 October 2022).

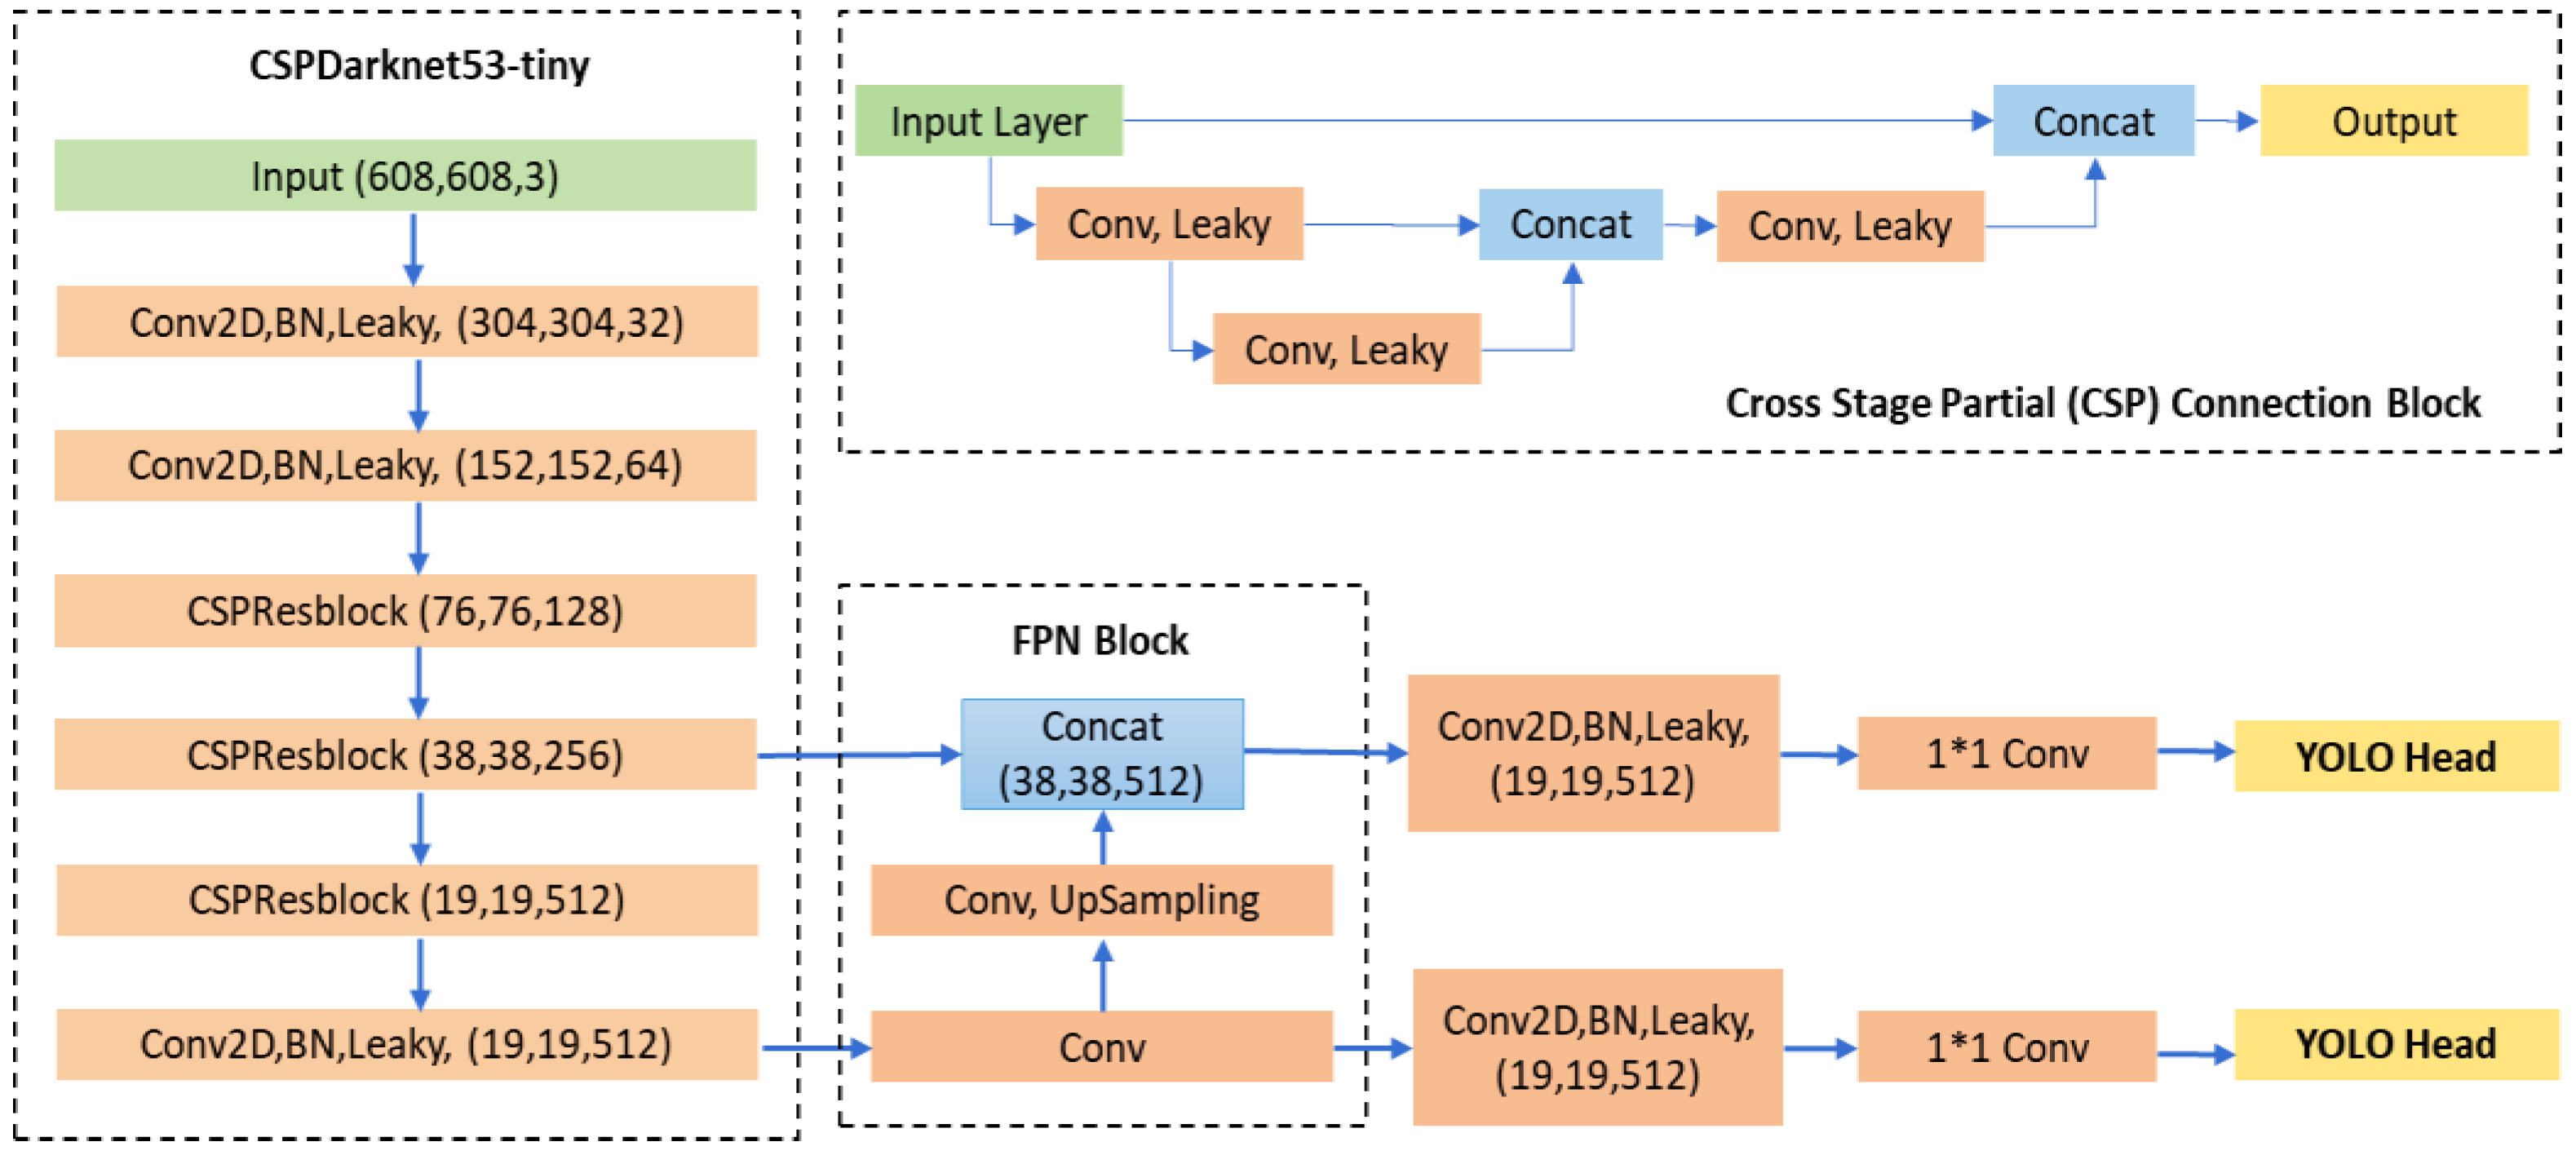
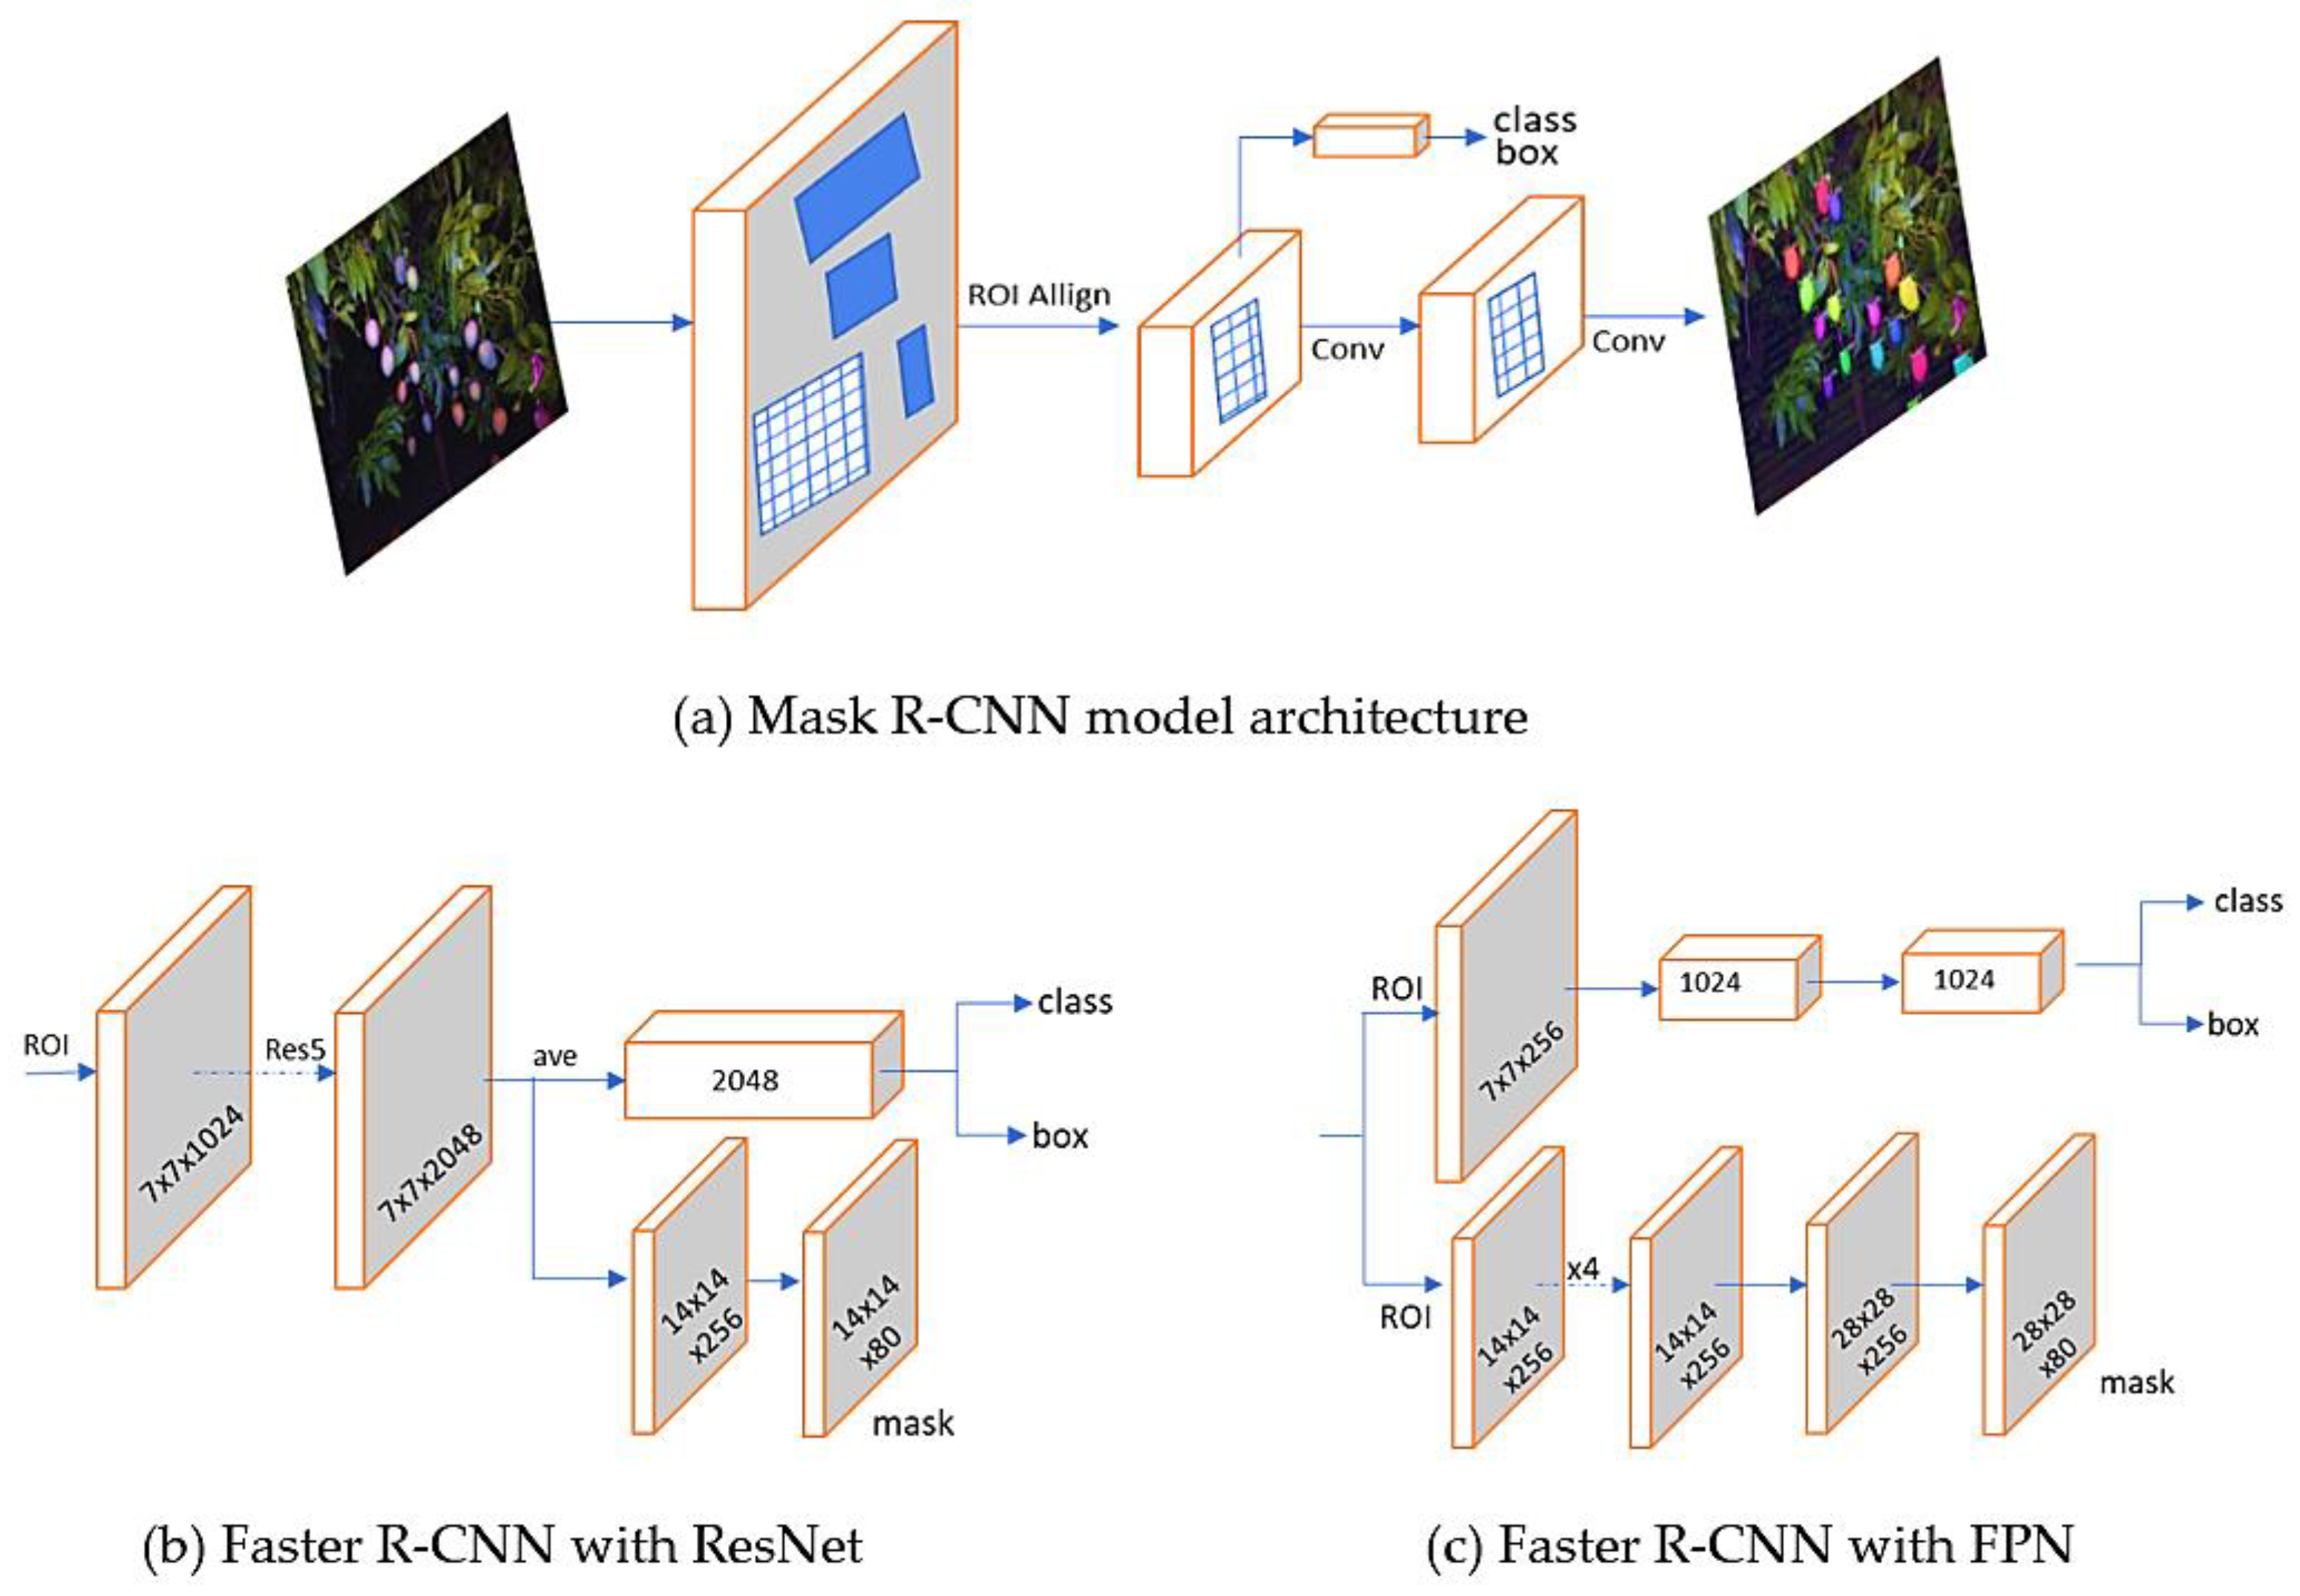
2.2. Training of YOLO and Mask R-CNN Models

Two types of CNN based models were trained: the single stage object detector YOLO (Figure 1) and the instance segmentation model Mask R-CNN (Figure 2). Both YOLO and Mask R-CNN models were trained on a High Performance Computing System, using a Tesla P100 GPU with 16 GB GPU memory, 2.6 Ghz Intel Xeon Gold 6126 CPU.
Three YOLO architectures and their tiny versions, v3, 4 and 7, were compared to the in-house developed MangoYOLO. All models were trained on the [14] data set for 5000 iterations. All YOLO models compared were trained with batch size of 64, subdivision 8, learning rate of 0.001 and momentum of 0.9. Batch normalisation was used, and activation function used was leaky ReLU. Input resolution for all models set to 608 × 608, and all models trained in Darknet platform (https://github.com/AlexeyAB/darknet, accessed on 15 October 2022).
Mask R-CNN models were trained for 50 epochs using Dataset-B and Dataset-C (Table 1). The datasets were annotated with VGG Image Annotator [27] using polygon annotation tool to create pixel-level ground truth annotation of training and test data. The dataset was randomly divided into a training set of 454 images (83%) and a test set of 92 images (17%). A pre-trained (on COCO dataset) ResNet-101 model was used for transfer learning. A learning rate 0.001, momentum 0.9, and a RPN NMS threshold of 0.7 were applied. All network layers were trained. For use of Mask R-CNN with bounding boxed images, a data set of 1200 snips of individual mango fruit were acquired from YOLOv4-tiny model detections in Dataset-B images. Two instance segmentation models were trained using the Matterport implementation of Mask R-CNN (https://github.com/matterport/Mask_RCNN, accessed on 15 October 2022), and the two best performing models were used in the study.
An example output from detection model in each method is provided in Figure 3.

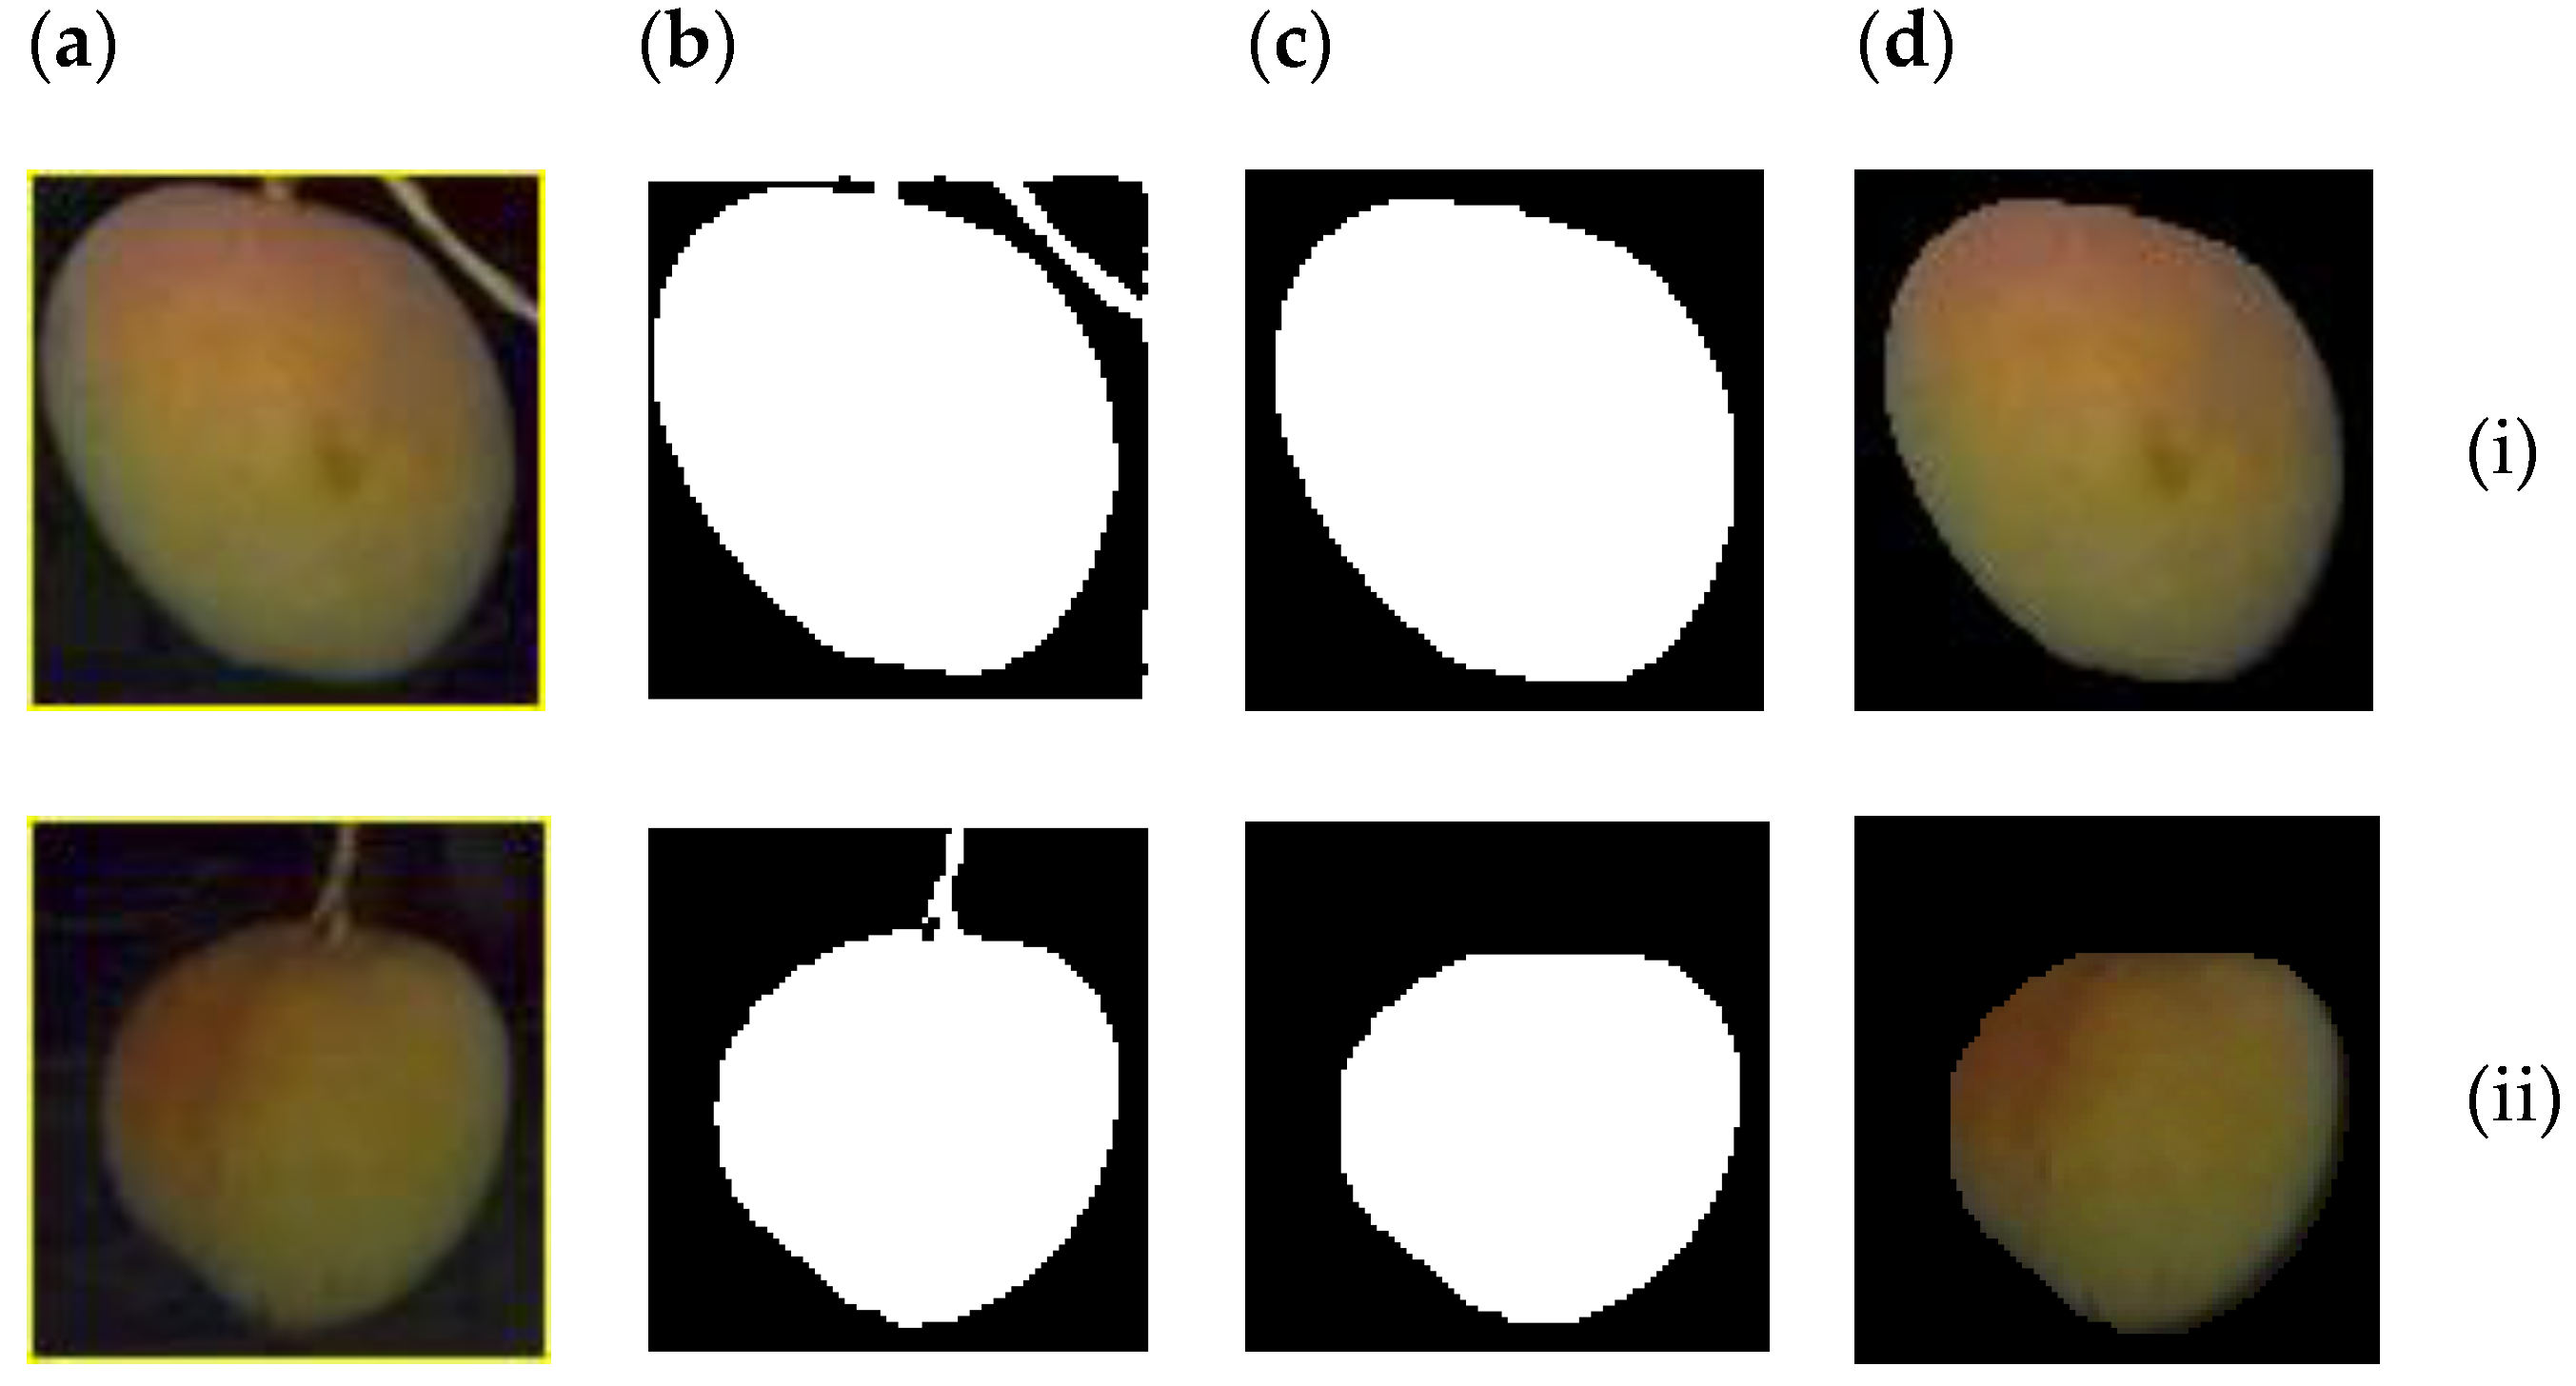
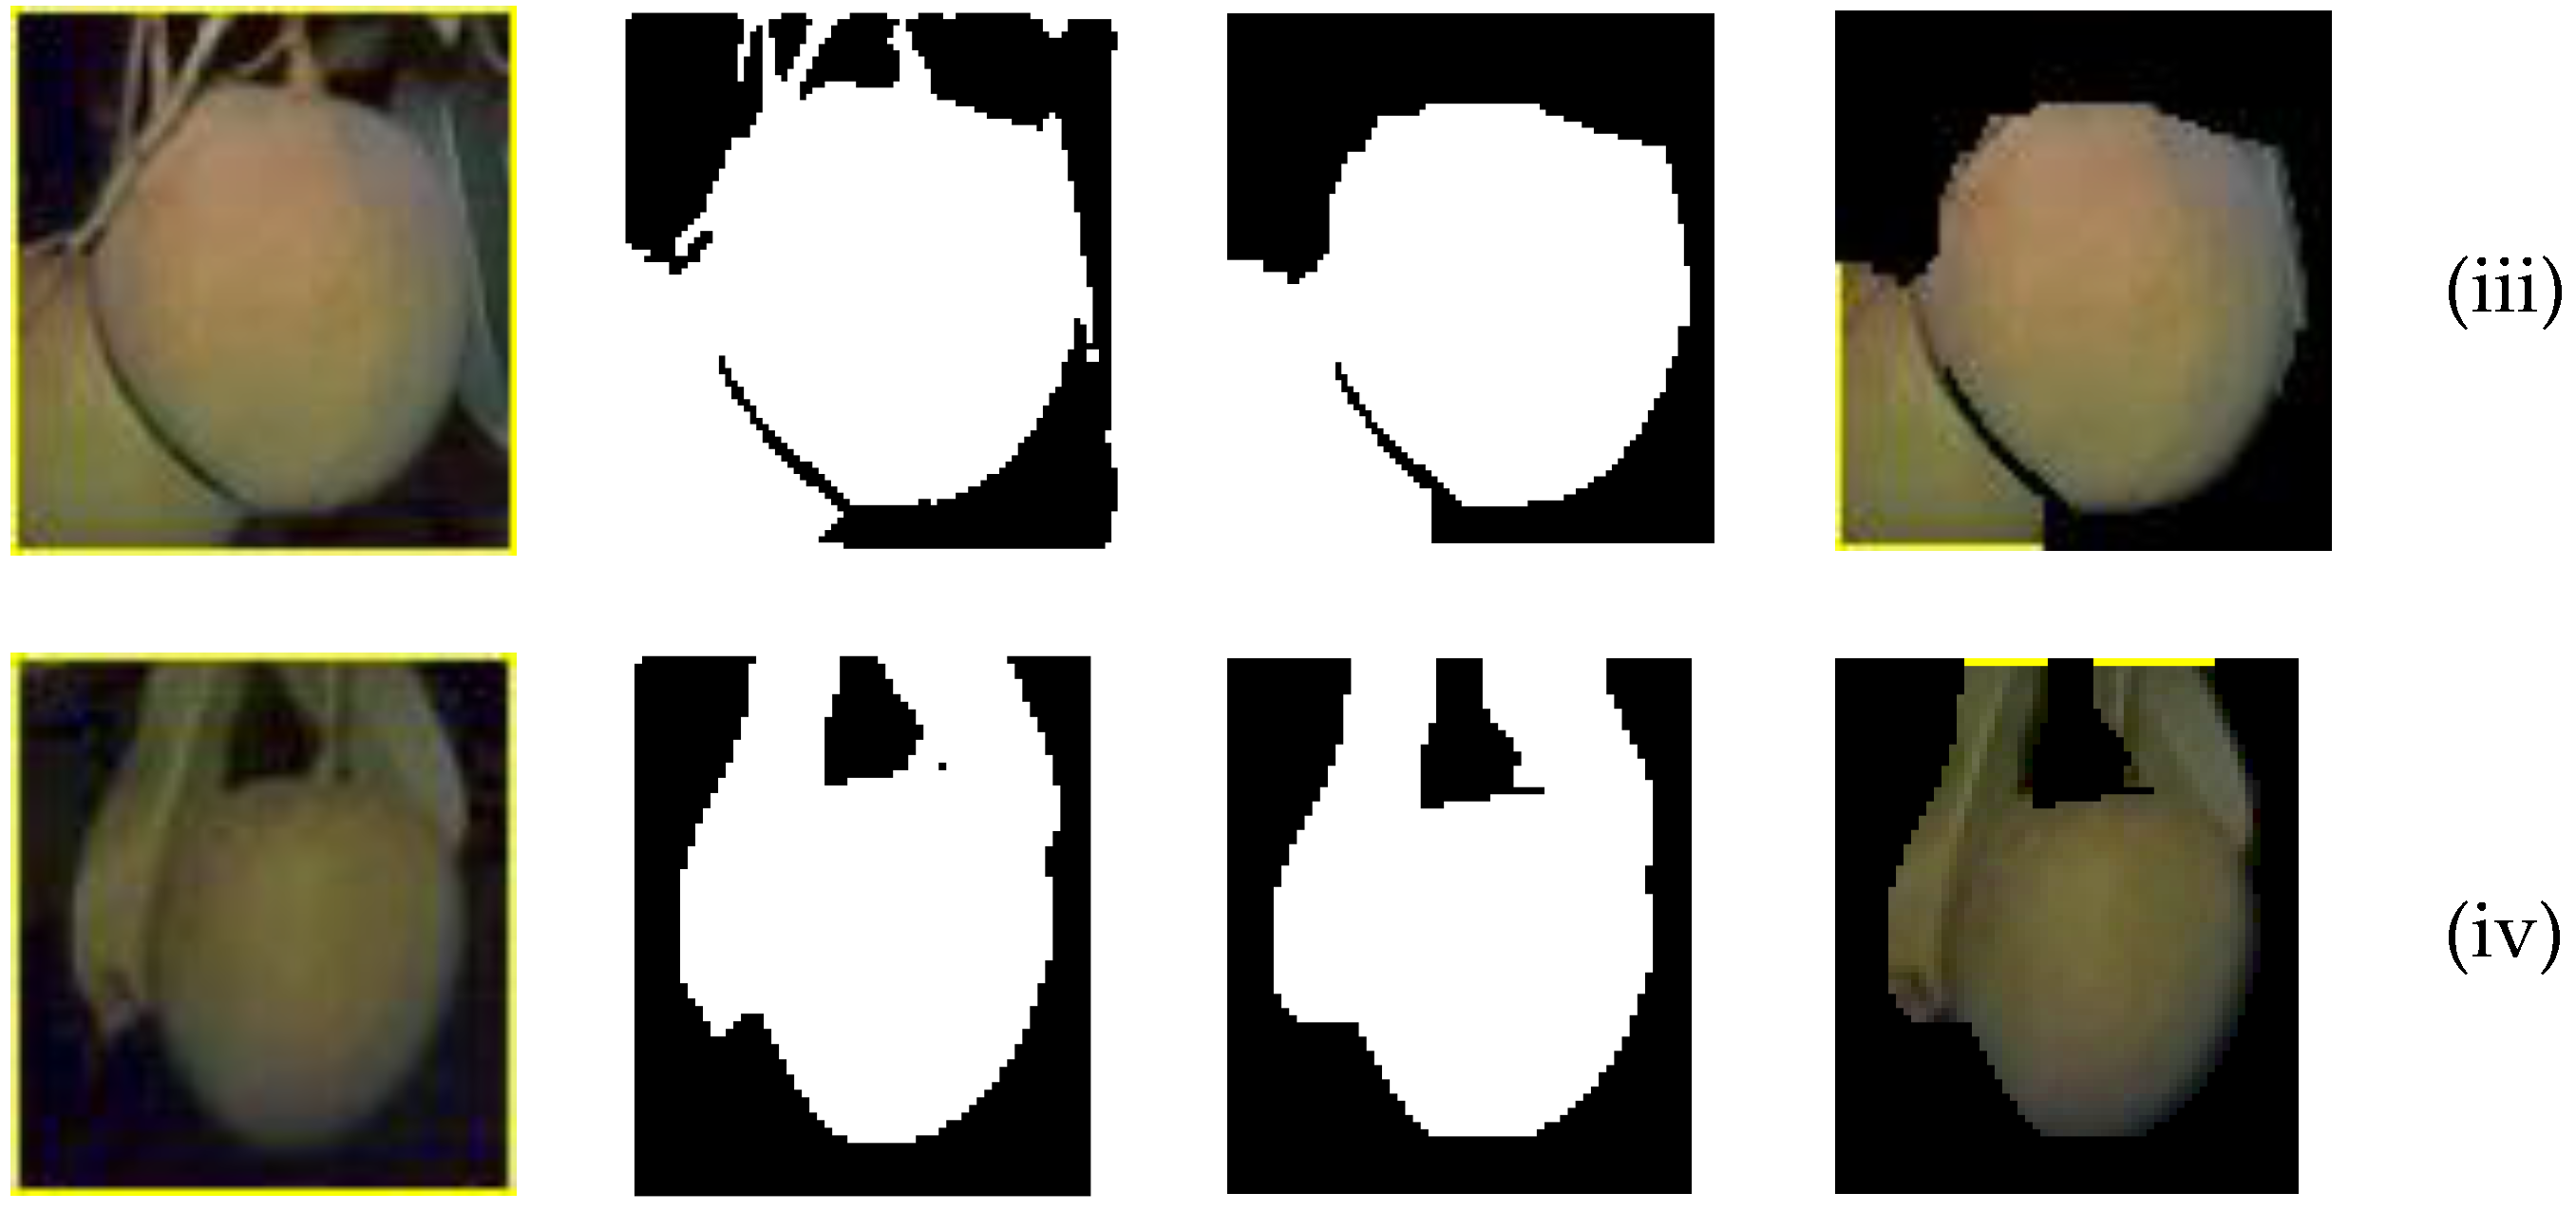
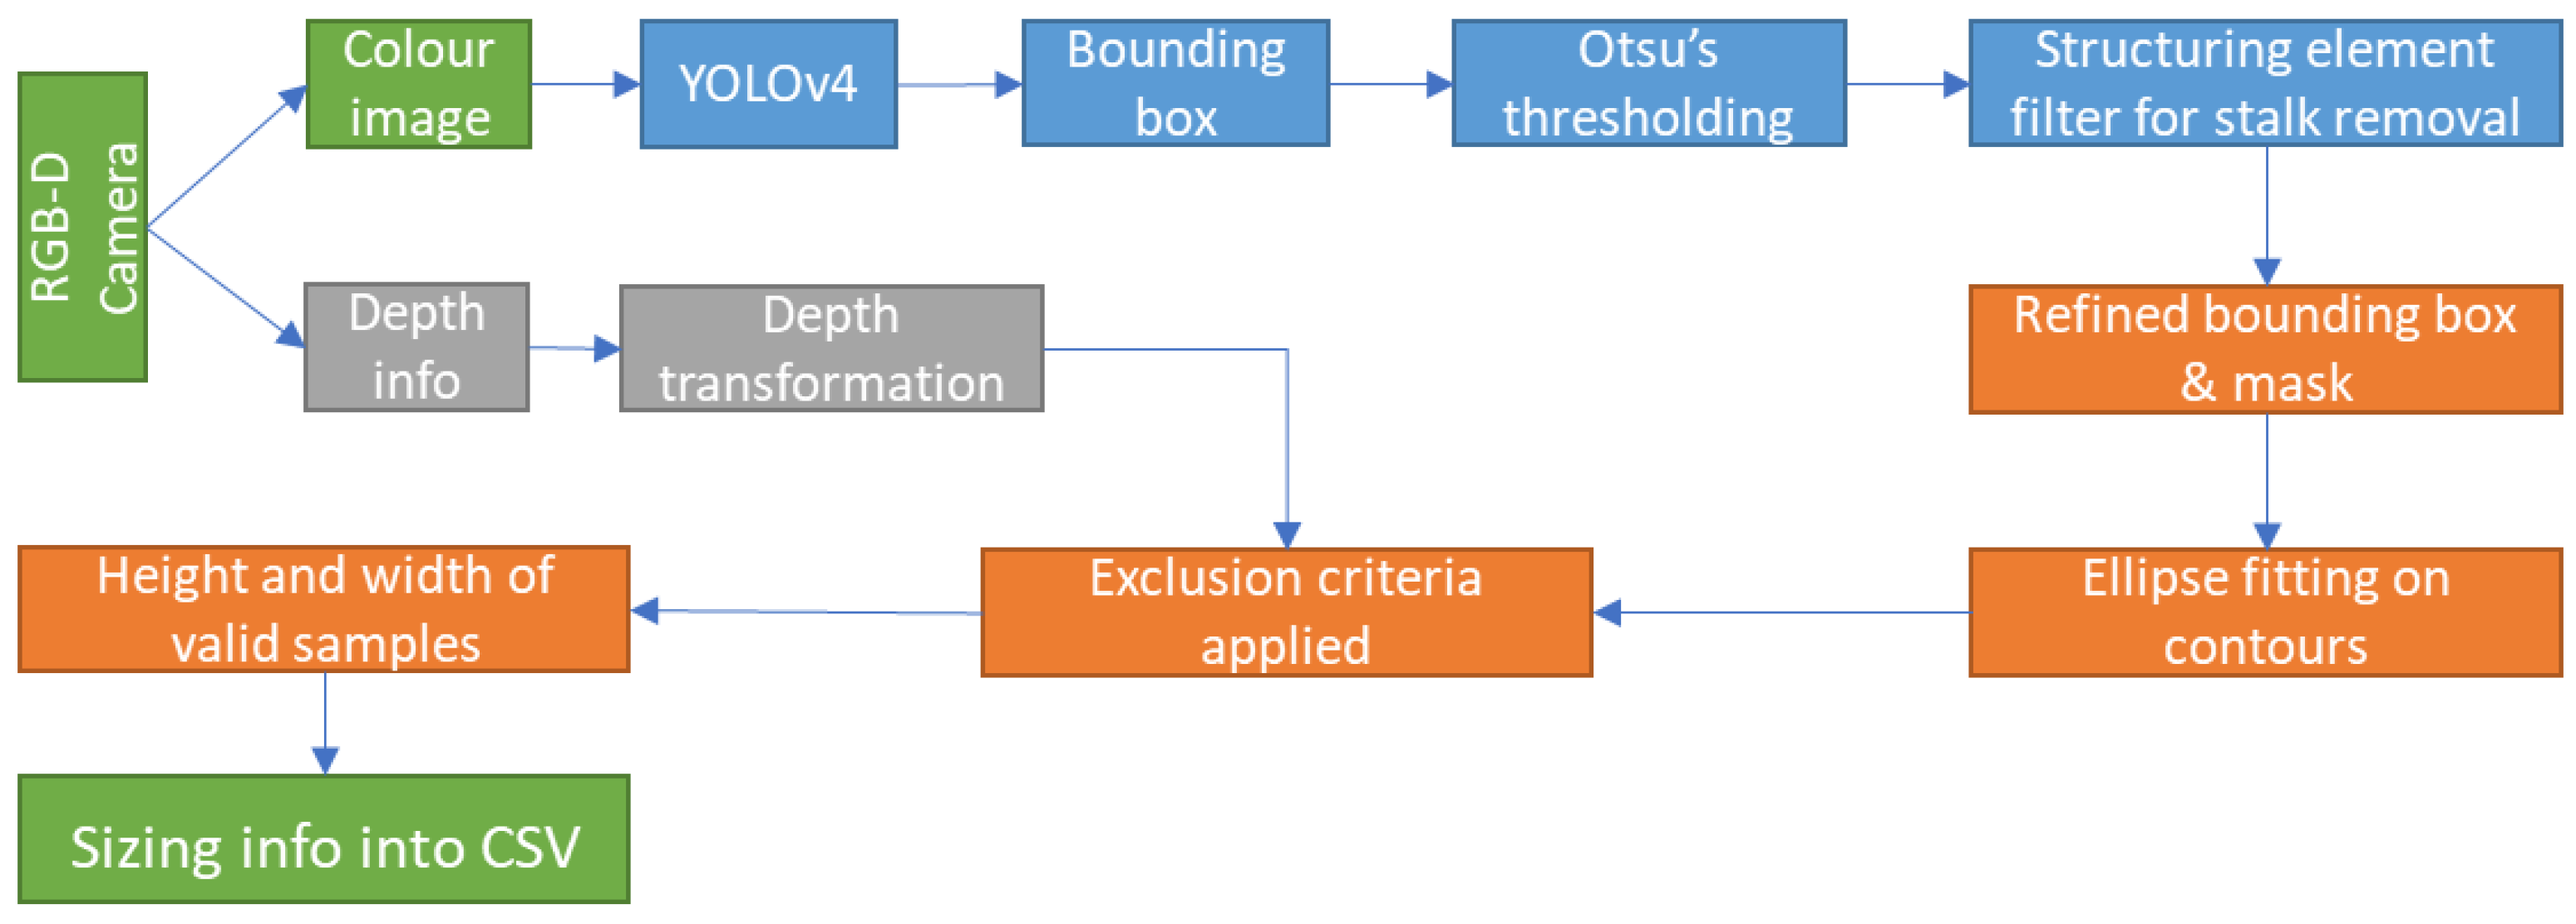
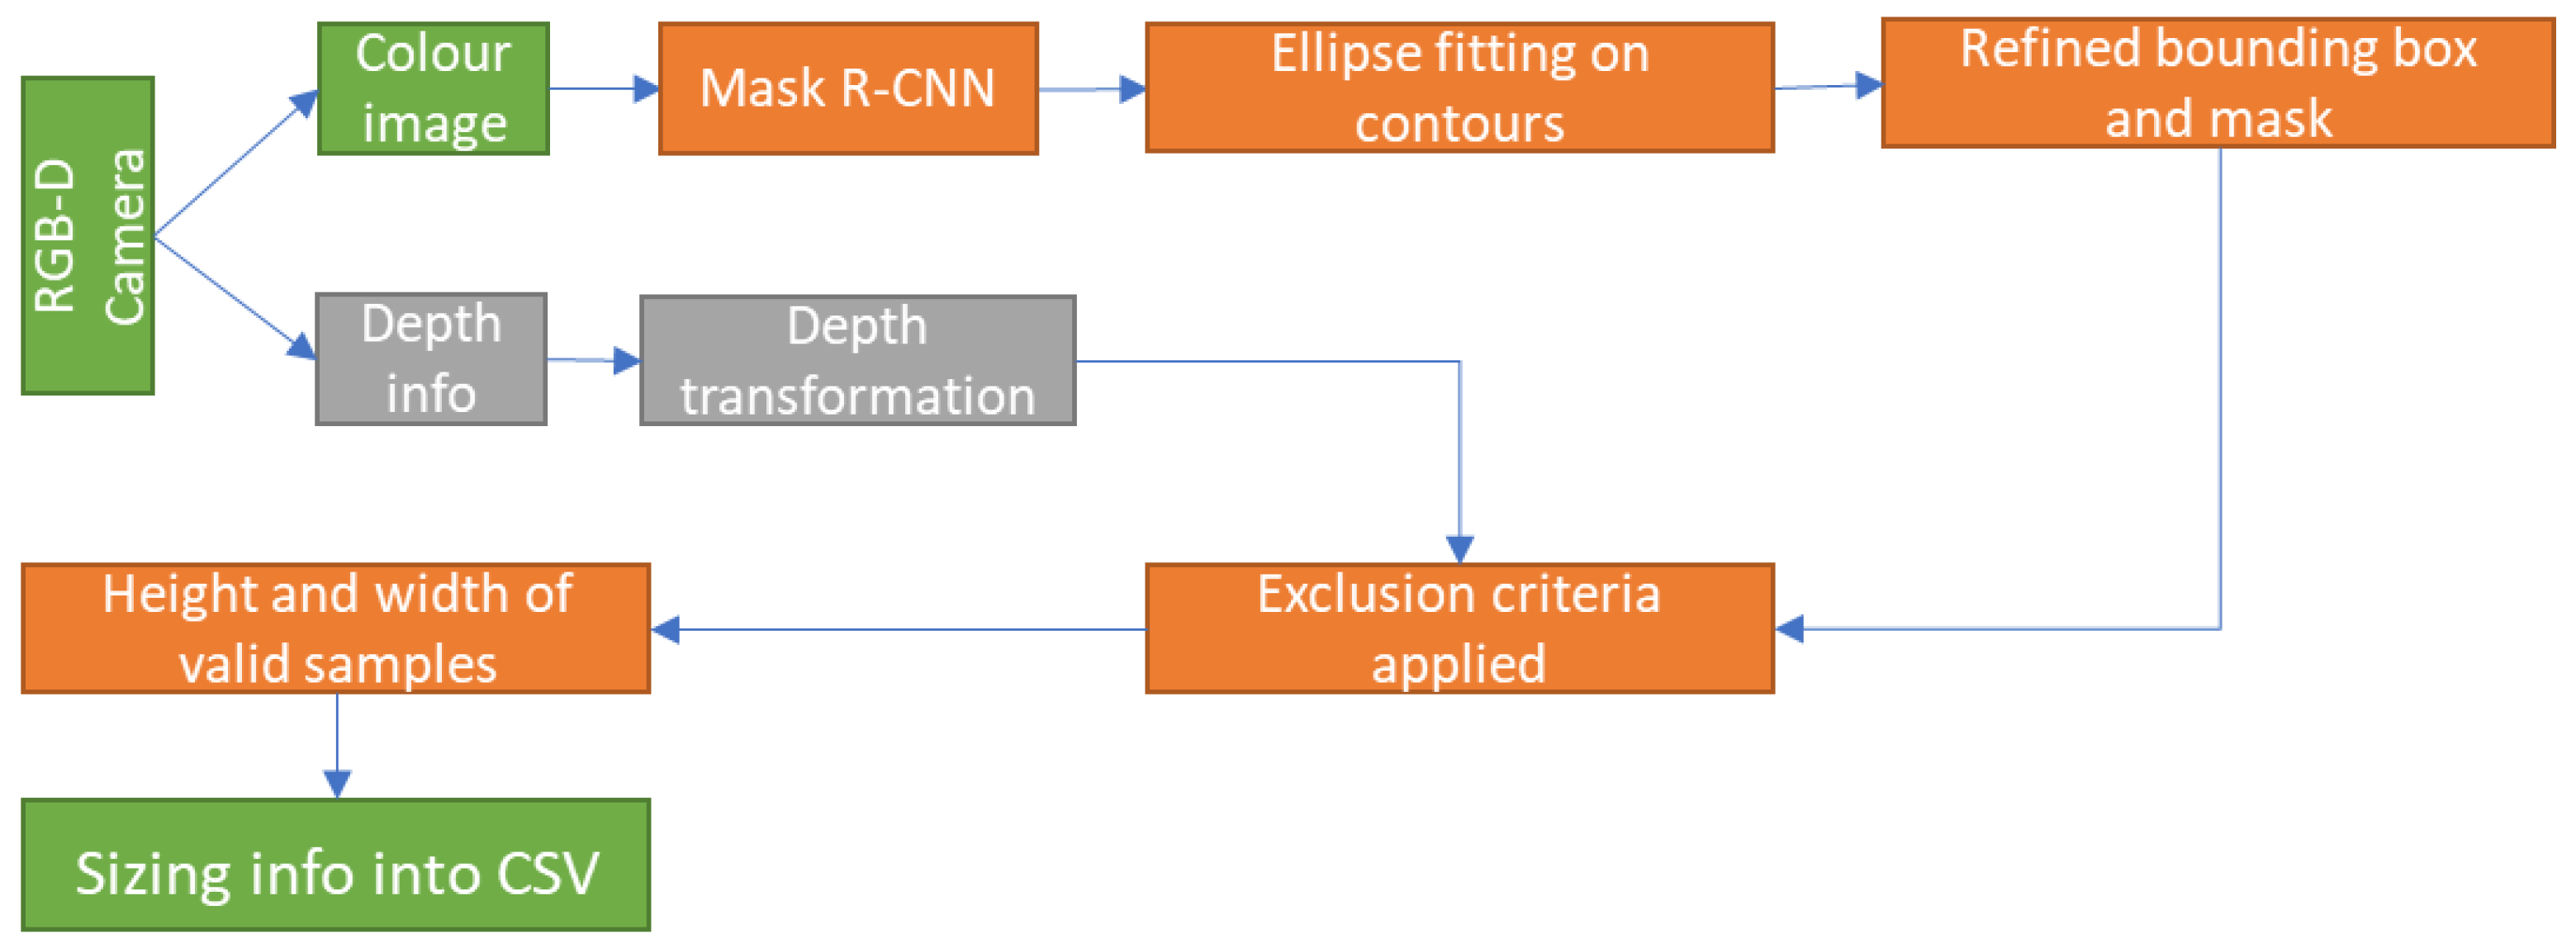
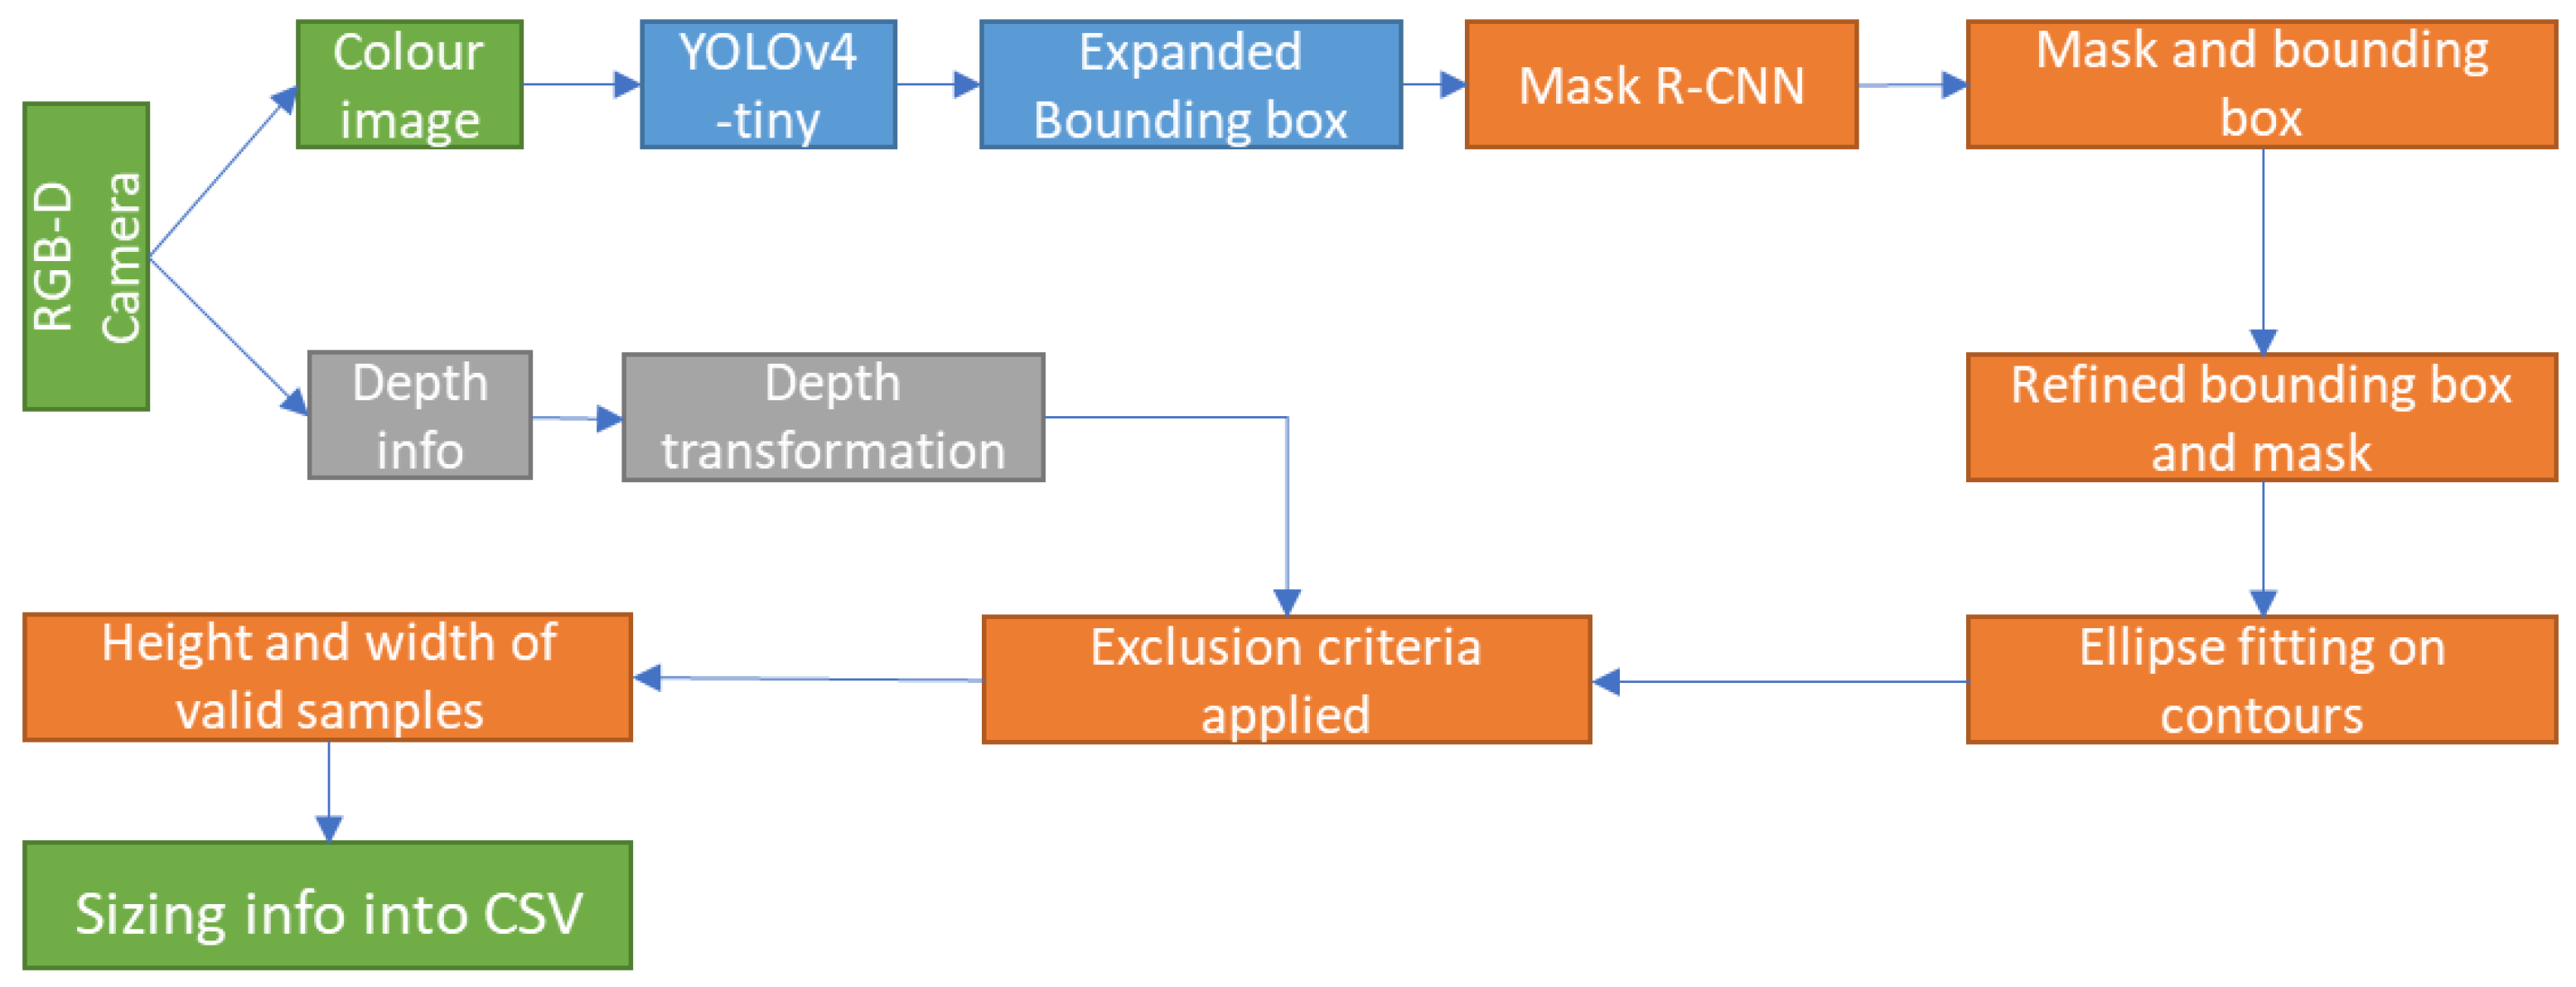
2.3. Fruit Sizing Methods

Three approaches to fruit sizing were compared.
Method 1 employed a YOLOv4-tiny detection model as an object detection model, replacing the cascade detector used by [9]. Each output bounding box was expanded by 5 pixels on each side to ensure that all fruit pixels were included inside the box. The OpenCV implementation of Otsu’s thresholding method was then used to segment fruit pixels as a binary threshold image. As a replacement to the hand-crafted feature for line filtering used in [12], OpenCV’s structuring element filtering was applied using a 2 × 10 kernel applied both horizontally and vertically to eliminate noise and remove stalk and panicles, if present, in the segmented image (Figure 4, rows i and ii). This solution is not always effective (see Figure 4, rows iii and iv), e.g., in situations where: (i) background objects, although linear in appearance, are larger than the structuring element kernel (morphological operation problem), and (ii) the colour of the background is very similar to the fruit colour (thresholding problem), compared to instance segmentation (Figure 3). Ellipse and minimum bounding rectangle fitting on the segmented binary mask was then applied, with criteria on depth, ellipse area vs mask area, major axis length vs rectangle height and overall pixel size of the mask used to filter out images with incomplete segmentation or object occlusion by another fruit or leaves.
The image processing pipeline of Method 1 is illustrated in Figure 5.
A Mask R-CNN model was used to segment fruit pixels on the images in two approaches–(a) using the entire image (Method 2, Figure 6) and (b) using image snips defined by bounding boxes generated by the YOLOv4-tiny detector (Method 3, Figure 7).
Method 2 avoided use of the YOLO detection model by employing the instance segmentation model Mask R-CNN with ResNet-101 as extraction backbone network, feature pyramid network (FPN) and path aggregation network (PAN) (Figure 2). Masked instances generated by segmentation network is further analysed by fitting ellipse and minimum bounding rectangle (Figure 6). Exclusion criteria were then applied to filter out incomplete or overfitted masks per instance. An example output image using Method 2 is shown in Figure 8.
Method 3 is a combination of both detection and instance segmentation methods (Figure 7) with the intent of increasing segmentation accuracy with some compromise to processing time. YOLOv4-tiny detection model was used to detect fruit on tree and extract bounding box coordinates with confidence score. The bounding box is expanded by 5 pixels on all sides to ensure fruit is enclosed by the bounding box. A Mask R-CNN model trained on fruit snips was then used to segment fruit pixels inside each bounding box.
In all three methods, fruit size was extracted from the height and width of the refined bounding box that enclosed the largest connected component (masked region). Pixel number was converted to length (mm) using thin lens theory (Equation (1)), where D is the camera to object distance, estimated as the average of distance values for a 5 × 5 pixel array from the centre of each refined bounding box.
f D = i m a g e   s i z e r e a l   s i z e
where f is the focal length of the camera, which is different for x-axis and y-axis, and is obtained from the intrinsic parameters of the depth camera.

2.4. Estimation of Fruit Mass

Mass of mango fruit ( M ) can be estimated using linear dimensions (cm) of length ( L ), width ( W ) and thickness ( T ) [28]. The linear relationship M = k L W T , where k is a factor between 0.49–0.51, was found robust across various growth stages and growing conditions (e.g., R 2 of 0.97 and R M S E of 28.7 g [29]).
However, while fruit L can be estimated from images of on-tree fruit viewed from the inter-row, i.e., the camera perspective, the orientation of the fruit is not controlled. As per [9], the horizontal width of the visible fruit will be, on average, the mean of W and T , and M can be calculated as:
M = k L   W + T 2 2

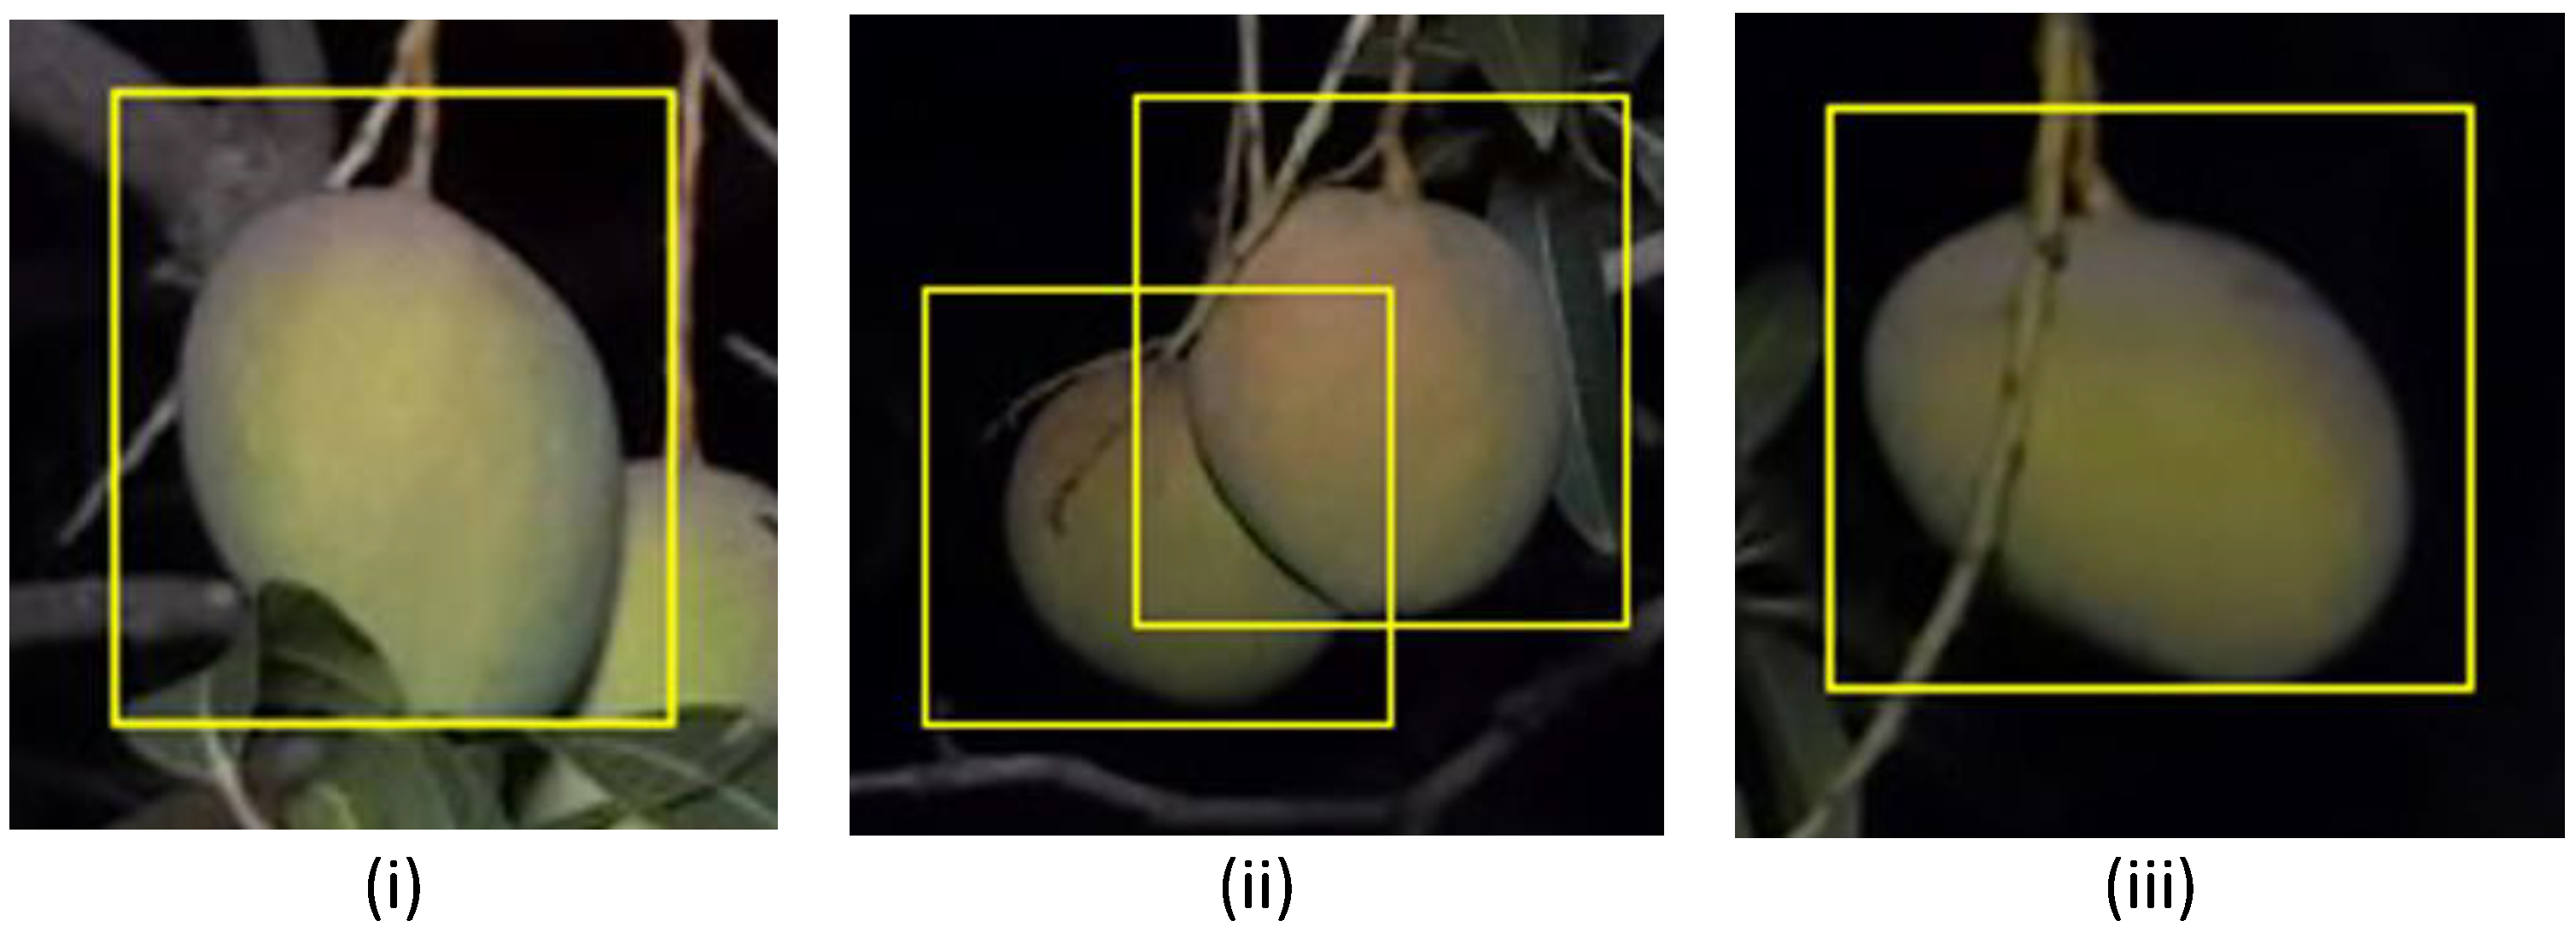
2.5. Exclusion Criteria

In a tree canopy image, fruit may be occluded by leaves, branches or other fruit (Figure 9). As mango fruit are not spherical, the size of occluded fruit cannot be estimated by simple projection of the visible contour, as undertaken by Gené-Mola, et al. [6] for apple. It is therefore necessary to reject occluded fruit from the measurement pipeline.
The criteria of Wang, et al. [9] on features of an ellipse fitted to the object were adopted (criteria set B) and adapted (criteria set A) to judge whether a mango fruit was occluded or completely imaged (Table 2).
Two stages were implemented in dealing with overlapping fruit detected with YOLO and marked with bounding boxes. First, the intersection between detected bounding boxes was calculated and a specification of <20% of intersection of bounding boxes employed for size measurement of detected objects (fruit). Next, objects were excluded based on depth information, with the mean non-zero depth value of a 5 × 5 pixel matrix from the centre of each bounding box calculated and the fruit (bounding box) at the greater distance (>3.5 m) excluded from the sizing pipeline.
For the Mask R-CNN output, a bounding rectangle fitted to mask area was used to estimate height and width of each segmented fruit instance. An ellipse was fitted to the mask contours. Outputs of ellipse and mask area ratio, ellipse major axes and mask height difference, segmented area pixel number and depth values at the centre of bounding boxes were used in criteria for fruit to be eligible as candidates for size estimation.

2.6. Fruit Sizing Exercises

Images of fruit on tree (cultivars Honey Gold and Keitt) were acquired at night using an Azure Kinect RGB-D camera mounted to the orchard imaging system used by [1].
In one exercise, images of tree canopies were acquired approximately two weeks before commercial harvest with the camera in a stationary position. Every fruit in the field of view was then labelled for reference. The length and width of labelled fruit was then manually assessed using a calliper (DCLR-1205, Clockwise Tools, Valencia, CA, USA) with a manufacturer reported measurement accuracy of ±0.04 mm. As an estimate of reference method error, the standard deviation of repeat measurements of mango fruit dimensions using a calliper was assessed to be 1.2 mm (n = 50). Fruit were then harvested and weighed to an accuracy of 1 g (PGL-2002, Adam Equipment, Perth, WA, Australia). This process was undertaken for 60 fruit of the cultivar Honey Gold and 44 fruit of the cultivar Keitt (Table 3).
In a second exercise, images of tree canopies were acquired with the camera moving past the trees at approximately 6 km/h. Images were acquired at 5 fps of each side of a 750 m row of Honey Gold trees (approximately 150 trees).

2.7. Statistics

The following statistics were used in characterisation of performance of object detection models and to analyse output sizing data:
P r e c i s i o n = T P T P + F P
R e c a l l = T P T P + F N
F 1 = 2 × p r e c i s i o n . r e c a l l   p r e c i s i o n + r e c a l l
Average   Precision   A P = i = 1 N   R i + 1 R i m a x   P r r R i + 1    
Mean   Average   Precision   m A P = 1 N   i = 1 N A P i
where T P = true positives, F P   = false positives, and F N = false negatives.
The following statistics were used in characterisation of the fruit sizing methods, relative to manually assessed fruit dimensions, where n = total number samples, y = ground truth values, y i = predicted values and y ¯ = mean of ground truth values.
R M S E = i = 1 n y y i 2 n
R 2 = 1 S u m   o f   s q u a r e s   o f   r e s i d u a l s   R S S T o t a l   s u m   o f   s q u a r e s   T S S = 1 i = 1 n y y i 2 i = 1 n y y ¯ 2
B i a s = G r o u n d   t r u t h   v a l u e s p r e d i c t e d   v a l u e s
The sample size required to adequately represent a population was estimated as:
n = t   S D e 2
where e denotes accepted error at desired probability level, S D denotes standard deviation of population, and t denotes associated t statistic value.

3. Results and Discussion

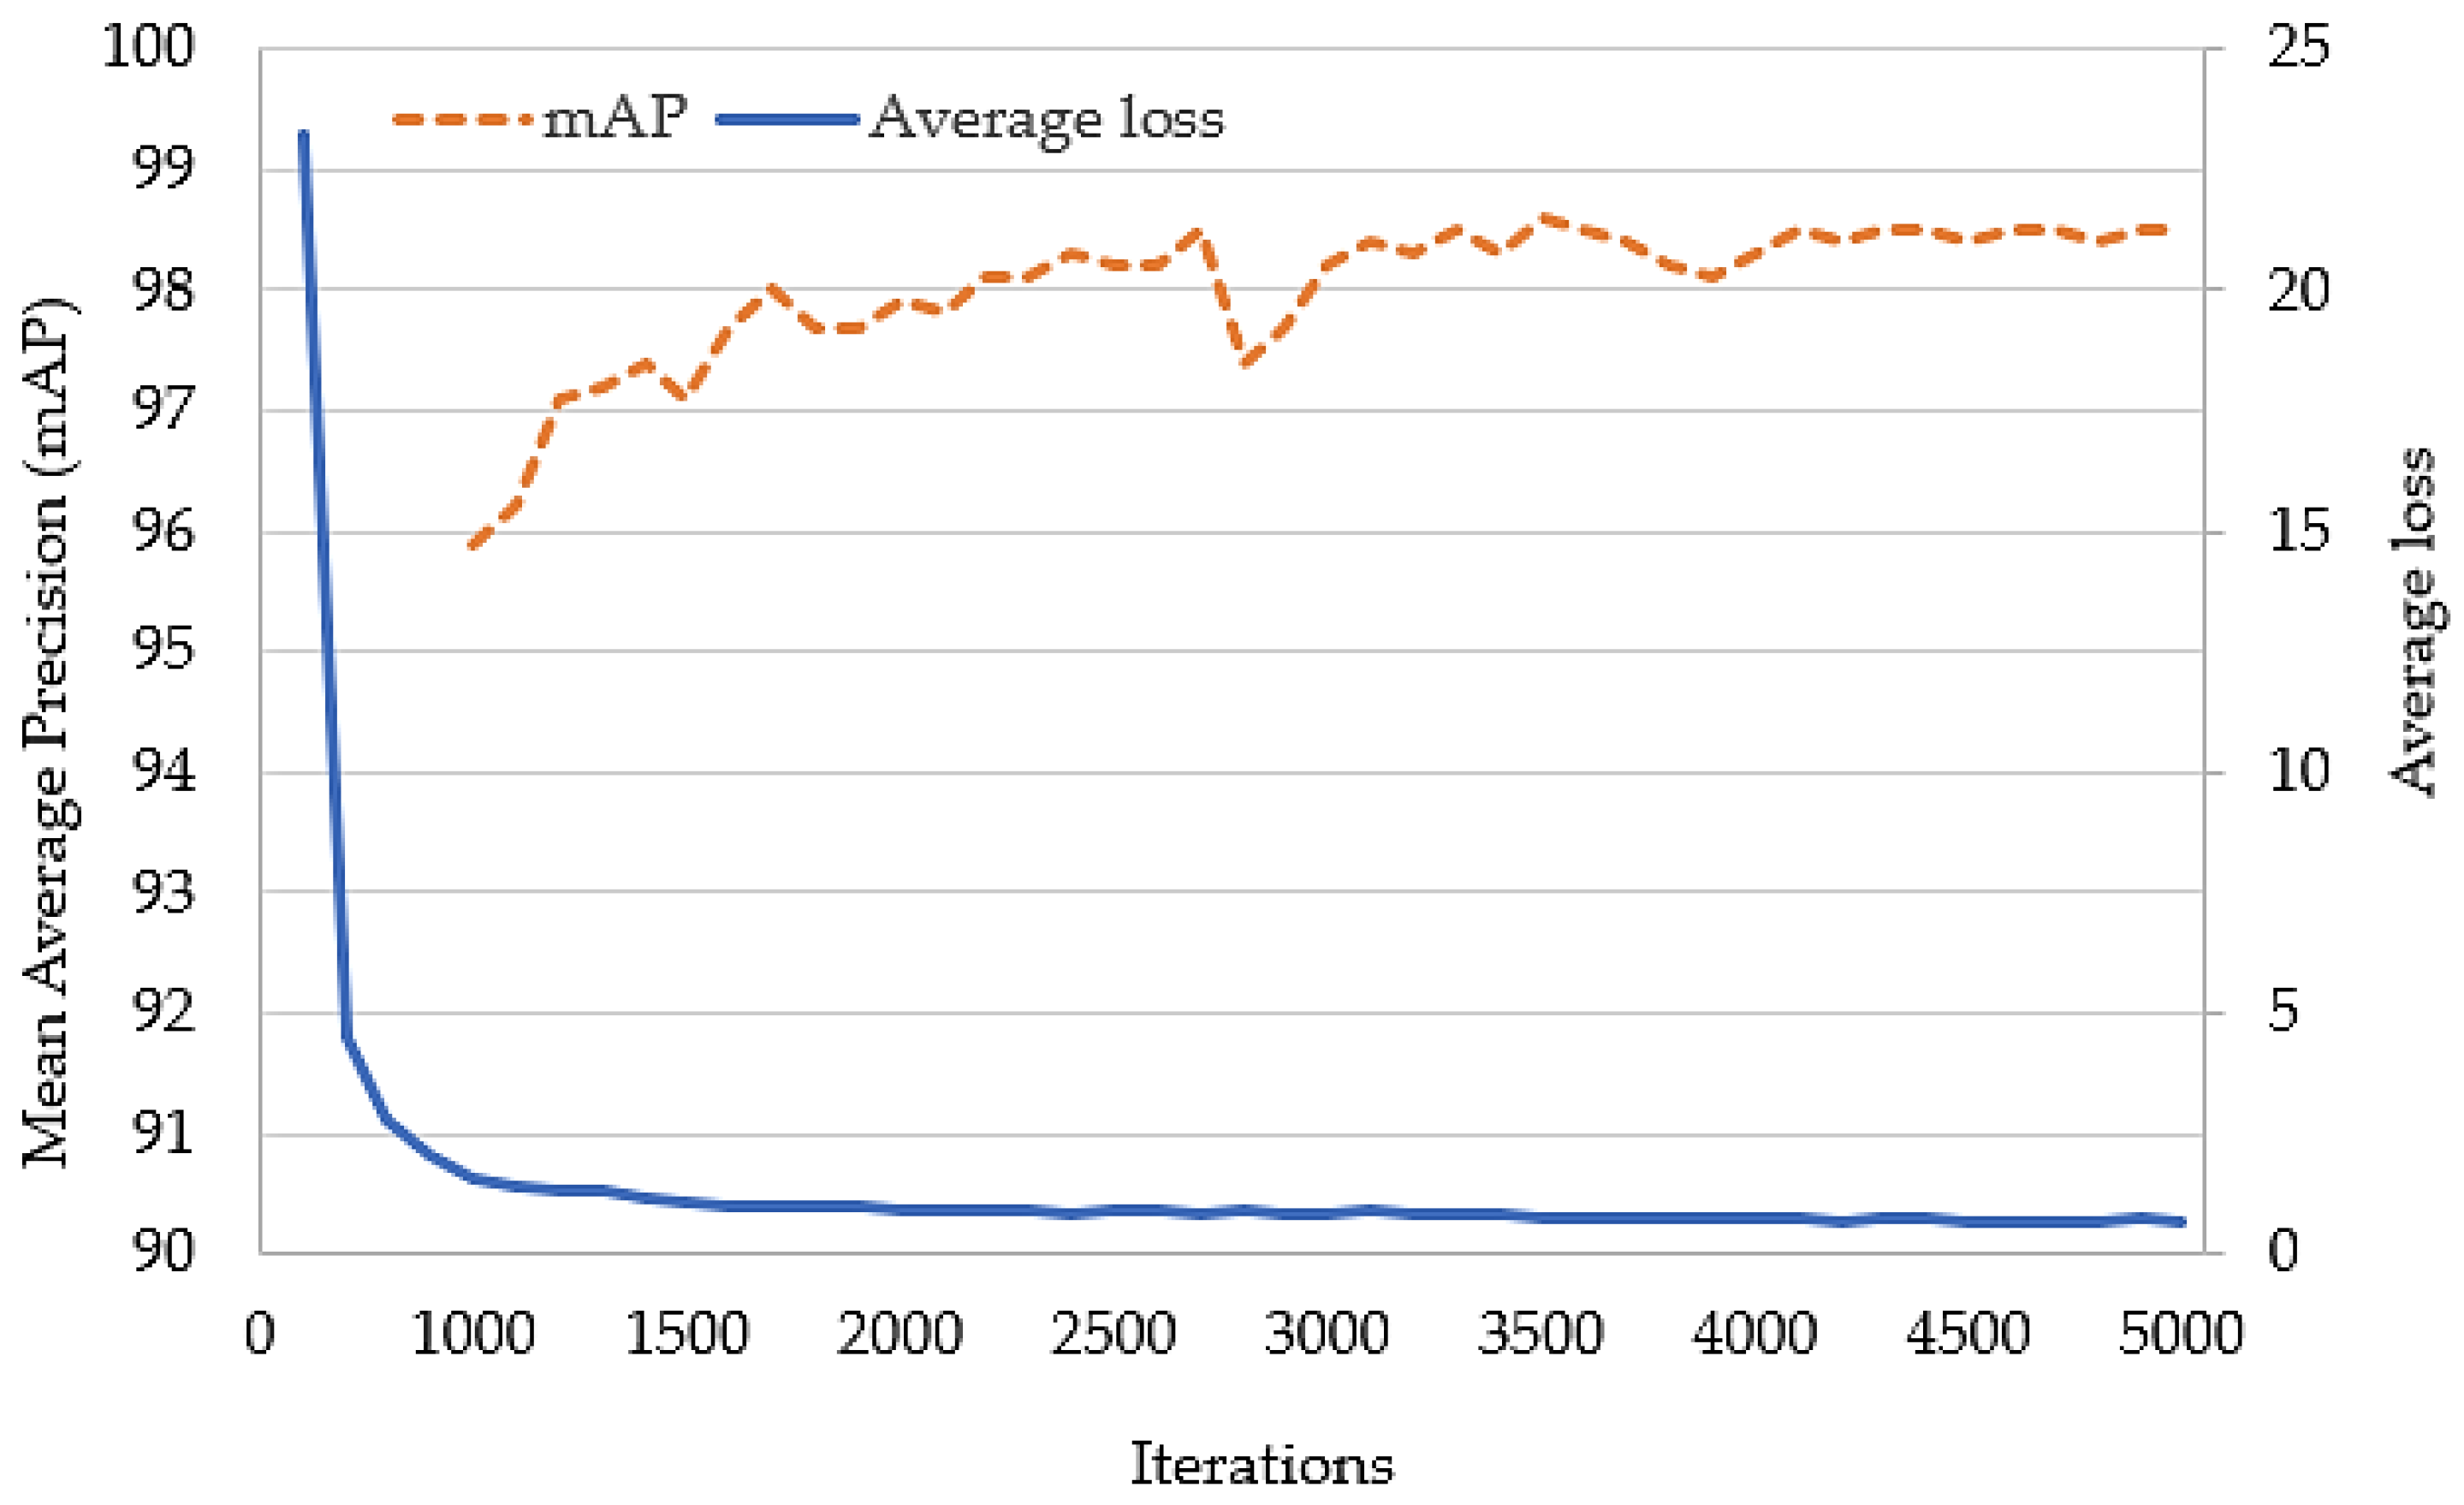
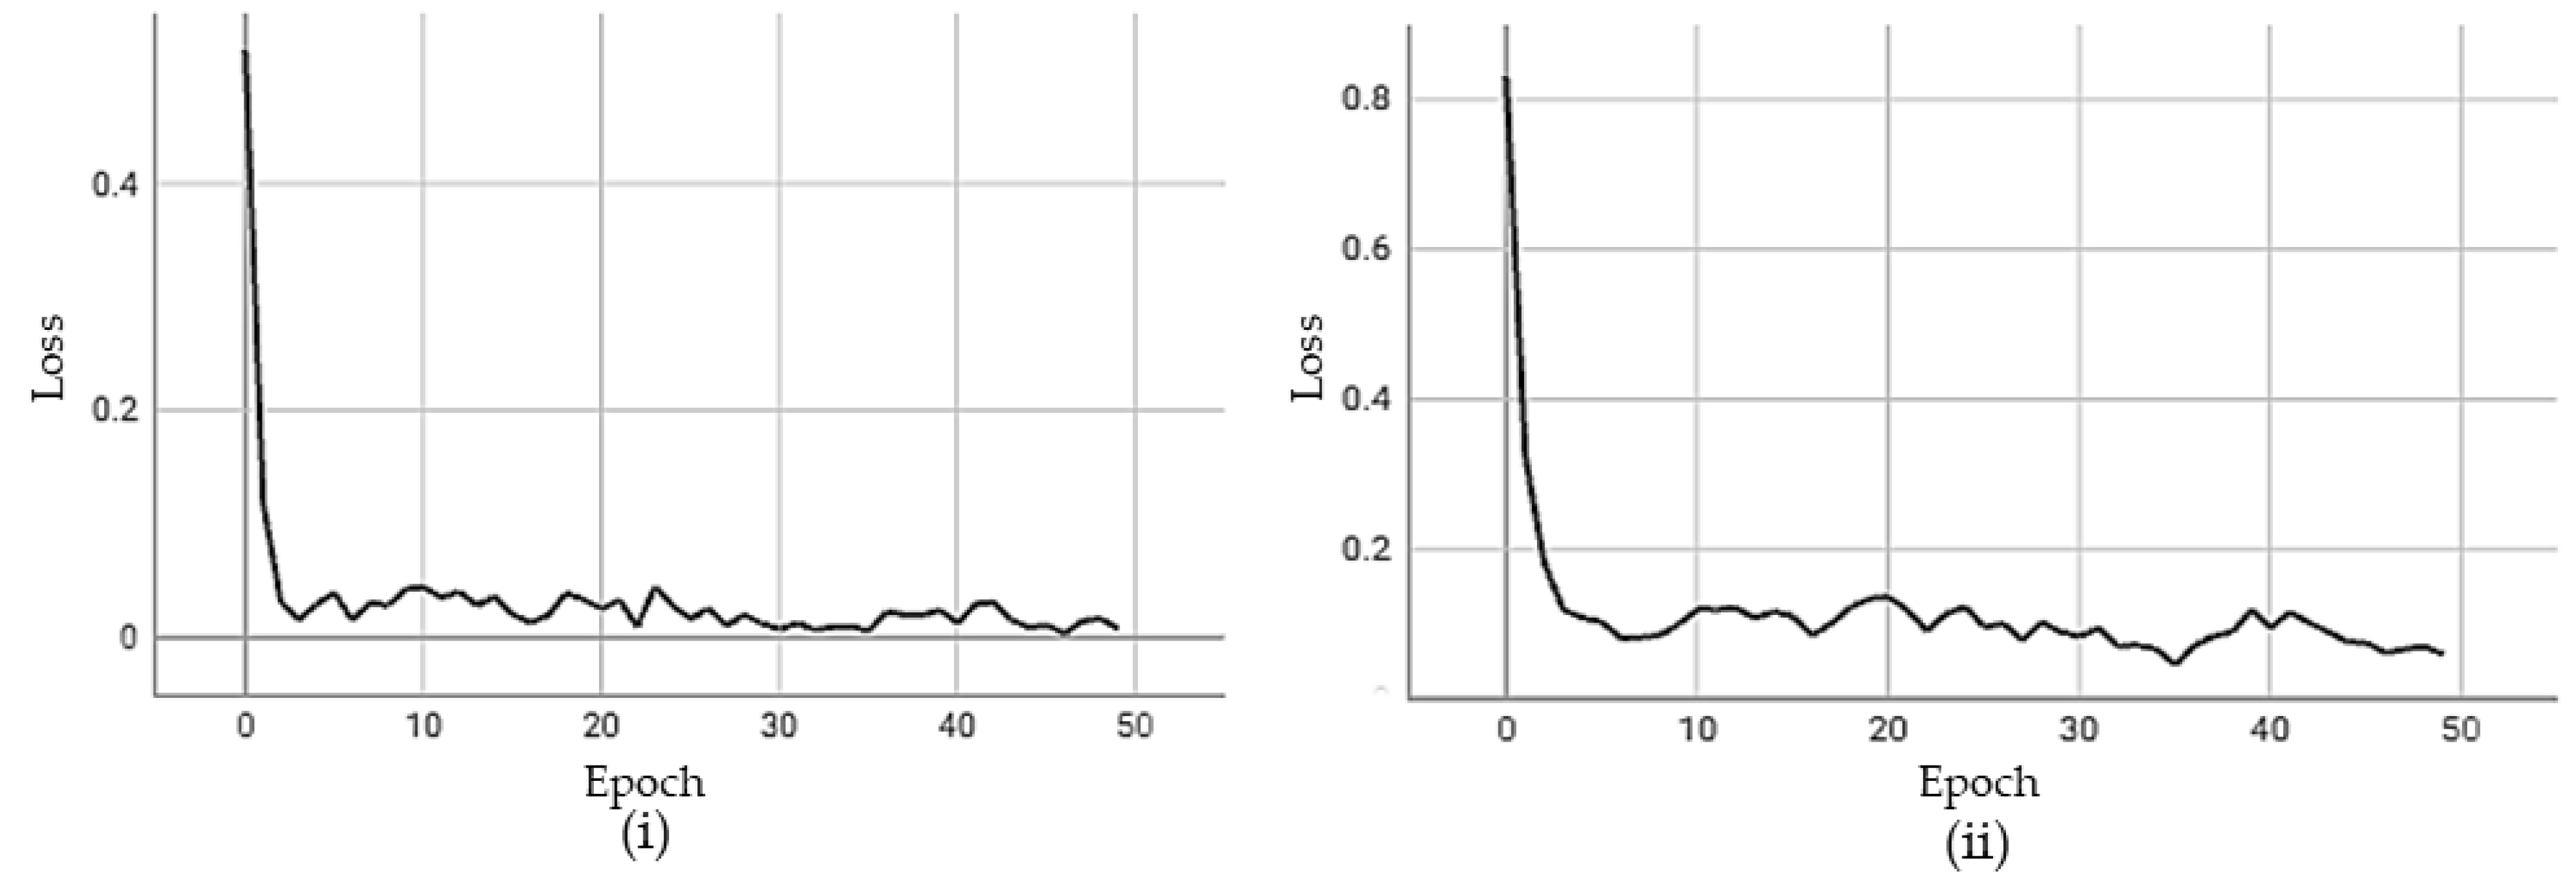
3.1. Model Performance for Fruit Detection

Several full and tiny YOLO versions were trained and tested using the images sets of Koirala et al. (2019), allowing direct comparison with the previously published results of MangoYOLO. An example Precision–Loss chart is provided from the training of the YOLOv4-tiny model, for which average precision plateaued after 2000 iterations (Figure 10) at 0.986 mean average precision (mAP) with a F1 score of 0.94 at 0.5 IoU threshold, with a detection speed of 5.5 ms per 612 × 512 pixels tiled image while using 655 Mb GPU memory (Tesla P100 GPU) and 23 ms per full image (1920 × 1080 pixel image) (i.e., capable of processing~43 fps) with use of 1261 Mb of GPU memory.
The performance of the YOLO models were similar in terms of mAP, and the light versions had similar inference time (Table 4). We conclude that while YOLO continues to evolve, the improvement in object detection accuracy for the mango fruit on tree application is relatively minor, with research effort better placed into other aspects of the application. YOLOv4-tiny was adopted in this study based on its small model size and high inference speed, which allows for real-time use on edge computing devices.
Training of the Mask R-CNN model converged well within ten epochs, indicating no significant model overfitting (Figure 11). The model trained for 50 epochs with Resnet-101 backbone had the best mAP (see Table 5). The best mAP achieved was 95.6 for a model trained with tiled image sets. The segmentation model trained with ResNet-101 backbone was used for the fruit sizing exercises in this study.

3.2. Exclusion of Occluded Fruit

The YOLOv4-tiny detector used in Method 1 and 3 achieved detection of 157 fruit, whereas the Mask R-CNN instance segmentation employed in Method 2 detected 160 fruit in the same images. A manual count of fruit on images was 154, suggesting few false positives in the detection.
The stricter settings of criteria B resulted in rejection of 42% of detected fruit (average across the three methods), compared to 26% for criteria A (Table 6). There was an interaction between Method and criteria set, with Method 2 and 3 resulting in the lowest and highest exclusion rates respectively.
To compare processing time for all methods, a single image of 1920 × 1080 pixels was processed using a 7th generation Intel Core i5 processor. Method 1 processed an image in 1.4 s, while Methods 2 and 3 took 5.5 and 15.5 s, respectively. These processing times can be improved significantly with the use of dedicated GPU and using optimised models, such as TensorRT models. Further research will be focused on optimizing the image processing pipeline for GPU enabled edge devices.
Unlike fruit load estimation, an orchard assessment of fruit size distribution does not require assessment of all fruit. The number of samples (n) required for a reliable estimate of the population mean is a function of population SD, accepted error (e) and desired probability level and associated t statistic (t) [27] (Equation (11)). For example, given e of 2 mm and a SD of fruit length of 17 mm (for Keitt, Table 3), at a 95% probability and using Equation (11), the required n is 141. Thus, the exclusion of a large number of fruits in a processing pipeline is not of concern, unless the size distribution of excluded fruit differs from that of the population mean. This was not the case in practice for either Honey Gold or Keitt populations (Table 7).

3.3. Fruit Sizing Method Evaluation

For fruit length evaluation, the best sizing assessment result, in terms of RMSE and R2, was achieved using Method 2 for the Honey Gold population, with the result improved by use of exclusion criteria B compared to criterion A. Method 2 also gave the best RMSE and R2 for the Keitt population under criteria set A, but Method 3 did best under criteria set B. Absolute bias varied between 0.7 and 4.2 mm, with the minimum bias achieved with Method 1 in three of the four cases considered. Based on RMSE, Method 2 is recommended, although processing speed was one third of Method 1. The harsher exclusion criteria in set B is recommended.

3.4. Fruit Weight Estimation

Fruit weight was related to lineal measurements of fruit by a linear and a power function by [28]. For Keitt fruit, weight (W) estimation from calliper measurements of lineal dimensions ( L ,     W and T ), the linear relationship M = k L W T was characterised by a R2 = 0.9977 and RMSE = 11.8 g, while for a power function ( M = C 1 L W T C 2 ) R2 = 0.9995 and RMSE = 12.4 g, where C1 and C2 are constants. The relationship of M = k L W + T 2 2 was characterised by a linear correlation R2 = 0.9996 and RMSE = 11.7 g, and a power function ( M = C 1 L W + T 2 2 C 2 ), with R2 = 0.9995 and RMSE = 12.4 g, where C 1 = 0.5757 and C 2 = 0.9895. The linear relationship is thus recommended over the power function. Using machine vision estimates of fruit length and width, fruit weight estimated using a linear correlation model for this fruit population (range of 180 and 1130 g, Table 3) was characterised by an R2 of 0.83, bias of −114 g and bias-corrected RMSE of 113 g.
The estimation of mass of a mango fruit on-tree from lineal dimensions is prone to greater error than for a circular-symmetric fruit, given the variation in mango fruit width in different orientations. Thus, while the RMSE on estimation of fruit lineal dimension in this study (4.7 mm) (Table 8) was comparable to that achieved in other studies and other fruit, e.g., 4.9 mm RMSE for mango length [9] and 5.1 mm RMSE for apple diameter at 40% visibility of fruit surface [6], the RMSE on estimation of mass was large, at 113 g, compared to that for axi-symmetric fruit, e.g., 18 g for tomato [23] and 15.5 g or for passion fruit [30]. Authors of [31] reported 95 and 96.7% accuracy on mass estimates for carrot and cucumber, respectively. For mango, [3] reported a RMSE of 10.4 g based on segmented fruit area, for measurements made in a well-lit indoor environment involving non-occluded fruit. However, [28] reported up to 29% over estimation of fruit mass for estimates based on machine vision measurements of fruit length only. This study achieved a lower bias for machine vision-based estimates of mango fruit mass through use of the two dimensions of length and apparent width.
To demonstrate the intended practical use, Method 2 with criteria set B was employed on video of an orchard row, with output of a fruit length and weight frequency distribution (Figure 12). This information could be used to assist harvest timing decisions given information on rate of size increase and target size, and in evaluation of the proportion of fruit in populations from different flowering events.

4. Conclusions

Much published effort has been placed into comparison of object detectors. For our application case, the detection performance of the YOLO versions was similar, with mAP between 98.6 and 99.2% across six architectures. We suggest research effort is therefore better placed in other aspects of the application. The tiny variants of each YOLO version were around one-tenth the model size and five times the speed of the full-size version, while detection performance was similar. Deployment of the tiny versions is therefore appropriate in support of real time processing in edge computing, as required, e.g., in automated harvesting or spray control.
For sizing of fruit on-tree, the elimination from consideration of partly occluded fruit is required. For generation of a size frequency distribution for which only a sample of fruit need to be assessed, the use of stricter criteria on the exclusion of fruit from consideration is recommended for the resulting decrease in size estimation error.
For sizing of fruit within YOLO bounding box detections, use of Otsu’s thresholding method was faster than use of Mask R-CNN instance segmentation, however, there was a higher risk of false segmentation because of occlusions by other fruit, leaves or panicles. A sizing method using instance segmentation of the entire images achieved the best result in estimation of fruit size, e.g., with a RMSE of 5 mm on length estimation, resulting in an RMSE of 113.8 g for fruit weight estimation based on L and apparent W estimates. However, this was at the penalty of a four-fold increased processing time (1.4 to 5.5 s per full resolution image). Improvement in these estimates could be achieved with use of higher resolution cameras and fine-tuned instance segmentation models.

Author Contributions

Conceptualization, C.N., A.K. and K.B.W.; methodology, C.N., A.K. and K.B.W.; software: C.N. and A.K.; investigation, C.N.; writing—original draft preparation, C.N.; writing—review and editing, C.N. and K.B.W.; supervision, K.B.W. and A.K.; project administration, K.B.W.; funding acquisition, K.B.W. All authors have read and agreed to the published version of the manuscript.

Funding

This research was funded by an Australian Department of Agricultural and Fisheries R&D4Profit grant managed by Hort Innovation (ST19009). CN acknowledges receipt of a CQU-Manbulloo Elevate living allowance scholarship and a CQU international fees scholarship.

Data Availability Statement

Parts of the image dataset used in this study are published and available at https://doi.org/10.25946/21655628 (accessed on 15 October 2022).

Acknowledgments

We acknowledge use of High Performance Computing (HPC) System GPU nodes at Central Queensland University for model trainings.

Conflicts of Interest

The authors declare no conflict of interest.

References

  1. Anderson, N.T.; Walsh, K.B.; Koirala, A.; Wang, Z.; Amaral, M.H.; Dickinson, G.R.; Sinha, P.; Robson, A.J. Estimation of Fruit Load in Australian Mango Orchards Using Machine Vision. Agronomy 2021, 11, 1711. [Google Scholar] [CrossRef]
  2. Moreda, G.; Ortiz-Cañavate, J.; García-Ramos, F.J.; Ruiz-Altisent, M. Non-destructive technologies for fruit and vegetable size determination–a review. J. Food Eng. 2009, 92, 119–136. [Google Scholar] [CrossRef] [Green Version]
  3. Utai, K.; Nagle, M.; Hämmerle, S.; Spreer, W.; Mahayothee, B.; Müller, J. Mass estimation of mango fruits (Mangifera indica L., cv. ‘Nam Dokmai’) by linking image processing and artificial neural network. Eng. Agric. Environ. Food 2019, 12, 103–110. [Google Scholar] [CrossRef]
  4. Apolo-Apolo, O.E.; Martínez-Guanter, J.; Egea, G.; Raja, P.; Pérez-Ruiz, M. Deep learning techniques for estimation of the yield and size of citrus fruits using a UAV. Eur. J. Agron. 2020, 115, 126030. [Google Scholar] [CrossRef]
  5. Kurtser, P.; Ringdahl, O.; Rotstein, N.; Berenstein, R.; Edan, Y. In-Field Grape Cluster Size Assessment for Vine Yield Estimation Using a Mobile Robot and a Consumer Level RGB-D Camera. IEEE Robot. Autom. Lett. 2020, 5, 2031–2038. [Google Scholar] [CrossRef]
  6. Gené-Mola, J.; Sanz-Cortiella, R.; Rosell-Polo, J.R.; Escolà, A.; Gregorio, E. In-field apple size estimation using photogrammetry-derived 3D point clouds: Comparison of 4 different methods considering fruit occlusions. Comput. Electron. Agric. 2021, 188, 106343. [Google Scholar] [CrossRef]
  7. Lin, G.; Tang, Y.; Zou, X.; Li, J.; Xiong, J. In-field citrus detection and localisation based on RGB-D image analysis. Biosyst. Eng. 2019, 186, 34–44. [Google Scholar] [CrossRef]
  8. Zheng, B.; Sun, G.; Meng, Z.; Nan, R. Vegetable Size Measurement Based on Stereo Camera and Keypoints Detection. Sensors 2022, 22, 1617. [Google Scholar] [CrossRef]
  9. Wang, Z.; Walsh, K.B.; Verma, B. On-tree mango fruit size estimation using RGB-D images. Sensors 2017, 17, 2738. [Google Scholar] [CrossRef] [Green Version]
  10. Otsu, N. A threshold selection method from gray-level histograms. IEEE Trans. Syst. Man Cybern. 1979, 9, 62–66. [Google Scholar] [CrossRef]
  11. Koirala, A.; Walsh, K.B.; Wang, Z.; McCarthy, C. Deep learning—Method overview and review of use for fruit detection and yield estimation. Comput. Electron. Agric. 2019, 162, 219–234. [Google Scholar] [CrossRef]
  12. Redmon, J.; Divvala, S.; Girshick, R.; Farhadi, A. You only look once: Unified, real-time object detection. In Proceedings of the IEEE Conference on Computer Vision and Pattern Recognition, Las Vegas, NV, USA, 27–30 June 2016; pp. 779–788. [Google Scholar]
  13. Koirala, A.; Walsh, K.B.; Wang, Z.; McCarthy, C. Deep learning for real-time fruit detection and orchard fruit load estimation: Benchmarking of ‘MangoYOLO’. Precis. Agric. 2019, 20, 1107–1135. [Google Scholar] [CrossRef]
  14. Bochkovskiy, A.; Wang, C.Y.; Liao, H.Y.M. YOLOv4: Optimal Speed and Accuracy of Object Detection. arXiv 2020. [Google Scholar] [CrossRef]
  15. Wang, C.-Y.; Bochkovskiy, A.; Liao, H.-Y.M. YOLOv7: Trainable bag-of-freebies sets new state-of-the-art for real-time object detectors. arXiv 2022. [Google Scholar] [CrossRef]
  16. Shi, R.; Li, T.; Yamaguchi, Y. An attribution-based pruning method for real-time mango detection with YOLO network. Comput. Electron. Agric. 2020, 169, 105214. [Google Scholar] [CrossRef]
  17. Ronneberger, O.; Fischer, P.; Brox, T. U-net: Convolutional networks for biomedical image segmentation. In Proceedings of the International Conference on Medical Image Computing and Computer-Assisted Intervention, Munich, Germany, 5–9 October 2015; pp. 234–241. [Google Scholar]
  18. He, K.; Gkioxari, G.; Dollár, P.; Girshick, R. Mask r-cnn. In Proceedings of the IEEE International Conference on Computer Vision, Venice, Italy, 22–29 October 2017; pp. 2961–2969. [Google Scholar]
  19. Ren, S.; He, K.; Girshick, R.; Sun, J. Faster r-cnn: Towards real-time object detection with region proposal networks. arXiv 2015, arXiv:1506.01497. [Google Scholar] [CrossRef] [Green Version]
  20. Long, J.; Shelhamer, E.; Darrell, T. Fully convolutional networks for semantic segmentation. In Proceedings of the IEEE Conference on Computer Vision and Pattern Recognition, Boston, MA, USA, 7–12 June 2015; pp. 3431–3440. [Google Scholar]
  21. Sabzi, S.; Abbaspour-Gilandeh, Y.; Hernandez-Hernandez, J.L.; Azadshahraki, F.; Karimzadeh, R. The use of the combination of texture, color and intensity transformation features for segmentation in the outdoors with emphasis on video processing. Agriculture 2019, 9, 104. [Google Scholar] [CrossRef] [Green Version]
  22. Zu, L.; Zhao, Y.; Liu, J.; Su, F.; Zhang, Y.; Liu, P. Detection and Segmentation of Mature Green Tomatoes Based on Mask R-CNN with Automatic Image Acquisition Approach. Sensors 2021, 21, 7842. [Google Scholar] [CrossRef]
  23. Lee, J.; Nazki, H.; Baek, J.; Hong, Y.; Lee, M. Artificial intelligence approach for tomato detection and mass estimation in precision agriculture. Sustainability 2020, 12, 9138. [Google Scholar] [CrossRef]
  24. Hsieh, K.-W.; Huang, B.-Y.; Hsiao, K.-Z.; Tuan, Y.-H.; Shih, F.-P.; Hsieh, L.-C.; Chen, S.; Yang, I.C. Fruit maturity and location identification of beef tomato using R-CNN and binocular imaging technology. J. Food Meas. Charact. 2021, 15, 5170–5180. [Google Scholar] [CrossRef]
  25. Neupane, C.; Koirala, A.; Wang, Z.; Walsh, K.B. Evaluation of depth cameras for use in fruit localization and sizing: Finding a successor to Kinect v2. Agronomy 2021, 11, 1780. [Google Scholar] [CrossRef]
  26. Lin, T.-Y.; Dollár, P.; Girshick, R.; He, K.; Hariharan, B.; Belongie, S. Feature pyramid networks for object detection. In Proceedings of the IEEE Conference on Computer Vision and Pattern Recognition, Honolulu, HI, USA, 21–26 July 2017; pp. 2117–2125. [Google Scholar]
  27. Walsh, K.B.; McGlone, V.A.; Wohlers, M. Sampling and statistics in assessment of fresh produce. In Developing Smart Agri-Food Supply Chains: Using Technology to Improve Safety and Quality; Burleigh Dodds Science Publishing: Cambridge, UK, 2021. [Google Scholar]
  28. Spreer, W.; Müller, J. Estimating the mass of mango fruit (Mangifera indica, cv. Chok Anan) from its geometric dimensions by optical measurement. Comput. Electron. Agric. 2011, 75, 125–131. [Google Scholar] [CrossRef]
  29. Anderson, N.T.; Subedi, P.P.; Walsh, K.B. Manipulation of mango fruit dry matter content to improve eating quality. Sci. Hortic. 2017, 226, 316–321. [Google Scholar] [CrossRef]
  30. Gonzalez, J.P.B.; Ortiz, F.A.P.; Rodriguez, C.P.P. Mass and volume estimation of passion fruit using digital images. IEEE Lat. Am. Trans. 2017, 15, 275–282. [Google Scholar] [CrossRef]
  31. Huynh, T.; Tran, L.; Dao, S. Real-time size and mass estimation of slender axi-symmetric fruit/vegetable using a single top view image. Sensors 2020, 20, 5406. [Google Scholar] [CrossRef]
Figure 1. Example YOLO network structure (YOLOv4-tiny).
Horticulturae 08 01223 g001
Figure 2. Mask R-CNN head architecture, involving addition of a Mask branch to ResNet [18] and backbone with feature pyramid network (FPN) [26].
Horticulturae 08 01223 g002
Figure 3. Example of model outputs for: (i) YOLOv4-tiny bounding box on detected fruits; (ii) Mask R-CNN instance segmentation on image tile; (iii) instance segmentation applied to bounding box produced by a YOLOv4-tiny detection model.
Horticulturae 08 01223 g003
Figure 4. Segmentation using thresholding and morphological transformation: (a) image from YOLOv4-tiny bounding box, (b) thresholding using Otsu’s method, (c) stalk and noise removal using structuring element filtering with horizontal (2 × 10 pixels) and vertical (10 × 2 pixels) kernel filtering applied, (d) segmented portion of RGB image. Examples (i) and (ii) represent well segmented fruit, while (iii) and (iv) represent problems resulting from overlap with other fruit and leaves. Image (iii) is common to Figure 3.
Horticulturae 08 01223 g004aHorticulturae 08 01223 g004b
Figure 5. Method 1–Fruit sizing based on YOLOv4-tiny detection and Otsu’s thresholding. This method is an adoption of Wang et al. [9], with changes in object detector and filter for stalk removal.
Horticulturae 08 01223 g005
Figure 6. Method 2–Fruit sizing using Mask R-CNN instance segmentation on the entire image.
Horticulturae 08 01223 g006
Figure 7. Method 3–Mask R-CNN segmentation within YOLOv4-tiny detected bounding boxes.
Horticulturae 08 01223 g007
Figure 8. An example output image using Method 2, criteria set B. Fruit enclosed with green bounding box and blue ellipse are non-occluded fruits and considered for sizing. Fruit enclosed by red ellipse are occluded or failed to fulfil criterion set.
Horticulturae 08 01223 g008
Figure 9. Examples of fruit occlusion by (i) leaf, (ii) other fruit; (iii) panicle.
Horticulturae 08 01223 g009
Figure 10. Precision-Loss chart for the training of YOLOv4-tiny model.
Horticulturae 08 01223 g010
Figure 11. Loss charts for training of the Mask R-CNN model; (i) bounding box loss; (ii) mask loss. Charts were generated by Tensorboard.
Horticulturae 08 01223 g011
Figure 12. Frequency distribution of (i) fruit length and (ii) fruit weight, based on fruit lineal dimensions estimated from Honey Gold orchard row imaged at 5 fps. Fruit weight categories match those of Australian fruit tray sizes. Fruit weight was calculated using estimated length and width.
Horticulturae 08 01223 g012
Table 1. Description of image datasets used for training and testing object detection and instance segmentation models.
DatasetDescription
Dataset-ATraining set of 1300 tiles and test set of 130 tiles of 512 × 612 pixels RGB images of cultivar Calypso fruit at Childers, QLD, Australia. The images were captured using a 5 MP (megapixels) ace 1300ac camera (Basler, Ahrensburg, Germany) operated at night under 400 W LED flood lighting, with a GNSS system for geolocation, on an imaging rig mounted to a farm vehicle, as described in [1]. Dataset acquired from [13].
Dataset-BTraining set of 454 tiles and test set of 92 images of 540 × 640 pixels. Images were of cultivar Honey Gold and Keitt at Bungundara, QLD, Australia, captured at night with an Azure Kinect RGB-D camera mounted on the imaging rig described in [1].
Dataset-CTraining set of 1080 and test set of 120 bounding box snips acquired using YOLOv4-tiny detection on Dataset-B images. Image size is variable with width and height < 256 pixels.
Table 2. Criteria sets for identification and exclusion of partly occluded fruit.
CriteriaCriteria Set-BCriteria Set-A
Threshold for ellipse area in pixels500 to 12,000500 to 12,000
Area ratio between area inside contours and ellipse area>0.97>0.90
Eccentricity of ellipse (fitted ellipse being closer to circle)<0.75<0.8
Absolute difference between refined bounding box height and ellipse major axis length (in pixels)<5<8
Table 3. Fruit lineal dimensions as assessed using calipers, for two populations of fruit.
Length (mm)Width (mm)Weight (g)
MAXMINAVGSDMAXMINAVGSDMAXMINAVGSD
HG (n = 60)128.282.7107.59.4110.365.191.210.1----
Keitt (n = 44)160.975.5110.117.0122.86688.612.61430180499247
Table 4. Performance comparison of YOLO models for a mango fruit detection application. Training and test sets of [13] were used. Best result for a given criterion is shown in bold.
ModelsmAP
IoU = 0.5
At Confidence Threshold 0.80Speed (ms)BFLOPModel Weights (MB)
F1FPAvg. IoU (%)
MangoYOLO98.550.952279.15.7115.652.5
YOLOv398.960.942682.628.9139.5234.9
YOLOv3-tiny98.060.932380.75.211.633.1
YOLOv499.20.972682.932.2127.3244.2
YOLOv4-tiny98.630.942282.45.514.522.4
YOLOv799.110.89186.827.6103.2139.4
YOLOv7-tiny99.020.913867.711.823
Note: mAP denotes mean average precision, F1 denotes harmonic mean of precision and recall, FP denotes false positive, IoU denotes intersection over union and BFLOP denotes billion floating point operations.
Table 5. Mean average precisions (mAP) of trained Mask R-CNN models.
ModelmAP (Tiled Images)mAP (Bounding Box Snips)
Mask R-CNN (ResNet101)95.685.28
Mask R-CNN (Resnet50)88.3578.75
Table 6. Percentage of sample fruit accepted by two criteria for each of three sizing methods.
Exclusion CriteriaFruit Acceptance (%)
HGKeittTotal
Criteria—AMethod 1806875
Method 2807779
Method 3676867
Average 74
Criteria—BMethod 1455248
Method 2716870
Method 3585055
Average 58
Table 7. Mean ± SD of calliper length measurements for populations retained and excluded on the basis of criteria to identify occluded fruit for Method 2, Criteria A and B. Units are in mm.
Retained HG
(mm)
Excluded HG
(mm)
Retained Keitt
(mm)
Excluded Keitt
(mm)
Criteria—AL107.3 ± 10.0108.0 ± 6.0113.3 ± 17.399.1 ± 9.9
W90.9 ± 10.691.6 ± 8.291.17 ± 12.479.8 ± 8.8
Criteria—BL107.4 ± 9.7107.7 ± 8.4110.6 ± 15.8108.9 ± 18.5
W92.2 ± 9.988.8 ± 10.389.13 ± 11.387.4 ± 14.5
Table 8. Statistics of RMSE, R2 and bias on estimation of fruit length using three methods (M1: YOLOv4-tiny with Otsu’s thresholding; M2: Mask R-CNN segmentation method; M3: YOLOv4-tiny bounding box + instance segmentation) and two criteria. Units of RMSE and bias are mm. Best result for each population and metric is bolded.
Honey GoldKeitt
M1M2M3M1M2M3
Criteria—ARMSE65.267.67.86.5
R20.70.80.70.90.90.9
Bias0.721.5−1.3−3.8−4.2
Criteria—BRMSE5.94.75.46.85.15.6
R20.80.90.80.90.90.9
Bias33.11−2.1−2.4−3.8
Publisher’s Note: MDPI stays neutral with regard to jurisdictional claims in published maps and institutional affiliations.

