Abstract
The Niamhom (Strobilanthes nivea Craib) plant was cultivated using a modern greenhouse with an automatic irrigation system controlled by the Internet of Things (IoT). The present study investigates the effects of fertilizers, including chemicals, cow manure fertilizer, and bio-fermented water with shading influences of 50 and 70% on plant growth and morphological characteristics. Additionally, the study aims to analyze the chemical constituents of cultivated Niamhom leaf evaluated by Gas Chromatography-Mass Spectrometry (GC-MS). Findings discovered that 50 and 70% shading did not affect plant stem size and canopy diameter. However, shading at 50% affects chlorophyll content, yield, dry weight, leaf diameter, plant height, and the number of leaves. There were no differences in plant growth parameters among the three fertilizer treatments, but significant differences were found in leaf number, leaf area, and chlorophyll content. The chemical fertilizers gave the highest values, followed by cow manure fertilizer and bio-fermented water. The leaves of the Niamhom plant grown in 70% shade with cow manure fertilizer application had the highest overall aromatic content, followed by plants grown in 50% shade with cow manure and chemical fertilizers, respectively. However, when the synergistic interaction of fertilizers and shade factor of 50 to 70% were examined, it was revealed that the chemical odorants of the Niamhom leaf interacted significantly. The whole aromatic substances were detectable in dichloromethane (DCM) extracts, except 2-hexanal in ethyl acetate mediated extract. GC-MS analysis revealed that the primary substances in Niamhom leave comprised 2-propionyl-3,4,5,6-tetrahydropyridine, 2-propionyl-1,4,5,6-tetrahydropyridine, hexanoic acid, 3,5,5-trimethyl-, nonyl ester, n-hexadecanoic acid, phytol, 9,12-octadecadienoic acid. The specific aroma compounds of Niamhom leaves that can be utilized as indicators for the herb’s potential consist of 2-hexenal, 2-acetyl-3,4,5,6-tetrahydropyridine, maltol, 2-acetyl-1,4,5,6-tetrahydropyridine, hexanoic acid, and 3,5,5-trimethyl-, nonyl ester. Future surveys are necessary to be performed for Niamhom as a potential herb plant for aromatic and several food applications.
1. Introduction
As a member of the Acanthaceae family, Niamhom (Strobilanthes nivea Craib) is primarily found in tropical and subtropical areas [1,2,3]. Thailand’s northern, central, and northeastern regions are home of native plant known as Niamhom. Niamhom is a succulent herb that thrives in moist, shaded environments. This herb’s leaves have a perfume that is unlike any other; it is like the aroma of Pandan leaves but is deeper, richer, and longer [4]. Historically, the leaves have been used for making perfumes, cosmetics, and traditional medicines to treat colds, fever, asthma symptoms, and dizziness [5]. It has been discovered that it can be utilized as an ingredient in roasted herbs to benefit postpartum ladies by reducing bruising, swelling, and dispersing blood. Because of their distinctive and enduring aroma, leaves are gradually employed as culinary and beverage ingredients. Likewise, due to the pleasant smell, Niamhom is used as a natural flavor in the food industry [6].
There is not adequate information in the scientific literature about the fundamentals of physiology, anatomy, growth, and yield of Niamhom. This plant mainly grows by nature, which is quite challenging to take care of because its leaves will burn in bright sunlight, or if the plant is planted in very moist or shaded conditions, it will rot or die. Additionally, the current climate change significantly impacts the growth of Niamhom plants and herbal plants that need attention to grow [7]. Some particularly delicate plant species may even be in danger of going extinct. Increased transparency in scientific understanding of destruction patterns will allow concentration on the most effective approaches to reduce or minimize invasive species extinction hazards [8].
The increase in the worldwide population necessitates a transition toward intelligent agricultural technology. The Internet of Things (IoT) and data analytics (DA) are being used to improve farming operations’ productivity and effectiveness [9]. Agriculture has benefited from the Internet of Things (IoT) due to climate change and unpredictable environments. IoT is used in farming to track and monitor using “sensing” technologies. Status of information required to grow in real-time light intensity, temperature, soil moisture, weather conditions, etc., assist operators in making decisions and managing production effectively to predict or anticipate the yield accurately and to lessen the risk of damage [10].
The quality analysis of agricultural products or aromatic and medicinal plants must be investigated concurrently with system development or studying factors influencing growth and production. For example, the quality of agricultural products can be determined by analyzing the significant components, bio-active compounds, volatile organic compounds, or fragrance substances [11,12,13,14]. Various varieties of components were assessed for each essential volatile organic compound in fruit to indicate freshness and the evaluation of scents [15], aroma levels in flowers [16,17], and caffeine levels in coffee [18,19] to assess the quality and to reach the goal of standard production.
The first and most widely applied approach for analyzing volatile organic molecules or odor components is Gas Chromatography-Mass Spectroscopy (GC-MS). The GC-MS method can monitor and research compositional changes based on planting period, location, and environmental factors. For example, Ahmad et al. [13] reported that the Solid Phase Micro Extraction (SPME) GC-MS technique was used to study the chemical composition of essential oil from each part of the medicinal plant Polygonum minus shoots, leaves, and roots. A similar kind of investigation was conducted to compare the quality of passion fruit (Passiflora edulis) grown under conventional and organic production methods based on the various organic component levels [14]. The bioactive components, volatile chemicals, and cup quality of Excelsa coffee (Coffea liberica var. dewevrei) from different postharvest processing techniques were examined using High Performance-Liquid Chromatography (HPLC) and GC-MS equipment. Alkaloids remained largely stable during roasting; trigonelline was the notable exception. Additionally, the roasting procedure of Excelsa beans produced 17 strong volatile chemicals [11].
Therefore, the present investigation is focused on researching the impact of fertilization and shading on the morphological parameters and development of Niamhom plants, accompanied by studying the chemical constituent produced that will be used to evaluate the quality of the odor or fragrant components. Plant cultivation is done by employing an automatic irrigation system monitored by IoT.
2. Materials and Methods
2.1. Chemicals
Organic solvents of all analytical grades, such as hexane, dichloromethane (DCM), ethyl acetate (EtOAc), and methanol (MeOH), were purchased from RCI-Labscan. Folin–Ciocalteu reagent and Sodium carbonate anhydrous (Na2CO3, 99.5%, AR grade) was purchased from Loba, India. Gallic acid standard (purity ≥ 98.0%) was obtained from Sigma-Aldrich.
2.2. Plant Material
Niamhom saplings were collected as 8-month-old cuttings of plants from Queen Sirikit Botanical Garden (Monthon Norsaengsri and Anuwat Jaradrattanapaiboon QBG No. 122643), Mae Rim District, Chiang Mai Province, Thailand. Plant species were identified by following an example of A.F.G. Kerr, collector number 2442, as a prototype Craib [20], and a specialist in botany and plant anatomy confirmed (Dr. Monton Norsangsri) the plant species. The Niamhom plant pictures are displayed in Figure 1.
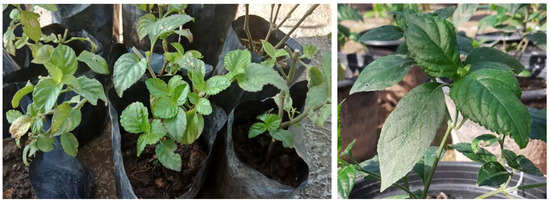
Figure 1.
Saplings of Niamhom (Strobilanthes nivea Craib).
2.3. Experimental Design
The experiment was arranged as a split-plot randomized complete block design (RCBD), with three repetitions of 10–15 plants each. The main plot was shaded with a shading net (Black plastic) at 50 and 70%, and the subplot consisted of 3 types of fertilizers. The greenhouse is supported with a light-intensity measurement system to maintain the photoperiod. Figure 2 shows that sensor kits in the Niamhom greenhouse are placed into two sensor kits, the first located in the center of the house, roughly 2 m from the entrance door, and the second in the center from the entrance, about 4 m. In the greenhouse, there is an atmospheric humidity control device equipped for spraying fog which consists of a small water pump connected to spraying 2 sets of 15 bar 4-way fog nozzles devices. The function of the misting system is to keep the humidity in the house stable for the decent development of the plants. If the air humidity exceeds the initial set, the control cabinet will direct the fog pump to run and get mist spray to maintain the environment’s moisture in the greenhouse. There are 4 fog nozzles placed in the greenhouse, each covering 25 Niamhom plants. Secondarily, the greenhouse is equipped with a water management device for the drip irrigation system monitored by IoT. It consists of a solenoid valve, 4 polyethylene (PE) pipes, and a micro-cable tube with 100 drip heads. The function of the drip irrigation system is to provide moisture to the soil in the pot. If the soil moisture content is less than specified, the control cabinet directs the Solenoid Valve to open immediately. The water from the tank is drawn through the pump along lines where the water flowing through the drip pipe is dispersed into the pot.
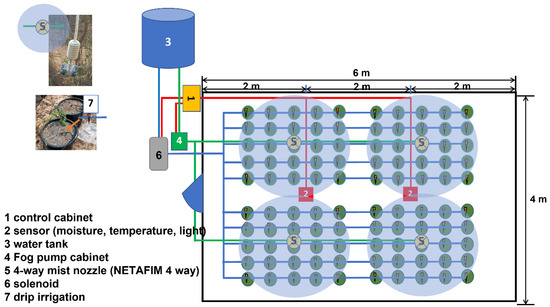
Figure 2.
Schematic diagram of IoT-operated irrigation system in a greenhouse.
IoT Irrigation System
Using the Internet of Things (IoT) scheme to control the environmental factors related to the growth of Niamhom plants is designed to monitor several factors, including automation of soil moisture control, pot irrigation, atmospheric humidity control, and the light-intensity measurement system. Above mentioned sensors connect the signal to the microcontroller devices in the control cabinet in front of the greenhouse. The reason for the need for a 2-point sensor unit is to compare the data obtained from the indoor environment, such as temperature, air humidity, and light intensity of which there are different level values, and average the data to a value that is closest to the environment that the system can measure. (1) The Arduino MEGA (Gravitech Thai, Co., Ltd., Pathum Thani, Thailand) device connects to the sensor device for receiving data from a specific environment. It connects to a variety of sensor devices: Light Intensity Sensor (SI1145 Digital UV/IR/Visible Light Sensor Adafruit, New York, NY, USA), Digital Temperature and Humidity Sensor (AM2315, CyberTice, Khon Kaen, Thailand), and Capacitive Soil Moisture Sensor (Rika Sensors, Changsha, China). (2) Device node MCU connects to the LCD screen display device in I2C Interface and links to various control devices such as Relay 2-Channel DC 5V 30A 220v to control misting pump and Solenoid Valve. Arduino MEGA receives the values obtained from the sensor then the collected data are forwarded to the Node MCU device and displayed on the LCD. The node MCU estimated the received environment data according to the specified conditions. If the needs are met, various control devices will be switched on, such as turning on-off the fog pump and the solenoid valve through the relay. Node MCUs can also be connected to a computer network via a Wi-Fi signal to the Internet network by using the Blynk program. The operating system is as smooth as using a single Arduino MEGA and can also solve the problem of insufficient power supply to the equipment. This includes data transmission loss and data discrepancy due to sensor interference installed in a single microcontroller. The schematic diagram of the IoT system equipped with a light intensity sensor (SI1145 Digital UV/IR/Visible Light Sensor), digital temperature and humidity sensor (AM2315), and capacitive soil moisture sensor with an automated irrigation system is displayed in Figure 3.
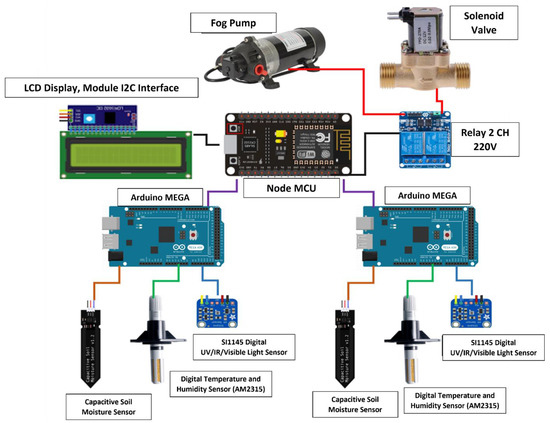
Figure 3.
Schematic diagram of IoT system equipped with Light Intensity Sensor (SI1145 Digital UV/IR/Visible Light Sensor), Digital Temperature and Humidity Sensor (AM2315), Capacitive Soil Moisture Sensor with automated irrigation system.
2.4. Plantation
The Niamhom plants are planted in plastic experimental pots (Xiamen Xiexinlong Trading Co., Ltd., Xiamen, China). The experiment was carried out from June 2019–December 2021 at Green House at Maejo University, Phrae campus, Mae Sai Subdistrict, Rong Kwang District, Phrae Province, Thailand. Following experimental conditions attained during the experiments (a) average temperature is 26.7 °C; max temp 33.4 °C; min temp 22.0 °C (b) average rainfall: 1173.4 mL/year and (c) soil mixture: 1 part rice husk + 1 part cow manure compost + 1 part soil. The area of the experimental plot(s) for the farming experiment is 4 × 6 m and consists of 2 main fields: 50 % shade and 70% shade, with the plantation covered with black shade plastic (12′ × 200′, Farm Plastic Supply, Chicago, IL, USA) to control the vaguely amount of surviving color. Each main plot consists of 3 sub-plots: (1) chemical fertilizer (Rabbit, Chia Tai Co., Ltd., Bangkok, Thailand) 46-0-0 (Urea) mixed with 15-15-15 (N:P:K) in a ratio of 1:1 where the amount of fertilizer is 15 g per plant/month, (2) fertilization with cow manure (local farmer nearby the Maejo University, Chiang Mai, Thailand) where the amount of fertilizer is 50 g per plant/month, and (3) bio-fermented water (Royal Project Foundation, Chiang Mai, Thailand) in a ratio of 20:10 (mL:L) where the amount of fertilizer is 300 mL per plant/month. The bio-fermented water is made from 80% fish waste and 20% molasses (as sugar source) mixture fermented together for 3 months. Each experimental series consisted of 3 groups of 15 plants. In the greenhouse system, automatic irrigation is controlled by IoT and holds the soil moisture and air humidity to 50–60%. Four-month-old plants were grown in a greenhouse at 50% shade for one month to adjust plant conditions before transplanting into the experimental plot in the greenhouse. The leaf samples were collected from 2-month-old plants after transplanting into greenhouses by collecting leaves 1 to 10 from the apex to carry out further experiments.
2.5. Plant Growth Monitoring
Niamhom plants’ experimental growth data were obtained using a controlled greenhouse system. The number of leaves was counted and the diameter of the stem was measured using a Vernier calliper around 3–5 cm above the ground. The plant’s height was measured from the bottom to the tip. Leaf area was measured using a leaf area meter (Cl-202 Laser Leaf Area Meter, CID) calculated by selecting representative leaves for the length of most of the plant leaves. The inclined point quadrat method was used to measure the leaf canopy diameter, which comprises penetrating a plant stand with a long thin needle (point quadrat) in a predetermined direction and zenith angle and counting the number of contacts of the point quadrat with vegetation in the canopy. The chlorophyll content of the leaves was measured using a chlorophyll meter (SPAD-502Plus from Konica Minolta). The light intensity was measured by a light intensity sensor (SI1145 Digital UV/IR/Visible Light Sensor). The yield of leaves was calculated by harvesting fresh leaves one month after planting and weighing them. After that, the Niamhom leaves were cut and dried in a hot air oven at 70 °C for 1 h, weighed, and the average dry weight was calculated. Plant morphological data were collected twice, 1 and 2 months after planting. After harvesting the crops for one month, the shoots were cut to stimulate more shoots and were then cultivated for one month.
2.6. Chemical Analysis
2.6.1. Sample Preparation and Extraction
Leaf samples were collected and rinsed with tap water to remove dirt from their leaves. They were then re-rinsed two more times with distilled water, allowing them to air-dry. Fifteen g of finely ground fresh leaves were extracted with organic solvents such as hexane, dichloromethane, and ethyl acetate at a ratio of 1:10 weight per volume (g/mL). The extract was shaken with a horizontal shaker at a speed of 120 rpm (Revolution/minute) for 24 h at room temperature (RT) and filtered. The leaf residue was extracted twice as much with the same organic solvent. The extracts were combined, and the organic solvent was evaporated with a rotary evaporator until the volume was about 3–5 mL. Then, the volume was adjusted to 10 mL with the extraction solvent. Each treatment was repeated three times.
2.6.2. Total Phenolic Content Analysis
The determination of total phenolic compounds (TPC) was performed by the Folin–Ciocalteu colorimetric method modified from Bhuyar et al. [21], where Gallic acid was used as standard. Ten g of fresh apex leaf samples were collected from 2-month-old plants after planting in the greenhouse and then extracted with methanol with a ratio of 1:10 by weight per volume. After extraction, the extract was subjected to a horizontal shaker at 120 rpm for 1 h, filtered, and the volume adjusted with methanol. Gallic acid standard solutions were prepared at 20–200 mg/mL. Of the standard or sample 0.2 mL was mixed with 1 mL of 10% Folin–Ciocalteu reagent, incubated for 5 min, and then 0.5 mL of 7.5% Na2CO3 was added for 30 min at room temperature. Absorbance was measured at 765 nm using a UV-Vis spectrophotometer (Genesys 10S, Thermo Fisher, Waltham, MA, USA). TPC content analysis was performed in triplicates. TPC was calculated using a gallic acid standard curve in milligrams, the gallic acid equivalent to one gram of extract weight (Gallic acid equivalents, mgGAE/1 g crude extract).
2.6.3. GCMS Analysis
The chemical constituents of the extracts were analyzed by GCMS using an HP-5MS ultra insert column i.d., 0.25 mm, length 30 m, film thickness 0.25 mm of (5%-phenyl)-methylpolysiloxane as stationary phase. The injection volume was 1 mL with pulsed splitless mode: injection pulse pressure 25 psi to 0.25 min and purge flow to split vent 100 mL/min at 0.5 min. The inlet temperature is set to 250 °C. Oven temperature programmed to initially 40 °C, hold for 3 min, up to 100 °C, rate 7.5 °C/min, up to 160 °C, rate 4 °C, then up to 280 °C, rate 10 °C, and hold for 20 min. Identification of the chemical constituents in the extracts was employed by comparing the spectrum with the standard spectrum in Wiley version 7 with a calculation of the Kovats Index (KI) value. For calculating the KI value, normal alkanes C8-C30 and C20-C40 were used, and the value was compared with the KI value in the Adams reference table. The amount of chemical constituent is calculated from the peak area and given as % relative peak area.
2.7. Statistical Analysis
The IBM® SPSS® Statistics Version 28 statistical analysis software (IBM, Armonk, NY, USA) was employed to present the experiment. Analysis of variance (ANOVA) of the data according to the experimental Split-piot in a randomized complete block design (RCBD) and mean comparison was performed by Duncan’s Multiple Range Test (DMRT).
3. Results
3.1. Growth Parameters, Yield and Quality of Niamhom Leaves
The results of experimental greenhouse plantation Niamhom cultivation under an irrigation control system and different fertilization treatments were studied. Various chemicals (Urea, N, P, and K), cow manure fertilizer, bio-fermented water (80% fish waste and 20% molasses mixture) and shading with 50 and 70% demonstrated that fertilizer and shading factors affect the yield of Niamhom leaves. The interactions between 50 and 70% shade factors and three fertilizers (chemical fertilizers, cow manure fertilizers, and bio-fermented water) were analyzed. The relative analysis of light intensity influences was studied by 50 and 70% shading using black plastic to control the light shade.
From the 1 month growth data after planting (Table 1), the light intensity factor at 50 and 70% shading did not affect the stem’s diameter or leaf canopy. The average stem diameter was 0.51 ± 0.1 cm, and the leaf canopy’s diameter was 21.57 ± 0.12 cm, respectively. However, shading of 50% affects chlorophyll content, yield, dry weight per plant, leaf area, plant height, and the number of leaves with a mean higher than 70% shading: 45.98 units of chlorophyll (SPAD-502Plus), yield 99.56 g, 31.43% dry weight, 34.06 cm2 leaf area, average plant height of 35.68 cm and leaves per plant of 92.50. Regarding fertilizer factors for Niamhom quality, it was found that chemical fertilizers, cow manure, and bio-fermented water did not affect height, stem, and canopy diameter. However, they were affected by chlorophyll content, yield, dry weight, leaf area, and the number of leaves per plant. The plants treated with chemical fertilizer showed the best growth values, followed by cow manure fertilizer and bio-fermented water, as shown in Table 1. It was found that there was no interaction between the size of the stem diameter and the canopy of the Niamhom, but there were interactions on chlorophyll value, yield, leaf area, dry weight, leaf number, and plant height. Mean chlorophyll content, yield, dry weight, and maximum leaf count were observed in 50% shading with chemical fertilizer application at 53.63 units SPAD-502Plus, 113 g yield, 37.70% dry weight, and 41.97 cm2 leaf area, respectively. The maximum average number of leaves is 98.84. Except for the average height of the plants, the shading of 50% with cow manure fertilizers showed the highest growth. However, there was no significant difference in shading 50% with all three fertilizers and shading 70% with chemical fertilizers.

Table 1.
Morphological characteristics of the Niamhom plant after one-month cultivation.
The morphological traits (or properties) of 2 months old plants growth results of the plants are shown in Table 2. It was found that the interaction between shading and fertilization found in the morphological growth of plants had no differences in stem and canopy diameter. The highest mean of each parameter was observed in plants grown under shading 50 x chemical fertilizers, for example the first month’s results. Table 2 displays plant morphological data such as leaf area, height, stem diameter, leaf number, and canopy diameter. Results showed that the factor of shading of 50% and 70% × combined with various types of fertilization affects the morphological properties of plants decreases when more extended cultivation periods. This study yielded exciting data regarding the cow manure fertilizer application giving the better yield and chemical fertilizer results. While the dry weight effect of the biofertilizer water application was as good as chemical fertilizer, both shaded 50% and 70%, which was no significant difference at the 95% confidence level. The height of the plant, the number of leaves, and the leaves in the second month after planting were significantly less than in the first month. This phenomenon might affect because the pruning was done after planting one month to stimulate branching. Therefore, the plant grows laterally, showing that the canopy size is more significant. However, it may be due to other environmental factors such as temperature, day-light exposure, or absorption of nutrients from plants. From the experimental cultivation of plants, 50% shading provides better physiological characteristics than 70% shading and chemical fertilization and gives good quality morphological results, followed by cow manure fertilizer.
Table 2.
Morphological characteristics of the Niamhom plant after two months of cultivation.
3.2. Total Phenolic Content (TPC)
The total phenolic content in Niamhom plants cultivated under several conditions was measured by Folin–Ciocalteu colorimetric technique [21,22]. The TPC was calculated by comparing the gallic acid standard curve with the linear equation y = 0.01 x − 0.1917 (R2 = 0.9983) and reported in milligram Gallic acid equivalents in one-gram crude extract (mg GAE/g crude extract), represented in Table 3. The interaction of the variables delivered to plants between the shading and three forms of fertilization was discovered after statistical analysis of the mean/SD. The Niamhom plants treated with a 50% shade factor along with fertilization using cow dung or bio-fermented water, or a 70% shading factor with chemical fertilizer application, received the highest levels of total phenolic components, averaging 1.64 mg GAE/g crude extract. The mean minimum phenolic concentration was 1.41 mg GAE/g crude extract, followed by 70% × shade with cow dung fertilization, 70% shading with a bio-fertilizer application, and 50% × shading with chemical fertilizer application. As demonstrated in Table 3, there was no impact on the phenolic compound concentration from the three different fertilizers or the one shading component.
Table 3.
Total phenolic content of Niamhom leaves.
The measurement of phenolic compounds using six samples in this experiment produced the desired findings. The number of total phenolic compounds was found to be maximum when planted in a 50% shaded area with two types of organic fertilizers, cow manure and bio-fermented water. The amount was 70% lower when produced in the dark-shaded region. The total phenolic content of Niamhom plants grown with chemical fertilizer and 50% shade is lower than that of cow manure and bio-fermented water. The methanol extracts from the Niamhom plants fed with chemical fertilizers were found to have higher levels of total phenolic compounds. The phenolic content was comparable to that of growing in 50% shade with organic fertilizer. Secondary metabolite synthesis under six different growth circumstances was further characterized for the quantitative difference. This was supported by the results of the chemical composition analysis data of the extracts using the GC-MS technique. The total phenolic compound content test result may therefore reflect the same set of chemicals or a different one.
3.3. Chemical Components in Niamhom Leaves
Using an organic solvent, such as hexane, dichloromethane (DCM), or ethyl acetate, Niamhom leaves were extracted, and GCMS was employed to test the samples. The results of the extracts’ identified chemicals are accordingly presented in the Supplementary file (Supplementary file: Tables S1–S3). Different chemical components were found in each extract depending on the type of organic solvent utilized. These organic chemicals, the primary components and groupings of volatile compounds that could be discovered in this plant, were revealed to be the chemical constituents found in the three extracts. Therefore, it can be concluded that the main chemical components of the Niamhom leaves are 2-propionyl-3,4,5,6-tetrahydropyridine, 2-propionyl-1,4,5,6-tetrahydropyridine, hexanoic acid, 3,5,5-trimethyl-, nonyl ester, n-hexadecanoic acid, phytol, 9,12,15-octadecatrienoic acid, (Z, Z, Z)-, and squalene. When considering other chemical constituents detected in all three extracts (Supplementary file) found that the following odor substances 2-hexenal, 2-acetyl-3,4,5,6-tetrahydropyridine, maltol, 2-acetyl-1,4,5,6-tetrahydropyridine, 2-propionyl-3,4,5,6-tetrahydropyridine, 2-propionyl-1,4,5,6-tetrahydropyridine, and hexanoic acid, 3,5,5-trimethyl-, nonyl ester, all odorous substances were detectable in DCM extracts, except for 2-hexenal being detected in hexane extracts.
The principal organic components and fragrant substances can be used to assess the quality of plants. This study aimed to discover these chemical constituents used to determine the Niamhom plant under different cultivation conditions, such as three fertilizers and light shading. The relative area percentage (%RA) of the compounds in the DCM extracts was considered and is summarized in Figure 4. Phytol, alpha-linoleic acid, and squalene could be detected in the range of 4.10–12.96%, 0.29–11.56%, and 4.14–25.42%, respectively. Phytol and squalene were found in DCM leaf extract from plants grown in conditions shading 50% × bio-fermented water.
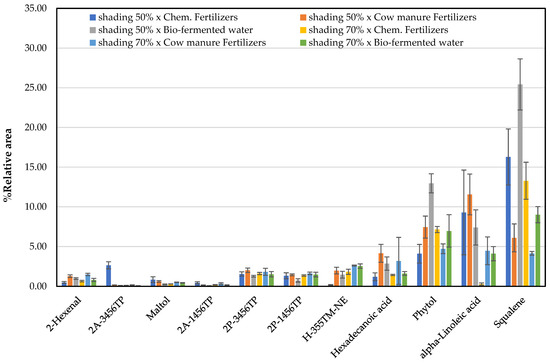
Figure 4.
Total fragrant substances found in Niamhom leaves extracted with DCM (except 2-Hexenal from Ethyl Acetate) [Note: 2-Acetyl-3,4,5,6-tetrahydropyridine: 2A-3456TP; 2-Acetyl-1,4,5,6-tetrahydropyridine: 2A-1456TP; 2-Propionyl-3,4,5,6-tetrahydropyridine: 2P-3456TP; 2-Propionyl-1,4,5,6-tetrahydropyridine: 2P-1456TP; Hexanoic acid, 3,5,5-trimethyl-, nonyl ester: H-355TM-NE; Alpha-Hexadecanoic acid: Hexadecanoic acid; 9,12-Octadecadienoic acid (Z,Z)-: alpha-Linoleic acid].
In comparison, alpha-linoleic acid was found in extracts from plants grown in conditions shading 50% × cow manure fertilizers. Considering the quality of Niamhom plants by the odor compounds level, it was found that plants grown under conditions shading 70% × cow manure fertilizers gave the highest amount of fragrance substances. Followed by conditions shading 50% × cow manure fertilizers and shading 50% × chemical fertilizers, respectively (Figure 5). Figure 5 shows that the plants produced better odorant under shading 50% and 70% exposures of cow manure fertilizers than the chemical fertilizers and bio-fermented water. In addition, it was found that the odor of the Niamhom plant of all cultivations came from the main fragrance substances as follows 2-hexenal, 2-propionyl-3,4,5,6-tetrahydropyridine, 2-propionyl-1,4,5,6-tetrahydropyridine, and hexanoic acid, 3,5,5-trimethyl-, nonyl ester, except the planting with shading 50% × chemical fertilizers were the main fragrance substances as 2-acetyl-3,4,5,6-tetrahydropyridine, 2-propionyl-3,4,5,6-tetrahydropyridine, 2-propionyl-1,4,5,6-tetrahydropyridine, and maltol.
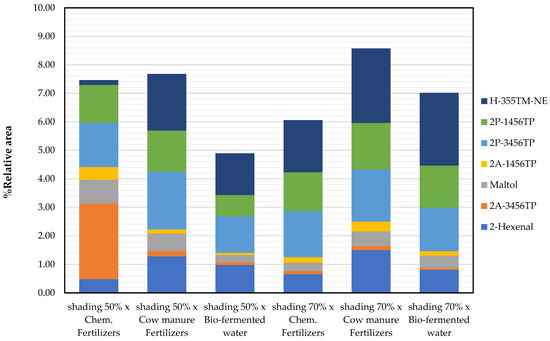
Figure 5.
Potential fragrant substances found in the Niamhom leaves extracted with DCM (except 2-Hexenal from Ethyl Acetate) [Note: 2-Acetyl-3,4,5,6-tetrahydropyridine: 2A-3456TP; 2-Acetyl-1,4,5,6-tetrahydropyridine: 2A-1456TP; 2-Propionyl-3,4,5,6-tetrahydropyridine: 2P-3456TP; 2-Propionyl-1,4,5,6-tetrahydropyridine: 2P-1456TP; Hexanoic acid, 3,5,5-trimethyl-, nonyl ester: H-355TM-NE; Alpha-Hexadecanoic acid: Hexadecanoic acid; 9,12-Octadecadienoic acid (Z,Z)-: alpha-Linoleic acid].
4. Discussion
Results suggested that cow manure fertilizer has the best outcomes among all the three fertilizers used in this investigation. In cow manure, fertilizer production was carried out by fermentation technology [23,24]. In this process, microorganisms help decompose various components into smaller particles, allowing plants to easily absorb those nutrients and use them in the synthesis process. Cow manure results revealed good morphological characteristics and yields than chemical fertilizers. Geng et al. [25] findings imply that a suitable quantity of organic replacements, such as cow manure delivers adequate nutrients, enhances the soil environment, and leads to higher production. Compared to chemical fertilizers, cow manure benefits soil nutrient balance, soil structure, and moisture-holding capacity [26]. This study demonstrates the effectiveness of employing IoT systems to control water management to assess air and soil moisture levels and let the irrigation system function properly. This leads to healthy plant growth and an acceptable yield. The study’s findings support assumptions and are consistent with the previously published reports [9,10]. Therefore, IoT technology is a tool that helps to regulate the environmental parameters that are the limiting factors to the survival of environmentally specialized plants such as the Niamhom.
Total phenolic compounds, also known as phytochemicals, and organic compounds, are both secondary metabolites produced by biosynthetic processes in plants, were analyzed using GCMS equipment [27]. The findings of this study imply that the cultivation environment influences the synthesis of these chemicals within plants. A plant’s ability to adapt to its environment at the time, including temperature, humidity, amount of light, soil quality, nutrients and minerals in the soil, etc., may result in the biosynthesis process in plants [28]. The results of this experiment demonstrate that light shading is not the only factor influencing the level of phenolic compounds or secondary metabolites plants to generate. The previous study supports the above statements, as light intensity significantly impacted phenolic levels [29].
Additionally, the kind of fertilizer used for cultivation has a positive impact. Manipulation of nitrogen fertilization levels may be an efficient technique for increasing polyphenolic compound expression [30]. The 50% shading with chemical fertilizers had fewer total phenolic chemicals than the other tests. This might be because, as evidenced by the GCMS data, the plants transformed the chemical to a different substance, their aromatic content varied from that of plants grown under other conditions, or the plants themselves may have been utilized in the growth process. The morphological data revealed that this particular group of plants had the highest dry weight, highest yield, and largest leaf area. Environmental factors influence the antioxidant content, EO output, and composition of medicinal and aromatic plants [31].
Additionally, 2-acetyl-3,4,5,6-tetrahydropyridine, 2-acetyl-1,4,5,6-tetrahydropyridine, 2-propionyl-3,4,5,6-tetrahydropyridine, and 2-propionyl-1,4,5,6-tetrahydropyridine can classify in tetrahydropyridines, and these have a similar structure of 2-acetyl-1-pyrroline or 2AP which is an aroma found in Jasmine rice and Pandan. This organic compound group of substances smells like freshly baked bread and popcorn. Maltol, also found in Niamhom plants, is an aromatic substance that smells like freshly baked bread. It also has a soft aroma, like caramel and cotton candy. This is one of the aroma substances that give the Niamhom leaves a fragrance that is softer and deeper than the smell of 2AP. The aromatic components of Niamhom were similar to volatile compounds found in Semnostachya menglaensis Tsui leaves, which are found in the southern Yunnan province, China, and Strobilanthes Crispus (L.) Bremek, which are all members of the Acanthaceae family though they are different species. The volatile chemical constituent in Semnostachya menglaensis Tsui [32], such as 1-(3,4,5,6-tetrahydro-2-pyridyl)-1-propanone, 1-(1,4,5,6-tetrahydro-2-pyridyl)-1-propanone, 1-(3,4,5,6-tetrahydro-2-pyridyl)-1-ethanone, 1-(1,4,5,6- tetrahydro-2-pyridyl)-1-ethanone, 1-(2-piperidyl)-1-propanone, 1-octen-3-ol, 1-octen-3-one, and 3-octanol and 1-(2-pyridyl)-1-propanone, of which classes of tetrahydropyridines, piperidines, and a few enones and fatty alcohols were detected. At the same time, the 2-hexen-1-ol 2-hexenal, 1-octen-3-ol linalool, and benzaldehyde were detected as the primary component of Strobilanthes crispus (L.) [33].
The chemical constituent of Niamhom (S. nivea Craib) has not been identified yet. However, another plant in the same genus, S. crispus (L.) Bremek has been reported to contain 0.44–2.95 mg/g dry weight of phenolic acids (such as caffeic acid, ferulic acid, gallic acid, chlorogenic acid, and trans-cinnamic acid), 0.33–1.95 mg/g dry weight of flavonoids (such as quercetin, rutin, catechin, apigenin, naringenin, and kaempferol) [34] as well as terpenes (β-amyrin, taraxerone and taraxerol) and stigmasterol [35]. Another Strobilanthes plant, S. cusia (Nees) Kuntze, was reported to have several chemicals in its extract, such as alkaloids (indirubin, indigo, indicant, 4(3H)-quinazolinone), glycosides (uridine, pinoresinol-4-O-β-D-apiosyl-(1→2)- β-D-glucopyranoside, isoacteoside), sterols (β-daucosterol, spinasterol-3-O-β-D-glucopyranoside), pentacyclic triterpenoids (lupenone, betulin), flavonoids (5,7,4′-trihydroxy-6-methoxyflavone, 3′,4′,5,7-quadrihydroxy-flavanonols), organic acids (4-hydroxy-3-methoxybenzoic acid, lauric acid), anthraquinones (chrysophano), and polysaccharide [36].
As several Strobilanthes plants have a pleasant aroma, they have been used in tea blending, perfume making and nutraceuticals [37,38,39]. GCMS technique is employed to identify the volatile compositions of the extracts from Strobilanthes plants. Several volatile compounds were detected in the methanolic extract of S. crispus, such as isopentyl alcohol, pyridine, 2-hexen-1-ol, 2-hexenal, 1-octen-3-ol, linalool, and benzaldehyde [40]. The GCMS analysis of the essential oil from S. callosus Nee contains trans-sabinene hydrate, cis-sabinene hydrate, terpinen-4–01(23%), and β-terpineol [37]. S. tonkinensis Lindau leaves extracts to have high contents of benzaldehyde, 1-octen-3-ol, isophorone, 2-methoxy-3-(2-methylpropyl)-pyrazine, linalool oxide (pyranoid), 1-dodecanol, -ionone, and trans-ionone [39].
In addition, in this study, volatile organic compounds (VOCs) were extracted with various solvents and measured by GCMS to obtain complete data on VOCs, including odor groups. As the results of this study showed (Supplementary file; Tables S1–S3), the major organic compounds in each extract differed. The findings were consistent with earlier research, indicating that the kind and number of VOCs detected by GCMS depend on the varied solvent extraction techniques [34,41], ratios, and volumes of various organic solvents [40], including the methodology utilized in co-extraction [34].
5. Conclusions
The GCMS technique can evaluate the Niamhom plants’ quality by identifying the type and amount of aromatic chemicals in their leaves. It was discovered that the amount of these aromatic compounds is influenced by fertilization and shade factor. IoT-based irrigation and cultivation are intriguing tools for regulating the quantity of moisture in the air, the soil, or the surrounding environment. This is advantageous to plant growth while still generating a high yield acceptable for both planting systems that employ chemical fertilizers and organic fertilizers in tandem. The results conclude that the specific aroma of the Niamhom leaves is due to the combination of these aromatic compounds. Environmental conditions such as the amount of light, water, and fertilizer affect the quality of the plant or the odorant. However, further experiments should be conducted to summarize the effects of fertilizer and light factors on plant odor synthesis processes. Future cultivation alterations can be targeted for producing Niamhom plants for various kinds of applications in flavor and the food industry. The proper attention is required to notice this plant for worldwide plantations and usage as a Thai herb.
Supplementary Materials
The following supporting information can be downloaded at: https://www.mdpi.com/article/10.3390/horticulturae8121130/s1, Table S1: Chemical constituent in Niamhom leaves extracted with Hexane; Table S2: Chemical constituent in Niamhom leaves extracted with dichloromethane; Table S3: Chemical constituent in Niamhom leaves extracted with ethyl acetate
Author Contributions
Conceptualization, C.S.; methodology, C.S.; software, C.S.; validation, C.S., A.J.; formal analysis, C.S.; investigation, C.S.; resources, C.S.; data curation, C.S.; writing—original draft preparation, C.S., A.J., J.S., K.C., Y.J., K.T. and P.B.; writing—review and editing, C.S., A.J., J.S., K.C., Y.J., K.T. and P.B.; visualization, C.S.; supervision, C.S.; project administration, C.S.; funding acquisition, C.S. All authors have read and agreed to the published version of the manuscript.
Funding
This research received no external funding.
Institutional Review Board Statement
Not applicable.
Informed Consent Statement
Not applicable.
Data Availability Statement
Not applicable.
Acknowledgments
This research was funded by the National Research Council of Thailand (NRCT). We acknowledge a specialist in botany and plant anatomy, Monton Norsangsri, for confirmation of the plant species Strobilanthes nivea Craib.
Conflicts of Interest
The authors declare no conflict of interest.
References
- Simitinan, T. Names of plants of Thailand; Forest Botanical Section Office of Forestry Academics, Royal Forest Department: Bangkok, Thailand, 2011. [Google Scholar]
- International Plant Name Index (IPNI). Acanthaceae Strobilanthes nivea Craib [Internet]. 2005. Available online: http://www.ipni.org/n/55838-1 (accessed on 28 July 2020).
- JSTOR. Volume Information Vol. 1901, No. 178/180 (October–December 1901). 2009, pp. 205–210. Available online: http://plants.jstor.org.stable/10.5555/al.ap.specimen.bm000906342 (accessed on 28 July 2020).
- Bhuyan, B.; Sonowal, R. AN OVERVIEW OF Pandanus amaryllifolius Roxb. ex Lindl. AND ITS POTENTIAL IMPACT ON HEALTH. Curr. Trends Pharm. Res. 2021, 8, 138–157. [Google Scholar]
- Sumarni, W.; Sudarmin, S.; Sumarti, S.S.; Kadarwati, S. Indigenous knowledge of Indonesian traditional medicines in science teaching and learning using a science–technology–engineering–mathematics (STEM) approach. Cult. Stud. Sci. Educ. 2022, 17, 467–510. [Google Scholar] [CrossRef]
- Somprasong, W.; Vjarodaya, S.; Chayamarit, K. Taxonomic Study of the Family Acanthaceae used as traditional medicinal plants for ethnic groups in North, Central and Northeastern Thailand. Thai Agric. Res. J. 2014, 32, 77–88. [Google Scholar]
- Verma, S.; Singh, S.P. Current and future status of herbal medicines. Vet. World 2008, 1, 347. [Google Scholar] [CrossRef]
- Gurevitch, J.; Padilla, D.K. Are invasive species a major cause of extinctions? Trends Ecol. Evol. 2004, 19, 470–474. [Google Scholar] [CrossRef]
- Quy, V.K.; Hau, N.V.; Anh, D.V.; Quy, N.M.; Ban, N.T.; Lanza, S.; Randazzo, G.; Muzirafuti, A. IoT-enabled smart agriculture: Architecture, applications, and challenges. Appl. Sci. 2022, 12, 3396. [Google Scholar] [CrossRef]
- Maraveas, C.; Bartzanas, T. Application of Internet of Things (IoT) for optimized greenhouse environments. AgriEngineering 2021, 3, 954–970. [Google Scholar] [CrossRef]
- Herawati, D.; Loisanjaya, M.O.; Kamal, R.H.; Adawiyah, D.R.; Andarwulan, N. Profile of Bioactive Compounds, Aromas, and Cup Quality of Excelsa Coffee (Coffea liberica var. dewevrei) Prepared from Diverse Postharvest Processes. Int. J. Food Sci. 2022, 2022. [Google Scholar] [CrossRef]
- Ahmed, S.; Brinkley, S.; Smith, E.; Sela, A.; Theisen, M.; Thibodeau, C.; Warne, T.; Anderson, E.; Van Dusen, N.; Giuliano, P.; et al. Climate Change and Coffee Quality: Systematic Review on the Effects of Environmental and Management Variation on Secondary Metabolites and Sensory Attributes of Coffea arabica and Coffea canephora. Front. Plant Sci. 2021, 12, 708013. [Google Scholar] [CrossRef] [PubMed]
- Ahmad, R.; Baharum, S.N.; Bunawan, H.; Lee, M.; Noor, N.M.; Rohani, E.R.; Ilias, N.; Zin, N.M. Volatile Profiling of Aromatic Traditional Medicinal Plant, Polygonum minus in Different Tissues and Its Biological Activities. Molecules 2014, 19, 19220–19242. [Google Scholar] [CrossRef] [PubMed]
- Macoris, M.S.; Janzantti, N.S.; Garruti, D.S.; Monteiro, M. Volatile compounds from organic and conventional passion fruit (Passiflora edulis F. Flavicarpa) pulp. Food Sci. Technol. (Camp.) 2011, 31, 430–435. [Google Scholar] [CrossRef]
- Angeloni, S.; Mustafa, A.M.; Abouelenein, D.; Alessandroni, L.; Acquaticci, L.; Nzekoue, F.K.; Petrelli, R.; Sagratini, G.; Vittori, S.; Torregiani, E.; et al. Characterization of the Aroma Profile and Main Key Odorants of Espresso Coffee. Molecules 2021, 26, 3856. [Google Scholar] [CrossRef] [PubMed]
- Mostafa, S.; Wang, Y.; Zeng, W.; Jin, B. Floral scents and fruit aromas: Functions, compositions, biosynthesis, and regulation. Front. Plant Sci. 2022, 13, 860157. [Google Scholar] [CrossRef] [PubMed]
- Lo, M.-M.; Benfodda, Z.; Benimelis, D.; Fontaine, J.X.; Molinie, R.; Meffre, P. Etraction and identification of volatile organic compounds emitted by fragrant flowers of three Tillandsia species by HS- SPME/GC-MS. Metabolites 2021, 11, 594. [Google Scholar] [CrossRef] [PubMed]
- Seninde, D.R.; Chambers, E., IV. Coffee Flavor: A Review. Beverages 2020, 6, 44. [Google Scholar] [CrossRef]
- Yeretzian, C.; Opitz, S.; Smrke, S.; Wellinger, M. Coffee volatile and aroma compounds-from the green bean to the cup. In Production, Quality and Chemistry; Farah, A., Ed.; The Royal Society of Chemistry: London, UK, 2019; pp. 726–770. [Google Scholar] [CrossRef]
- Craib, W.G. A New Cover-Crop. (Dolichos Hosei). In Bulletin of Miscellaneous Information (Royal Botanic Gardens, Kew); Springer: Berlin/Heidelberg, Germany, 1914; pp. 76–77. [Google Scholar]
- Bhuyar, P.; Rahim, M.H.; Sundararaju, S.; Maniam, G.P.; Govindan, N. Antioxidant and antibacterial activity of red seaweed Kappaphycus alvarezii against pathogenic bacteria. Glob. J. Environ. Sci. Manag. 2020, 6, 47–58. [Google Scholar]
- Bhuyar, P.; Rahim, M.H.A.; Maniam, G.P.; Ramaraj, R.; Govindan, N. Exploration of bioactive compounds and antibacterial activity of marine blue-green microalgae (Oscillatoria sp.) isolated from coastal region of west Malaysia. SN Appl. Sci. 2020, 2, 1906. [Google Scholar] [CrossRef]
- Zheng, Y.H.; Wei, J.G.; Li, J.; Feng, S.F.; Li, Z.F.; Jiang, G.M.; Lucas, M.; Wu, G.L.; Ning, T.Y. Anaerobic fermentation technology increases biomass energy use efficiency in crop residue utilization and biogas production. Renew. Sustain. Energy Rev. 2012, 16, 4588–4596. [Google Scholar] [CrossRef]
- Souvannasouk, V.; Shen, M.Y.; Trejo, M.; Bhuyar, P. Biogas production from Napier grass and cattle slurry using a green energy technology. Int. J. Innov. Res. Sci. Stud. 2021, 4, 174–180. [Google Scholar] [CrossRef]
- Geng, Y.; Cao, G.; Wang, L.; Wang, S. Effects of equal chemical fertilizer substitutions with organic manure on yield, dry matter, and nitrogen uptake of spring maize and soil nitrogen distribution. PLoS ONE 2019, 14, e0219512. [Google Scholar] [CrossRef]
- Reganold, J.P.; Palmer, A.S. Significance of gravimetric versus volumetric measurements of soil quality under biodynamic, conventional, and continuous grass management. J. Soil Water Conserv. 1995, 50, 298–305. [Google Scholar]
- Braglia, R.; Costa, P.; Di Marco, G.; D′Agostino, A.; Redi, E.L.; Scuderi, F.; Gismondi, A.; Canini, A. Phytochemicals and quality level of food plants grown in an aquaponics system. J. Sci. Food Agric. 2022, 102, 844–850. [Google Scholar] [CrossRef]
- Yang, L.; Wen, K.S.; Ruan, X.; Zhao, Y.X.; Wei, F.; Wang, Q. Response of plant secondary metabolites to environmental factors. Molecules 2018, 23, 762. [Google Scholar] [CrossRef] [PubMed]
- Waterman, P.G.; Ross, J.A.; Mckey, D.B. Factors affecting levels of some phenolic compounds, digestibility, and nitrogen content of the mature leaves of Barteria fistulosa (Passifloraceae). J. Chem. Ecol. 1984, 10, 387–401. [Google Scholar] [CrossRef] [PubMed]
- Nguyen, P.M.; Niemeyer, E.D. Effects of nitrogen fertilization on the phenolic composition and antioxidant properties of basil (Ocimum basilicum L.). J. Agric. Food Chem. 2008, 56, 8685–8691. [Google Scholar] [CrossRef]
- Chrysargyris, A.; Mikallou, M.; Petropoulos, S.; Tzortzakis, N. Profiling of essential oils components and polyphenols for their antioxidant activity of medicinal and aromatic plants grown in different environmental conditions. Agronomy 2020, 10, 727. [Google Scholar] [CrossRef]
- Naef, R.; Velluz, A.; Mayenzet, F.; Starkenmann, C.; Sun, H.-D. Volatile constituents of Semnostachya menglaensis Tsui. J. Agric. Food Chem. 2005, 53, 9161–9164. [Google Scholar] [CrossRef]
- Chua, L.Y.W.; Chua, B.L.; Figiel, A.; Chong, C.H.; Wojdylo, A.; Szumny, A.; Choong, T.S.Y. Antioxidant activity, and volatile and phytosterol contents of Strobilanthes crispus Dehydrated using conventional and vacuum microwave drying methods. Molecules 2019, 24, 1397. [Google Scholar] [CrossRef]
- Guzowska, M.; Wasiak, W.; Wawrzyniak, R. Comparison of extraction techniques for the determination of volatile organic compounds in liverwort samples. Molecules 2022, 27, 2911. [Google Scholar] [CrossRef]
- Koay, Y.C.; Wong, K.C.; Osman, H.; Eldeen, I.; Asmawi, M.Z. Chemical constituents and biological activities of Strobilanthes crispus L. Rec. Nat. Prod. 2013, 7, 59–64. [Google Scholar]
- Qin, M.Z. The Chemical Components and Pharmacological Functions of Strobilanthes Cusia (Nees) Kuntze. Herb. Med. 2020, 6, 2472-0151. [Google Scholar]
- Weyerstahl, P.; Marschall, H.; Manteuffel, E.; Huneck, S. Volatile constituents of Agastache rugosa. J. Essent. Oil Res. 1992, 4, 585–587. [Google Scholar] [CrossRef]
- Lim, V.; Yap, C.S.; Chong, H.W.; Shukkoor, M.S.A.; Priya, M. Antimicrobial evaluation and GC-MS analysis of Strobilanthes crispus ethanolic leaf extract. Methodology 2013, 10, 1–8. [Google Scholar] [CrossRef]
- Hua, J.; Li, J.; Ouyang, W.; Wang, J.; Yuan, H.; Jiang, Y. Effect of Strobilanthes tonkinensis Lindau Addition on Black Tea Flavor Quality and Volatile Metabolite Content. Foods 2022, 11, 1678. [Google Scholar] [CrossRef] [PubMed]
- Anitas, O.; Goncu, S. Comparison of different extraction solvents used in GC-MS analysis for detecting volatile odor compounds in heat cow sweat. Turk. J. Veerinary Anim. Sci. 2021, 45, 411–418. [Google Scholar] [CrossRef]
- Osman, R.; Saim, N. Selective extraction of organic contaminants from soil using pressurized liquid extraction. J. Chem. 2013, 2013, 357252. [Google Scholar] [CrossRef]
Publisher’s Note: MDPI stays neutral with regard to jurisdictional claims in published maps and institutional affiliations. |
© 2022 by the authors. Licensee MDPI, Basel, Switzerland. This article is an open access article distributed under the terms and conditions of the Creative Commons Attribution (CC BY) license (https://creativecommons.org/licenses/by/4.0/).