Article

Assessing Physicochemical Parameters, Bioactive Profile and Antioxidant Status of Different Fruit Parts of Greek Eggplant Germplasm

by
Kalliopi I. Kadoglidou
*,
Konstantinos Krommydas
,
Parthenopi Ralli
,
Ifigeneia Mellidou
,
Apostolos Kalyvas
and
Maria Irakli
Institute of Plant Breeding and Genetic Resources, Hellenic Agricultural Organization-Dimitra (ELGO-Dimitra), Thermi, GR-57001 Thessaloniki, Greece
*
Author to whom correspondence should be addressed.
Horticulturae 2022, 8(12), 1113; https://doi.org/10.3390/horticulturae8121113
Submission received: 27 October 2022 / Revised: 13 November 2022 / Accepted: 22 November 2022 / Published: 26 November 2022

Abstract

:
Eggplant is an economically important vegetable with a potential for functional food production, mainly due to its high fruit antioxidant capacity. The goal of the present study was to investigate the main physicochemical and antioxidant parameters, and assess the bioactive profiles, of 19 eggplant genotypes of diverse origin, including Greek commercial varieties and hybrids, landraces and the related species S. macrocarpon. For that reason, the physicochemical traits (dry matter, pH, total soluble solids and total acidity) were assessed in the eggplant fruit and some important bioactive compounds (total phenols (TPC), total flavonoids (TFC), total monomeric anthocyanin (TAC), chlorogenic acid (CA) and its isomers neo- and crypto-CA) were assessed both in fruit pulp and peel. In addition, the antioxidant capacity was assessed according to ABTS•+, DPPH and FRAP assays. The results revealed significant differences between the studied genotypes for all the evaluated traits, for both fruit parts. Solanum macrocarpon showed a distinct bioactive profile and was superior for most of the pulp traits (TFC, neo-CA, crypto-CA, ABTS•+, DPPH and FRAP). Among the eggplant materials, the landrace ‘KD054/07’ had very high values for pH and some pulp traits (TPC, CA, ABTS•+ and FRAP), while the commercial F1 hybrid ‘Nilo’ was superior for dry matter and most of the peel traits (TPC, TFC, ABTS•+ and FRAP). The Greek commercial variety ‘Langada’ performed well for TAC and peel CA, ABTS•+ and FRAP, while ‘Tsakoniki’ had very high anthocyanin and pulp TPC content. These results constitute a source of information for a subset of the Greek eggplant germplasm and could contribute both to the promotion of Greek varieties of high bioactive and antioxidant value, as well as to the targeted selection of parents in breeding programs.

1. Introduction

Eggplant or aubergine (Solanum melongena L.) is the third most widely grown solanaceaeous vegetable after potato and tomato, with commercial and economic importance. It is cultivated mainly in the tropical and the subtropical zones, either in open field or greenhouse conditions [1,2,3,4]. Recent statistics from the Food and Agriculture Organization (FAO) show that the world production of eggplant cultivation in 2020 rose to 56.6 million tons derived from about 1.88 million ha of cultivated area [5].
The eggplant fruit has well-known nutritional value, with sufficient amount of carbohydrates, proteins and minerals such as copper, zinc, iron and vitamins [6,7]. In addition, eggplant contains a considerably high concentration of health-promoting bioactive compounds, such as phenolic acids [8,9], whereas almost 90% of these constituents are chlorogenic acids (CAs) [10]. The contained polyphenols act as nutraceuticals that prevent cancer, cardiovascular diseases, respiratory infections and protect the brain’s memory function [4,11,12,13,14,15].
Another important phenolic group that can be found in the peel (epicarp) of the purple eggplant fruit are anthocyanins [11], which are mainly the glycosides of delphinidin [12,13]. The main delphinidin derivative reported in eggplant’s peel is nasunin, which consists of cis- and trans- isomers of delphinidin [14]. This compound was found to suppress angiogenesis, a process involved in atherosclerosis as well as tumor growth and metastasis [15], whereas it is a potent superoxide anion radical scavenger, inhibits hydroxyl radicals generation by chelating ferrous ion and has protective activity against lipid peroxidation [16].
A thorough literature review revealed that there is a considerable genetic variation in the eggplant genetic pool concerning the fruit nutritional value and bioactive properties. That was particularly true for total phenolic content (TPC), CA content, DPPH scavenging activity, polyphenol oxidase activity, antioxidant activity, flavonoid levels, ascorbic acid and soluble solids contents [17,18,19,20,21]. According to previous research studies, the existence of sufficient genetic variation within the eggplant germplasm justifies the breeding efforts to enhance fruit functional and apparent quality [20,22].
In order to develop new eggplant varieties with higher nutritional value, a broader genetic pool is required to increase the chances of identifying and utilizing superior genotypes in future relevant breeding programs. Eggplant local landraces represent a valuable source of genetic variation, as they could broaden the genetic basis of nutritional and functional quality related traits, whereas F1 hybrids seem to share a rather narrow genetic pool [23]. Other wild and cultivated relatives of eggplant can also contribute with significant genetic variation. For example, the wild species S. incanum was used for the mapping of genes involved in CA and polyphenol oxidase biosynthesis and contributed with alleles for breeding eggplants with high fruit TPC content [24,25]. Moreover, the domesticated S. macrocarpon (Gboma eggplant) and its wild ancestor S. dasyphyllum are crossable with eggplant and have a great potential for breeding for high levels of TPC, CA and other bioactive compounds [10,26]. Moreover, bioactive metabolite and antioxidant contents of eggplant are varied in different fruit’s anatomic tissues, e.g., pulp and peel [27,28].
Considering the above, we conducted the present study to assess the physicochemical properties, bioactive compounds and antioxidant activity of the pulp and peel of eggplant fruits from 19 different genotypes in order to identify superior genotypes to be used per se in eggplant cultivation or as parents in breeding programs. It is conceivable that the screening of locally or internationally available eggplant germplasms and the subsequent identification of genotypes with high nutrient content would equally be beneficial for: (1) the eggplant breeders who intend to develop new cultivars with improved nutrient properties and quality, (2) the eggplant growers who aim to raise prices by growing health-promoting products and (3) the consumers who demand healthier agricultural products.

2. Materials and Methods
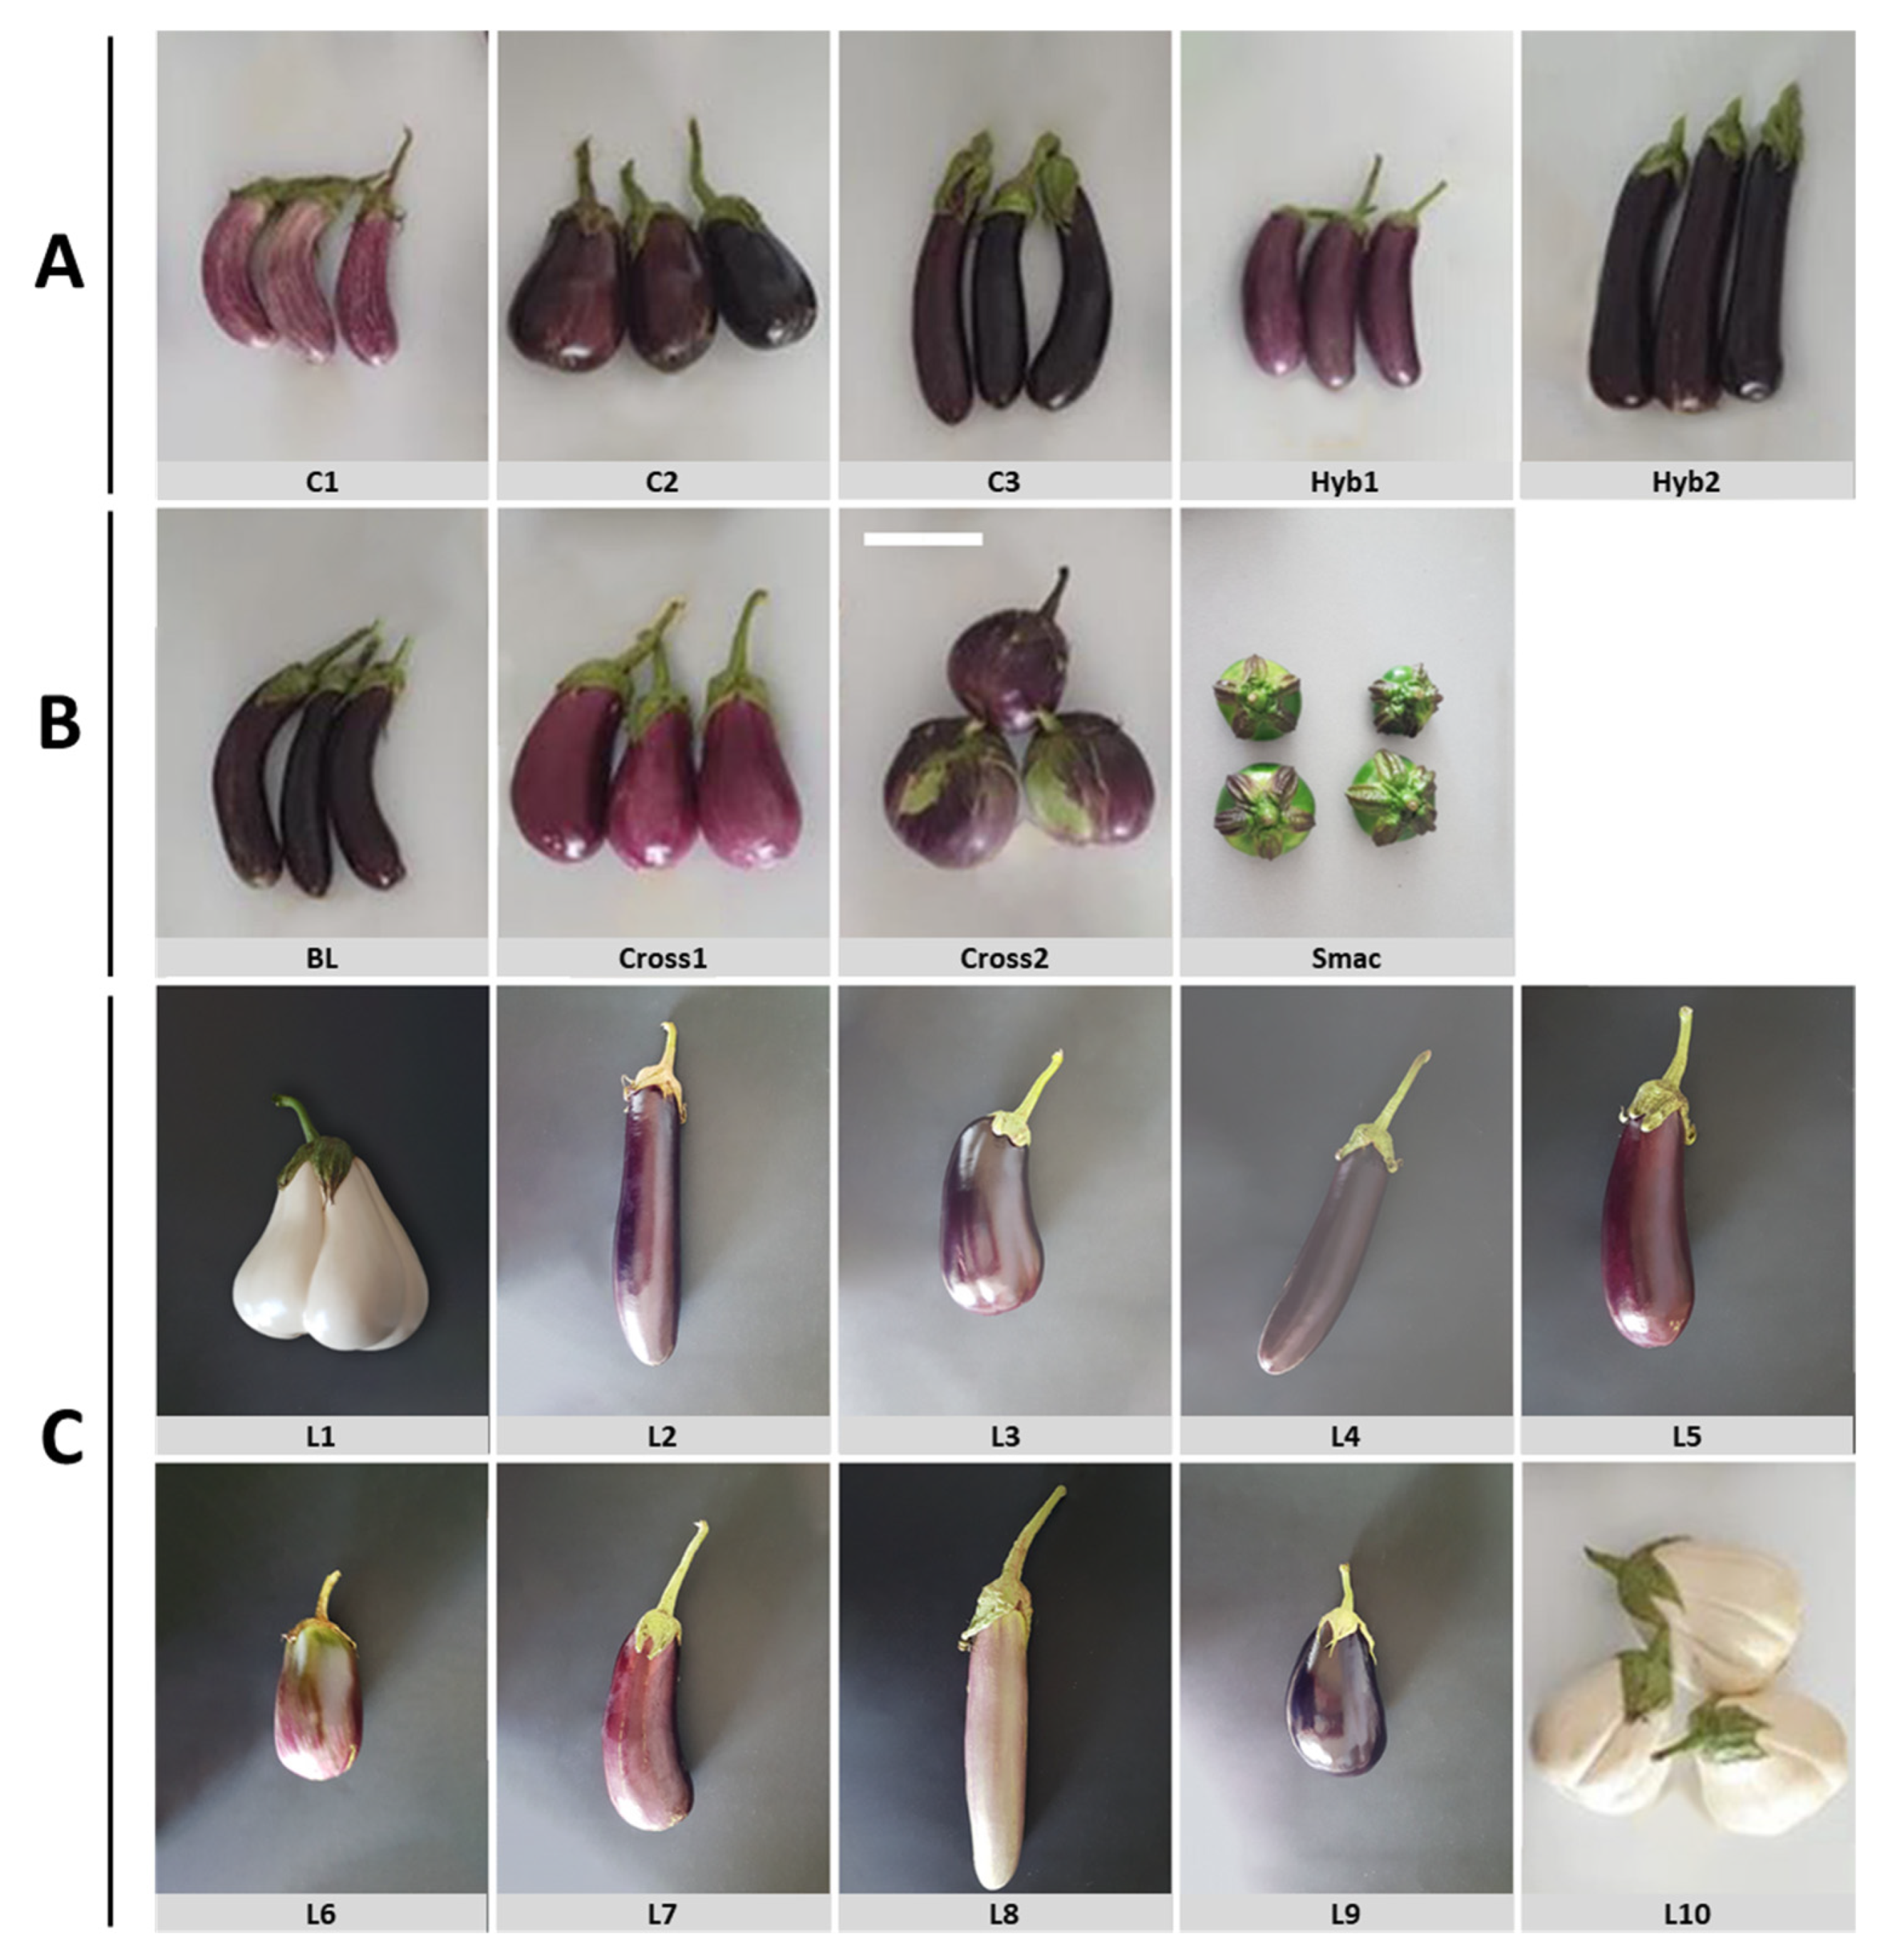
2.1. Plant Material

The plant material used in this study is a subset of the eggplant germplasm collection of the Greek Gene Bank (G.G.B.) of the Institute of Plant Breeding and Genetic Resources (I.P.G.R.B.) of the Hellenic Agricultural Organization (ELGO)—Dimitra. A total of 19 eggplant genotypes were used, for which the relevant data are presented in Table A1, in the Appendix. The studied material consisted of ten Greek landraces (L), three Greek commercial varieties (C) developed from landraces through classical breeding, two commercial F1 hybrids (Hyb), a breeding line (BL), two experimental F1 hybrids (Cross) derived from the hybridization some of the aforementioned Greek genotypes, and the closely related cultivated species S. macrocarpon L (Smac). The majority of the selected materials for this study are representative of eggplant diversity in Greece, with different geographical distribution and fruit morphology (Figure A1).

2.2. Field Experimentation

For each accession, seeds were sown in individual 10 cm diameter pots filled with peat and perlite as rooting media and grown in early May 2021 under greenhouse conditions at IPBGR, Thermi-Thessaloniki (40°32′08.7″ N, 23°00′06.4″ E). Thirty individual plants at the stage of 5–7 leaves of each genotype were later transplanted to an open field of IPBGR in June 2021. A randomized complete block design (RCBD) was used with 10 plants for each of the three replicates. Each block occupied approximately an area of 125 m2, and the plant spacing was 0.5 m on the row and 1.2 m between rows. The plants were drip-irrigated and the field was hand-weeded when necessary. The first and the tenth plant of each genotype in each block were guard plants. Each plant was supplied twice with 1 g of water-soluble NPK 20-20-20 fertilizer through the irrigation system. The fertilizer was applied two and four weeks after transplanting. All the other cultural practices were in accordance with a low-input sustainable horticulture.

2.3. Sample Preparation

About one to three representative fruits per plant were collected at commercial maturity from the 10 plants per replicate and then were bulked and were considered as one replication (i.e., three replications per genotype). Fruits were washed with tap water, cut across two longitudinal sections (about 2 cm wide) and the peels were separated manually from the pulp with a sharp knife. Both parts were chopped into small pieces (pulp in cubes of about 1–3.3 cm3 and peels of about 1–4 cm2). Subsequently, both pulp and peel samples were freeze-dried for 72 h with a lyophilizer (Freeze-dryer Alpha 1–2 LD plus, Christ, Osterode, Germany) to obtain dried samples, and then grounded in a laboratory mill (ZM 1000, Retsch GmbH, Haan, Germany) to pass a 0.50 mm sieve and stored in −20 °C until analysis. Powdered tissue samples were used to determine the bioactive compounds and the antioxidant activity, whereas non-lyophilized fresh tissue was used for the determination of the physicochemical parameters.

2.4. Evaluated Parameters

2.4.1. Physicochemical Parameters

Dry matter (DM), expressed as g/100 g of fresh weight (FW), was assessed after oven drying of one fraction of fresh random pulp samples at 72 °C for 48 h [29]. The other fraction of fresh pulp samples for each genotype were homogenized with a household blender and then were vacuum-filtered through a Whatman No. 2 filter (Whatman International Ltd., Maidstone, UK), according to the specifications Kadoglidou et al. [30] with some modifications. Then, the extracts were used for the determination of pH, total soluble solids (TSS) and titratable acidity, as described below. Specifically, pulp pH was measured with a portable pH meter (MW802, Milwaukee Instruments Inc., Rocky Mount, NC, USA), whereas the content of TSS was determined using a digital handheld refractometer (DR201-95 Krüss Optronic, Hamburg, Germany) and expressed in degrees Brix [31]. Titratable acidity (expressed as g citric acid/100 g of FW) was assessed on the same eggplant filtrate pulp through titration with 0.1N NaOH up to 8.1 pH, using 1% phenolphthalein as an indicator, according to the specifications of Sadler and Murphy [32]. Each sample was triplicated.

2.4.2. Sample Extraction

The sample extraction was carried out for pulp and peel separately. A quantity of 200 mg of freeze-dried powdered eggplant sample was transferred to glass vials containing 5 mL of aqueous methanol (methanol/H2O, 80:20, v/v) and the phenolic compounds were extracted, according to the protocol of Ntinas et al. [33] with some modifications. The suspension was vortexed for 1 min and then it was incubated in an ultrasound bath (frequency 37 kHz, model FB15051, Thermo Fisher Scientific Inc. Loughborough, England) for 20 min. Afterwards, the crude extract was centrifuged at 4000× g for 10 min (Universal 320R, Hettich, Germany), the supernatant was collected, and the residue was re-extracted with 5 mL aqueous methanol and centrifuged as described above. Each extraction was triplicated. The obtained extractions were used for all the analysis described below.

2.4.3. Bioactive Compounds Determination

Total Phenolics Content (TPC)

The analyses of TPC were performed using the Folin–Ciocalteu’s method according to the specifications of Singleton et al. [34] with some modifications. Briefly, 0.2 mL of sample extract was transferred into a test tube and mixed with 0.8 mL of the Folin–Ciocalteu reagent. Methanol/water mixture (70:30, v/v) was used as blank. After incubation for 2 min, 2 mL of sodium carbonate (7.5% w/v) solution was added to the reaction mixture and the volume was adjusted to 10 mL with the addition of distilled water. The mixture was allowed to stand for 60 min in a dark place and then the absorbance at 725 nm was recorded using gallic acid (GA) as the standard [35]. Values were determined from a calibration curve obtained with GA solutions at concentrations ranging from 25 to 500 μg/mL, following the same procedure as described above. The analyses were performed in triplicate, and results were expressed as mg of GA equivalents (GAE) per g of sample on a dry weight basis (mg GAE/g dw).

Total Flavonoids Content (TFC)

The TFC of the sample extracts, obtained as described above, were evaluated by the AlCl3 reagent method of Bao et al. [36] with slight modifications. Aliquot of 0.3 mL of extract was pipetted into a test tube containing 2 mL double distilled H2O and mixed with 0.225 mL 5% NaNO2. After 5 min, 0.225 mL 10% AlCl3 · 6H2O solution was added, the mixture was allowed to stand for another 5 min, and then 0.750 mL 2 M NaOH was added. The reaction solution was well mixed, kept for 15 min in the dark, and the absorbance was determined to be at 510 nm using catechin (CAT) as a standard. Methanol was used as a blank sample. Values were determined from a calibration curve obtained with CAT solutions at concentrations from 5 to 200 μg/mL, following the same procedure as described above. The analyses were performed in triplicate and the results were expressed as mg CAT equivalents (CATE) per g of sample on a dry weight basis (mg CATE/g dw).

Total Monomeric Anthocyanins Content (TAC)

A quantity of 500 mg of freeze-dried powdered eggplant sample were extracted, as previously described, with 10 mL of methanol solvent (methanol/HCI 1N, 85:15, v/v). Aliquots of 3 mL extract were mixed thoroughly with 1 mL of 0.025 M potassium chloride buffer pH 1.0, and the absorbance of the mixture was measured at 520 and 700 nm after 30 min. Extracts were combined similarly with 0.4 M sodium acetate buffer pH 4.5, and the absorbance was measured at the same wavelengths. Distilled water was used as a blank sample. Total monomeric anthocyanin content (TAC) in the extracts was calculated based on the spectrophotometric pH differential method according to the specifications of Lee et al. [37]. It was expressed as cyanidin-3-glucoside equivalents (C3GE) according to the following formula: anthocyanin pigment (C3GE, mg/L) = A × MW × DF × 103/(ε × l), where absorption (A) = (A520nm−A700nm) at pH 1.0 and (A520nm−A700nm) at pH 4.5, MW (molecular weight) = 449.2 g/mol for C3G, DF = dilution factor, ε = 26.900 molar extinction coefficient in L × mol−1 × cm−1 for C3G, l = pathlength in cm and 103 = factor for conversion from g to mg. Finally, TAC results were expressed as mg C3GE per g of sample on a dw basis (mg C3GE/g dw).

Chlorogenic Acids (CAs)

The phenolic extracts obtained from the pulp and the peel of each eggplant genotype were used to determine the chlorogenic acid and its isomers by using an Agilent Technologies HPLC (1200 series, Urdorf, Switzerland) system equipped with a Nucleosil 100 C18 column (250 mm × 4.6 mm, i.d. 5 μm), thermostated at 30 °C, according to the protocol previously described by Skendi et al. [38] with some modifications. The phenolic extract samples were filtered through PTFE syringe filters with 0.22 μm pore size and were injected at the 20 μL loop. The mobile phase consisted of 1% (v/v) aqueous acetic acid (A), methanol (B) and acetonitrile (C); its initial composition was 90% A and 10% B, and its flow rate was 1.3 mL/min. Adopting a linear gradient program, the composition changed to 80% A, 16% B and 4% C within 10 min; to 75% A, 20% B and 5% C within 25 min; 65% A, 5% B and 30% C within 30 min and finally 100% B within 45 min. The elution of compounds was monitored at 320 nm. System control, data acquisition and data processing were performed used the Agilent Chemstation software (version B.04.01, Agilent Technologies).
The detected CA (3-O-caffeoylquinic acid), its isomers crypto-CA (4-O-caffeoylquinic acid) (c-CA) and neo-CA (5-O-caffeoylquinic acid) (n-CA) were identified in phenolic extracts by comparison of their retention times with those of the pure standards, and quantification was performed using the corresponding calibration curves. The results were expressed as mg per g of sample on a dw basis.

2.4.4. Antioxidant Activity Determination

The antioxidant capacity was determined according to ABTS and DPPH radical scavenging assays and ferric reducing antioxidant power assays (FRAP) in order to evaluate the antioxidant activity of thw eggplant samples [39].

2,2′-Azinobis-(3-ethylbenzothiazoline-6-sulfonate) (ABTS) Radical Scavenging Activity

The radical scavenging activity of pulp and peel eggplant extracts against ABTS radical cation was evaluated according to the protocol of Re et al. [40], with appropriate adjustments. Briefly, ABTS●+ solution was obtained by reacting 2 mmol/L ABTS stock solution with 0.73 mmol/L potassium persulfate, and the mixture was left to stand in the dark at room temperature for 12–16 h before use. The ABTS●+ solution was diluted with water to an absorbance of 0.70 ± 0.02 at 734 nm. After the addition of 100 μL of sample extract to 3.9 mL of diluted ABTS●+ solution, the absorbance was measured against a blank (methanol) at 734 nm after 4 min. Inhibition of ABTS radical cation (%) was calculated by using the following equation: Inhibition (%) = [(A0 − As)/A0] × 100, where A0 is the absorbance of the blank sample and As is the absorbance of the sample at 4 min. The results were expressed as mg Trolox equivalents (TE) per g of sample (mg TE/g dw). Values were determined from a calibration curve obtained with Trolox solutions at concentrations ranging from 50 to 800 mM, following the same procedure as described above.

2,2-Diphenylpicrylhydrazyl (DPPH) Radical Scavenging Activity

Aliquots of aqueous methanol extract of the sample were mixed with DPPH solution and absorbance was read at 516 nm, as described in the method of Yen and Chen [41] but with some modifications. Briefly, 150 μL extract was reacted with 2.85 mL of 0.1 mM methanolic solution of DPPH. After 5 min, the absorbance at 516 nm was recorded, whereas methanol was used as the blank. The percentage of scavenging effect was calculated by using the following equation: DPPH radical scavenging capacity (%) = (A0 − As)/A0 × 100, where A0 and As are the absorbances of the blank and the sample, respectively. Results were expressed as mg Trolox equivalents (TE) per g of dried sample (mg TE/g dw). Values were determined from a calibration curve obtained with Trolox solutions at concentrations ranging from 50 to 800 mM, following the same procedure as described above.

Ferric Reducing Antioxidant Power (FRAP) Assay

The FRAP assay was carried out according to the methods Benzie and Strain [42] with slight modifications. Briefly, the fresh FRAP reagent consisted of 20 mM ferric chloride solution, 10 mM TPTZ (2,4,6-tripyridyl-s-triazine) solution in 40 mM HCl and 0.3 mM acetate buffer pH 3.6 in a proportion of 1:1:10, respectively. Aliquots of 100 μL of sample extract reacted with 3 mL of the FRAP reagent at 37 °C for 4 min under dark conditions, and the absorbance was recorded at 593 nm against blank (methanol). Results were expressed as mg Trolox equivalents (TE) per g of dried sample (mg TE/g dw). Values were determined from a calibration curve obtained with Trolox solutions at concentrations ranging from 50 to 800 mM, following the same procedure as described above.

2.5. Statistical Analysis

Analysis of variance (ANOVA) was carried out using the computer software MSTAT-C version 1.41 (Michigan State University, East Lansing, MI, USA). Data of DM, pH, TSS, TA and ΤAC were subjected to an ANOVA using the experiment model of one factor (eggplant genotype) in a randomized complete block design (RCBD). Conversely, data of the rest of the parameters were objected to an ANOVA of two-factor RCBD, with eggplant genotypes being factor A and fruit part being factor B. Tukey’s multiple comparison procedures were used to detect and separate mean treatment differences at p < 0.05. Pearson’s correlation coefficient was used for the determination of the relationships between the variables by using SPSS Statistics 21.0 software (SPSS Inc., Chicago, IL, USA). Principal component analysis (PCA) and agglomerative hierarchical clustering (AHC, heatmap) were generated using the web tool ClustVis [43]. The construction of two-dimensional (2D) plots was based on the first two principal components (PCs). The AHC analysis was performed, using Euclidean distance and Ward’s method for agglomeration to systematically analyze the combined evaluated traits per eggplant genotype.

3. Results and Discussion

3.1. Physicochemical Parameters

The analysis of variance (ANOVA) of the data obtained for the physicochemical traits (DM, pH, TSS and TA) showed a significant effect of the eggplant genotype (Table A2). Our study confirms that eggplant fruits contain a high percentage of water, with values above 90%. Specifically, comparing the various genotypes, the C2 clearly had the highest DM with a value of 9.4 g/100 g, although it did not differ from the corresponding values of L6, Cross1, Hyb2, L5 and L1 (Table 1). On the contrary, BL and L10 genotypes had the lower DM of 3.43 and 4.19 g/100 g, respectively. Generally, the average DM was 6.99 g/100 g, which falls within the range 6.5–9.0 g/100 g reported by other researchers [29,44].
The pH values showed a small range of variation (coefficient of variation CV = 0.36%, Table A2), even though significant differences among genotypes were detected (Table 1). Specifically, pH fluctuated at a narrow range of nearly 4.99 in Hyb2 to 5.57 in L3 (Table 1). Similar pH values in the fruit pulp of eggplant germplasm were found by Prohens et al. [21], with values ranging from 5.01 in S. melongena to 5.93 in S. aethiopicum, as well as by San José et al. [44]. Ιt is noteworthy that pH is an important trait in eggplant, as it may affect the enzymatic activity of polyphenol oxidase [45], which is responsible for the oxidation of phenolic compounds and consequently for the browning of the eggplant’s pulp. It has been shown that the activity of polyphenol oxidase begins to increase at pH > 5.0 [46], a value close to the observed pH range in the current study. Instead, at a pH below 4.0, denaturation occurred, and consequently so did enzymatic inactivation, providing a method for controlling enzymatic darkening [47,48]. In eggplant, the reported optimum pH values for the polyphenol oxidase activity range between 6.4 and 7.0 and more acidic or alkaline pH can lead to less enzymatic activity [49,50]. Considering the pH range obtained in the present study (4.99–5.57), the genotypes with lower pH values may be less susceptible to flesh browning.
Additionally, TSS of eggplant genotypes showed a mean value of 2.31, whereas their values ranged from 1.25 to 4.65 °Brix (Table 1). The genotypes C1 and Cross1 had the lowest and highest TSS values, respectively. Considering that high DM and TSS are desirable traits for the food industry since they enhance the quality of the processed product [51], there are several genotypes discriminated in each parameter. Τhe higher the TSS, the higher the flavor, since TSS contains organic acids (mostly malic and citric acid), sugars and amino acids, which are key taste components of eggplant fruit [52,53]. In accordance with the current results, previous studies of eggplant reported that TSS ranged from 1.27 to 3.94 °Brix [54], from 0.74 to 2.13 °Brix [44] and from 2.8 to 6.5 °Brix [31]. The later study showed that several factors like irrigation, fertilization and the year of experimentation had significant effects on this trait. In the same direction, Johnson et al. [55] demonstrated that the improvement in fruit quality parameters like DM and TSS, apart from the genotypic effect, could be a consequence of restricted water flow into the fruit due to the decreased water potential of the plant. Similarly, Serrano [56] mentioned that the high DM and TSS were enhanced from factors like osmotic challenges imposed by drought or salt stress, which led to the activation of a defense mechanism with the production and accumulation of sugars and other organic compounds in various compartments.
Concerning the TA, values ranged from 0.08% in L4 to 0.29% in C3, averaging at 0.14% (Table 1). TA and pH were negatively correlated and consequently the genotypes with lower TA (e.g., L3, L4) showed the higher pH values, whereas genotypes with higher TA (e.g., C3) had lower pH values. However, this did not hold true for the rest of the genotypes. A similar range of TA values (0.10–0.14%) was reported by Leogrande et al. [31] for eggplants cultivated in a Mediterranean environment. According to the literature cited, fresh eggplant contained about 1.24 g citric acid/100 g DW, while it is commonly accepted that TA influences fruit flavor [57] and indicates fruit maturity as it decreases during maturation [58].

3.2. Bioactive Compounds Determination

ANOVA on the data obtained from the evaluated parameters of bioactive compounds (TPC, TFC, TAC, CAs, ABTS, DPPH, FRAP) showed high statistically significant effects due to eggplants genotype (G), fruit part (P) and their interactions (G × P) as a source of variation (Table A2).

3.2.1. Total Phenolics Content

In terms of overall genotypes, the TPC had a mean value of 4.53 mg GAE/g of dw in pulp and 8.92 mg GAE/g of dw in the peel of fruits (Table 2). Specifically, the TPC in the pulp of eggplant’s genotypes ranged from 2.06 to 7.43 mg GAE/g of dw basis (Table 2). In more detail, fruit pulp of five genotypes (L3, W, L6, C1 and L6) presented the highest values ranging from 7.05 to 7.43 mg GAE/g of dw, whilst the L7 showed the lowest one (2.06 mg GAE/g dw). Regarding the fruit peel, Hyb2 had the greater TFC value (12.74 mg GAE/g dw), whereas three genotypes (C1, L9 and W1) had the lowest values ranged from 6.33 to 6.63 mg GAE/g dw.
The literature frequently references that environmental factors, cultivation system (e.g., conventional or organic) or cultivation season may affect the TPC and other bioactive compounds in different eggplant genotypes [59]. Moreover, expression in different units in Folin–Ciocalteu’s method for TPC determination and other methods used makes the relative comparisons difficult.
Our TPC results are in accordance with those reported by San José et al. [44], who found that TPC among eggplant cultivars ranged between 4.1 and 8.2 mg GAE/g dw, as well as with those of Apak et al. [60], who reported a quantitative range of 3.2–15.6 mg GAE/g dw for TPC of raw vegetables. Moreover, Luthria et al. [59] obtained a content of 7.0–16.0 mg GAE/g dw TPC for eggplant grown under organic and conventional cultivation, while recently Koley et al. [61] demonstrated that TPC ranged from 13.0 to 49.3 mg/100 g fw for twenty-six Indian eggplants. Similarly, Raigón et al. [62] found a TPC value of 48.26 mg/100 g fw of eggplant, comparable to those obtained in the present study. Nevertheless, Arkoub-Djermoune et al. [58] mentioned that TPC of eggplant was about 49.15 mg GAE/g dw, a value more than four-fold that of the highest value of TPC given (peel TPC) by our study. More recently and contrary to our results, Chioti et al. [63] also used the C1, C2, C3 and Hyb2 genotypes and obtained a different TPC range. In particular, C1, C2, C3 and Hyb2 had 17.4, 100.5, 57.1 and 83.2 mg GAE/g fw, respectively, which were remarkably higher than the respective values givn in the present study. Moreover, Zaro et al. [29] found that TPC of eggplant cultivars ‘Monarca’ and ‘Perla Negra’ at traditional harvest stages ranged from 1300–1500 mg/kg fw (approximately 13.0–15.0 mg/g converted on dry weight basis). TPC values in this range are comparable with the mean value of 6.72 mg/g dw obtained in the current study, even though are about 3-fold greater.

3.2.2. Total Flavonoids Content

The TFC averaged at 4.22 mg CATE/g dw in the pulp and at 9.01 mg CATE/g dw in the peel of the examined eggplant genotypes (Table 2). In general, peel TFC was at least double the pulp TFC. Concerning the pulp TFC, Smac had the highest value (8.92 mg CATE/g dw), while L7 had the lowest (1.49 mg CATE/g dw). Hyb2 was superior for peel TFC (14.24 mg CATE/g dw), whereas L9 had the lowest value (4.71 mg CATE/g of dw).
The expression of TFC in different units in similar studies in the literature makes the relative comparisons difficult. For instance, Arkoub-Djermoune et al. [58] found that TFC of eggplant was approximately equivalent to 2399.6 mg quercetin/100 g DW. Our results are in accordance with those of Chioti et al. [63], who found similar TFC values for C1, C2, C3 and Hyb2 genotypes (approximately 4.9, 6.0, 13.7 and 9.3 mg quercetin equivalent/g dw). Moreover, Jung et al. [12] reported values of 0.81 and 6.19 mg CATE/g dw for the eggplant pulp and peel TFC, respectively. More recently, Koley et al. [61] demonstrated that the TFC in twenty-six Indian eggplants ranged from 5.3 to 28.7 mg/100 g fw, amounts clearly lesser than the corresponding of the current study.

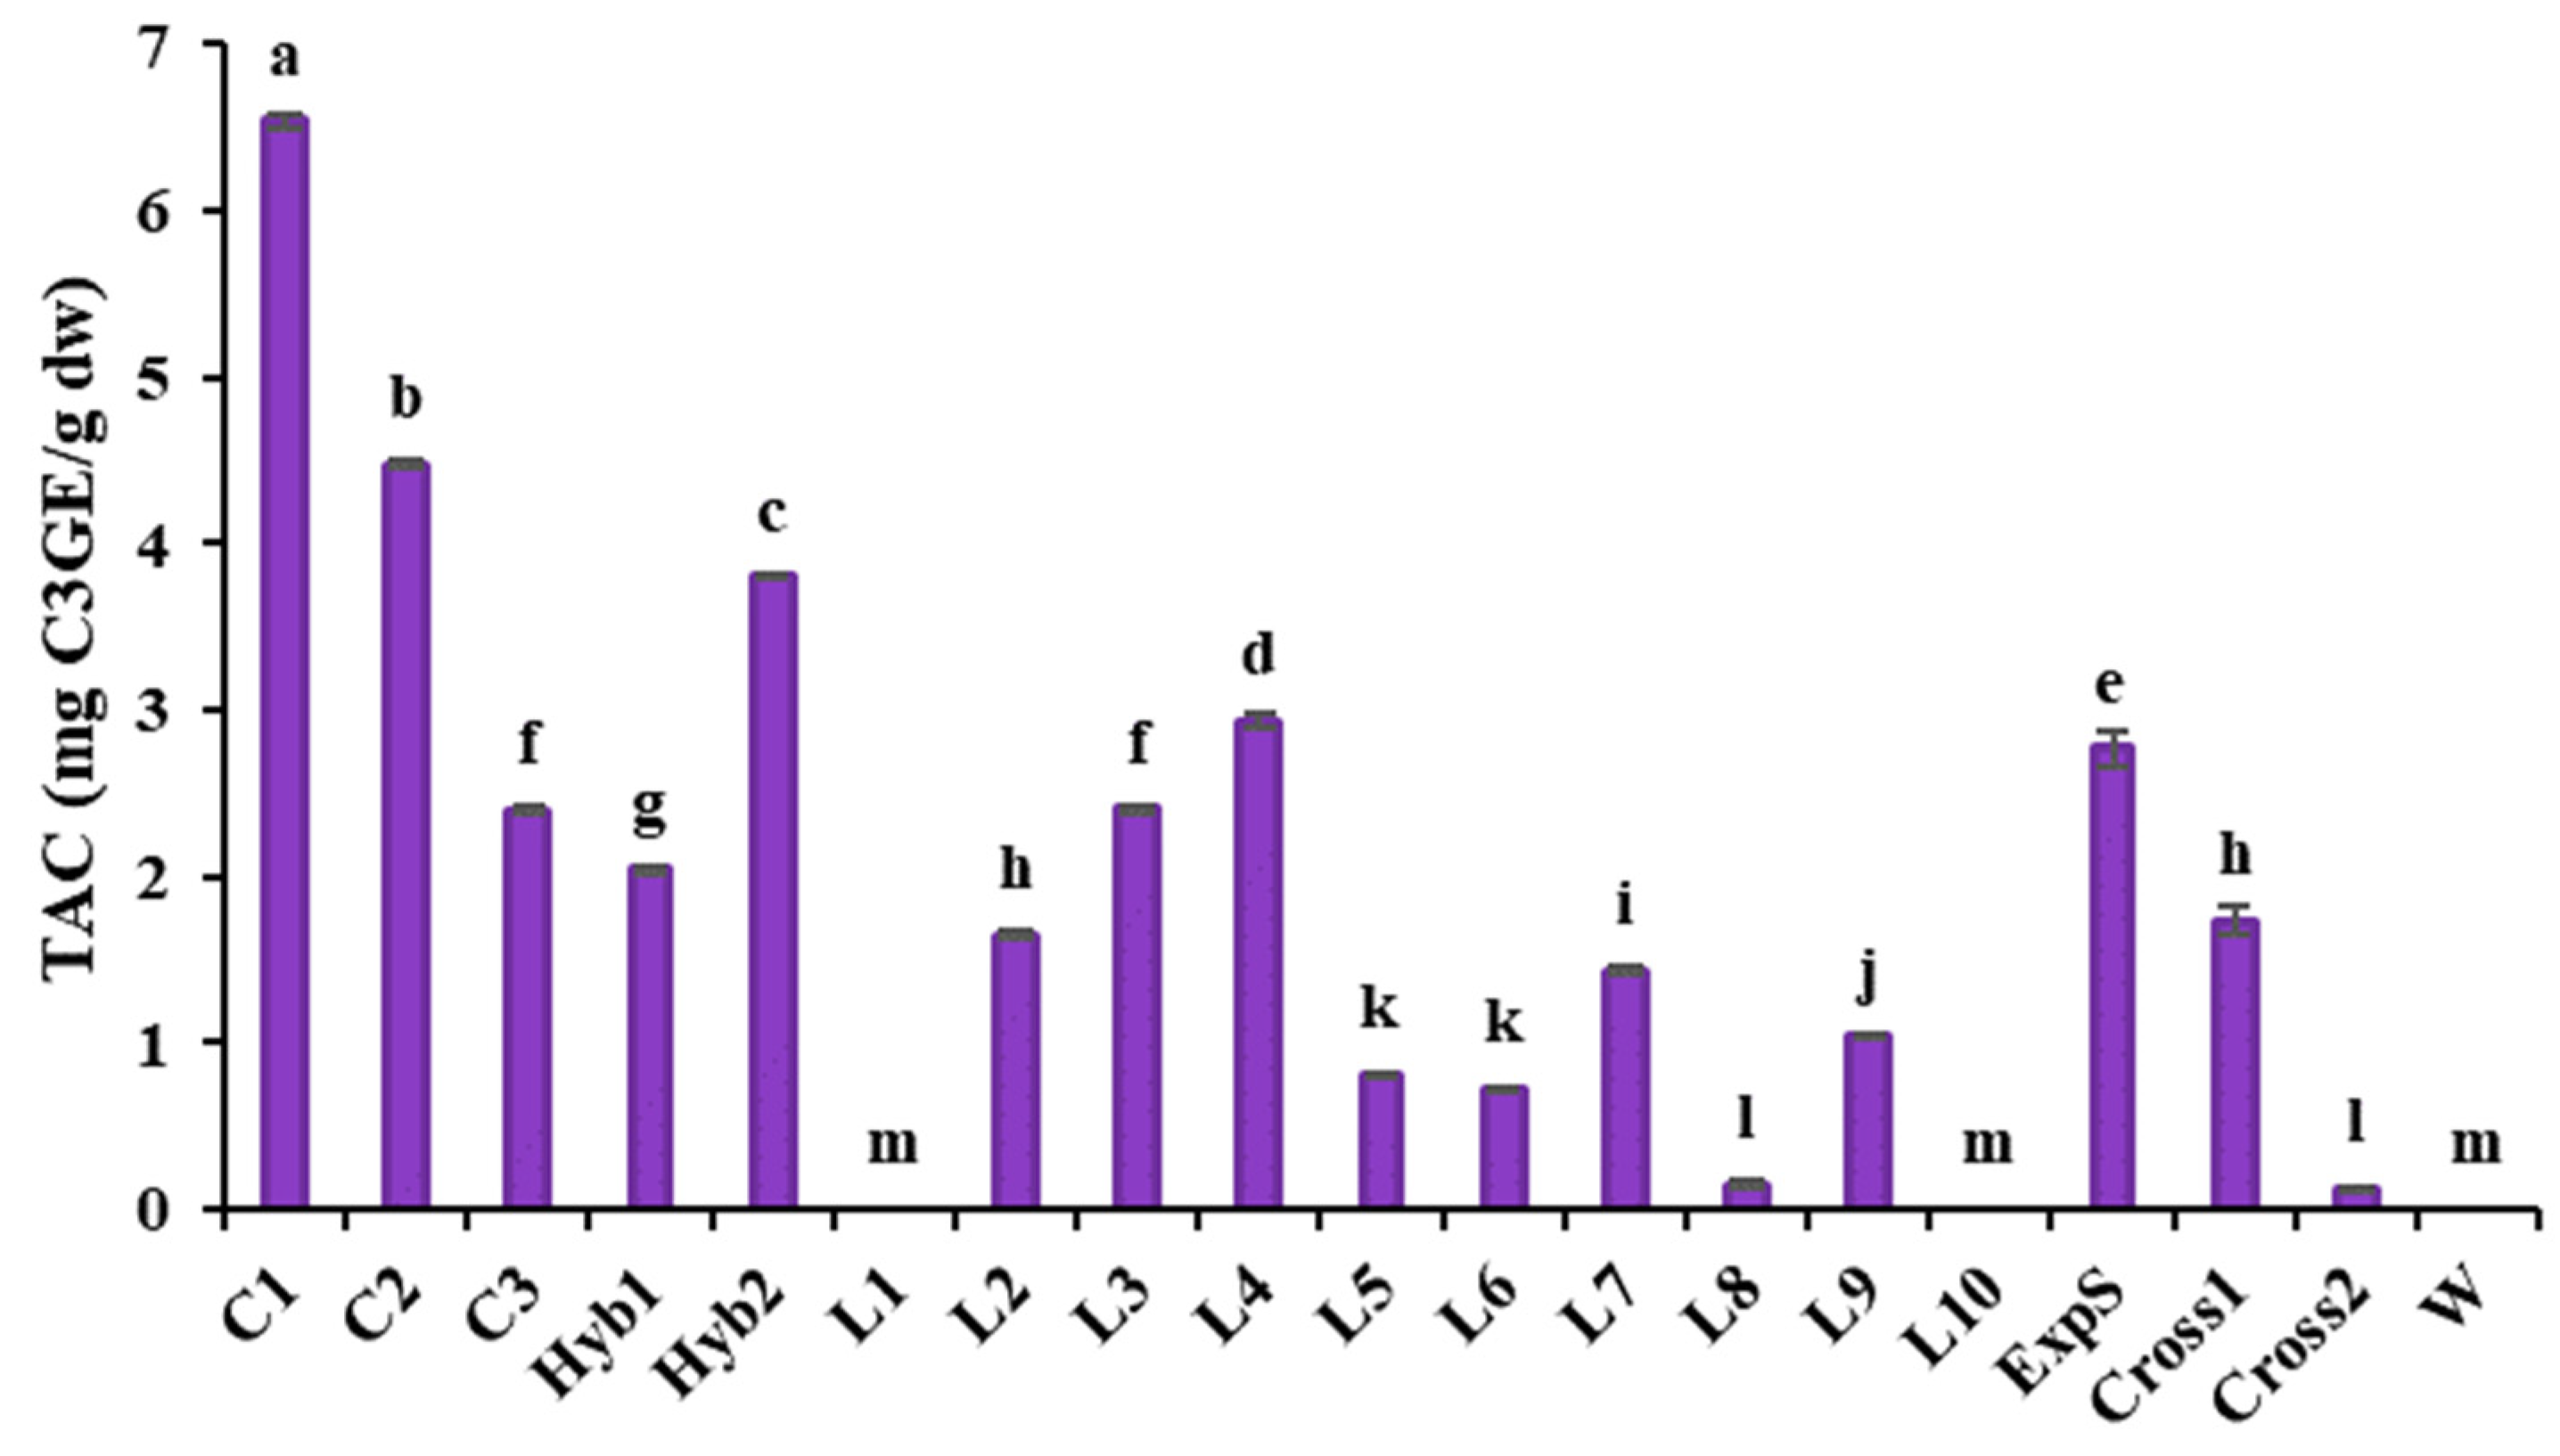
3.2.3. Total Monomeric Anthocyanins Content

The overall TAC mean value in the peel of eggplant fruits was 1.84 mg C3GE/g dw (Figure 1). Genotype C1 showed the greatest TAC at 6.54 mg C3GE/g dw, a value 3.5-fold greater than the overall value. Moreover, four genotypes (L5, L6, L8 and Cross2) presented TAC values lower than 1 mg C3G3/g dw. As was expected, anthocyanin was not detected in L1, L10 (white coloration of the fruit skin) or Smac (green coloration; Figure A1).
Arkoub-Djermoune et al. [58] found that TAC of the fresh eggplant peel was 201.51 mg quercetin-3-glucoside equivalent/100 g dw, a value close to the mean TAC of the present study but expressed in different equivalents. Jung et al. [12] reported a TAC of 138 mg for eggplant peel. In another recent study, C1, C2, C3 and Hyb2 were shown to have considerably less TAC (3.84–10.44 mg C3GE/100 g) on a fresh weight basis [63] with respect to the values obtained here. This could be attributed to the different cultivation conditions or important environmental factors (e.g., temperature) that affect the anthocyanin synthesis [64].

3.2.4. Identification and Quantification of Chlorogenic Acids

It is well known that eggplant pulp is rich in phenolics acids, specifically hydroxycinnamic acids [8]. These acids typically form esters, CA and its isomers n-CA and c-CA are the most widely distributed in eggplant, all of which were identified herein. The CA and its isomers, quantified by HPLC, revealed a great variation among genotypes and fruit parts (Table 3 and Table A2). Generally, 13 of the 19 genotypes contained more CA in the peel than in the pulp. Pulp CA, ranged from 0.887 mg/g dw in L7 to 10.424 mg/g dw in L3, with a mean value of 3.995 mg/g dw (Table 3). The corresponding values of peel CA ranged between 1.855 mg/g dw in L9 and 9.774 mg/g dw in L6, with a mean value of 4.966 mg/g dw.
The pulp n-CA ranged from negligible values (0.014 mg/g dw in L6 and 0.017 mg/g dw in C3) to 0.528 mg/g dw in Smac (Table 3). It is remarkable that two eggplant genotypes had only traces of n-CA and that five genotypes had no n-CA at all. Peel n-CA ranged from the very low value of 0.017 mg/g dw in Smac to 0.548 mg/g dw in L2. All the other genotypes did not differ significantly in peel n-CA concentration. The mean pulp n-CA value was 0.053 mg/g dw, about one quarter of the peel n-CA (0.202 mg/g dw).
Regarding c-CA, its overall mean value was 0.037 mg/g dw in the pulp and 0.180 mg/g dw in the peel of the eggplant fruit (Table 3). Pulp c-CA ranged from 0.007 mg/g dw in C3 to 0.210 mg/g dw in Smac, whereas peel c-CA varied between 0.035 mg/g dw in L9 and 0.471 mg/g dw in Hyb1. It is noteworthy that, excluding the very high value of W, pulp c-CA concentration did not differ among the rest of the eggplant genotypes.
The above-mentioned results concerning the pulp and peel CAs confirm several previous findings that report a high phenolic content in the eggplant fruit, with CA being the most abundant phenolic compound [65,66], whereas its isomers c-CA and n-CA were found in minor quantities [67,68]. However, there is a great range amongst their quantification methods in the literature, while the expression of results on different weight bases (dry or fresh) makes the comparisons difficult. For example, Niño-Medina et al. [8] reported that CAs isomers, as the main class of phenolic acids of eggplant, represented 77% to 94% of the total soluble phenolic acids and varied from 424 to 961 mg/100 g fw, showing an analogy with our study. Accordingly to our results, the literature mentioned that CAs in dried samples ranged from 0.5 to 13.0 mg/g dw [69,70], whereas Šilarová et al. [71] found lower concentration of CA (0.1–1.9 mg/g fw). Scalzo et al. [72] reported CA concentrations of 17.2, 15.2 and 12.9 mg/g dw in the eggplant cultivars ‘Tunisina’, ‘Buia’ and ‘L 305’, respectively. Niño-Medina et al. [7] mentioned that the content of CA in eggplants grown in Mexico depended highly on the cultivar and on the harvesting conditions and ranged from 8.6 to 17.0 mg/g dw, values comparable to the respective ones of the current study. Contrariwise, the CA content of the ‘Blackbell’ and ‘Millionaire’ eggplant cultivars growing under organic or conventional conditions ranged between 2.63–6.71 mg/100 g dw [59], values about one hundred fold smaller than the relative ones in our study.

3.3. Antioxidant Capacity

The ANOVA of the data obtained by the ABTS, DPPH and FRAP assays indicated a significant effect of the eggplant genotype (G), fruit part (P) and their interaction (G × P) on the antioxidant capacity (Table A2).
Indeed, a higher antioxidant capacity was observed in the peel than in the pulp tissue. Precisely, the overall, mean values of ABTS, DPPH and FRAP assays in the pulp were 5.96, 4.21 and 5.07 TE/g dw, respectively, whilst the corresponding values in peel were 14.68, 12.04 and 15.23 TE/g dw (Table 4). In detail, in the pulp of the eggplant fruit ABTS values ranged between 2.97 and 10.57 TE/g dw, DPPH ranged between 1.58 to 9.04 TE/g dw and FRAP were between 2.23 to 9.47 TE/g dw. Concerning the peel antioxidant capacity, ABTS ranged between 9.13 and 24.87 TE/g dw, DPPH ranged between 8.01 and 18.74 TE/g dw and FRAP values were between 8.06 and 23.90 TE/g dw. Overall assays, Smac clearly presented the highest antioxidant capacity in pulp, with nearly 1.8- to 2.1-fold higher values than the respective means of the other genotypes, followed by L3. The pulp of L7 had the lowest antioxidant capacity in the three conducted assays. Peel of the Hyb2 and C3 genotypes presented at least 24.7–69.4% higher antioxidant capacity for all three assays than the other genotypes. The same trend was demonstrated by Chioti et al. [63], with C3 and Hyb2 showing the best antioxidant activity, as indicated by the highest DPPH and FRAP values. On the contrary, the peel of Smac and C1 presented the lowest values of antioxidant capacity for all assays. Generally, the antioxidant activity of raw vegetables (garlic, onions, peppers cabbages, lotus, and salad), as determined by FRAP ABTS, DPPH, and CUPRAC assays, varied remarkably and ranged from 6.2 to 22.0 μmol TE/g dw for DPPH [60]. Nevertheless, Arkoub et al. [58] reported 121 mg TE/g dw for ABTS in fresh whole eggplant fruit, a value about 8-fold of the mean value obtained in the present work (14.68 mg TE/g dw in the peel).

3.4. Correlation Coefficients among Physicochemical Traits, Bioactive Compounds, Antioxidant Capacity and CAs

The Pearson correlation coefficient (r) was used to evaluate the correlations between the studied physicochemical traits (DM, pH, TSS, TA), the concentrations of the bioactive compounds (TPC, TFC and TAC and CAs) and the antioxidant capacity as determined by the ABTS, DPPH and FRAP assays, both in the fruit pulp and peel.
Significant positive correlations (mainly at p ≤ 0.001) were observed between several traits (Table 5), indicating that breeding for one of these traits could also bring about an indirect improvement in other traits [73]. Apparently, the physicochemical traits were not correlated with the rest of traits, with the exception of TA, which was strongly negatively correlated with DM (r = −0.676, p > 0.01). In contrast, Arkoub-Djermoune et al. [58] found a high positive correlation between TA and pH (r = 0.69).
TAC was not correlated with the other antioxidant capacity traits in the present study (Table 5). This was also reported by other researchers [12,70], leading to the conclusion that TPC, rather than TAC, is more correlated to the antioxidant activity. Indeed, pulp TPC was correlated with all the other traits determined at pulp, except for the physicochemical traits. Specifically, regarding the pulp traits, TPC was very strongly correlated with TFC, ABTS, DPPH, FRAP and CA, (r = 0.954−0.993, p > 0.01), whereas it was highly correlated with n-CA and c-CA (r = 0.553−0.567, p > 0.05). The same holds true for the peel traits as TPC was strongly or very strongly correlated with TFC, ABTS, DPPH, FRAP, CA and c-CA (r = 0.778−0.958, p > 0.01), except for the case of n-CA, where the strong correlation had a rather low r (0.524, p > 0.05). Similarly, pulp TFC was very strongly correlated with other pulp traits like ABTS, DPPH, FRAP, and CA (r = 0.949−0.995, p > 0.01), whereas it was strongly correlated with n-CA and c-CA (r = 0.597−0.637, p > 0.01). A similar trend was observed for peel TPC (Table 5).
In the antioxidant capacity assays, pulp ABTS was very strongly correlated with pulp DPPH and pulp FRAP (r = 0.985−0.986, p > 0.01), while no correlation was observed between peel ABTS and peel DPPH or FRAP. However, peel DPPH was strongly correlated with peel FRAP (r = 0.925, p > 0.01). Moreover, an ABTS assessed in either pulp or peel was very strongly correlated with pulp CA (0.944−0.952, p > 0.01) and strongly correlated with its isomers in the pulp (0.586−0.668, p > 0.01).
Although it is well-known that flavonoids have high antioxidant activity and there is no correlation between non-flavonoid compounds and antioxidant activity [74,75], in the present study, TPC was also strongly correlated with the antioxidant capacity assays. Moreover, the results clearly indicate that TPC and TFC contribute, to a high extent, to the antioxidant activity of eggplant, whereas Cas (especially CA) corresponded to a great extent to the determined TPC and TFC, as well as to the antioxidant capacity. The strong correlation between Cas and TPC was previously observed and attributed to the fact that the most abundant phenolic acid in eggplant was the CA [59]. In the same manner, a very strong correlation of Cas with the antioxidant activity’s assays was previously reported by Xu et al. [76], revealing that Cas isomers exhibit antioxidant activities and protective effects against DNA damage to various extents.

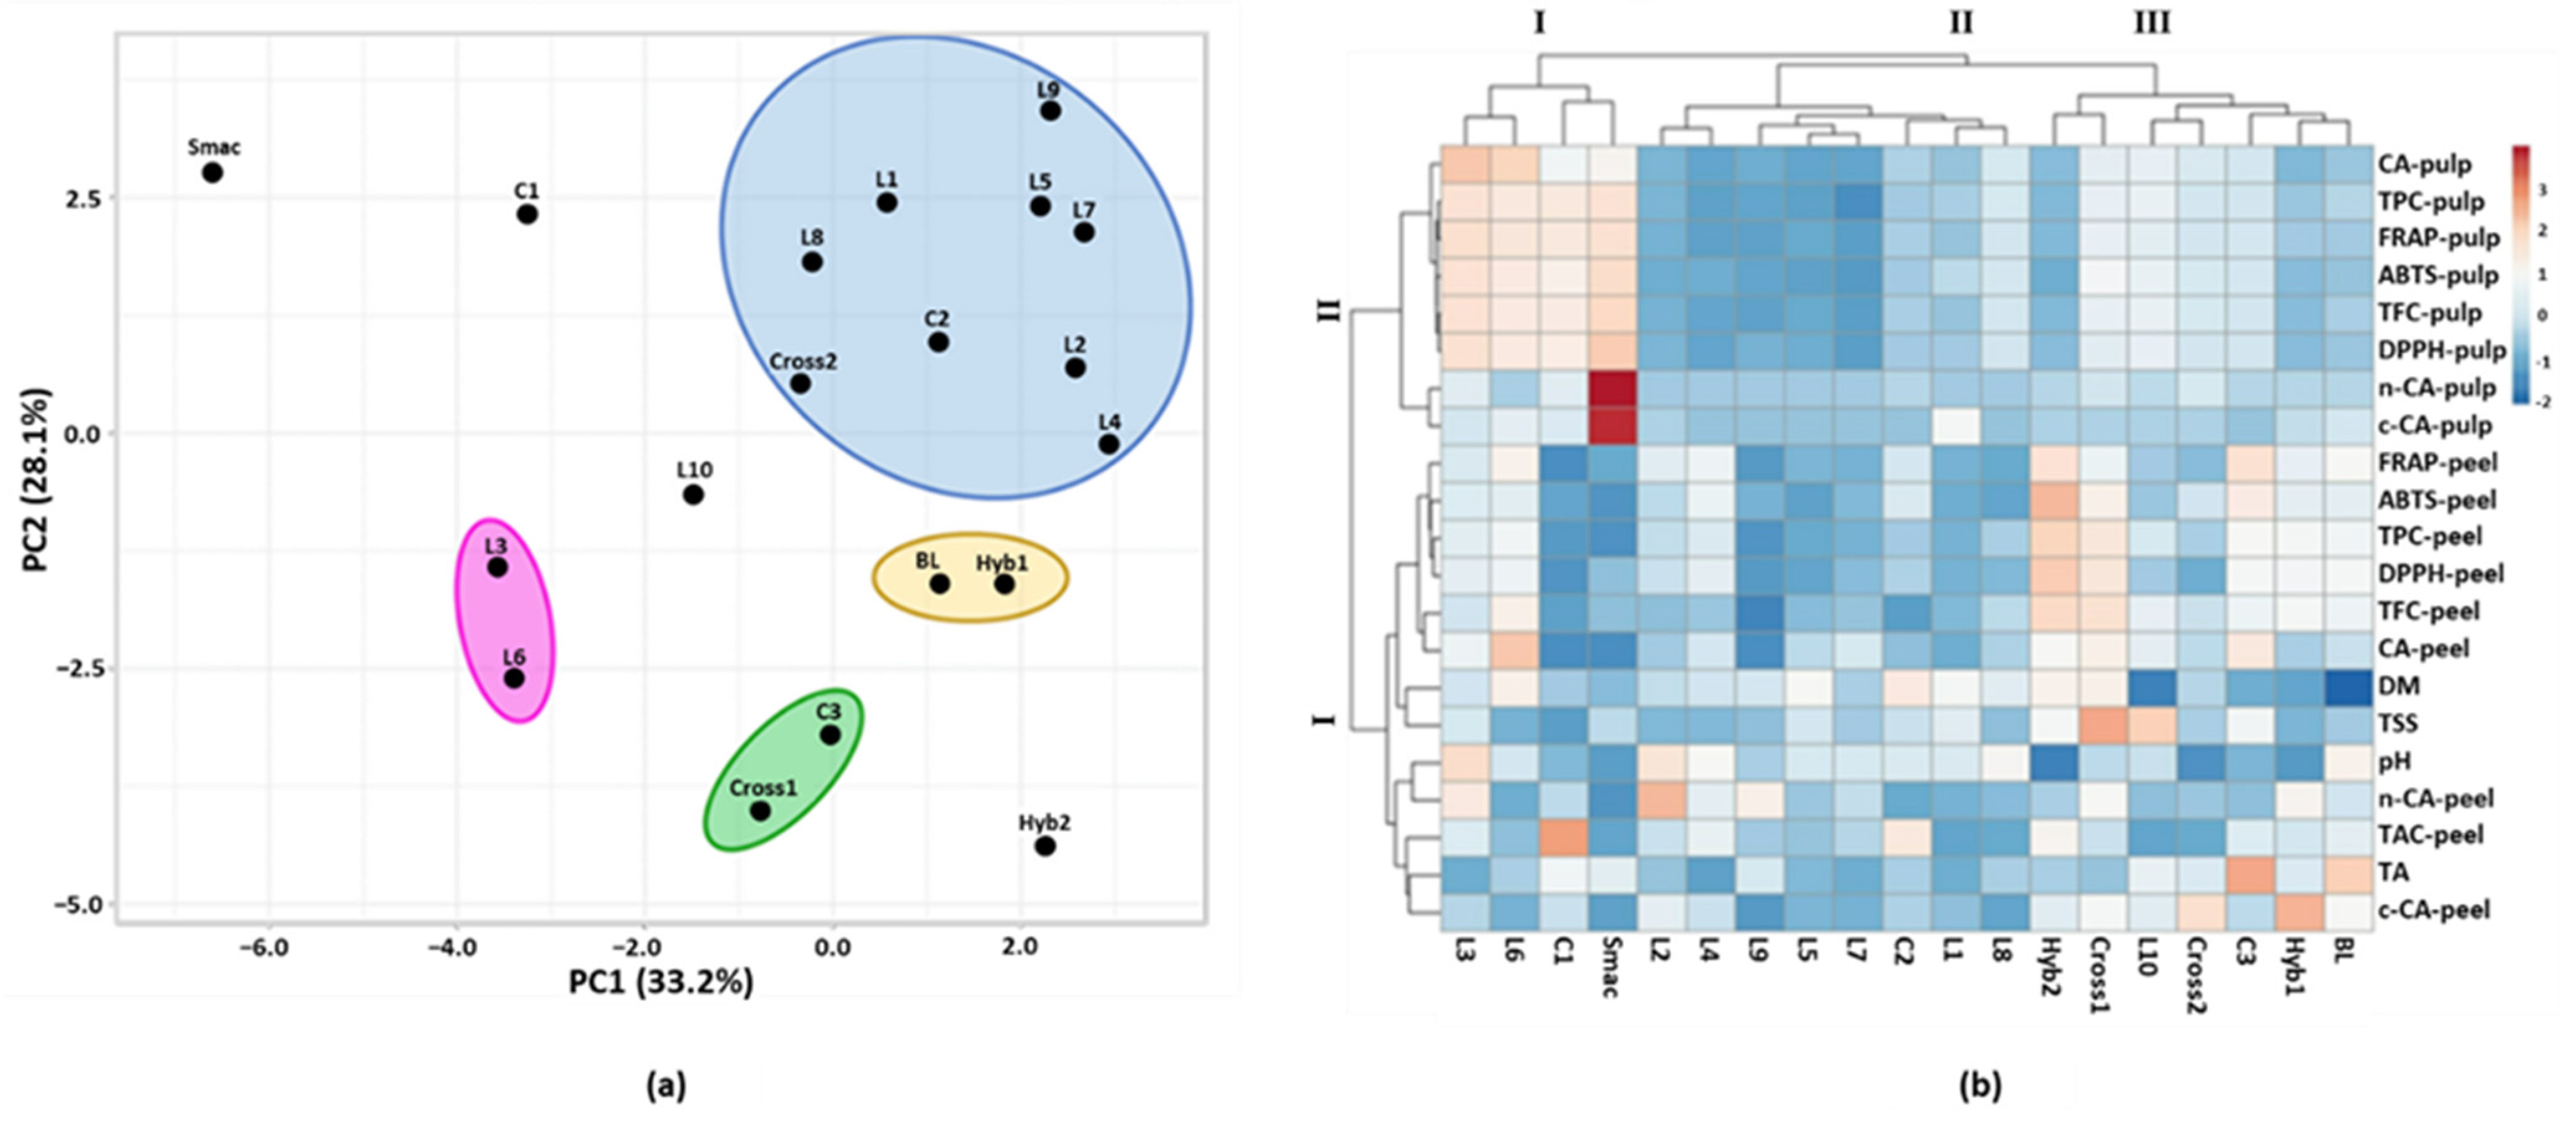
3.5. Principal Component Analysis and Hierarchical Clustering

In total, 21 determined variables concerning the physicochemical traits, the bioactive compounds, and the antioxidant capacity of 19 eggplant genotypes were subjected to a principal component analysis (PCA). Based on an eigenvalue >1, we extracted a total of two PCs with a cumulative distribution of 61.3%, (33.2% for the first component and 28.1% for the second) (Figure 2a). It was observed that 15 eggplant genotypes formed four distinct groups, whereas Smac, C1, L10 and Hyb2 were diagonally scattered in the PCA plot. Interestingly, the majority of the landraces, excepting L3 and L6, were distinctly ordinated on the positive side of the PCA (blue outline) together with C2 and Cross2, indicating a tendency for higher values in most of the evaluated traits. Two other groups, consisting of L3 and L6 (pink outline) and of C3 and Cross1 (green outline), were both located in the lower left quadrant, indicating that their values of estimated parameters were below the mean values and thus were grouped at the negative side of the PCA plot. The BL and Hyb1 formed the fourth group in the lower right quadrant (brown outline).
To obtain a comprehensive view of the distribution of the eggplant genotypes based on the evaluated parameters, AHC analysis was performed to enable the grouping of genotypes into clusters of similar responses based on calculations of the Euclidean distance (Figure 2b). The output dendrogram obtained after applying Ward’s method for agglomeration consisted of three distinct clusters on the horizontal axis. Cluster I was comprised of four genotypes located on the third and fourth quadrants of the PCA plot (group of L3 and L6 together with C1 and Smac). Cluster II consisted of eight genotypes (the genotypes of the blue group, excepting Cross2). Finally, Cluster III contained seven genotypes ordinated in the lower right quadrant of the PCA plot (the green and brown groups together with L10 and Hyb2). It is apparent that the grouping results from the AHC analysis were in accordance with the respective results of the PCA.
Genotypes belonging to different AHC clusters showed a different response regarding the pulp and the peel traits. Particularly, the genotypes of Cluster I presented remarkably high values (indicated with different shades of pink color in Figure 2b) for most of the evaluated traits, especially those estimated in the fruit pulp. On the other hand, the genotypes of Cluster III were characterized by moderate values for pulp traits and higher values for most of the peel traits. In this regard, C3, Cross1 and Hyb2 gave the best values for the peel traits. Finally, Cluster II consisted of genotypes with the lowest values for the pulp traits and low-to-moderate values for the peel traits. Moreover, AHC analysis grouped the evaluated traits into two distinct clusters on the vertical axis with respect to the fruit part that was used for their determination. Cluster I corresponded to the peel and physicochemical traits and Cluster II corresponded to the pulp traits.

4. Conclusions

The present study revealed a considerable genetic variation in the physicochemical and bioactive properties of the fruit peel and pulp in the evaluated eggplant germplasms. Among the 19 materials, some genotypes with remarkably high antioxidant contents were identified. Interestingly, these genotypes included both improved (commercial varieties and hybrids) and unimproved (landraces and S. macrocarpon) germplasms, emphasizing the significance of genetic resources in eggplant breeding. PCA and AHC analyses successfully grouped the genetic materials together on the basis of their biochemical profile. In addition, AHC grouped the evaluated traits into two major groups with respect to the fruit part used for their determination (fruit peel and fruit pulp traits).
Considering the four genotypes that performed best for the antioxidant content, two distinctive profiles were identified: (1) genotypes that were superior for pulp traits (S. macrocarpon and the landrace ‘KD054/07’) and (2) genotypes that were superior for peel traits (i.e., F1 ‘Nilo’ and ‘Langada’). However, no significant negative or positive correlation was found between pulp and peel traits. Therefore, it would be interesting to hybridize these two groups in order to obtain genotypes with high functional value in both fruit parts. In this respect, ‘KD054/07’ is a more suitable potential parent in a hybridization program, because S. macrocarpon is more distantly related to eggplant. Other materials with potential for breeding included the commercial variety ‘Tsakoniki’ with very high anthocyanin content and the landrace ‘GRC094/05’ with high values for dry matter percentage, pulp TPC and peel CA.
The present study provided an insight into the bioactive properties of an eggplant collection of diverse origin and identified several eggplant materials with high antioxidant fruit content that can be utilized for breeding purposes.

Author Contributions

Conceptualization, K.I.K. and K.K.; methodology, K.I.K., K.K. and M.I.; software, K.I.K.; validation, K.I.K., K.K. and M.I.; formal analysis, K.I.K.; investigation, K.I.K., K.K., P.R., I.M., A.K. and M.I.; data curation, K.I.K.; writing—original draft preparation, K.I.K.; writing—review and editing, K.K., P.R., I.M., A.K. and M.I.; visualization, K.I.K. and K.K.; supervision, K.I.K. All authors have read and agreed to the published version of the manuscript.

Funding

This research received no external funding.

Institutional Review Board Statement

Not applicable.

Data Availability Statement

Not applicable.

Conflicts of Interest

The authors declare no conflict of interest.

Appendix A

Figure A1. Fruit phenotype of the studied eggplant germplasm: Commercial landraces and commercial F1 hybrids (A). Experimental hybrids, breeding line and Solanum macrocarpon (B). Landraces. All genotypes maintained in the Greek Gene Bank of ELGO—Dimitra (C). Explanations for the abbreviations are given in Table A1.
Horticulturae 08 01113 g0a1

Appendix B

Table A1. Details on the eggplant’s germplasm collection used in the current study.
NoGermplasmAbbreviationTypeSource
1TsakonikiC1Greek commercial landrace 1ELGO-DIMITRA 2
2EmiC2Greek commercial landraceELGO-DIMITRA
3LangadaC3Greek commercial landraceELGO-DIMITRA
4AnamikaHyb1Commercial F1 hybridSungro Seeds
5NiloHyb2Commercial F1 hybridRijk Zwaan
6LKK95/07L1Greek landraceGGB 3
7KD053/07L2Greek landraceGGB
8KD054/07L3Greek landraceGGB
9KD209/07L4Greek landraceGGB
10KD047/07L5Greek landraceGGB
11GRC094/05L6Greek landraceGGB
12IS031/07L7Greek landraceGGB
13HL050/07L8Greek landraceGGB
14MFS030/07L9Greek landraceGGB
15SantoriniL10Greek landraceGGB
16Male parent of F1 MelitonBLBreeding lineGGB
17Santorini × TsakonikiCross1Experimental F1 hybridGGB
18Santorini × BLCross2Experimental F1 hybridGGB
19Solanum macrocarponSmacCultivated eggplant relativeGGB
1 Commercial landraces developed by applying classical breeding methods on Greek landraces. 2 Hellenic Agricultural Organization—Dimitra. 3 Greek Gene Bank of ELGO-Dimitra.

Appendix C

Table A2. Results of analysis of variance performed on the evaluated physicochemical profile, bioactive compounds and antioxidant capacity of different fruit parts (pulp and peel) of 19 eggplant genotypes. F-ratios’ significance are given for the effects of the eggplant genotype, the fruit part and their interaction on the evaluated traits.
Significance of F-Ratio
Variation SourceDf 1DMpHTSSTATPCTFCABTSDPPHFRAPTACCAn-CAc-CA
Genotype (G)18*** 2************************************
Fruit Part (P)1na 3nanana***************na*********
G x P18 *************** *********
CV% 5.240.363.833.452.712.9917.302.7311.732.0011.711.639.21
1 df, degree of freedom; DM, dry matter; TSS, Total Soluble Content; TA, Total Acidity; TPC, Total Phenols Content; TFC, Total Flavonoids Content; antioxidant activity expressed as ABTS, DPPH and FRAP; TAC, Total monomeric anthocyanin content; CA, Chlorogenic acid; n-CA, neo-chlorogenic Acid; c-CA, crypto-chlorogenic Acid; CV, Coefficient of Variance; 2 *** indicate significance at 0.001 significance level; 3 not applicable.

References

  1. Wei, Q.; Wang, J.; Wang, W.; Hu, T.; Hu, H.; Bao, C. A high-quality chromosome-level genome assembly reveals genetics for important traits in eggplant. Hortic. Res. 2020, 7, 153. [Google Scholar] [CrossRef] [PubMed]
  2. Singh, M.; Kalloo, G.; Banerjee, M.K.; Singh, S. Genetics of yield and its component characters in brinjal (Solanum melongena L.). Veg. Sci. 2002, 29, 24–26. [Google Scholar]
  3. Mwinuka, P.R.; Mbilinyi, B.P.; Mbungu, W.B.; Mourice, S.K.; Mahoo, H.F.; Schmitter, P. Optimizing water and nitrogen application for neglected horticultural species in tropical sub-humid climate areas: A case of African eggplant (Solanum aethiopicum L.). Sci. Hortic. 2021, 276, 109756. [Google Scholar] [CrossRef]
  4. Sharma, M.; Kaushik, P. Biochemical composition of eggplant fruits: A review. Appl. Sci. 2021, 11, 7078. [Google Scholar] [CrossRef]
  5. FAOSTAT. Statistical Database of the Food and Agriculture Organization of the United Nations. Online Database. Available online: https://www.fao.org/faostat/en/#data/QCL (accessed on 4 August 2022).
  6. Samtiya, M.; Aluko, R.E.; Dhewa, T.; Moreno-Rojas, J.M. Potential health benefits of plant food-derived bioactive components: An overview. Foods 2021, 10, 839. [Google Scholar] [CrossRef]
  7. Niño-medina, G.; Muy-rangel, D.; Gardea-béjar, A.; González-aguilar, G.; Heredia, B.; Báez-sañudo, M.; Siller-cepeda, J.; Vélez, R.; Rocha, D.E.L.A. Nutritional and Nutraceutical Components of Commercial Eggplant Types Grown in Sinaloa, Mexico. Not. Bot. Horti Agrobot. Cluj-Napoca 2014, 42, 538–544. [Google Scholar] [CrossRef] [Green Version]
  8. Niño-Medina, G.; Urías-Orona, V.; Muy-Rangel, M.D.; Heredia, J.B. Structure and content of phenolics in eggplant (Solanum melongena)—A review. S. Afr. J. Bot. 2017, 111, 161–169. [Google Scholar] [CrossRef]
  9. Scorsatto, M.; de Castro Pimentel, A.; da Silva, A.J.R.; Sabally, K.; Rosa, G.; de Oliveira, G.M.M. Assessment of Bioactive Compounds, Physicochemical Composition, and In Vitro Antioxidant Activity of Eggplant Flour. Int. J. Cardiovasc. Sci. 2017, 30, 235–242. [Google Scholar] [CrossRef]
  10. Plazas, M.; Prohens, J.; Cuñat, A.N.; Vilanova, S.; Gramazio, P.; Herraiz, F.J.; Andújar, I. Reducing Capacity, Chlorogenic Acid Content and Biological Activity in a Collection of Scarlet (Solanum aethiopicum) and Gboma (S. macrocarpon) Eggplants. Int. J. Mol. Sci 2014, 15, 17221–17241. [Google Scholar] [CrossRef] [Green Version]
  11. Gürbüz, N.; Uluişik, S.; Frary, A.; Frary, A.; Doğanlar, S. Health benefits and bioactive compounds of eggplant. Food Chem. 2018, 268, 602–610. [Google Scholar] [CrossRef]
  12. Jung, E.J.; Bae, M.S.; Jo, E.K.; Jo, Y.H.; Lee, S.C. Antioxidant activity of different parts of eggplant. J. Med. Plant Res. 2011, 5, 4610–4615. [Google Scholar]
  13. Sadilova, E.; Stintzing, F.F.C.; Carle, R. Anthocyanins, colour and antioxidant properties of eggplant (Solanum melongena L.) and violet pepper (Capsicum annuum L.) peel extracts. Z. fur Naturforsch. C 2006, 61, 527–535. [Google Scholar] [CrossRef] [PubMed]
  14. Ichiyanagi, T.; Kashiwada, Y.; Shida, Y.; Ikeshiro, Y.; Kaneyuki, T.; Konishi, T. Nasunin from eggplant consists of cis-trans isomers of delphinidin 3-[4-(p-coumaroyl)-L-rhamnosyl (1→6)glucopyranoside]-5-glucopyranoside. J. Agric. Food Chem. 2005, 53, 9472–9477. [Google Scholar] [CrossRef] [PubMed]
  15. Matsubara, K.; Kaneyuki, T.; Miyake, T.; Mori, M. Antiangiogenic activity of nasunin, an antioxidant anthocyanin, in eggplant peels. J. Agric. Food Chem. 2005, 53, 6272–6275. [Google Scholar] [CrossRef] [PubMed]
  16. Noda, Y.; Kaneyuki, T.; Igarashi, K.; Mori, A.; Packer, L. Antioxidant activity of nasunin, an anthocyanin in eggplant peels. Toxicology 2000, 148, 119–123. [Google Scholar] [CrossRef] [PubMed]
  17. Okmen, B.; Sigva, H.O.; Mutlu, S.; Doganlar, S.; Yemenicioglu, A.; Frary, A. Total antioxidant activity and total phenolic contents in different turkish eggplant (Solanum Melongena L.) cultivars. Int. J. Food Prop. 2009, 12, 616–624. [Google Scholar] [CrossRef] [Green Version]
  18. Piao, X.; Chung, J.; Lee, G.; Lee, J.; Cho, G.; Lee, H.; Ma, K.; Guo, J.; Kim, H.S.; Lee, S. Variation in antioxidant activity and flavonoid aglycones in eggplant (Solanum melongena L.) germplasm. Plant Breed. Biotechnol. 2014, 2014, 396–403. [Google Scholar] [CrossRef] [Green Version]
  19. Stommel, J.R.; Whitaker, B.D. Phenolic Acid Content and composition of eggplant fruit in a germplasm core subset. J. Am. Soc. Hort. Sci. 2003, 128, 704–710. [Google Scholar] [CrossRef]
  20. Plazas, M.; Andújar, I.; Vilanova, S.; Hurtado, M.; Gramazio, P.; Herraiz, F.J.; Prohens, J. Breeding for Chlorogenic Acid Content in Eggplant: Interest and Prospects. Not. Bot. Horti Agrobot. Cluj-Napoca 2013, 41, 26–35. [Google Scholar] [CrossRef] [Green Version]
  21. Prohens, J.; Rodríguez-Burruezo, A.; Raigón, M.D.; Nuez, F. Total Phenolic Concentration and Browning Susceptibility in a Collection of Different Varietal Types and Hybrids of Eggplant: Implications for Breeding for Higher Nutritional Quality and Reduced Browning. J. Am. Soc. Hortic. Sci. 2007, 132, 638–646. [Google Scholar] [CrossRef] [Green Version]
  22. Hanson, P.M.; Yang, R.-Y.Y.; Tsou, S.C.S.S.; Ledesma, D.; Engle, L.; Lee, T.-C.C. Diversity in eggplant (Solanum melongena) for superoxide scavenging activity, total phenolics, and ascorbic acid. J. Food Compos. Anal. 2006, 19, 594–600. [Google Scholar] [CrossRef]
  23. Muñoz-Falcón, J.E.; Prohens, J.; Vilanova, S.; Nuez, F. Diversity in commercial varieties and landraces of black eggplants and implications for broadening the breeders’ gene pool. Ann. Appl. Biol. 2009, 154, 453–465. [Google Scholar] [CrossRef]
  24. Gramazio, P.; Prohens, J.; Plazas, M.; Herraiz, F.J.; Castillo, E.; Knapp, S.; Meyer, R.S.; Vilanova, S. Location of chlorogenic acid biosynthesis pathway and polyphenol oxidase genes in a new interspecific anchored linkage map of eggplant. BMC Plant Biol. 2014, 14, 350. [Google Scholar] [CrossRef] [PubMed] [Green Version]
  25. Prohens, J.; Whitaker, B.D.; Plazas, M.; Vilanova, S.; Hurtado, M.; Blasco, M.; Gramazio, P.; Stommel, J.R. Genetic diversity in morphological characters and phenolic acids content resulting from an interspecific cross between eggplant, Solanum melongena, and its wild ancestor (S. incanum). Ann. Appl. Biol. 2013, 162, 242–257. [Google Scholar] [CrossRef]
  26. Oboh, G.; Ekperigin, M.M.; Kazeem, M.I. Nutritional and haemolytic properties of eggplants (Solanum macrocarpon) leaves. J. Food Compos. Anal. 2005, 18, 153–160. [Google Scholar] [CrossRef]
  27. Kaushik, P.; Gramazio, P.; Vilanova, S.; Raigón, M.D.; Prohens, J.; Plazas, M. Phenolics content, fruit flesh colour and browning in cultivated eggplant, wild relatives and interspecific hybrids and implications for fruit quality breeding. Food Res. Int. 2017, 102, 392–401. [Google Scholar] [CrossRef]
  28. Yadav, V.K.; Singh, R.; Jha, R.K.; Kaushik, P. Biochemical variability of eggplant peel among Indian cultivars. Indian J. Biochem. Biophys. 2020, 57, 634–637. [Google Scholar] [CrossRef]
  29. Zaro, M.J.; Keunchkarian, S.; Chaves, A.R.; Vicente, A.R.; Concellón, A. Changes in bioactive compounds and response to postharvest storage conditions in purple eggplants as affected by fruit developmental stage. Postharvest Biol. Technol. 2014, 96, 110–117. [Google Scholar] [CrossRef]
  30. Kadoglidou, K.; Chatzopoulou, P.; Maloupa, E.; Kalaitzidis, A.; Ghoghoberidze, S.; Katsantonis, D. Mentha and Oregano Soil Amendment Induces Enhancement of Tomato Tolerance against Soilborne Diseases, Yield and Quality. Agronomy 2020, 10, 406. [Google Scholar] [CrossRef] [Green Version]
  31. Leogrande, R.; Lopedota, O.; Vitti, C.; Ventrella, D.; Montemurro, F. Effects of irrigation volumes and organic fertilizers on eggplant grown in Mediterranean environment. Acta Agric. Scand. Sect. B Soil Plant Sci. 2014, 64, 518–528. [Google Scholar] [CrossRef]
  32. Sadler, G.D.; Murphy, P.A. pH and Titratable Acidity. In Food Analysis; Nielsen, S.S., Ed.; Springer: Boston, MA, USA, 2010; pp. 219–238. ISBN 978-1-4419-1478-1. [Google Scholar]
  33. Ntinas, G.K.; Kadoglidou, K.; Tsivelika, N.; Krommydas, K.; Kalivas, A.; Ralli, P.; Irakli, M. Performance and Hydroponic Tomato Crop Quality Characteristics in a Novel Greenhouse Using Dye-Sensitized Solar Cell Technology for Covering Material. Horticulturae 2019, 5, 42. [Google Scholar] [CrossRef] [Green Version]
  34. Singleton, V.L.; Orthofer, R.; Lamuela-Raventós, R.M. Analysis of total phenols and other oxidation substrates and antioxidants by means of folin-ciocalteu reagent. Methods Enzymol. 1999, 299, 152–178. [Google Scholar] [CrossRef]
  35. Irakli, M.N.; Samanidou, V.F.; Biliaderis, C.G.; Papadoyannis, I.N. Development and validation of an HPLC-method for determination of free and bound phenolic acids in cereals after solid-phase extraction. Food Chem. 2012, 134, 1624–1632. [Google Scholar] [CrossRef]
  36. Bao, J.; Cai, Y.; Sun, M.; Wang, G.; Corke, H. Anthocyanins, flavonols, and free radical scavenging activity of Chinese Bayberry (Myrica rubra) extracts and their color properties and stability. J. Agric. Food Chem. 2005, 53, 2327–2332. [Google Scholar] [CrossRef]
  37. Lee, J.; Durst, R.W.; Wrolstad, R.E. Determination of total monomeric anthocyanin pigment content of fruit juices, beverages, natural colorants, and wines by the pH differential method: Collaborative study. J. AOAC Int. 2005, 88, 1269–1278. [Google Scholar] [CrossRef] [PubMed] [Green Version]
  38. Skendi, A.; Irakli, M.; Chatzopoulou, P. Analysis of phenolic compounds in Greek plants of Lamiaceae family by HPLC. J. Appl. Res. Med. Aromat. Plants 2017, 6, 62–69. [Google Scholar] [CrossRef]
  39. Frankel, E.N.; Meyer, A.S. The problems of using one-dimensional methods to evaluate multifunctional food and biological antioxidants. J. Sci. Food Agric. 2000, 80, 1925–1941. [Google Scholar] [CrossRef]
  40. Re, R.; Pellegrini, N.; Proteggente, A.; Pannala, A.; Yang, M.; Rice-Evans, C. Antioxidant activity applying an improved ABTS radical cation decolorization assay. Free Radic. Biol. Med. 1999, 26, 1231–1237. [Google Scholar] [CrossRef]
  41. Yen, G.C.; Chen, H.Y. Antioxidant Activity of Various Tea Extracts in Relation to Their Antimutagenicity. J. Agric. Food Chem. 1995, 43, 27–32. [Google Scholar] [CrossRef]
  42. Benzie, I.F.F.; Strain, J.J. Ferric reducing/antioxidant power assay: Direct measure of total antioxidant activity of biological fluids and modified version for simultaneous measurement of total antioxidant power and ascorbic acid concentration. Methods Enzymol. 1999, 299, 15–27. [Google Scholar] [CrossRef]
  43. Metsalu, T.; Vilo, J. ClustVis: A web tool for visualizing clustering of multivariate data using Principal Component Analysis and heatmap. Nucleic Acids Res. 2015, 43, W566–W570. [Google Scholar] [CrossRef] [PubMed]
  44. San José, R.; Sánchez, M.C.; Cámara, M.M.; Prohens, J. Composition of eggplant cultivars of the Occidental type and implications for the improvement of nutritional and functional quality. Int. J. Food Sci. Technol. 2013, 48, 2490–2499. [Google Scholar] [CrossRef]
  45. Todaro, A.; Cavallaro, R.; Argento, S.; Branca, F.; Spagna, G. Study and characterization of polyphenol oxidase from eggplant (Solanum melongena L.). J. Agric. Food Chem. 2011, 59, 11244–11248. [Google Scholar] [CrossRef] [PubMed]
  46. de Oliveira Carvalho, J.; Orlanda, J.F.F. Heat stability and effect of pH on enzyme activity of polyphenol oxidase in buriti (Mauritia flexuosa Linnaeus f.) fruit extract. Food Chem. 2017, 233, 159–163. [Google Scholar] [CrossRef] [PubMed]
  47. Mayer, A.M. Polyphenol oxidases in plants and fungi: Going places? A review. Phytochemistry 2006, 67, 2318–2331. [Google Scholar] [CrossRef]
  48. Selinheimo, E.; NiEidhin, D.; Steffensen, C.; Nielsen, J.; Lomascolo, A.; Halaouli, S.; Record, E.; O’Beirne, D.; Buchert, J.; Kruus, K. Comparison of the characteristics of fungal and plant tyrosinases. J. Biotechnol. 2007, 130, 471–480. [Google Scholar] [CrossRef]
  49. Roudsari, M.H.; Signoret, A.; Crouzet, J. Eggplant polyphenol oxidase: Purification, characterisation and properties. Food Chem. 1981, 7, 227–235. [Google Scholar] [CrossRef]
  50. Vijayanand, S.; Nagasathya, S.; Peter, B. Extraction, Characterization and Inhibition of Polyphenol Oxidase in Solanum Melongena. Artic. Int. J. Pharm. Sci. Res. 2021, 12, 4292. [Google Scholar] [CrossRef]
  51. De Pascale, S.; Maggio, A.; Fogliano, V.; Ambrosino, P.; Ritieni, A. Irrigation with saline water improves carotenoids content and antioxidant activity of tomato. J. Hortic. Sci. Biotechnol. 2001, 76, 447–453. [Google Scholar] [CrossRef]
  52. Hanifah, A.; Maharijaya, A.; Putri, S.P.; Laviña, W.A. Sobir Untargeted Metabolomics Analysis of Eggplant (Solanum melongena L.) Fruit and Its Correlation to Fruit Morphologies. Metabolites 2018, 8, 49. [Google Scholar] [CrossRef] [Green Version]
  53. Ayaz, F.A.; Colak, N.; Topuz, M.; Tarkowski, P.; Jaworek, P.; Seiler, G.; Inceer, H. Comparison of Nutrient Content in Fruit of Commercial Cultivars of Eggplant (Solanum melongena L.). Polish J. Food Nutr. Sci. 2015, 65, 251–259. [Google Scholar] [CrossRef] [Green Version]
  54. Bidaramali, V.; Akhtar, S.; Das, A. Proximate Composition and Bioactive Compounds in Diverse Eggplant Genotypes. Curr. J. Appl. Sci. Technol. 2020, 39, 113–121. [Google Scholar] [CrossRef]
  55. Johnson, R.W.; Dixon, M.A.; Lee, D.R. Water relations of the tomato during fruit growth. Plant. Cell Environ. 1992, 15, 947–953. [Google Scholar] [CrossRef]
  56. Serrano, R. Salt tolerance in plants and microorganisms: Toxicity targets and defense responses. Int. Rev. Cytol. 1996, 165, 1–52. [Google Scholar] [CrossRef] [PubMed]
  57. Gajewski, M.; Katarzyna, K.; Bajer, M. The influence of postharvest storage on quality characteristics of fruit of eggplant cultivars. Not. Bot. Horti Agrobot. Cluj-Napoca 2009, 37, 200–205. [Google Scholar]
  58. Arkoub-Djermoune, L.; Boulekbache-Makhlouf, L.; Zeghichi-Hamri, S.; Bellili, S.; Boukhalfa, F.; Madani, K. Influence of the thermal processing on the physico-chemical properties and the antioxidant activity of A solanaceae vegetable: Eggplant. J. Food Qual. 2016, 39, 181–191. [Google Scholar] [CrossRef] [Green Version]
  59. Luthria, D.; Singh, A.P.; Wilson, T.; Vorsa, N.; Banuelos, G.S.; Vinyard, B.T. Influence of conventional and organic agricultural practices on the phenolic content in eggplant pulp: Plant-to-plant variation. Food Chem. 2010, 121, 406–411. [Google Scholar] [CrossRef]
  60. Apak, R.; Gorinstein, S.; Böhm, V.; Schaich, K.M.; Özyürek, M.; Güçlü, K. Methods of measurement and evaluation of natural antioxidant capacity/activity (IUPAC Technical Report). Pure Appl. Chem. 2013, 85, 957–998. [Google Scholar] [CrossRef] [Green Version]
  61. Koley, T.K.; Tiwari, S.K.; Sarkar, A.; Nishad, J.; Goswami, A.; Singh, B. Antioxidant Potential of Indian Eggplant: Comparison Among White, Purple and Green Genotypes Using Chemometrics. Agric. Res. 2019, 8, 9–20. [Google Scholar] [CrossRef]
  62. Raigon, M.D.; Prohens, J.; Munoz-Falcon, J.E.; Nuez, F. Comparison of eggplant landraces and commercial varieties for fruit content of phenolics, minerals, dry matter and protein. J. Food Compos. Anal. 2008, 21, 370–376. [Google Scholar] [CrossRef]
  63. Chioti, V.; Zeliou, K.; Bakogianni, A.; Papaioannou, C.; Biskinis, A.; Petropoulos, C.; Lamari, F.N.; Papasotiropoulos, V. Nutritional Value of Eggplant Cultivars and Association with Sequence Variation in Genes Coding for Major Phenolics. Plants 2022, 11, 2267. [Google Scholar] [CrossRef]
  64. Zhang, S.; Zhang, A.; Wu, X.; Zhu, Z.; Yang, Z.; Zhu, Y.; Zha, D. Transcriptome analysis revealed expression of genes related to anthocyanin biosynthesis in eggplant (Solanum melongena L.) under high-temperature stress. BMC Plant Biol. 2019, 19. [Google Scholar] [CrossRef] [PubMed] [Green Version]
  65. Whitaker, B.D.; Stommel, J.R. Distribution of hydroxycinnamic acid conjugates in fruit of commercial eggplant (Solanum melongena L.) cultivars. J. Agric. Food Chem. 2003, 51, 3448–3454. [Google Scholar] [CrossRef] [PubMed]
  66. Alarcón-Flores, M.I.; Romero-González, R.; Vidal, J.L.M.; Frenich, A.G. Systematic study of the content of phytochemicals in fresh and fresh-cut vegetables. Antioxidants 2015, 4, 345–358. [Google Scholar] [CrossRef] [Green Version]
  67. Clifford, M.N. Chlorogenic acids and other cinnamates—Nature, occurrence and dietary burden. J. Sci. Food Agric. 1999, 79, 362–372. [Google Scholar] [CrossRef]
  68. Clifford, M.N. Chlorogenic acids and other cinnamates—Nature, occurrence, dietary burden, absorption and metabolism. J. Sci. Food Agric. 2000, 80, 1033–1043. [Google Scholar] [CrossRef]
  69. Luthria, D.L. A simplified UV spectral scan method for the estimation of phenolic acids and antioxidant capacity in eggplant pulp extracts. J. Funct. Foods 2012, 4, 238–242. [Google Scholar] [CrossRef]
  70. Singh, A.P.; Luthria, D.; Wilson, T.; Vorsa, N.; Singh, V.; Banuelos, G.S.; Pasakdee, S. Polyphenols content and antioxidant capacity of eggplant pulp. Food Chem. 2009, 114, 955–961. [Google Scholar] [CrossRef]
  71. Šilarová, P.; Boulekbache-Makhlouf, L.; Pellati, F.; Česlová, L. Monitoring of chlorogenic acid and antioxidant capacity of Solanum melongena L. (eggplant) under different heat and storage treatments. Antioxidants 2019, 8, 234. [Google Scholar] [CrossRef] [Green Version]
  72. Lo Scalzo, R.; Fibiani, M.; Francese, G.; D’Alessandro, A.; Rotino, G.L.; Conte, P.; Mennella, G. Cooking influence on physico-chemical fruit characteristics of eggplant (Solanum melongena L.). Food Chem. 2016, 194, 835–842. [Google Scholar] [CrossRef] [Green Version]
  73. Irakli, M.; Skendi, A.; Bouloumpasi, E.; Chatzopoulou, P.; Biliaderis, C.G. Lc-ms identification and quantification of phenolic compounds in solid residues from the essential oil industry. Antioxidants 2021, 10, 2016. [Google Scholar] [CrossRef] [PubMed]
  74. Baderschneider, B.; Winterhalter, P. Isolation and characterization of novel benzoates, cinnamates, flavonoids, and lignans from Riesling wine and screening for antioxidant activity. J. Agric. Food Chem. 2001, 49, 2788–2798. [Google Scholar] [CrossRef] [PubMed]
  75. Aguilera, Y.; Dueñas, M.; Estrella, I.; Hernández, T.; Benitez, V.; Esteban, R.M.; Martín-Cabrejas, M.A. Evaluation of phenolic profile and antioxidant properties of Pardina lentil As affected by industrial dehydration. J. Agric. Food Chem. 2010, 58, 10101–10108. [Google Scholar] [CrossRef] [PubMed]
  76. Xu, J.G.; Hu, Q.P.; Liu, Y. Antioxidant and DNA-protective activities of chlorogenic acid isomers. J. Agric. Food Chem. 2012, 60, 11625–11630. [Google Scholar] [CrossRef]
Figure 1. Total monomeric anthocyanin content (TAC), expressed as mg C3GE per g of dry weight (dw) in the peel of 19 eggplant genotypes. Values are averages ± standard deviation. Values in columns followed by the same letter(s) are not significantly different according to Tukey’s multiple comparison test, at significance level 0.05. Tukey’s honestly significant difference (HSD) value in pulp = 0.0183. Explanations for the genotypes’ abbreviations are given in Table A1.
Horticulturae 08 01113 g001
Figure 2. Multivariate analysis of 19 eggplant genotypes based on 21 evaluated traits: (a) 2D PCA plot of the first two components after principal component analysis (PCA); (b) dendrogram using agglomerative hierarchical clustering (AHC).
Horticulturae 08 01113 g002
Table 1. Physicochemical parameters of fruits of 19 eggplant genotypes. Values are averages ± standard deviation. Values in columns followed by the same letter(s) are not significantly different according to Tukey’s multiple comparison test at significance level 0.05. Explanations for the genotypes’ abbreviations are given in Table A1.
GenotypeDry Matter
g /100 g fw 1
pHTotal Soluble Solids
(°Brix)
Total Acidity
(%)
C16.19 ± 0.34 def5.13 ± 0.02 n1.25 ± 0.05 k0.19 ± 0.006 c
C29.45 ± 0.45 a5.30 ± 0.01 g2.25 ± 0.05 ef0.12 ± 0.003 i
C35.38 ± 0.51 f5.12 ± 0.01 o3.05 ± 0.05 c0.29 ± 0.010 a
Hyb15.21 ± 0.45 fg5.05 ± 0.01 q1.60 ± 0.02 j0.16 ± 0.003 f
Hyb29.08 ± 0.71 a4.99 ± 0.03 s3.15 ± 0.05 c0.12 ± 0.006 h
L18.61 ± 0.40 ab5.30 ± 0.01 f2.67 ± 0.06 d0.09 ± 0.001 m
L26.72 ± 0.07 cde5.53 ± 0.01 b1.63 ± 0.15 ij0.11 ± 0.001 j
L35.57 ± 0.41 cde5.57 ± 0.01 a2.47 ± 0.22 de0.09 ± 0.001 l
L46.99 ± 0.40 cd5.43 ± 0.01 e1.63 ± 0.06 ij0.08 ± 0.001 n
L58.70 ± 0.11 ab5.29 ± 0.01 i2.40 ± 0.17 def0.10 ± 0.004 k
L69.20 ± 0.10 a5.27 ± 0.02 j1.53 ± 0.06 j0.12 ± 0.001 i
L76.28 ± 0.28 def5.29 ± 0.02 h1.90 ± 0.02 ghi0.09 ± 0.005 l
L87.67 ± 0.40 bc5.44 ± 0.01 d1.73 ± 0.11 hij0.12 ± 0.005 h
L97.21 ± 0.20 cd5.19 ± 0.01 m1.77 ± 0.06 hij0.15 ± 0.010 g
L104.19 ± 0.32 gh5.24 ± 0.06 k4.20 ± 0.01 b0.18 ± 0.003 d
BL3.43 ± 0.12 h5.46 ± 0.02 c1.90 ± 0.02 ghi0.26 ± 0.001 b
Cross19.14 ± 0.39 a5.22 ± 0.01 l4.65 ± 0.15 a0.11 ± 0.003 k
Cross26.58 ± 0.43 cde5.03 ± 0.01 r1.95 ± 0.05 gh0.16 ± 0.010 fg
Smac5.83 ± 0.27 ef5.06 ± 0.01 p2.15 ± 0.05 fg0.17 ± 0.001 e
CV 2 %5.240.363.833.45
HSD 30.21130.00060.05160.0006
1 fw, fresh weight; 2 CV, coefficient of variance; 3 HSD, Tukey’s honestly significant difference value.
Table 2. Total phenolics content and total flavonoids content in the extracts of pulp and peel of 19 eggplant genotypes. Values are averages ± standard deviation. Values in columns followed by the same letter(s) are not significantly different according to Tukey’s multiple comparison test at significance level 0.05. Explanations for the genotypes’ abbreviations are given in Table A1.
GenotypeTotal Phenolics Content
(mg GAE/g dw)
Total Flavonoids Content
(mg CATE /g dw)
PulpPeelPulpPeel
C17.06 ± 0.20 a6.63 ± 0.18 jk7.46 ± 0.09 c5.99 ± 0.10 j
C23.81 ± 0.13 d8.09 ± 0.13 h3.24 ± 0. 04 f5.75 ± 0.21 j
C34.63 ± 0.02 c10.82 ± 0.13 c4.37 ± 0.06 e11.07 ± 0.32 e
Hyb13.64 ± 0.03 de10.64 ± 0.46 c2.59 ± 0.02 gh11.66 ± 0.32 d
Hyb23.25 ± 0.09 ef12.74 ± 0.06 a2.43 ± 0.17 h14.24 ± 0.32 a
L13.85 ± 0.10 d7.27 ± 0.14 i2.91 ± 0.18 fg6.87 ± 0.16 i
L23.09 ± 0.05 fg8.66 ± 0.17 fg2.23 ± 0.23 hi7.32 ± 0.05 hi
L37.43 ± 0.46 a9.82 ± 0.27 d8.12 ± 0.30 b8.90 ± 0.16 f
L42.67 ± 0.08 g9.31 ± 0.44 de1.74 ± 0.01 j7.59 ± 0.09 h
L52.66 ± 0.18 g7.01 ± 0.15 ij1.94 ± 0.12 ij7.17 ± 0.05 hi
L67.05 ± 0.19 a10.47 ± 0.11 c7.54 ± 0.13 c12.52 ± 0.06 c
L72.06 ± 0.14 h7.27 ± 0.27 i1.49 ± 0.12 j7.40 ± 0.25 h
L84.82 ± 0.16 c8.14 ± 0.53 gh4.48 ± 0.27 e8.37 ± 0.20 g
L92.73 ± 0.18 fg6.52 ± 0.20 jk1.63 ± 0.18 j4.71 ± 0.25 k
L105.63 ± 0.17 b9.21 ± 0.14 ef5.75 ± 0.01 d10.68 ± 0.19 e
BL4.07 ± 0.03 d10.43 ± 0.24 c3.24 ± 0.07 f11.09 ± 0.49 e
Cross15.55 ± 0.28 b11.84 ± 0.27 b5.55 ± 0.04 d13.75 ± 0.26 b
Cross24.66 ± 0.25 c8.24 ± 0.15 gh4.56 ± 0.01 e8.86 ± 0.19 f
Smac7.37 ± 0.26 a6.33 ± 0.18 k8.92 ± 0.06 a7.27 ± 0.12 hi
CV 1 %6.332.053.441.69
HSD 20.09830.10490.08370.0876
1 CV, coefficient of variance; 2 HSD, Tukey’s honestly significant difference value.
Table 3. Content of the main chlorogenic acids (n-CA, CA and c-CA) in dried pulp and peel of 19 eggplant genotypes, expressed as mg per g of dry weight (dw). Values in columns followed by the same letter(s) are not significantly different according to Tukey’s multiple comparison test at significance level 0.05. Explanations for the genotypes’ abbreviations are given in Table A1.
Genotypen-CA
(mg/g dw)
CA
(mg/g dw)
c-CA
(mg/g dw)
PulpPeelPulpPeelPulpPeel
C10.104 ± 0.005 b0.174 ± 0.015 bc6.338 ± 0.019 d1.963 ± 0.058 n0.046 ± 0.003 b0.174 ± 0.014 h
C20.024 ± 0.004 f0.059 ± 0.005 bc3.079 ± 0.051 h3.624 ± 0.024 l0.014 ± 0.006 b0.136 ± 0.010 l
C30.017 ± 0.001 g0.110 ± 0.010 bc4.240 ± 0.070 g8.137 ± 0.058 b0.007 ± 0.007 b0.155 ± 0.015 j
Hyb10.019 ± 0.001 g0.356 ± 0.015 abc1.865 ± 0.035 jk4.065 ± 0.058 k0.034 ± 0.011 b0.471 ± 0.021 a
Hyb20.019 ± 0.004 g0.145 ± 0.015 bc2.022 ± 0.022 j7.090 ± 0.020 d0.022 ± 0.008 b0.225 ± 0.025 g
L1nd, 1,i0.079 ± 0.058 bc2.348 ± 0.049 i2.990 ± 0.090 m0.084 ± 0.014 ab0.106 ± 0.014 m
L20.002 ± 0.004 i0.548 ± 0.031 a1.574 ± 0.025 kl4.062 ± 0.062 k0.015 ± 0.005 b0.240 ± 0.025 e
L30.102 ± 0.016 b0.411 ± 0.011 ab10.424 ± 0.302 a6.559 ± 0.144 e0.036 ± 0.006 b0.147 ± 0.007 k
L4nd i0.284 ± 0.010 abc0.993 ± 0.003 mn5.200 ± 0.080 g0.014 ± 0.004 b0.166 ± 0.016 i
L5nd i0.131 ± 0.021 bc0.960 ± 0.059 mn4.511 ± 0.061 i0.015 ± 0.006 b0.087 ± 0.008 n
L60.014 ± 0.012 h0.067 ± 0.007 bc9.939 ± 0.060 b9.774 ± 0.075 a0.062 ± 0.013 b0.081 ± 0.011 o
L7nd i0.175 ± 0.015 bc0.877 ± 0.037 n5.250 ± 0.100 g0.014 ± 0.004 b0.080 ± 0.015 o
L8nd i0.097 ± 0.012 bc4.402 ± 0.002 fg4.266 ± 0.101 j0.013 ± 0.002 b0.057 ± 0.008 p
L90.001 ± 0.001 i0.381 ± 0.020 abc1.271 ± 0.129 lm1.855 ± 0.055 o0.013 ± 0.002 b0.035 ± 0.005 r
L100.034 ± 0.001 e0.110 ± 0.010 bc5.659 ± 0.180 e6.110 ± 0.011 f0.023 ± 0.005 b0.235 ± 0.005 f
BL0.025 ± 0.004 f0.205 ± 0.020 abc2.514 ± 0.015 i4.721 ± 0.019 h0.038 ± 0.007 b0.296 ± 0.026 c
Cross10.057 ± 0.004 d0.354 ± 0.010 abc5.500 ± 0.090 e7.669 ± 0.070 c0.022 ± 0.008 b0.293 ± 0.013 d
Cross20.066 ± 0.006 c0.131 ± 0.011 bc4.624 ± 0.086 f4.564 ± 0.082 i0.023 ± 0.002 b0.385 ± 0.015 b
Smac0.528 ± 0.031 a0.017 ± 0.005 c7.274 ± 0.095 c1.942 ± 0.042 no0.210 ± 0.030 a0.050 ± 0.010 q
CV 2 %16.359.542.450.7812.175.09
HSD 30.000580.065830.057740.018260.025820.00058
1 nd, non-detectable; 2 CV, coefficient of variance; 3 HSD, Tukey’s honestly significant difference value.
Table 4. Overview of the antioxidant capacity of extracts derived from pulp and peel of 19 eggplants genotypes determined as 2,2-azino-bis-(3-ethylbenzothia zoline-6-sulfonic acid) radical scavenging activity (ABTS), 2,2-diphenyl-1-picrylhydrazyl radical scavenging activity (DPPH), and ferric reducing antioxidant power (FRAP); all values are expressed as mg of trolox equivalent (TE) per g of dry weight (dw). Data represent the mean values ± standard deviation. Values in columns followed by the same letter(s) are not significantly different according to Tukey’s multiple comparison test at significance level 0.05. Explanations for the genotypes’ abbreviations are given in Table A1.
GenotypeABTS (mg TE/g dw)DPPH (mg TE/g dw)FRAP (mg TE/g dw)
PulpPeelPulpPeelPulpPeel
C18.98 ± 0.14 cd10.17 ± 0.60 hi7.11 ± 0.09 c8.01 ± 0.21 k8.74 ± 0.17 b8.06 ± 1.45 h
C24.85 ± 0.11 hij15.54 ± 2.61 cdefg3.20 ± 0.06 g10.99 ± 0.35 ef4.16 ± 0.15 fg15.73 ± 3.01 defg
C36.27 ± 0.22 fg20.47 ± 3.08 ab4.25 ± 0.07 f15.01 ± 0.17 c5.24 ± 0.12 e23.90 ± 1.37 a
Hyb14.29 ± 0.14 ijk16.79 ± 2.73 bcde2.71 ± 0.05 h14.87 ± 0.23 c3.95 ± 0.16 fg18.02 ± 1.76 cde
Hyb23.65 ± 0.12 jkl24.87 ± 4.70 a2.63 ± 0.02 h18.74 ± 0.36 a3.21 ± 0.16 h23.61 ± 2.01 ab
L15.41 ± 0.53 gh10.84 ± 1.87 ghi3.19 ± 0.04 g9.33 ± 0.37 hi3.73 ± 0.14 g10.82 ± 0.43 gh
L23.66 ± 0.06 jkl13.92 ± 2.34 defghi2.42 ± 0.20 hi11.71 ± 0.29 ef2.86 ± 0.16 hi17.32 ± 0.56 cde
L310.03 ± 0.22 ab16.18 ± 1.36 bcdef8.07 ± 0.14 b13.69 ± 0.43 d9.47 ± 0.29 a16.37 ± 1.81 cdef
L43.66 ± 0.72 jkl17.58 ± 3.99 bcd1.81 ± 0.16 jk13.67 ± 0.10 d2.29 ± 0.17 jk19.06 ± 4.32 abcd
L53.26 ± 0.19 l10.07 ± 1.94 hi2.05 ± 0.14 ij8.82 ± 0.12 ijk2.68 ± 0.11 ij11.09 ± 0.87 gh
L69.55 ± 0.13 bc16.70 ± 1.74 bcde7.43 ± 0.14 c14.44 ± 0.57 cd8.96 ± 0.27 b21.05 ± 0.01 abc
L72.97 ± 0.08 l11.54 ± 2.21 fghi1.58 ± 0.08 k9.92 ± 0.29 gh2.23 ± 0.06 k10.99 ± 1.03 gh
L86.15 ± 0.71 fg10.32 ± 0.98 hi4.29 ± 0.14 f9.62 ± 0.53 hi5.16 ± 0.07 e10.25 ± 0.57 h
L93.39 ± 0.13 kl11.04 ± 1.77 ghi2.22 ± 0.14 i8.22 ± 0.20 jk2.38 ± 0.07 jk9.21 ± 0.25 h
L107.50 ± 0.18 e12.58 ± 1.65 efghi5.47 ± 0.10 d10.66 ± 0.12 fg6.15 ± 0.08 d13.03 ± 1.91 efgh
BL4.58 ± 0.16 hij16.86 ± 2.66 bcde3.10 ± 0.04 g15.05 ± 0.03 c3.99 ± 0.21 fg20.14 ± 0.91 abcd
Cross18.09 ± 0.03 de19.86 ± 2.68 bc5.08 ± 0.24 e16.83 ± 0.22 b6.59 ± 0.06 c18.63 ± 2.15 bcd
Cross26.42 ± 0.02 f14.48 ± 2.28 defgh4.27 ± 0.01 f9.13 ± 0.33 hij5.15 ± 0.03 e11.68 ± 0.14 fgh
Smac10.57 ± 0.20 a9.13 ± 1.76 i9.04 ± 0.18 a9.99 ± 0.33 gh9.42 ± 0.05 a10.34 ± 0.78 h
CV 1 %5.0610.482.942.632.7010.68
HSD 20.17420.88840.07070.18260.07960.9390
1 CV, coefficient of variance; 2 HSD, Tukey’s honestly significant difference value.
Table 5. Correlation matrix (Pearson correlation coefficients r) of the physicochemical traits, bioactive compounds, and antioxidant capacity of 19 eggplant genotypes.
ParametersDM 1,2pHTSSTATPC-PulpTPC-PeelTFC-PulpTFC-PeelTAC-PeelABTS-PulpABTS-PeelDPPH-PulpDPPH-PeelFRAP-PulpFRAP-PeelCA-Pulpn-CA-Pulpc-CA-PulpCA-Peeln-CA-Peelc-CA-Peel
DM1−0.0070.106−0.676 **−0.0830.045−0.084−0.0130.033−0.0410.140−0.0730.063−0.0510.0320.028−0.187−0.1200.185−0.103−0.345
pH 1−0.166−0.319−0.066−0.068−0.088−0.248−0.043−0.080−0.161−0.091−0.055−0.0850.0190.035−0.305−0.2290.0550.387−0.252
TSS 10.0500.1170.4490.01210.509 * 3−0.1840.1710.3690.0910.3780.0930.2500.123−0.001−0.0910.436−0.780.143
TA 10.2130.1550.1910.2080.1650.1560.1450.1710.1210.1760.2280.0860.1530.0940.023−0.2190.254
TPC-pulp 10.0470.991 **0.1940.0290.987 **−0.0820.985 **0.0320.993 **−0.0510.954 **0.567 *0.553 *0.174−0.221−0.076
TPC-peel 1−0.0030.915 **0.1800.0140.930 **−0.0370.958 **0.0330.897 **0.128−0.293−0.3030.778 **0.1960.524 *
TFC-pulp 10.161−0.0070.991 **−0.1190.995 **−0.0040.993 **−0.0870.949 **0.637 **0.597 **0.162−0.255−0.126
TFC-peel 1−0.0370.1730.764 **0.1250.856 **0.1840.742 **0.244−0.117−0.1010.782 **−0.0090.497 *
TAC-pulp 1−0.0520.346−0.0270.2390.0430.243−0.045−0.138−0.230−0.0670.1290.143
ABTS-pulp 1−0.1040.985 **0.0080.986 **−0.0800.952 **0.606 **0.586 **0.188−0.241−0.118
ABTS-peel 1−0.143−0.0220.989 **−0.1040.944 **0.668 **0.641 **0.127−0.244−0.170
DPPH-pulp 10.928 **−0.0840.919 **0.005−0.280−0.3330.694 **0.1760.459 *
DPPH-peel 10.0330.925 **0.096−0.141−0.1410.706 **0.2100.424
FRAP-pulp 1−0.0540.960 **0.589 **0.563 *0.189−0.219−0.103
FRAP-peel 10.042−0.253−0.2290.744 **0.1590.364
CA-pulp 10.4320.4200.359−0.175−0.129
n-CA-pulp 10.899 **−0.313−0.262−0.75
c-CA-pulp 1−0.304−0.336−0.240
CA-peel 1−0.0350.127
n-CA-peel 10.334
c-CA-peel 1
1 DM, dry matter; TSS, total soluble solids; TA, total acidity; TPC, total phenolic content; TFC, total flavonoid content; TAC, total monomeric anthocyanin content; ABTS, 2,2-azino-bis-(3-ethylbenzothiazoline-6-sulfonic acid); DPPH, 2,2-diphenyl-1-picrylhydrazyl radical scavenging activity; FRAP, ferric reducing antioxidant power; CA, chlorogenic acid. 2 Measurements for the physicochemical traits were taken in fruit pulp, while the rest of the measurements were taken in both pulp and peel. 3 ** and * indicate significance at 0.01 and 0.05 significance level, respectively.
Publisher’s Note: MDPI stays neutral with regard to jurisdictional claims in published maps and institutional affiliations.

