Article

Consideration of Maillard Reaction-Based Time–Temperature Indicator (TTI) to Visualize Shelf Life of Cold-Stored Strawberries

1
Department of Agricultural Engineering, National Institute of Agricultural Sciences, Jeonju 54875, Korea
2
Department of Biosystems Engineering, Chungbuk National University, Cheongju 28644, Korea
*
Author to whom correspondence should be addressed.
Horticulturae 2022, 8(10), 979; https://doi.org/10.3390/horticulturae8100979
Submission received: 27 September 2022 / Revised: 17 October 2022 / Accepted: 19 October 2022 / Published: 21 October 2022
(This article belongs to the Special Issue Quality and Safety of Fresh Fruits and Vegetables)

Abstract

:
In this paper, the potential of a Maillard reaction-based time–temperature indicator (TTI) as a device for the visualization of shelf life was evaluated by comparing the quality variations of cold-stored strawberries and the color changes of Maillard reaction solutions. The color variations of the Maillard reaction solutions stored in the same storage environment as the cold-stored strawberries showed suitable characteristics for the visualization of shelf life, such as pronounced color changes, a wide-ranging color variation rate, and activation energy. In particular, the concentrations of the reaction solutions with the combinations of 3.0 M D-xylose, 1.5 M glycine, and 0.3 M Na2HPO4; 2.0 M D-xylose, 1.5 M glycine, and 0.3 M Na2HPO4; and 4.0 M D-xylose, 1.0 M glycine, and 0.3 M Na2HPO4 were suitable for the visualization of the weight loss variation, color difference variation, and appearance damage. These concentrations showed similar color variations and Arrhenius activation energies to the variation of the quality characteristics, such as weight loss and color difference. Additionally, a Maillard reaction-based time–temperature indicator (TTI) has a wide applicability to other agricultural products using the wide range of the color change rate and the activation energy.

1. Introduction

Temperature is an important factor affecting the quality of food. The quality reduction and spoilage of foods may occur by the mismanagement of temperature [1]. Moreover, shelf life, which exists for most foods, cannot be completely trusted because the food might have been exposed to inappropriate storage conditions, such as a temperature abuse and being in storage for excessive periods of time [2,3]. Therefore, the monitoring of time and temperature during storage and transportation is important to ensure the freshness and safety of food. A time–temperature indicator (TTI) is a simple and economical device that can indirectly provide information on the shelf life of food with time- and temperature-dependent visual responses [1,4]. That is, the quality and freshness of food can be determined by visually monitoring the color change in a TTI. Several studies have been conducted to develop the TTI by using various methods, such as chemical TTIs, physical TTIs, enzymatic TTIs, microbial TTIs, and so on [1,3]. Pandian et al. [5] reviewed the theoretical aspects of the developed enzymatic TTI devices for their application in quality monitoring and the shelf-life estimation of food products during storage, and the enzymatic TTIs were developed based on various enzymes such as including lipase, amylase, phospholipase, urease, and laccase. Zhang et al. [2] reviewed the response mechanism, application, and research trends of microbial TTIs. The microbial TTIs reflect the bacterial growth and metabolism by microbial food spoilage and were developed using A L.sakei strain, lactic acid bacteria, Weissella cibaria CIFP 009, and Weissella koreensis. Wang et al. [6] reported that TTIs can basically provide effective information about food quality, but have some problems such as the migration of toxic substances, the inaccuracy of temperature monitoring, and the high cost in the area of commercial application. For the use of the TTI system in food quality management, several factors, such as time- and temperature-dependent irreversible responses, a high visibility, compactness, a low cost, a simple mechanism, consistency, a good connection with quality variation, non-toxicity, and so on, should be considered [5]. As a material that satisfies these requirements, we focused on a Maillard reaction-based TTI. The Maillard reaction produces a brown substance called melanoidin via a reaction between the reducing sugars and amino acids [7], and it is observed as the browning in food processes, such as coffee roasting, bread baking, and meat cooking [8]. Additionally, the Maillard reaction rate can be adjusted over a wide range by temperature, pH, and the type of reactants and their concentrations [8]. In previous studies, Maillard reaction-based TTIs have shown various possibilities, such as monitoring cooking temperature [9], predicting the maturity of melon cultivation [10], monitoring the quality variation of the long-term storage of chilled beef [11], and monitoring the deterioration in the quality of frozen food during distribution [4]. Moreover, the reactivity of the Maillard reaction has also been studied in a wide temperature and concentration range [12]. In order to confirm its actual applicability, the color change characteristic should be analyzed in the same storage environment as stored food and compared with variations in food quality.
Strawberry, among various agricultural products, is an extremely popular agricultural product in Korea. However, strawberry has a short shelf life of 3–7 days at a temperature of 0 °C and 1–2 days at room temperature [13]. The shelf life of stored strawberries can be visually determined by the occurrence of signs of decay, such as gray mold and soft rot [14]. However, the occurrence of signs of decay indicates that it is already dangerous to eat the strawberries. The determination of the remaining shelf-life is needed for the safe consumption of strawberries; however, this is difficult to achieve because the temperature history and the storage period cannot be visually known. We considered that the shelf life and safety of cold-stored strawberries can be visualized by using a Maillard reaction-based TTI.
We aimed to investigate the relationship between the quality variations of cold-stored strawberries and the color changes of the Maillard reaction solutions in order to determine the potential of a Maillard reaction-based TTI as a device for the visualization of shelf life and safety.

2. Materials and Methods

2.1. Samples and Low-Temperature Storage

Ripe strawberry (Fragaria × ananassa Duch. cv. Seolhyang) was harvested from a local producer in Cheongju, Chungbuk, Korea. Strawberries without any damage, such as physiological disorders, fungal infections, or other pollution, were selected and were dried on paper towels after cleaning with distilled water. Additionally, those were packaged in polystyrene trays and stored in the refrigerator (R-B425GB, LG, Seoul, Korea) within 4 h after harvest. The temperature conditions for storage were set to 1, 4, and 7 °C. During storage, we measured the appearance change and the physical characteristics of the strawberry, such as the weight loss, color difference (ΔE), and total soluble solid content (SSC), which were measured at the same time interval as obtaining the digital images of the reaction solution. The weight loss, color difference, and appearance damage were measured as time-series data using ten randomly selected strawberry fruits. The SSC was measured using five randomly selected strawberry fruits in every experiment.
The fruit weight was measured using an electronic scale (HF-200GD, AND, Tokyo, Japan) and the weight loss was calculated as a percentage of the fruit weight between day zero and each time interval [15]. The SSC of the strawberry juice was determined using a digital refractometer (PAL-1, Atago Co. Ltd., Tokyo, Japan), and the digital refractometer was calibrated with distilled water before each measurement [16]. The appearance damage was used as a factor of visual evaluation during storage and was expressed as the percentage of strawberries with signs of decay, such as gray mold and soft rot [14,17]. The color characteristics of the fruit surface were assessed using a portable colorimeter (Cd-2500d, Konica Minolta, Tokyo, Japan) to determine the L * value (lightness), a * value (redness; red-green), and b * value (yellowness; yellow-blue) [16,17]. The L *, a *, and b * values of the standard plate were 98.01, 0.08, and 0.06, respectively. The total color difference (ΔE) was calculated using Equation (1) [18]:
Δ E = Δ L 2 + Δ a 2 + Δ b 2
where ΔE is the total color difference, and ΔL, Δa, and Δb are the changes in L *, a *, and b * values between day zero and each time interval, respectively.
The weight loss, color differences, and appearance damage were measured ten times for each sample and were expressed as the average values. The SSC was measured five times for each sample and were expressed as the average values.

2.2. Preparation of Maillard Reaction Solution for TTI

D-xylose and glycine (Samchun Chemical Co., Ltd., Seoul, Korea) were used as reactants for the Maillard reaction. These reactants are known to be suitable TTIs, as they have several advantages, such as a low cost, excellent reactivity, and pronounced color changes [12,19]. The reactant concentrations used in this study were as follows: D-xylose: 2.0, 3.0, and 4.0 M, and glycine: 0.5, 1.0, and 1.5 M. In addition, disodium hydrogen phosphate (Na2HPO4, Samchun Chemical Co. Ltd., Seoul, Korea) with 0.3 M was used as a reaction accelerator to improve the reactivity at low temperatures. Then, the reaction solutions were moved to a 96-well microplate for a measurement of the color variation according to the reaction concentrations, and they were placed together in a refrigerator where the strawberries were stored. Accordingly, strawberries and reaction solutions were stored under the same conditions such as the period, place, and temperature.

2.3. Color Variation of the Reaction Solution

The red, green, and blue (RGB) color data of the reaction solution obtained from the digital images were used to analyze the color variation by the storage temperatures [12]. The digital images of the microplate, which contained the reaction solutions, were taken using a smartphone camera (iPhone SE ver. 2, Apple Corp., CA, USA), and were separated according to the reaction concentrations. Then, the images of the reaction solution were obtained from the separated digital images. Figure 1 shows a digital image of the microplate used for the color variation analysis of the reaction solutions. The images of the reaction solution were taken at intervals of 2 days at 1 °C temperature and every day at 4 °C and 7 °C temperatures under the same conditions: the same light source and a 150 mm vertical distance from the microplate. In addition, Python program (Ver. 3.9) was used to analyze the images.

2.4. Activation Energy

Activation energy was used to evaluate the reaction solutions according to the reaction concentration during a low-temperature storage, and it was determined using Equation (2) according to the Arrhenius function, expressing the temperature dependence of all the reaction conditions and the qualities of the strawberry [20,21].
ln k = E a R T + ln A
where k is the slope of the results using linear regression for the color variation of the reaction solution and the quality variation of the stored strawberry. E a is the activation energy, and A is the pre-exponential factor. R and T are the universal gas constant ( 8.314   J / M · K )   and absolute temperature (K), respectively. The slope ( E a / T ) and pre-exponential factor were estimated using linear regression [21,22].

2.5. Statistical Analysis

The data were analyzed using a one-way analysis of variance, and the Python program was used to analyze the data. Differences according to the different conditions were established using the Tukey–Kramer multiple range test with a significance level of p < 0.5.

3. Results and Discussion

3.1. Color Variation of Maillard Reaction Solution

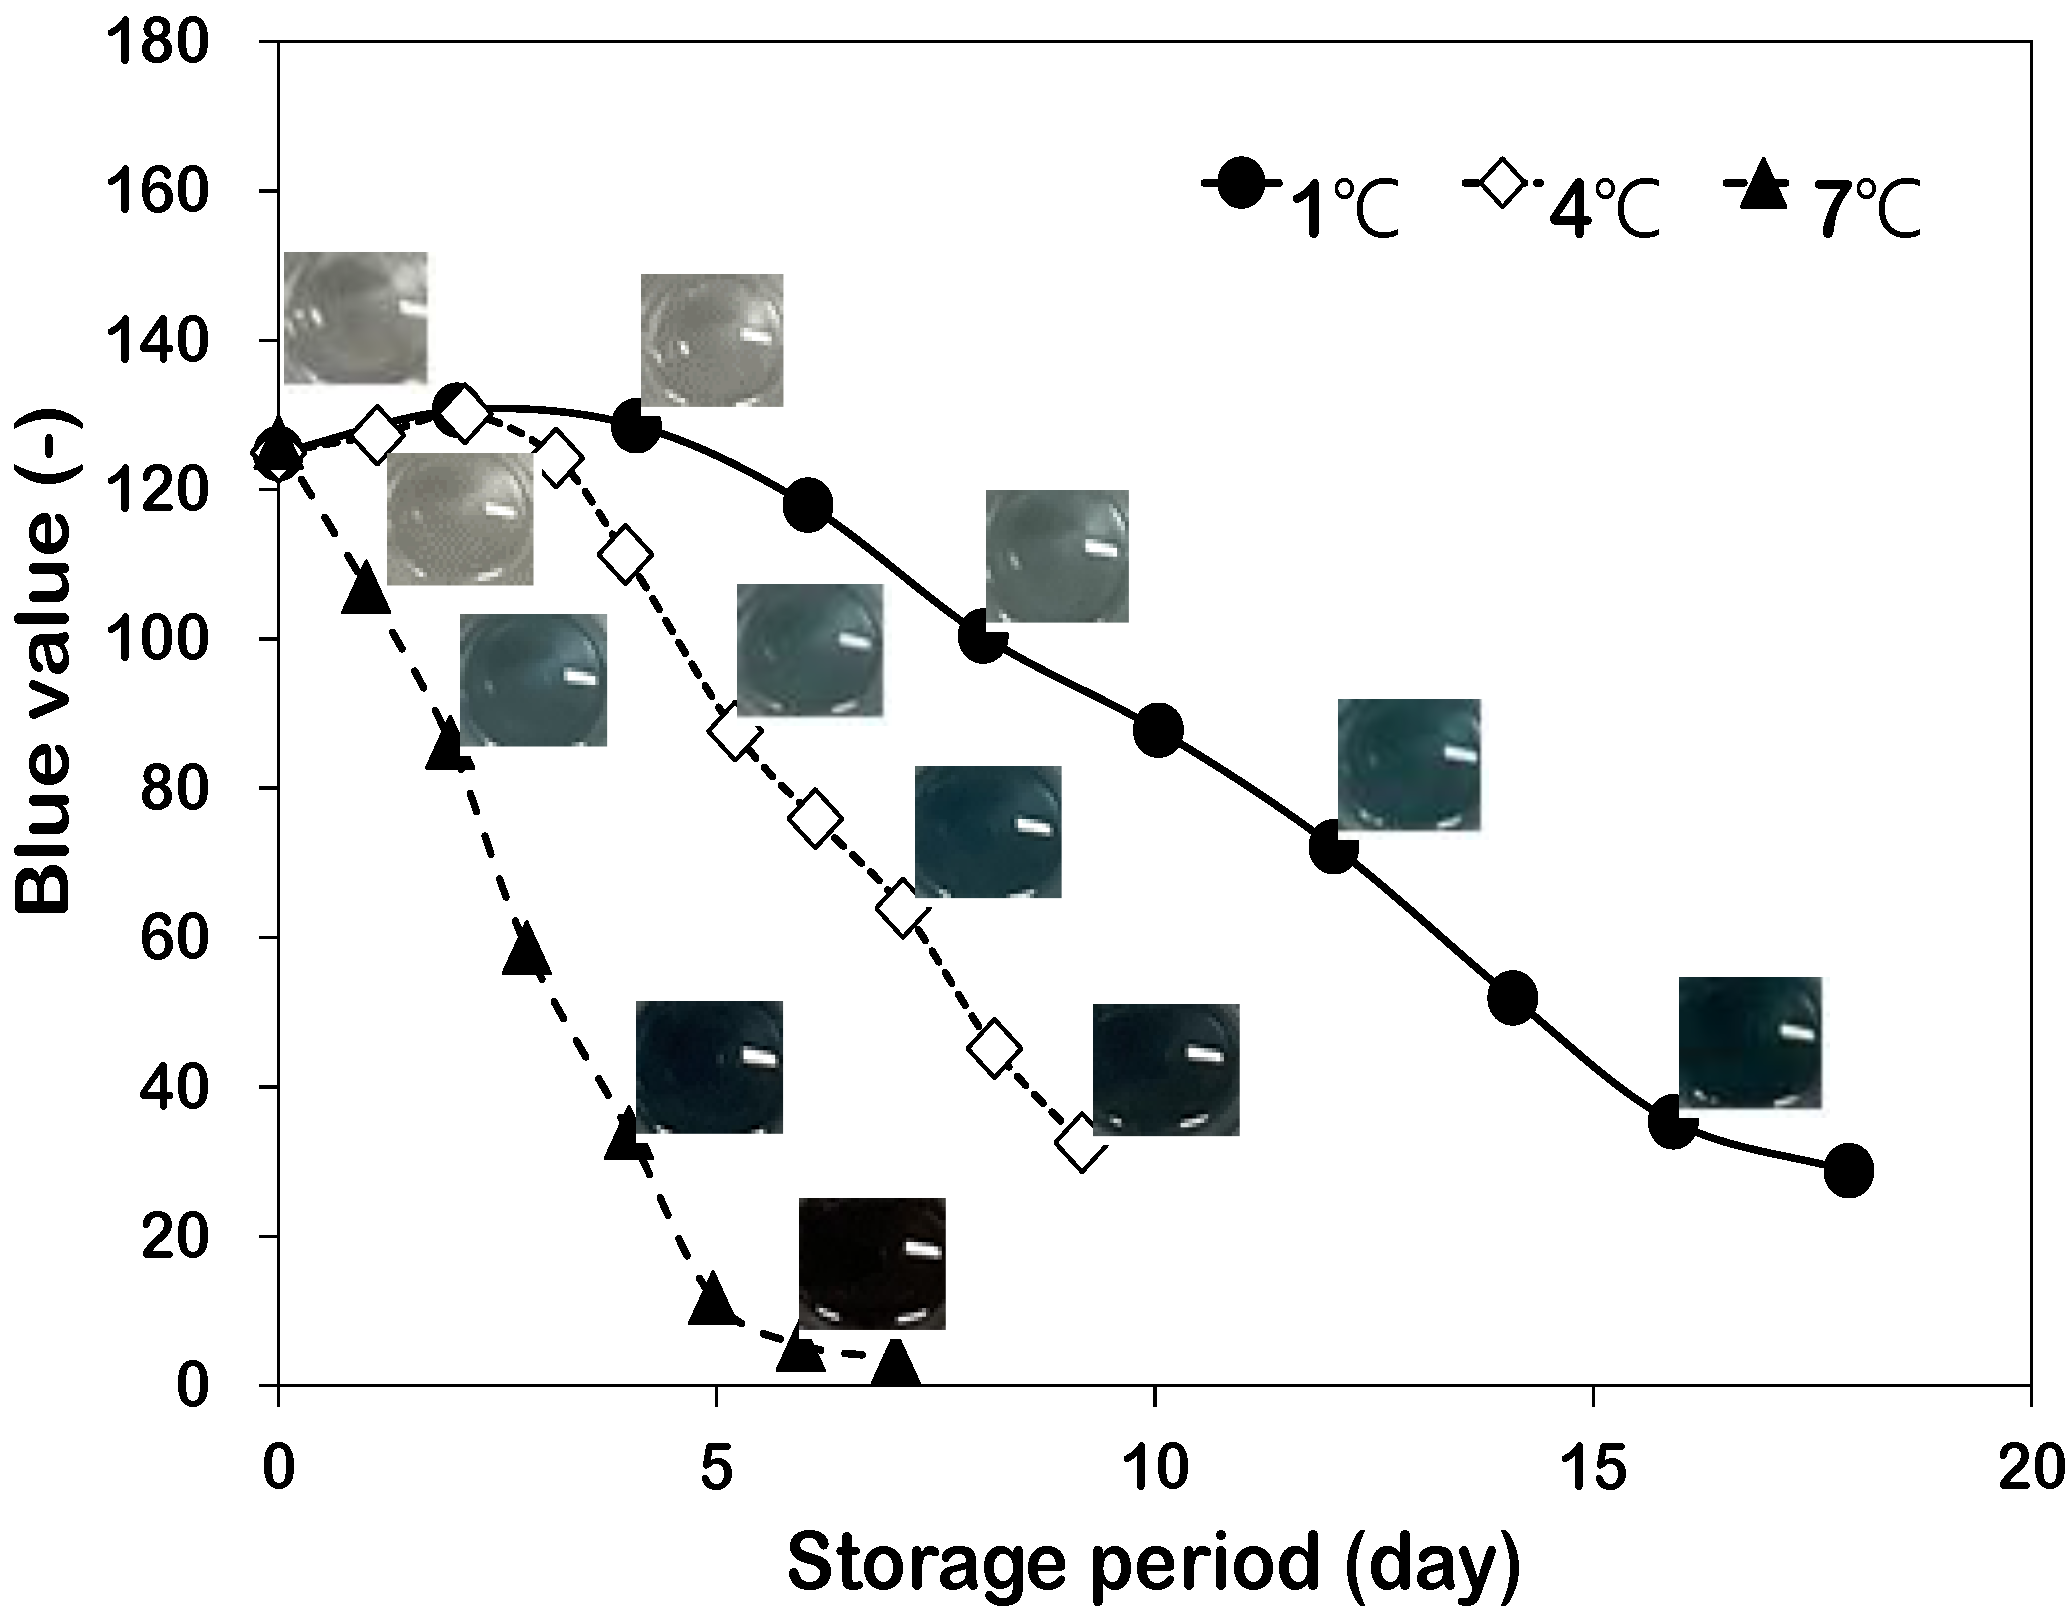
The color variation of the Maillard reaction solution was highly visible, and it was influenced by the temperature and reactant concentration. Figure 2 shows the actual TTI images, as well as the blue value extracted from the digital images of the Maillard reaction solution consisting of 3.0 M D-xylose, 1.0 M glycine, and 0.3 M Na2HPO4. As shown in Figure 2, the color of the TTIs changed from colorless to black via the change in light blue, blue, and dark blue. Commonly, browning is observed through the Maillard reaction, but in this study, the reaction solution showed a color change from colorless to blue according to the storage period. These results were obtained with Na2HPO4, which was used as a reaction accelerator because the blue-colored pigments denoted by Blue-M1, Blue-M2, and Blue-M3 were generated by a slightly alkaline medium containing sodium bicarbonate [23]. In addition, Figure 2 shows the effect of the reaction temperature on the color change rate of the reaction solution. The Maillard reaction solutions showed a faster color change rate with higher reaction temperatures due to time- and temperature-dependent irreversible responses. The color variations of the RGB color data showed a similar tendency to the result of the Maillard reaction solutions, and the color data changed faster with higher temperatures.
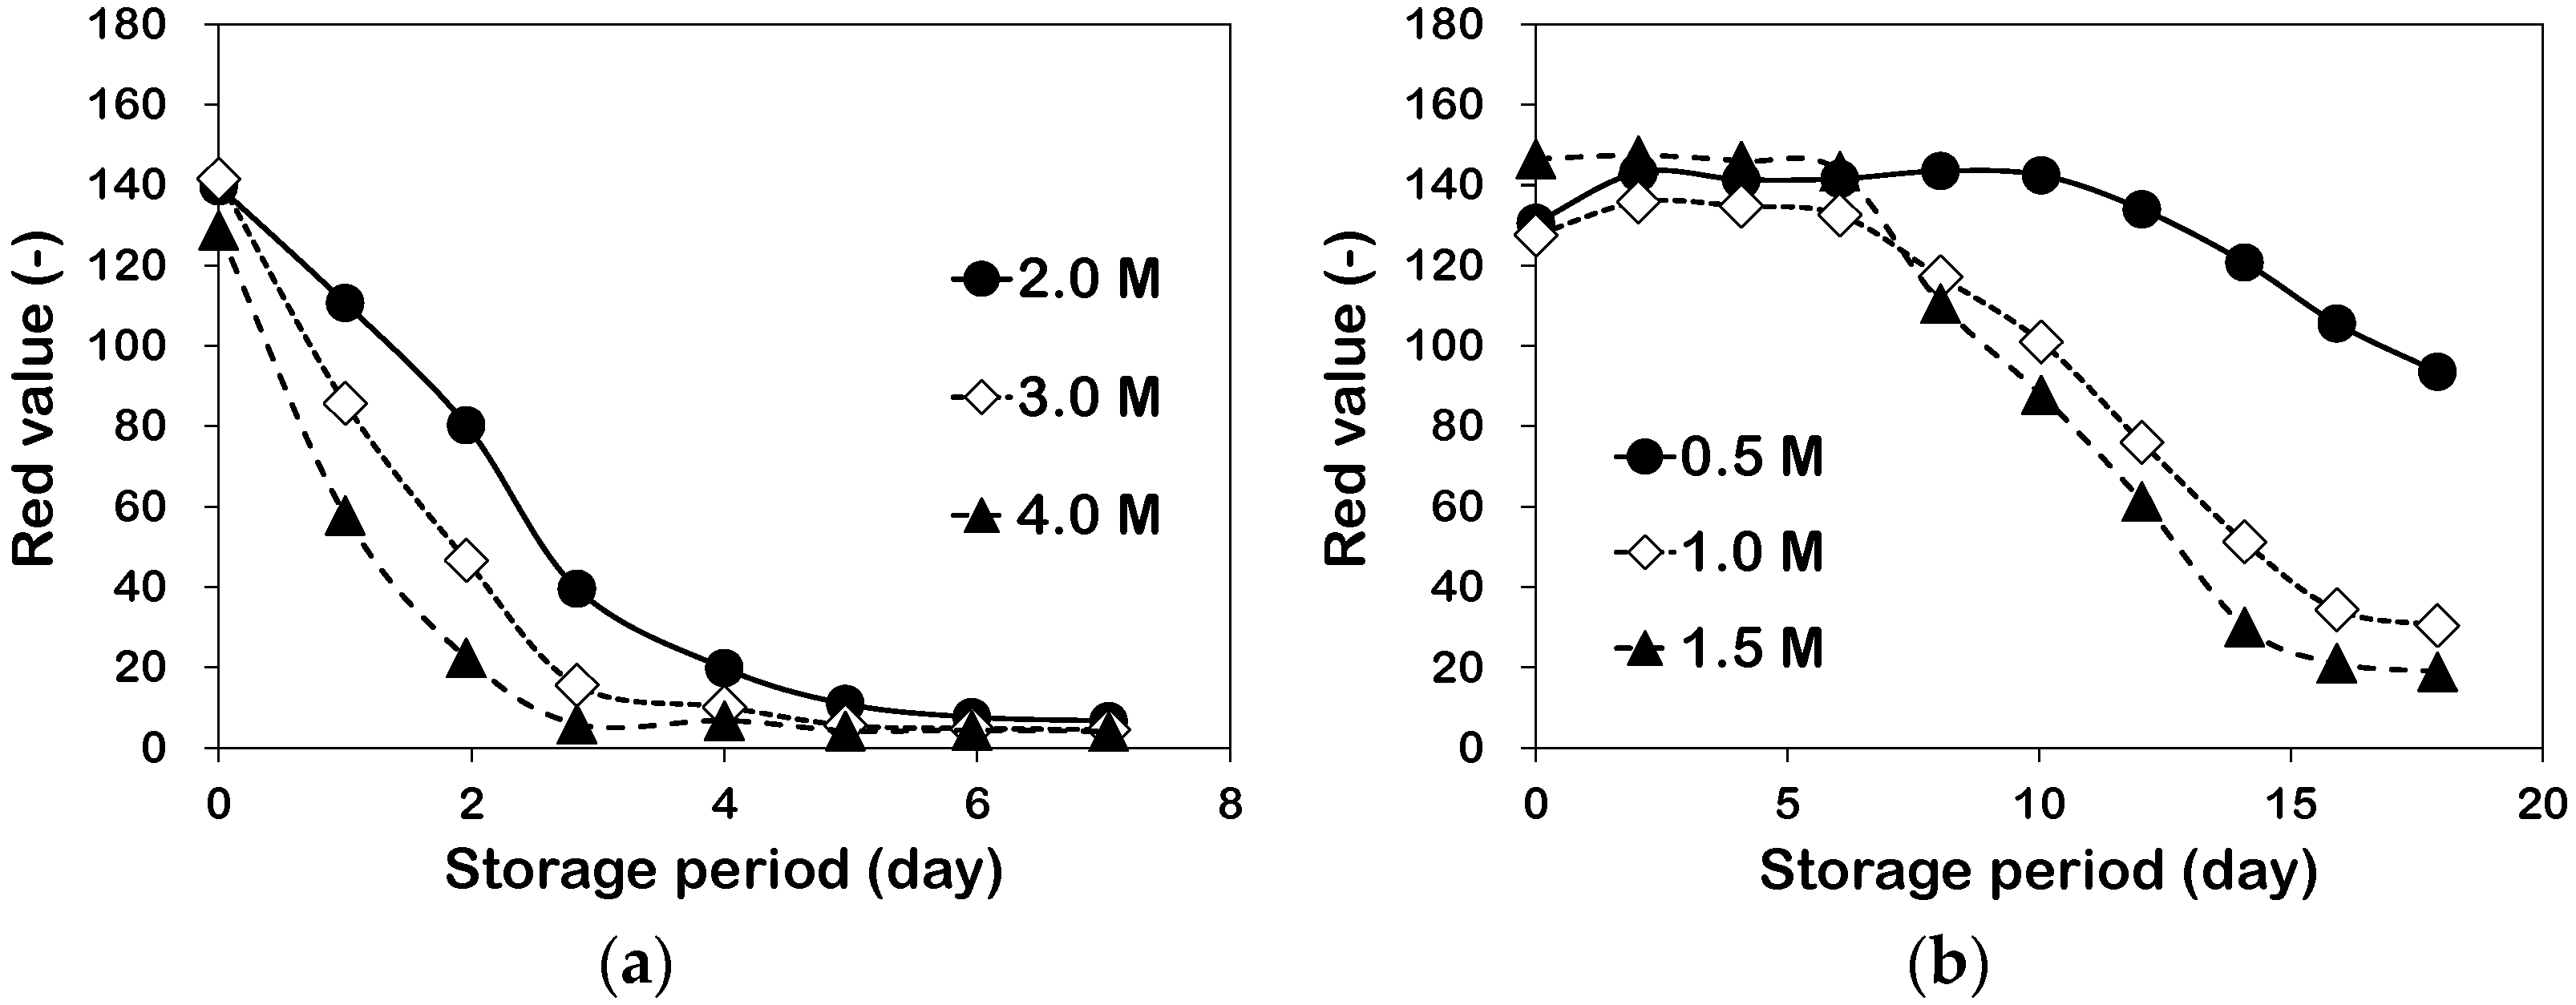
The color change kinetics were influenced by the reactant concentration, and the color variation rate increased with higher concentrations. Figure 3 shows the difference in the red color variation according to the reaction concentrations of D-xylose (a) and glycine (b). As shown in Figure 3, the color variation rate was higher with higher concentrations. The Maillard reaction solution showed various reaction rates according to the storage temperature of the strawberries and the reactant concentration. In particular, the black color in the reaction solution was observed after 4 days in the highest concentration solution, which had 4.0 M D-xylose and 1.5 M glycine, stored at the highest temperature of 7 °C, and it developed the most rapidly among all the conditions. However, only a blue color, even after 18 days, was observed under the lowest conditions, the concentration solution with 2.0 M D-xylose and 0.5 M glycine and a storage temperature of 1 °C. Significant differences were found among all the reaction conditions (p < 0.05). These results are similar to a previous study. Lee et al. [12] reported that the color change kinetics of the reaction by D-xylose, glycine, and Na2HPO4 was accelerated by the increases of temperature and reactant concentration, and at a reaction storage temperature of 0 °C, the reaction completion time was 18 to 61 days. In addition, when the reaction solutions with blue were observed for long periods, then the reaction solutions will be changed to a black color.
We could confirm by the above results that the color of the reaction solution changes according to the storage temperature and period, and the reaction rate can be adjusted by controlling the reaction temperature and concentration. Thus, it is considered that the quality variations of the strawberries can be predicted using the reaction solution of the concentration with a similar variation pattern or characteristic to the quality variation of the strawberries. Based on above results, the reaction concentration which can visualize the shelf life of strawberries was confirmed by making a comparison between the quality variation of the strawberries and the color variation of the reaction solution.

3.2. Relationship between Quality Characteristics and TTI

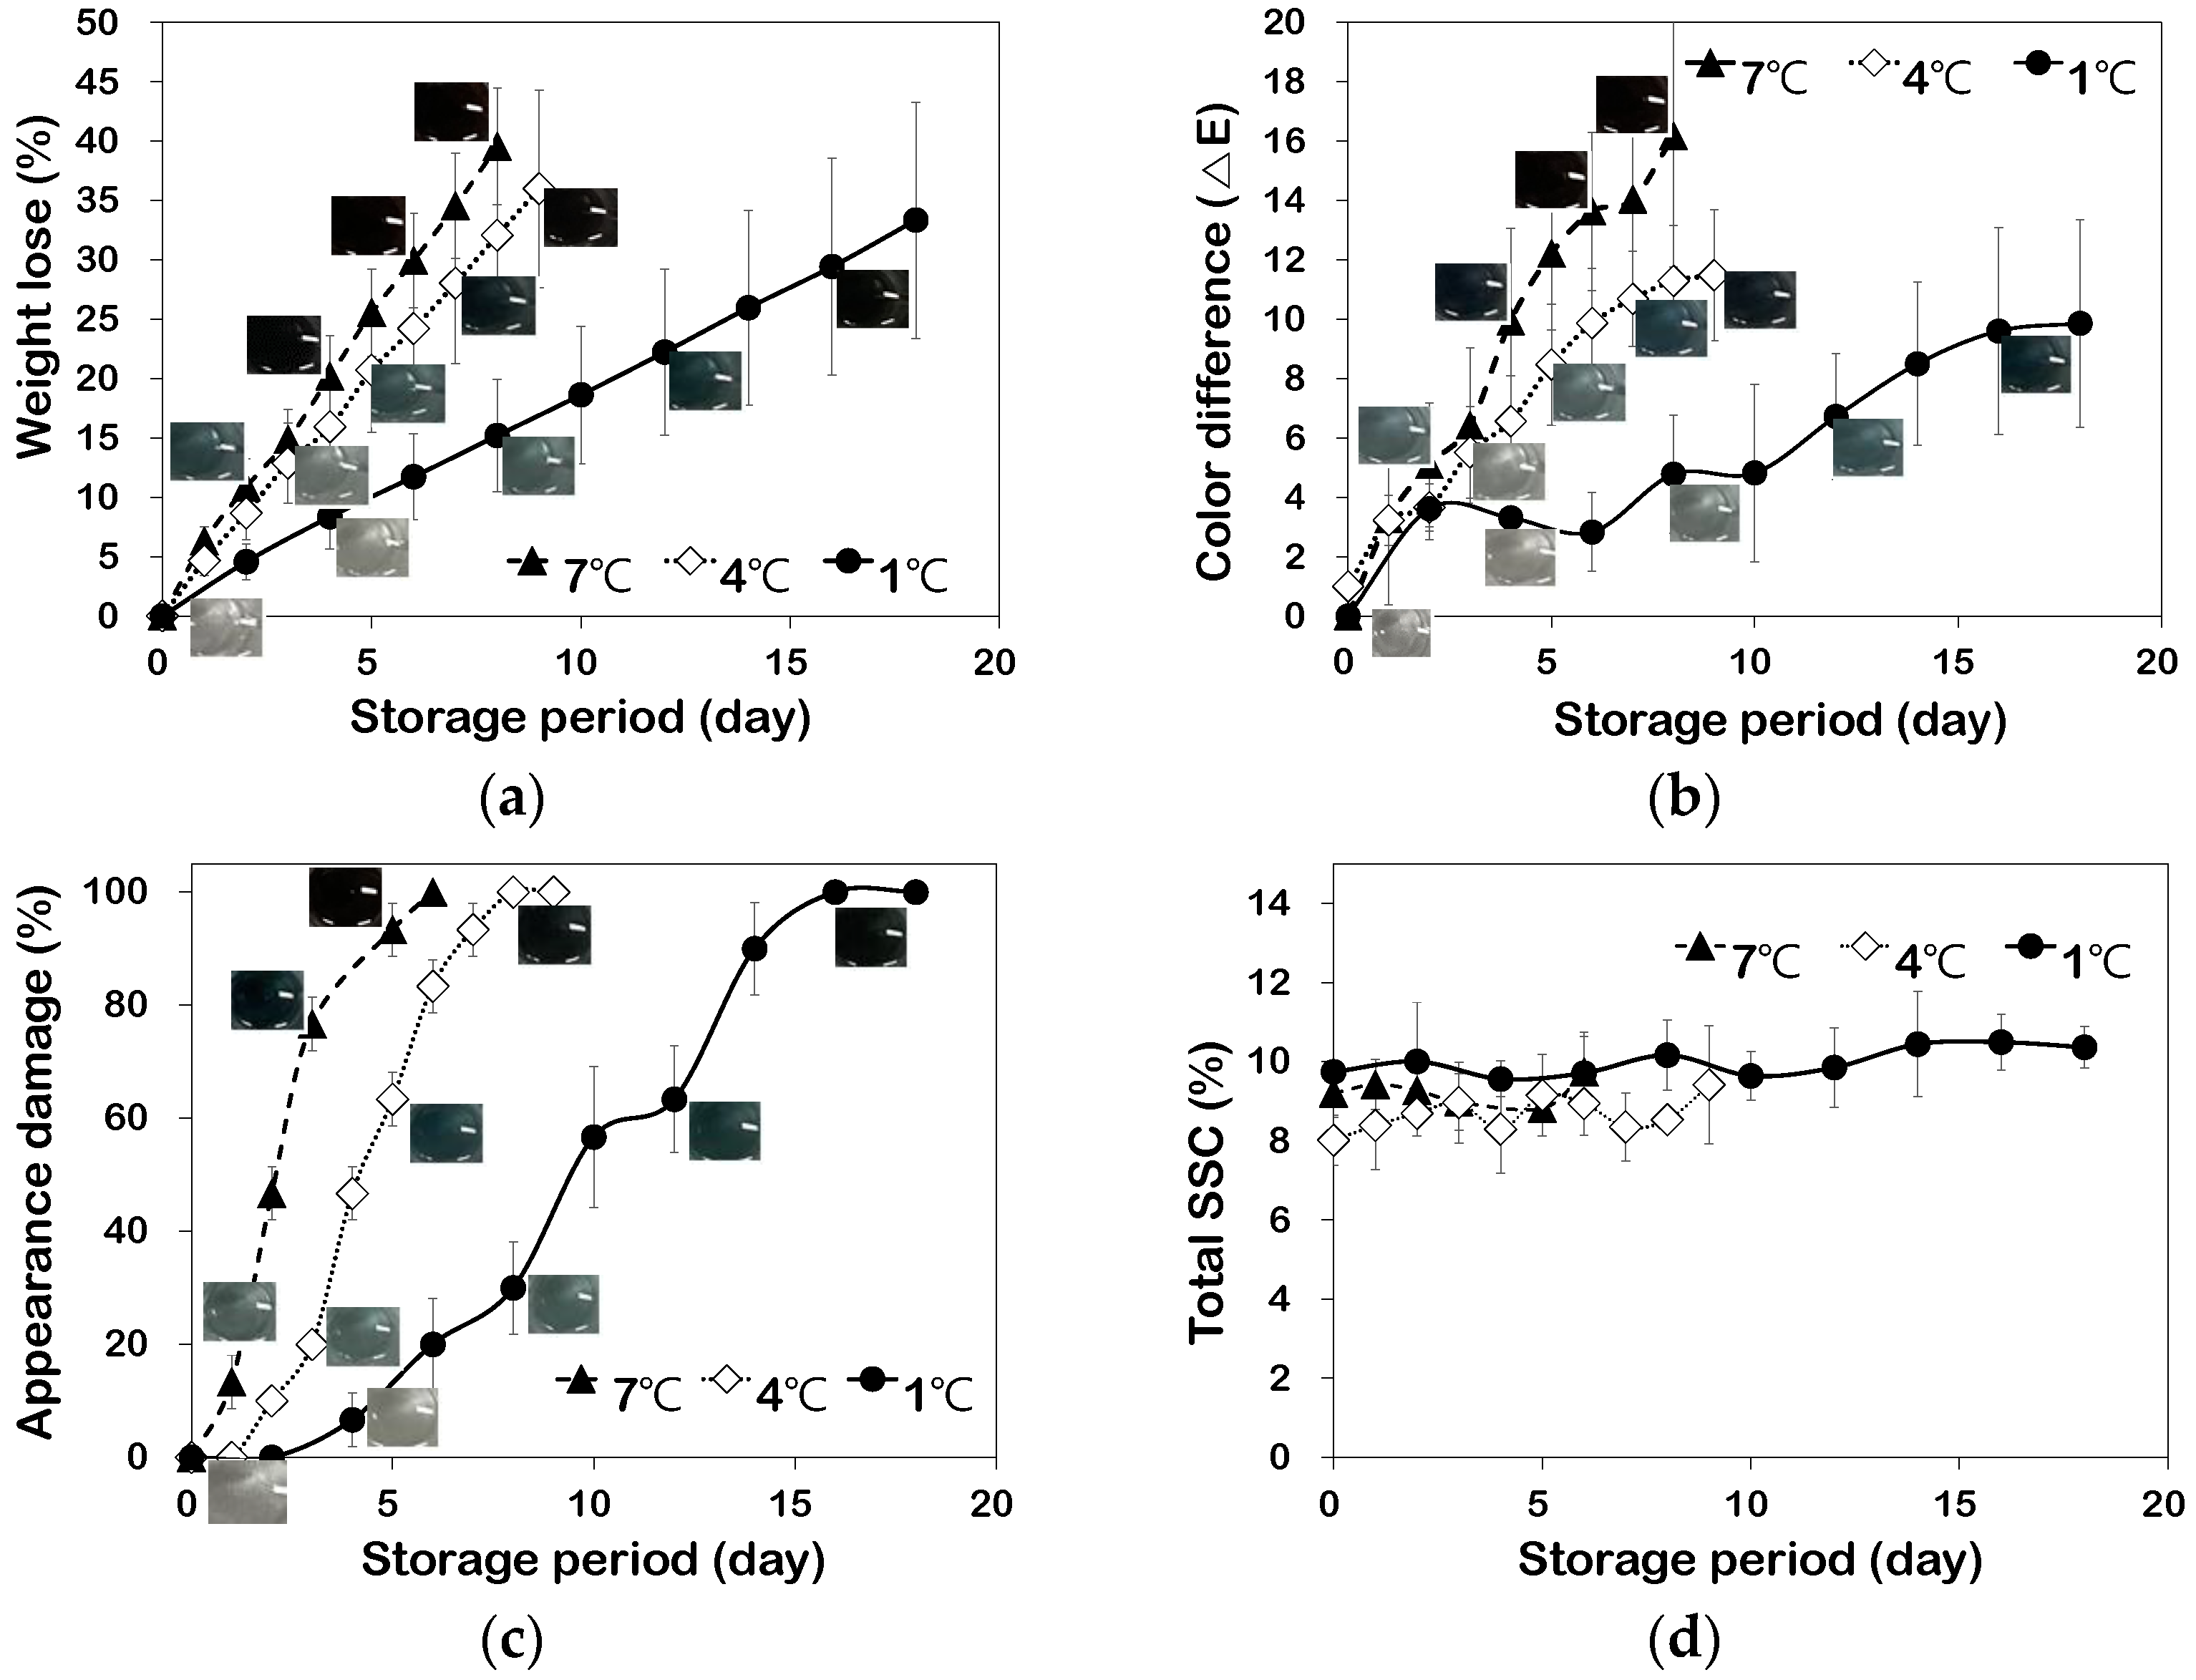
The weight loss, color difference, and appearance damage of strawberries increased during the storage period as shown in Figure 4a–c, respectively, and the variation rate of the measurements increased with the higher temperatures. The SSC values did not significantly change compared with the initial values of all the conditions (Figure 4d).
Weight loss is an important factor relative to the perishability of strawberries, because it is mainly related to the respiration rate and evaporation of moisture through the fruit skin [24,25]. Weight loss increased with the storage period, and this result is similar to that found in a previous study. This may be related to moisture loss and the occurrence of gray mold and soft rot in the strawberries [26,27]. In particular, the weight loss rate increased as the storage temperature increased. Thus, the increase in the weight loss rate during high-temperature storage may be related to an increase in the perishability rate or quality deterioration.
The color of strawberries, which is the first consumer-rated feature, is considered an important factor relative to the external quality and appearance of strawberries [24]. The color difference of the strawberry surfaces increased as the storage temperature and the storage period increased, and it showed a similar tendency to the weight loss results. It is considered that these results are because the skin color of the strawberries changed to dark red as the storage period increased [26]. In addition, these changes were probably due to a reduction in both the respiration rate and some enzymatic processes preventing the strawberry fruit from browning, as well as other reactions [28].
The appearance damage of fruits can be used as a factor to determine the shelf life. When gray mold or rot disease occurs, consumers are discouraged from purchasing the fruit, and it rapidly spreads to other healthy fruits. In addition, it can cause an increase in strawberry waste [27]. The percentage of the appearance damage of the strawberries rapidly increased with the higher temperature during storage. The appearance damage at the storage temperatures of 1, 4, and 7 °C occurred on day 4, day 2, and day 1, respectively. The appearance damages, such as gray mold and soft rot, are related to physiological changes, biochemical changes, and pathological deterioration [27]. In particular, the physiological and biochemical changes are affected by temperature, and, thus, the appearance damages also showed differences according to the storage temperature. There were significant differences between the weight loss, color difference, and appearance damage (p < 0.05). Meanwhile, the SSC showed a tendency to increase, but there was no significant difference, as a p value over 0.05 was found in the statistical analysis. There was no significant difference in the SSC, despite the weight loss of the strawberries increasing. Moreover, this result has been reported in previous studies [29,30].
The Maillard reaction-based TTI was evaluated for its ability to visualize the shelf life of strawberries during cold storage. For this reason, the relationship between the strawberry quality and the reaction solution color was analyzed. The color changes of the reaction solution are shown in Figure 4. We selected the reaction solution concentration by considering the relationship between the quality changes in the strawberry, the color changes in the reaction solution, and the activation energy value. As shown in Figure 4, the color changes in the Maillard reaction solution could visually indicate the quality variation of weight loss (a), color difference (b), and appearance damage (c) during cold storage. Our TTI indicates a dark blue color or black color when the weight loss is over 20% or appearance damage occurs. Thus, it was considered that the shelf life of strawberries during the cold storage can be determined by the color of the Maillard reaction-based TTI. Moreover, the shelf life can be visualized in other colors, such as color revelation and light blue, by adjusting the reaction concentration.

3.3. Activation Energy, E a

The Arrhenius activation energy ( E a ) expresses the temperature dependency of a reaction or variation, and it can be used as a criterion to determine the prediction accuracy of TTIs [1]. In previous studies, a suitable TTI was decided based on the E a values for the food quality because the food quality can be directly represented by the response of TTI with a similar temperature dependence [1,2,5,21,31]. Therefore, TTIs, which can indicate the relationship between the quality variation of strawberries and activation energy, can effectively predict the shelf life during cold storage. It is considered that the Maillard reaction-based TTI is able to predict the shelf life of strawberries because of the similarity of the activation energies between the quality variation of the strawberries and the color variation of the TTI. Table 1 shows the E a values according to the color variation of the reaction solution and the quality variations of the stored strawberries. In Table 1, the concentration conditions of the reaction solutions only indicate the color changes during cold storage. The ranges of E a for each color channel (red, green, and blue) were 114–181 kJ/M, 108–178 kJ/M, and 108–192 kJ/M, respectively (Table 1). These ranges include the activation energies of the weight loss, the color difference, and the appearance damage. In addition, Taoukis [31] reported that TTIs can be applied to predict the food quality variation with a prediction error below 15% when the difference in the activation energy between the food quality and TTI is less than ± 25 kJ/M. According to this theory, when developing a TTI using various reaction concentrations, a more comprehensive prediction can be achieved. The activation energies of the weight loss and appearance damage showed a similar trend. This was considered to be because of the relationship between the weight loss and the occurrence of appearance damage [27]. Activation energy is a useful indicator for the selection of a suitable concentration of TTIs. However, the activation energies in the same reaction concentration were different according to the color channels, namely, red, green, and blue. Moreover, the TTI colors may differ depending on the combination of the red, green, and blue values. For this reason, the relationship between the color stages of the TTI and the quality levels desired by consumers should be considered when developing a Maillard reaction-based TTI. In this study, a suitable reaction concentration for the visualization of the weight loss variation was a combination of 3.0 M D-xylose, 1.5 M glycine, and 0.3 M Na2HPO4. Moreover, a reaction concentration of 2.0 M D-xylose, 1.5 M glycine, and 0.3 M Na2HPO4 was suitable for the visualization of the color difference variation and the occurrence of appearance damage.

4. Conclusions

A Maillard reaction-based TTI can be used for the visualization of the shelf life and safety of cold-stored strawberries. We determined the availability of a Maillard reaction-based TTI by comparing the quality variations of strawberries, the color changes of the reaction solutions, and the Arrhenius activation energies. As shown in Figure 4, the color change in the Maillard reaction solution with an activation energy similar to that of the quality variations, namely, weight loss, appearance damage, and color difference, effectively visualized the quality variation of the cold-stored strawberries. Regarding the availability of other TTIs, a timely temperature management during storage and transportation can also be ensured by confirming the color change rate of the TTI because temperature abuse rapidly changes the color of TTIs. Moreover, we determined that the wide range of the color change rate and the activation energy of the Maillard reaction-based TTI indicate a wide applicability to other agricultural products. Although we confirmed that the TTI can visualize the shelf-life of strawberries during cold storage, it is necessary to consider several characteristics, such as the microorganisms and texture of strawberry, to enhance the reliability of the Maillard reaction-based TTI. Therefore, it will be necessary to carry out more experiments, such as a conformation of the relationship between the various quality variation of agricultural products and the color variation of various reaction concentrations, to achieve more comprehensive predictions with the Maillard reaction-based TTI.

Author Contributions

B.-H.C., as the first author, planned the experiments and wrote the manuscript. J.-H.L., led the overall research as a corresponding author and helped revise the manuscript. All authors have read and agreed to the published version of the manuscript.

Funding

This research was supported by the Chungbuk National University Korea National University Development Project (2020).

Data Availability Statement

The data presented in this study are available on request from the corresponding author. The data are not publicly available due to privacy reasons.

Conflicts of Interest

The authors declare no conflict of interest.

References

  1. Yang, J.; Xu, Y. Prediction of fruit quality based on the RGB values of time–temperature indicator. J. Food Sci. 2021, 86, 932–941. [Google Scholar] [CrossRef]
  2. Zhang, X.; Sun, G.; Xiao, X.; Liu, Y.; Zheng, X. Application of microbial TTIs as smart label for food quality: Response mechanism, application and research trends. Trends Food Sci. Technol. 2016, 51, 12–23. [Google Scholar] [CrossRef]
  3. Hao, C.; Hao, X.; David, J.M.C.; Long, C.; Aiquan, J.; Yaoqi, T.; Ming, M.; Zhengyu, J. Recent advances in intelligent food packaging materials: Principles, preparation and applications. Food Chem. 2022, 375, 131738. [Google Scholar] [CrossRef]
  4. Tsujihashi, M.; Tanaka, S.; Koayama, K.; Koseki, S. Application of Time–Temperature Indicator/Integrator Based on the Maillard Reaction to Frozen Food Distribution. Food Bioprocess Technol. 2022, 15, 1343–1358. [Google Scholar] [CrossRef]
  5. Pandian, A.T.; Chaturvedi, S.; Chakraborty, S. Applications of enzymatic time–temperature indicator (TTI) devices in quality monitoring and shelf-life estimation of food products during storage. Food Meas. 2021, 15, 1523–1540. [Google Scholar] [CrossRef]
  6. Wang, S.; Liu, X.; Yang, M.; Zhang, Y.; Xiang, K.; Tang, R. Review of Time Temperature Indicators as Quality Monitors in Food Packaging. Packag. Technol. Sci. 2015, 28, 839–867. [Google Scholar] [CrossRef]
  7. Maillard, L.C. Action des acides amines sur les sucres: Formation des melanoidines par voie methodique. CR Acad. Sci. 1912, 154, 66–68. [Google Scholar]
  8. Martins, S.I.F.S.; Jongen, W.M.F.; Boekel, M.A.J.S. A Review of Maillard Reaction in Food and Implications to Kinetic Modelling. Trends Food Sci. Technol. 2000, 11, 364–373. [Google Scholar] [CrossRef]
  9. Lee, J.H.; Harada, R.; Kawamura, S.; Koseki, S. Development of a Novel Time-Temperature Integrator/Indicator (TTI) Based on the Maillard Reaction for Visual Thermal Monitoring of the Cooking Process. Food Bioprocess Technol. 2018, 11, 185–193. [Google Scholar] [CrossRef]
  10. Lee, J.H.; Morita, A.; Kuroshima, M.; Kawamura, S.; Koseki, S. Development of a novel time–temperature integrator/indicator (TTI) based on the maillard reaction for visual monitoring of melon (Cucumis melo L.) maturity during cultivation. Food Meas. 2018, 12, 2899–2904. [Google Scholar] [CrossRef]
  11. Sakai, K.; Lee, J.H.; Kocharunchitt, C.; Ross, T.; Jeoson, I.; Koayama, K.; Koseki, S. Development of a Maillard Reaction–Based Time-Temperature Integrator/indicator (TTI) for Visual Monitoring of Chilled Beef During Long-term Storage and Distribution. Food Bioprocess Technol. 2020, 13, 2094–2103. [Google Scholar] [CrossRef]
  12. Lee, J.H.; Kawamura, S.; Koseki, S. Quantitative Evaluation of Changes in Color during Maillard Reaction for Development of Novel Time-Temperature Integrators/Indicators. Food Sci. Technol. Res. 2018, 24, 283–287. [Google Scholar] [CrossRef] [Green Version]
  13. Lee, K.H.; Bong, S.J.; Yoon, Y.J.; Lee, B.; Kwak, I.H.; Min, K.H.; Kim, H.K. Quality Changes of Strawberry by Slow-released ClO2 Gas Gel-pack during Storage. Korean J. Food Nutr. 2017, 30, 591–598. [Google Scholar] [CrossRef]
  14. Feliziani, E.; Romanazzi, G. Postharvest Decay of Strawberry Fruit: Etiology, Epidemiology, and Disease Management. J. Berry Res. 2016, 6, 47–63. [Google Scholar] [CrossRef] [Green Version]
  15. Darwish, O.S.; Ali, M.R.; Khojah, E.; Samra, B.N.; Ramadan, K.M.A.; El-Mogy, M.M. Pre-Harvest Application of Salicylic Acid, Abscisic Acid, and Methyl Jasmonate Conserve Bioactive Compounds of Strawberry Fruits during Refrigerated Storage. Horticulturae 2021, 7, 568. [Google Scholar] [CrossRef]
  16. Mehmet, S.A.; Cengiz, C. Individual and combined effects of ultrasound, ozone and chlorine dioxide on strawberry storage life. LWT-Food Sci. Technol. 2014, 57, 244–251. [Google Scholar] [CrossRef]
  17. Mehmet, S.A.; Riza, T.; Mehmet, B.B.; Cengiz, C. An innovative technique for extending shelf life of strawberry: Ultrasound. LWT-Food Sci. Technol. 2013, 52, 93–101. [Google Scholar] [CrossRef]
  18. Al-Dairi, M.; Pathare, P.B.; Al-Yahyai, R. Effect of Postharvest Transport and Storage on Color and Firmness Quality of Tomato. Horticulturae 2021, 7, 163. [Google Scholar] [CrossRef]
  19. Laroque, D.; Inisan, C.; Berger, C.; Vouland, E.; Dufossé, L.; Guérard, F. Kinetic Study on the Maillard Reaction. Consideration of Sugar Reactivity. Food Chem. 2008, 111, 1032–1042. [Google Scholar] [CrossRef]
  20. Han, J.Y.; Kim, M.J.; Shim, S.D.; Lee, S.J. Application of fuzzy reasoning to prediction of beef sirloin quality using time temperature integrators (TTIs). Food Control 2012, 24, 148–153. [Google Scholar] [CrossRef]
  21. Kim, K.H.; Kim, E.J.; Lee, S.J. New Enzymatic Time-Temperature Integrator (TTI) That Uses Laccase. J. Food Eng. 2012, 113, 118–123. [Google Scholar] [CrossRef]
  22. Wanihsuksombat, C.; Hongtrakul, V.; Suppakul, P. Development and Characterization of a Prototype of a Lactic Acid-based Time-Temperature Indicator for Monitoring Food Product Quality. J. Food Eng. 2010, 100, 427–434. [Google Scholar] [CrossRef]
  23. Miura, M.; Gomyo, T. Formation of Blue Pigment in the Earlier Stage of Browning a System Composed of D-Xylose and Glycine. J. Agric. Chem. Soc. Jpn. 1982, 56, 417–425. [Google Scholar]
  24. Andreas, A.P.; Konstantoula, A.D.; Panagiotis, D.; Kyriakos, A.R. Effect of Gaseous Ozone and Heat Treatment on Quality and Shelf Life of Fresh Strawberries during Cold Storage. Int. J. Fruit Sci. 2021, 21, 218–231. [Google Scholar] [CrossRef]
  25. Shehata, S.A.; Abdeldaym, E.A.; Ali, M.R.; Mohamed, R.M.; Bob, R.I.; Abdelgawad, K.F. Effect of Some Citrus Essential Oils on Post-Harvest Shelf Life and Physicochemical Quality of Strawberries during Cold Storage. Agronomy 2020, 10, 1466. [Google Scholar] [CrossRef]
  26. Nadim, Z.; Ahmadi, E.; Sarikhani, H.; Chayjan, R.A. Effect of methylcellulose-based edible coating on strawberry fruit’s quality maintenance during storage. J. Food Process. Preserv. 2014, 39, 80–90. [Google Scholar] [CrossRef]
  27. Kahramanoğlu, İ.; Panfilova, O.; Kesimci, T.G.; Bozhüyük, A.U.; Gürbüz, R.; Alptekin, H. Control of Postharvest Gray Mold at Strawberry Fruits Caused by Botrytis cinerea and Improving Fruit Storability through Origanum onites L. and Ziziphora clinopodioides L. Volatile Essential Oils. Agronomy 2022, 12, 389. [Google Scholar] [CrossRef]
  28. Fan, Y.; Xu, Y.; Wang, D.; Zhang, L.; Sun, J.; Sun, L.; Zhang, B. Effect of alginate coating combined with yeast antagonist on strawberry (Fragaria × ananassa) preservation quality. Postharvest Biol. Technol. 2009, 53, 84–90. [Google Scholar] [CrossRef]
  29. Majeed, A.; Muhammad, Z.; Majid, A.; Shah, A.; Hussain, M. Impact of low doses of gamma irradiation on shelf life and chemical quality of strawberry (Fragariaxananassa) cv. ‘Corona’. J. Anim. Plant Sci. 2014, 24, 1531–1536. [Google Scholar]
  30. Yoon, Y.S.; Kim, J.K.; Lee, K.C.; Eun, J.B.; Park, J.H. Effects of electron-beam irradiation on postharvest strawberry quality. J. Food Process. Preserv. 2020, 44, 14665. [Google Scholar] [CrossRef]
  31. Taoukis, P.S. Modelling the use of time-temperature indicators in distribution and stock rotation. In Food Process Modelling; Tijkskens, L.M.M., Hertog, M.L.A.T.M., Nicolai, B.M., Eds.; Woodhead Publishing: Amsterdam, The Netherlands, 2001; pp. 402–431. [Google Scholar]
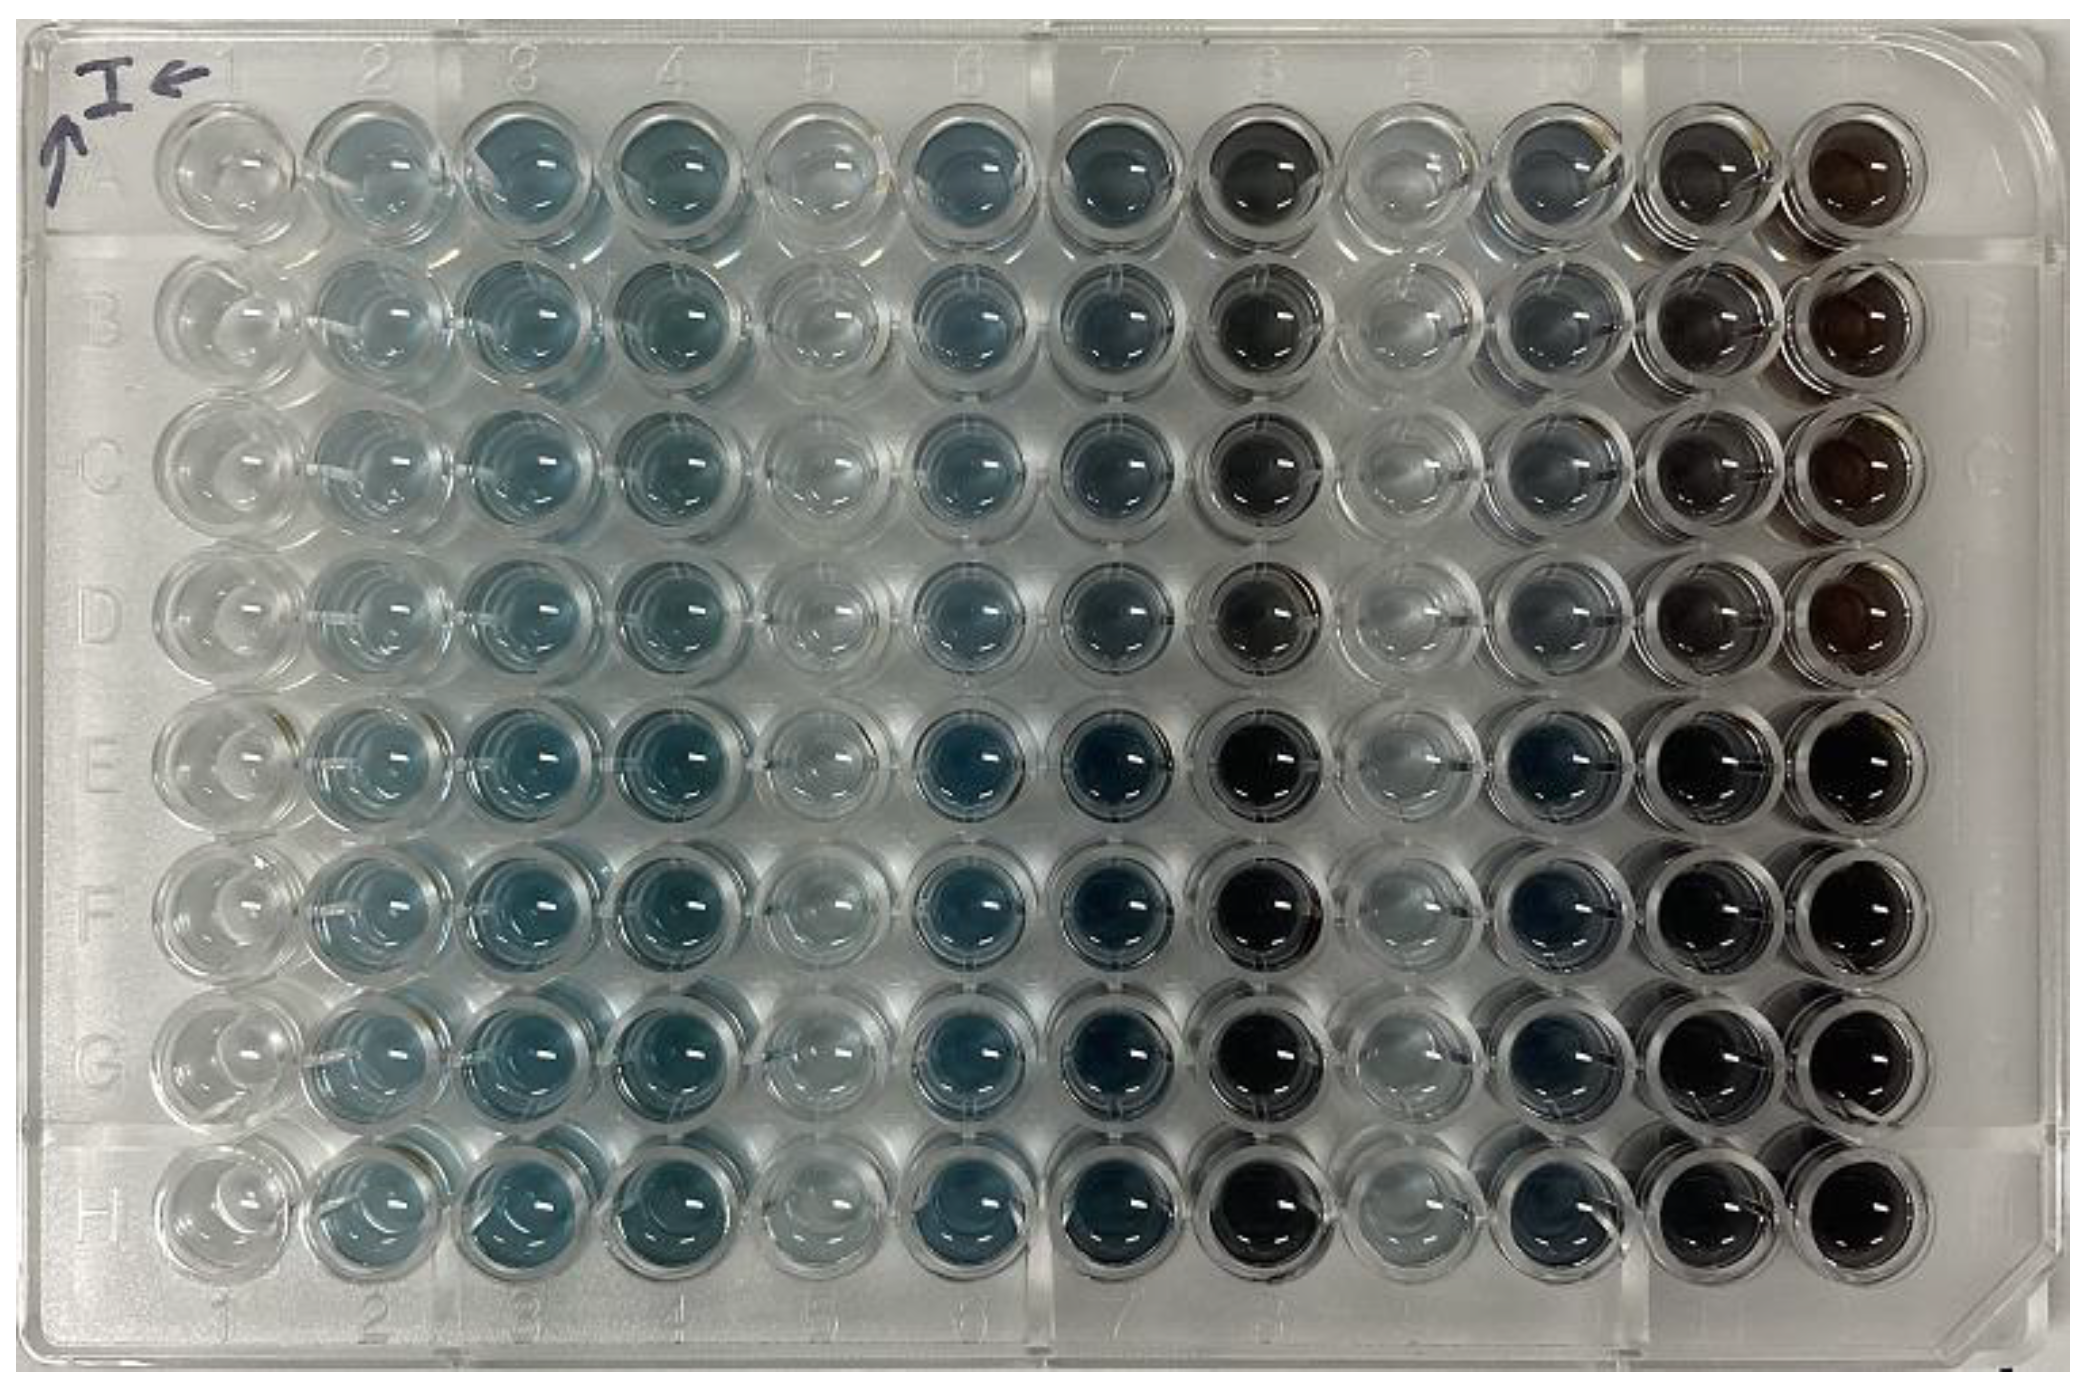
Figure 1. A digital image of microplate used for color variation analysis of solutions with reacted during 4 days at 7 °C storage temperature.
Horticulturae 08 00979 g001
Figure 2. Variation in the blue color value and the observed solution color of the Maillard reaction with a solution concentration of 3.0 M D-xylose, 1.0 M glycine, and 0.3 M Na2HPO4.
Horticulturae 08 00979 g002
Figure 3. Variation in the red color value according to reactant concentration. Reaction conditions for (a) are reaction temperature of 7 °C; D-xylose concentrations of 2.0 M (●), 3.0 M (◇), and 4.0 M (▲); 1.0 M glycine; and 0.3 M Na2HPO4. Reaction conditions for (b) are reaction temperature of 1 °C; 2.0 M D-xylose; glycine concentrations of 0.5 M (●), 1.0 M (◇), and 1.5 M (▲); and 0.3 M Na2HPO4. (a) D-xylose concentration; (b) Glycine concentration.
Horticulturae 08 00979 g003
Figure 4. Quality value variation of strawberries and color change in reaction solution during cold storage. The reaction concentration used in (a) is 3.0 M D-xylose, 1.5 M glycine, and 0.3 M Na2HPO4. The reaction concentration used in (b) is 2.0 M D-xylose, 1.5 M glycine, and 0.3 M Na2HPO4. The reaction concentration used in (c) is 4.0 M D-xylose, 1.0 M glycine, and 0.3 M Na2HPO4. (a) Weight loss; (b) Color difference; (c) Appearance damage; (d) Total SSC.
Horticulturae 08 00979 g004
Table 1. Arrhenius activation energy ( E a ) of the color variation of reaction solution and the quality variations of stored strawberry. The shaded yellow indicates an E a value similar to that of weight loss and appearance damage. The shaded green indicates an E a value similar to that of color difference.
Concentration (M) E a   ( kJ / M · K ) ln A R 2
D-xyloseGlycine
Color
variation
Red3.00.518177.70.99
4.017073.30.99
2.01.013558.10.99
3.013257.30.99
4.015265.80.98
2.01.512654.40.99
3.011449.30.99
4.014362.20.99
Green4.00.517876.40.99
2.01.017374.10.98
3.013859.60.99
4.011951.20.99
2.01.514160.80.99
3.010846.70.99
4.014763.90.99
Blue4.00.519282.30.99
2.01.018779.90.96
3.013457.50.99
4.011348.80.99
2.01.514361.70.99
3.010846.60.99
4.014060.90.99
Weight loss10546.90.90
Color difference14563.10.97
Appearance damage10347.50.93
Publisher’s Note: MDPI stays neutral with regard to jurisdictional claims in published maps and institutional affiliations.