
Genetic Diversity of Tea Plant (Camellia sinensis (L.) Kuntze) Germplasm Resources in Wuyi Mountain of China Based on Single Nucleotide Polymorphism (SNP) Markers


Abstract
1. Introduction
2. Materials and Methods
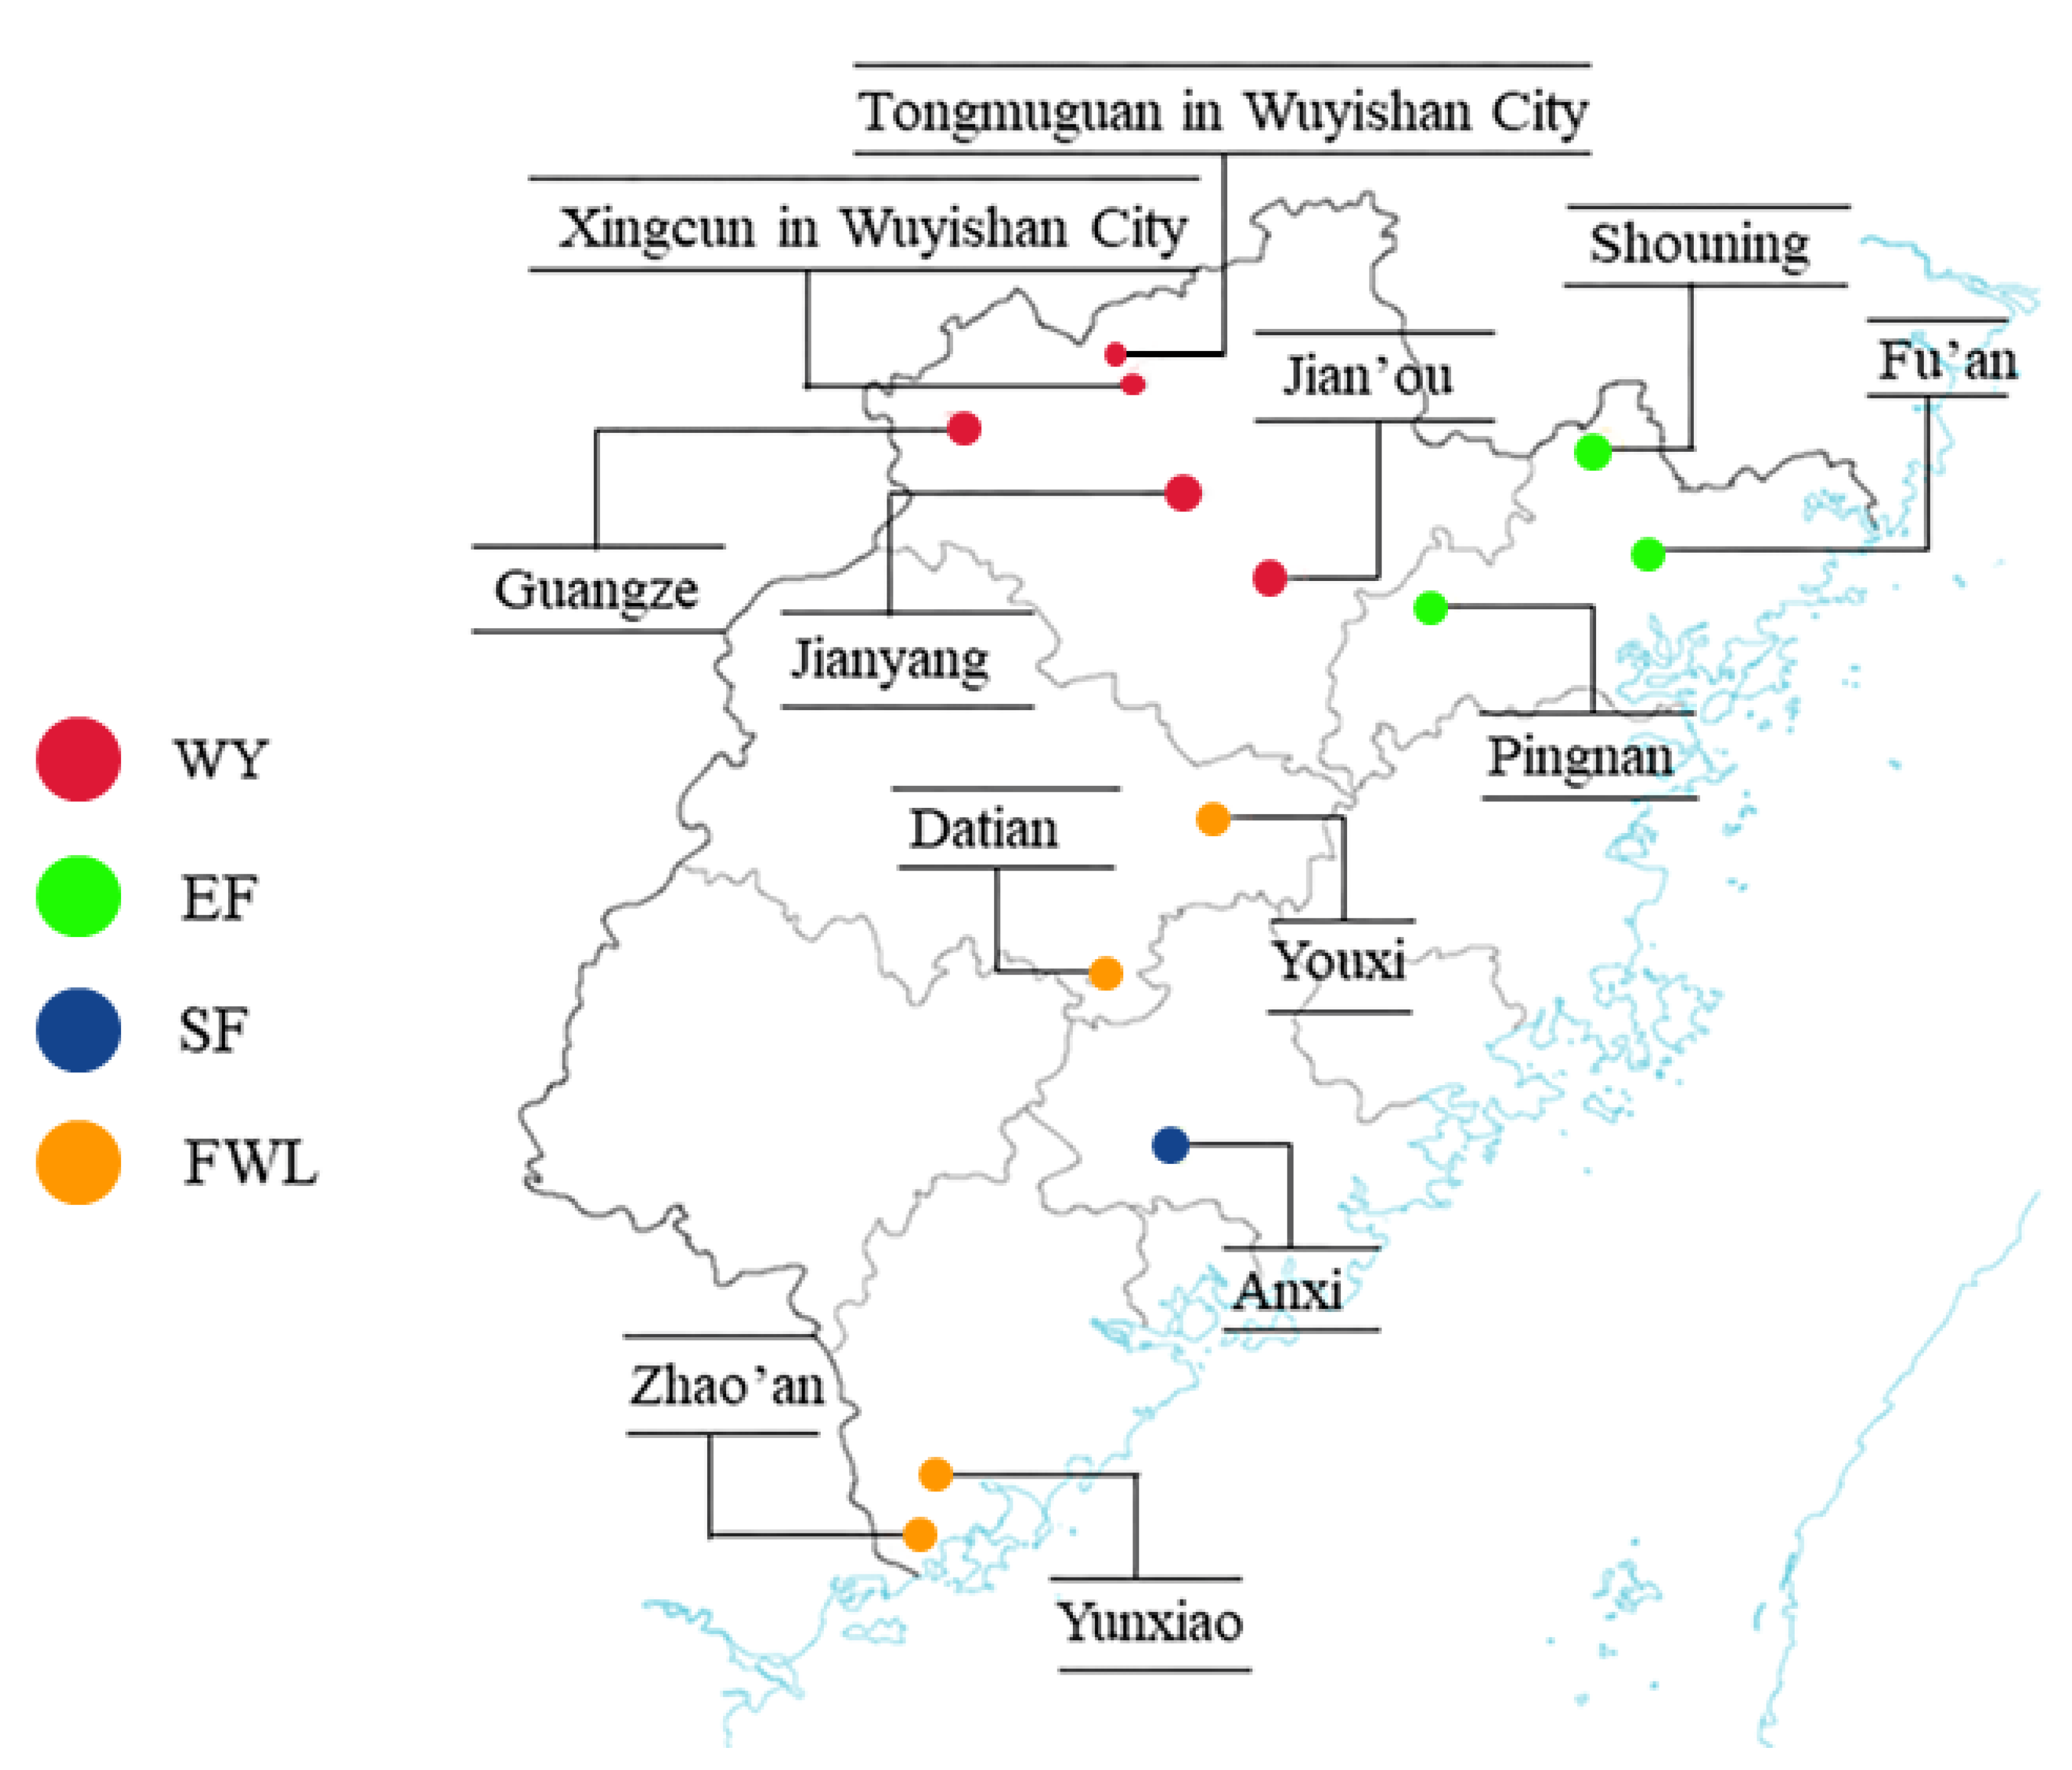
2.1. Sample Collection
2.2. DNA Extraction
2.3. Single Nucleotide Polymorphism Markers and Genotyping
2.4. Data Analysis
3. Results
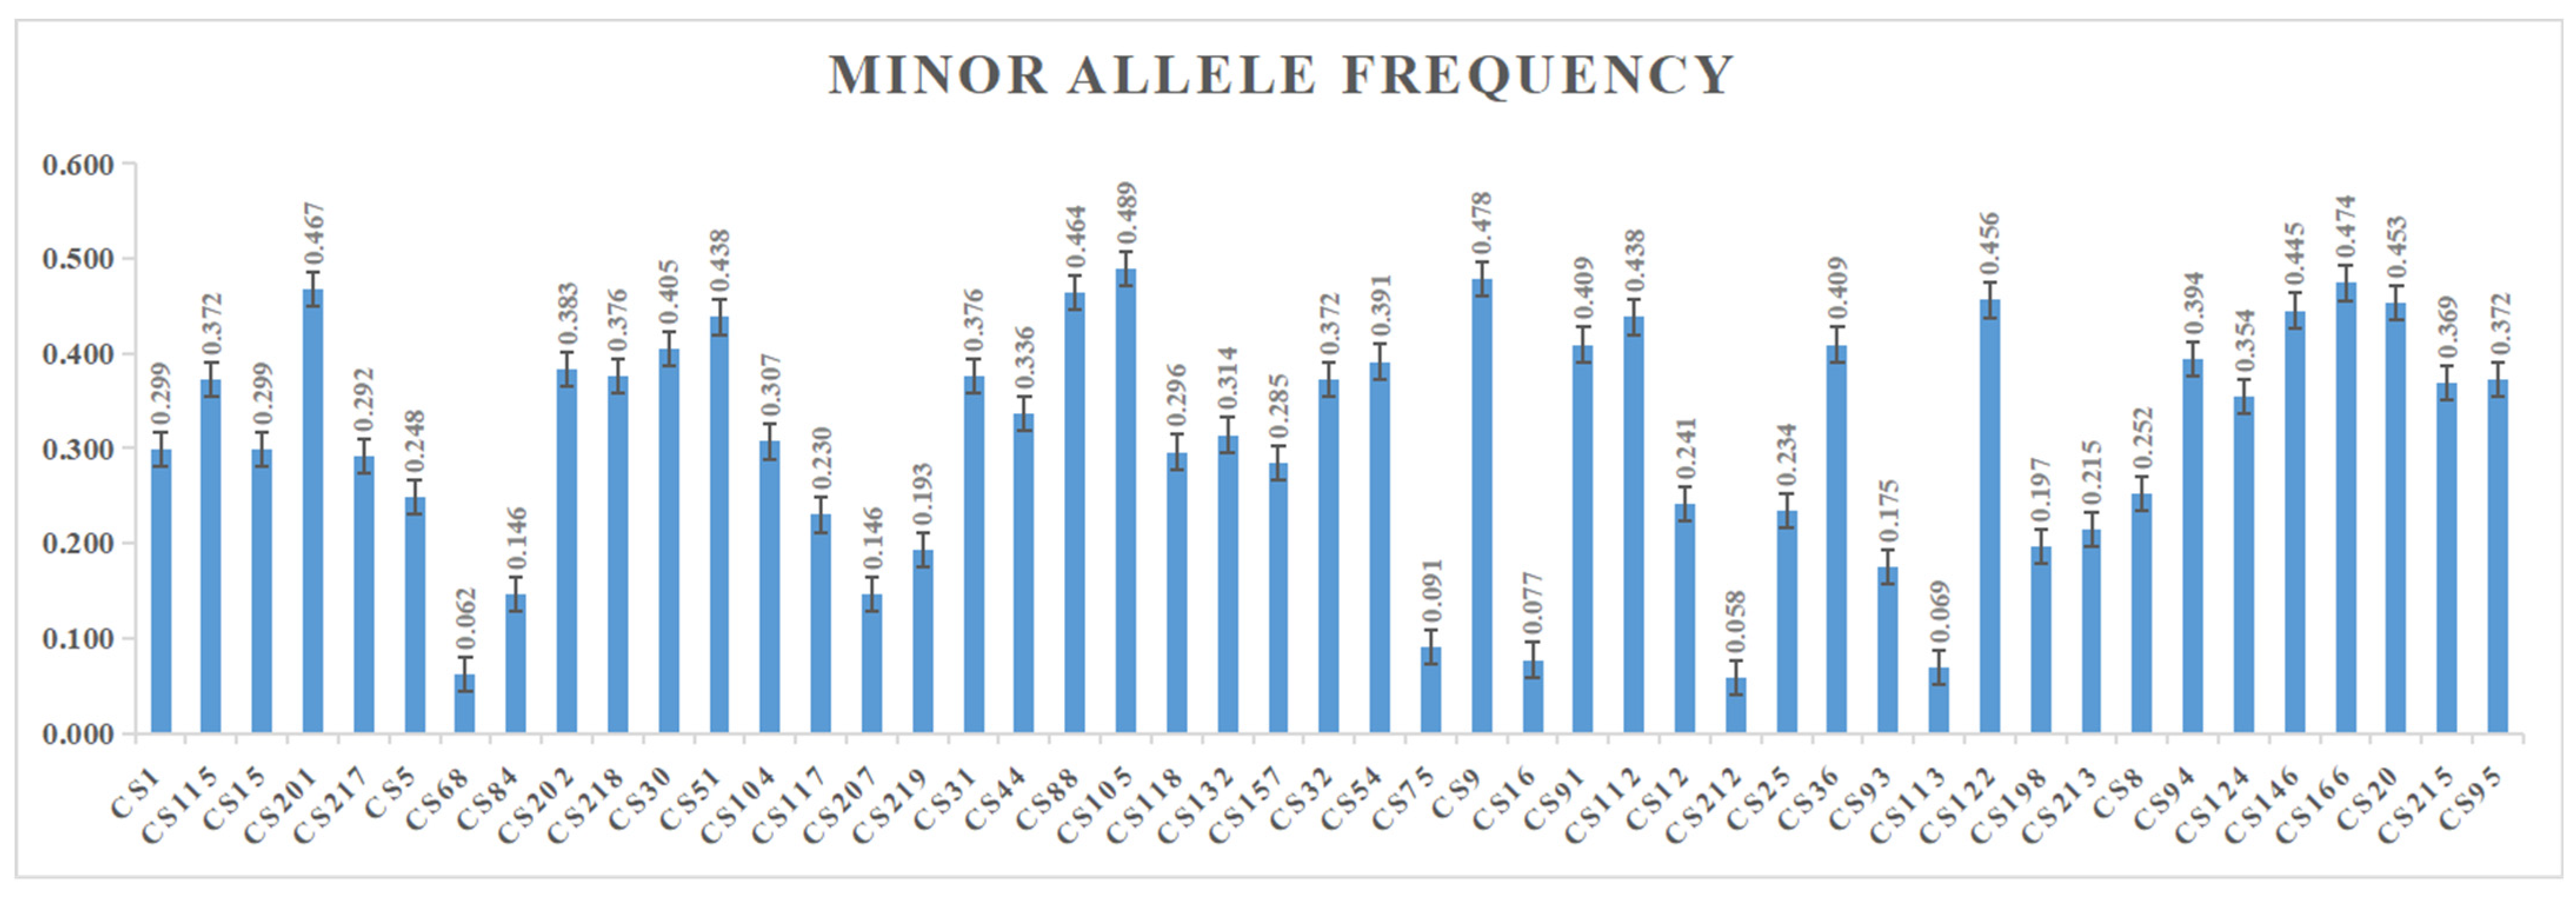
3.1. Screening and Analysis of the Polymorphic Loci
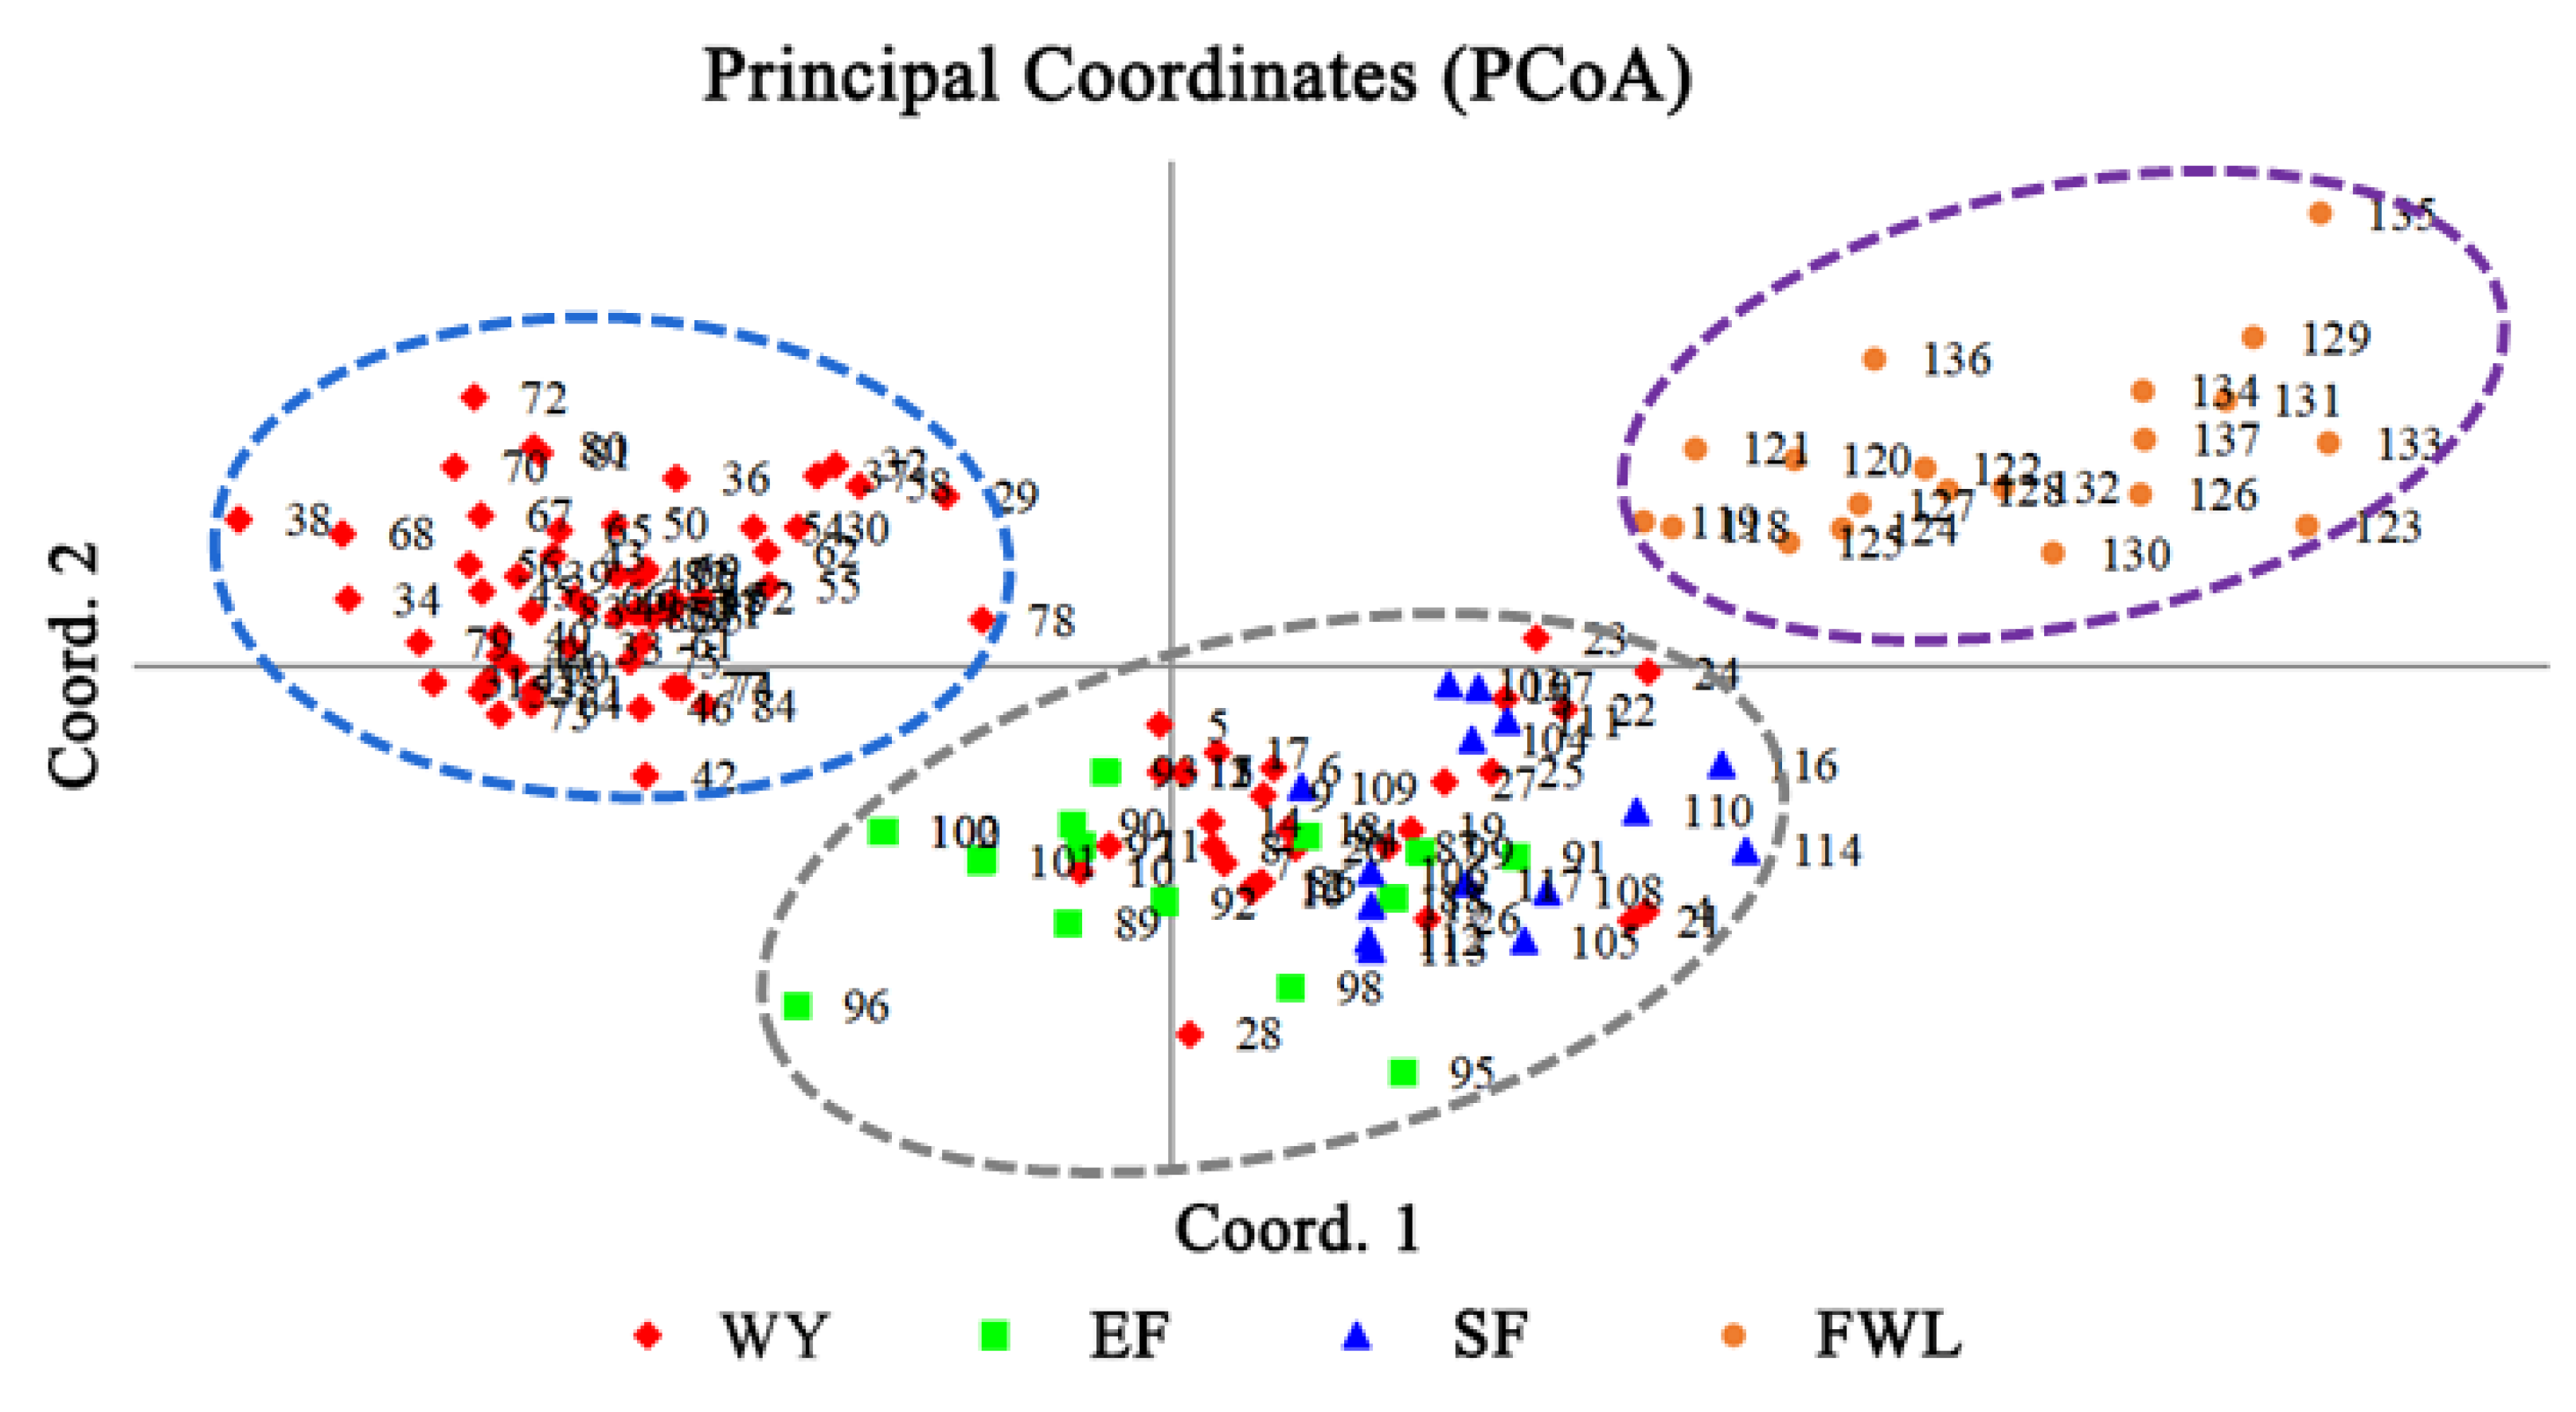
3.2. Genetic Relationship Analysis of Test Samples
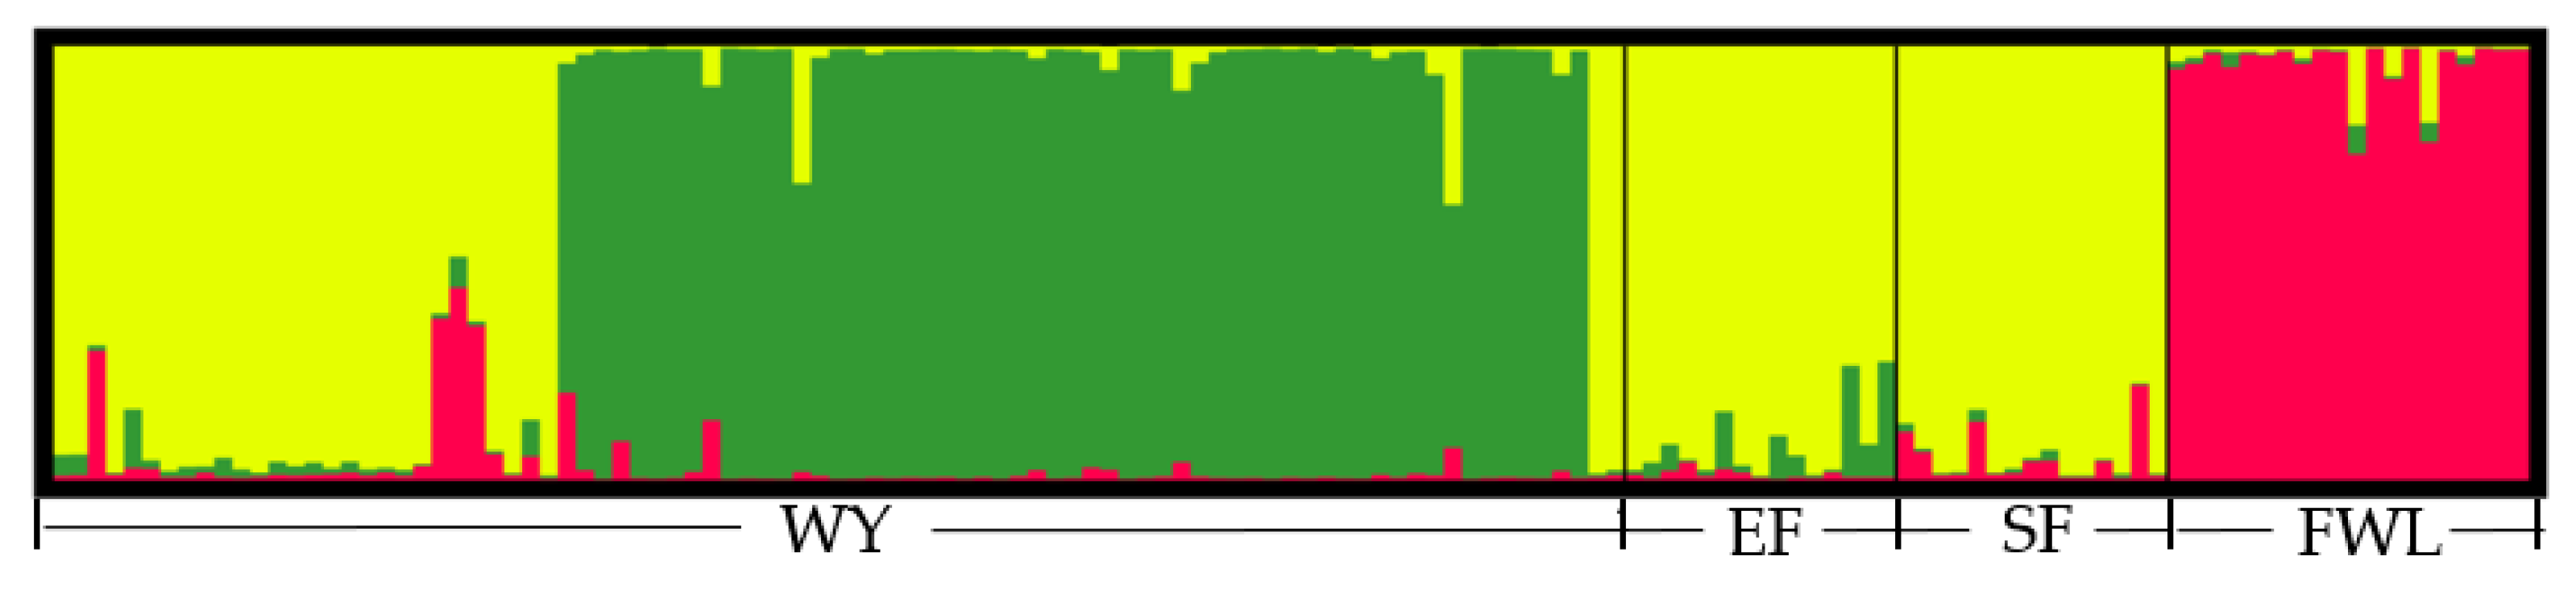
3.3. Population Structure Analysis of Samples
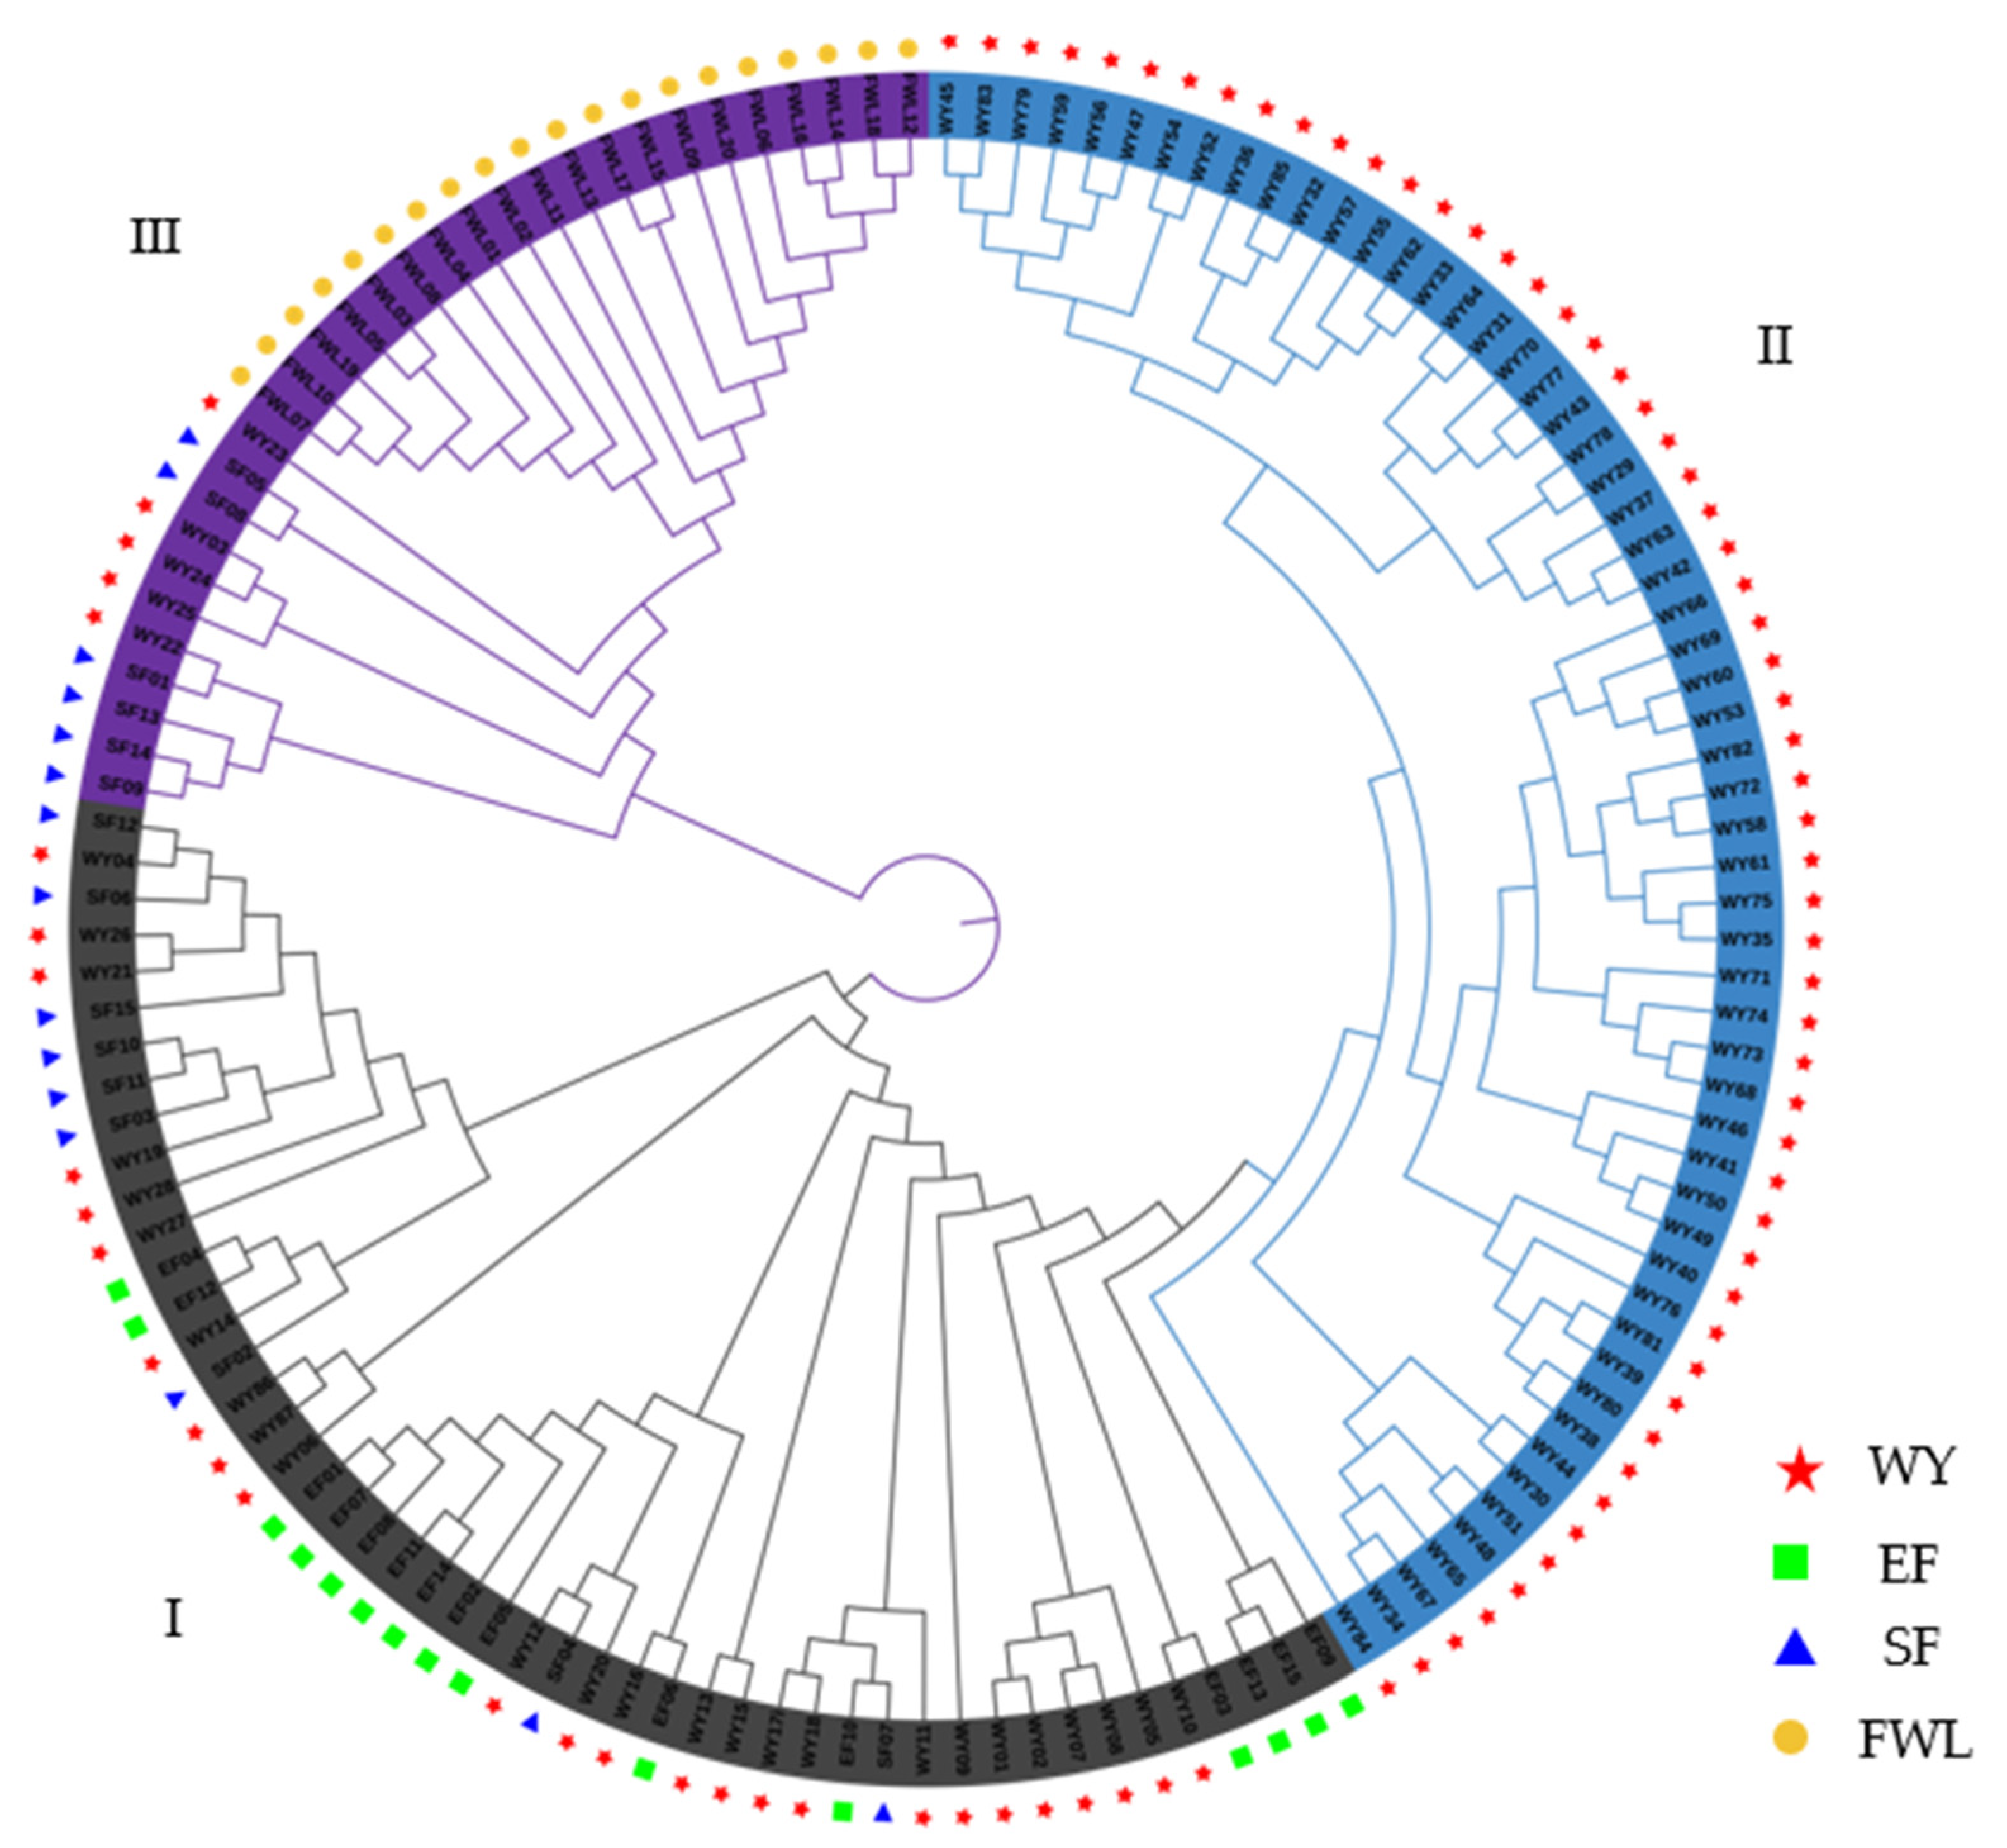
3.4. Hierarchical Clustering Diagram Describing Kinship
3.5. Population Differentiation Analysis
4. Discussion
4.1. SNP Screening and Genetic Richness Analysis
4.2. Genetic Relationship Analysis of Tea Plant Population between Wuyi Mountain and Its Adjacent Areas
4.3. Genetic Diversity Analysis of Tea Plant Population in Wuyi Mountain
5. Conclusions
Supplementary Materials
Author Contributions
Funding
Data Availability Statement
Conflicts of Interest
References
- Mondael, T.K.; Bhattacharya, A.; Laxmikumaran, M.; Ahuja, P.S. Recent advances of tea (Camellia sinensis) biotechnology. Plant Cell Tissue Organ Cult. 2004, 76, 195–254. [Google Scholar] [CrossRef]
- Yao, S.S.; Guo, W.F.; Lu, Y.; Jiang, Y.X. Flavor characteristics of lapsang souchong and smoked lapsang souchong, a special chinese black tea with pine smoking process. J. Agric. Food Chem. 2005, 53, 8688–8693. [Google Scholar] [CrossRef]
- Zeng, L.T.; Zhou, X.C.; Su, X.G.; Yang, Z.Y. Chinese oolong tea: An aromatic beverage produced under multiple stresses. Trends Food Sci. Technol. 2020, 106, 242–253. [Google Scholar] [CrossRef]
- Ye, N.X. Introduction to Tea Science, 2nd ed.; China Agriculture Press: Beijing, China, 2021; pp. 19–20. [Google Scholar]
- Wang, P.J.; Jin, S.; Chen, X.J.; Wu, L.Y.; Zheng, Y.C.; Yue, C.; Guo, Y.C.; Zhang, X.T.; Yang, J.F.; Ye, N.X. Chromatin accessibility and translational landscapes of tea plants under chilling stress. Hortic. Res. 2021, 8, 96–110. [Google Scholar] [CrossRef]
- Lu, L.T.; Chen, H.F.; Wang, X.J.; Zhao, Y.C.; Yao, X.Z.; Xiong, B.; Deng, Y.L.; Zhao, D.G. Genome-level diversification of eight ancient tea populations in the Guizhou and Yunnan regions identifies candidate genes for core agronomic traits. Hortic. Res. 2021, 8, 190–199. [Google Scholar] [CrossRef]
- Wang, P.J.; Gu, M.Y.; Shao, S.X.; Chen, X.M.; Hou, B.H.; Ye, N.X.; Zhang, X.T. Changes in non-volatile and volatile metabolites associated with heterosis in tea plants (Camellia sinensis). J. Agric. Food Chem. 2022, 70, 3067–3078. [Google Scholar] [CrossRef] [PubMed]
- Guney, M.; Kafkas, S.; Keles, H.; Zarifikhosroshahi, M.; Gundesli, M.A.; Ercisli, S.; Necas, T.; Bujdoso, G. Genetic diversity among some walnut (Juglans regia L.) genotypes by SSR markers. Sustainability 2021, 13, 6830. [Google Scholar] [CrossRef]
- Barut, M.; Nadeem, M.A.; Karaköy, T.; Baloch, F.S. DNA fingerprinting and genetic diversity analysis of world quinoa germplasm using iPBS-retrotransposon marker system. Turk. J. Agric. For. 2020, 44, 479–491. [Google Scholar] [CrossRef]
- Savaş, T.G.; Yücel, G.; Kaygisiz, A.T.; Ateş, D.; Eşİyok, D.; Tanyolaç, M.B.; Tuna, M. Molecular cytogenetic characterization of common bean (Phaseolus vulgaris L.) accessions. Turk. J. Agric. For. 2020, 44, 612–630. [Google Scholar] [CrossRef]
- Chen, L.; Yamaguchi, S. RAPD markers for discriminating tea germplasms at the inter-specific level in China. Plant Breed. 2010, 124, 404–409. [Google Scholar] [CrossRef]
- Chen, L.; Gao, Q.K.; Chen, D.M.; Xu, C.J. The use of RAPD markers for detecting genetic diversity, relationship and molecular identification of chinese elite tea genetic resources [Camellia sinensis (L.) O. Kuntze] preserved in a tea germplasm repository. Biodivers. Conserv. 2005, 14, 1433–1444. [Google Scholar] [CrossRef]
- Liu, B.Y.; Li, Y.Y.; Tang, Y.C.; Wang, L.Y.; Cheng, H.; Wang, P.S. Assessment of genetic diversity and relationship of tea germplasm in Yunnan as revealed by ISSR markers. Acta Agron. 2010, 36, 391–400. [Google Scholar] [CrossRef]
- Tan, L.Q.; Peng, M.; Xu, L.; Wang, L.Y.; Chen, S.X.; Zou, Y.; Qi, G.N.; Cheng, H. Fingerprinting 128 chinese clonal tea cultivars using SSR markers provides new insights into their pedigree relationships. Tree Genet. Genom. 2015, 11, 90. [Google Scholar] [CrossRef]
- Wang, P.; Fang, J.; Lin, H.; Yang, W.; Yu, J.; Hong, Y.; Jiang, M.; Gu, M.; Chen, Q.; Zheng, Y.; et al. Genomes of single and double-petal jasmines (Jasminum sambac) provide insights into their divergence time and structural variations. Plant Biotechnol. J. 2022, 20, 1232–1234. [Google Scholar] [CrossRef] [PubMed]
- Fang, W.P.; Meinhardt, L.W.; Tan, H.W.; Zhou, L.; Mischke, S.; Zhang, D.P. Varietal identification of tea (Camellia sinensis) using nanofluidic array of single nucleotide polymorphism (SNP) markers. Hortic. Res. 2014, 1, 14035. [Google Scholar] [CrossRef] [PubMed]
- Buckler, E.S.; Thornsberry, J. Plant molecular diversity and applications to genomics. Curr. Opin. Plant Biol. 2002, 5, 107–111. [Google Scholar] [CrossRef]
- Rafalski, A. Applications of single nucleotide polymorphisms in crop genetics. Curr. Opin. Plant Biol. 2002, 5, 94–100. [Google Scholar] [CrossRef]
- Lin, Y.; Yu, W.T.; Zhou, L.; Fan, X.J.; Wang, F.Q.; Wang, P.J.; Fang, W.P.; Cai, C.P.; Ye, N.X. Genetic diversity of oolong tea (Camellia sinensis) germplasms based on the nanofluidic array of single-nucleotide polymorphism (SNP) markers. Tree Genet. Genom. 2020, 16, 3. [Google Scholar] [CrossRef]
- Fan, X.J.; Yu, W.T.; Cai, C.P.; Li, Y.; Wang, Z.H.; Fang, W.P.; Zhang, J.M.; Ye, N.X. Construction of molecular id for tea cultivars by using of single nucleotide polymorphism (SNP) Markers. Sci. Agric. Sin. 2021, 54, 1751–1772. [Google Scholar] [CrossRef]
- Wang, Z.H.; Yu, W.T.; Fang, D.Y.; Cai, J.Y.; Wang, J.H.; Fan, X.J.; Liu, C.G.; Xu, B.; Ye, N.X. EST-SNP marker-based genetic analysis on tea germplasms of Yunxiao in Fujian. Fujian J. Agric. Sci. 2021, 36, 1431–1438. [Google Scholar] [CrossRef]
- Yamashita, H.; Katai, H.; Kawaguchi, L.; Nagano, A.J.; Nakamura, Y.; Morita, A.; Ikka, T. Analyses of single nucleotide polymorphisms identified by ddRAD-seq reveal genetic structure of tea germplasm and japanese landraces for tea breeding. PLoS ONE 2019, 14, e0220981. [Google Scholar] [CrossRef] [PubMed]
- Fujian Province Standard Map Service. Available online: http://bzdt.fjmap.net/ (accessed on 27 August 2022).
- Mohammadi, S.A.; Prasanna, B.M. Analysis of genetic diversity in crop plants—Salient statistical tools and considerations. Crop Sci. 2003, 43, 1235–1248. [Google Scholar] [CrossRef]
- Xia, E.H.; Zhang, H.B.; Sheng, J.; Li, K.; Zhang, Q.J.; Kim, C.H.; Zhang, Y.; Liu, Y.; Zhu, T.; Li, W.; et al. The tea tree genome provides insights into tea flavor and independent evolution of caffeine biosynthesis. Mol. Plant 2017, 10, 866–877. [Google Scholar] [CrossRef] [PubMed]
- Xia, E.H.; Tong, W.; Hou, Y.; An, Y.L.; Chen, L.B.; Wu, Q.; Liu, Y.L.; Yu, J.; Li, F.D.; Li, R.P.; et al. The reference genome of tea plant and resequencing of 81 diverse accessions provide insights into its genome evolution and adaptation. Mol. Plant 2020, 13, 1013–1026. [Google Scholar] [CrossRef] [PubMed]
- Zhang, W.Y.; Zhang, Y.J.; Qiu, H.J.; Guo, Y.F.; Wan, H.L.; Zhang, X.L.; Scossa, F.; Alseekh, S.; Zhang, Q.H.; Wang, P.; et al. Genome assembly of wild tea tree DASZ reveals pedigree and selection history of tea varieties. Nat. Commun. 2020, 11, 3719. [Google Scholar] [CrossRef]
- Wang, X.C.; Feng, H.; Chang, Y.X.; Ma, C.; Wang, L.Y.; Hao, X.Y.; Li, A.L.; Cheng, H.; Wang, L.; Cui, P.; et al. Population sequencing enhances understanding of tea plant evolution. Nat. Commun. 2020, 11, 4447. [Google Scholar] [CrossRef]
- Zhang, X.T.; Chen, S.; Shi, L.Q.; Gong, D.P.; Zhang, S.C.; Zhao, Q.; Zhan, D.L.; Vasseur, L.; Wang, Y.B.; Yu, J.X.; et al. Haplotype-resolved genome assembly provides insights into evolutionary history of the tea plant Camellia sinensis. Nat. Genet. 2021, 53, 1250–1259. [Google Scholar] [CrossRef]
- Zhang, Q.J.; Li, W.; Li, K.; Nan, H.; Shi, C.; Zhang, Y.; Dai, Z.Y.; Lin, Y.L.; Yang, X.; Tong, Y.; et al. The chromosome-level reference genome of tea tree unveils recent bursts of non-autonomous LTR retrotransposons in driving genome size evolution. Mol. Plant 2020, 13, 935–938. [Google Scholar] [CrossRef]
- Wang, P.J.; Yu, J.X.; Jin, S.; Chen, S.; Yue, C.; Wang, W.L.; Gao, S.L.; Cao, H.L.; Zheng, Y.C.; Gu, M.Y.; et al. Genetic basis of high aroma and stress tolerance in the oolong tea cultivar genome. Hortic. Res. 2021, 8, 107–121. [Google Scholar] [CrossRef]
- Ganal, M.W.; Altmann, T.; Roder, M.S. SNP identification in crop plants. Curr. Opin. Plant Biol. 2009, 12, 211–217. [Google Scholar] [CrossRef]
- Hansson, B.; Westerberg, L. On the correlation between heterozygosity and fitness in natural populations. Mol. Ecol. 2002, 11, 2467–2474. [Google Scholar] [CrossRef] [PubMed]
- Slate, J.; Davi, P.; Dodds, K.G.; Veenvliet, B.A.; Glass, B.C.; Broad, T.E.; Mcewan, J.C. Understanding the relationship between the inbreeding coefficient and multilocus heterozygosity: Theoretical expectations and empirical data. Heredity 2004, 93, 255–265. [Google Scholar] [CrossRef] [PubMed]
- Tan, L.Q.; Wang, X.Y.; Li, H.; Liu, G.Q.; Zou, Y.; Chen, S.X.; Li, P.W.; Tang, Q. Systematic evaluation of landrace tea populations in Northern Sichuan, China, Based on Morphology, DNA Markers, and Biochemistry Analyses. Hortscience 2018, 53, 1095–1101. [Google Scholar] [CrossRef]
- Tamaki, I.; Kuze, T.; Hirota, K.; Mizuno, M. Genetic variation and population demography of the landrace population of Camellia sinensis in Kasuga, Gifu Prefecture, Japan. Genet. Resour. Crop Evol. 2016, 63, 823–831. [Google Scholar] [CrossRef]
- Niu, S.Z.; Song, Q.F.; Koiwa, H.; Qiao, D.H.; Zhao, D.G.; Chen, Z.W.; Liu, X.; Wen, X.P. Genetic diversity, linkage disequilibrium, and population structure analysis of the tea plant (Camellia sinensis) from an origin center, Guizhou plateau, using genome-wide SNPs developed by genotyping-by-sequencing. BMC Plant Biol. 2019, 19, 328. [Google Scholar] [CrossRef]
- Zhao, Z.F.; Song, Q.F.; Bai, D.C.; Niu, S.Z.; He, Y.Q.; Qiao, D.H.; Chen, Z.W.; Li, C.Y.; Luo, J.; Li, F. Population structure analysis to explore genetic diversity and geographical distribution characteristics of cultivated-type tea plant in Guizhou Plateau. BMC Plant Biol. 2022, 22, 55. [Google Scholar] [CrossRef]
- Zhu, C.; Zhang, H.T.; Chang, X.J.; Wang, Z.; Xu, C.T.; Zhang, X.H.; Lin, Y.L.; Lai, Z.X.; Guo, Y.Q. Analysis of genetic diversity of fifty-three Camellia sinensis in Fujian Province by ISSR. Chin. J. Trop. Crops 2017, 38, 1303–1310. [Google Scholar] [CrossRef]
- Yao, M.Z.; Ma, C.L.; Qiao, T.T.; Jin, J.Q.; Chen, L. Diversity distribution and population structure of tea germplasms in China revealed by EST-SSR markers. Tree Genet. Genom. 2012, 8, 205–220. [Google Scholar] [CrossRef]
- Huang, F.Y.; Duan, J.H.; Lei, Y.; Liu, Z.; Kang, Y.K.; Luo, Y.; Chen, Y.G.; Li, Y.Y.; Liu, S.Q.; Li, S.J.; et al. Genetic diversity, population structure and core collection analysis of Hunan tea plant germplasm through genotyping-by-sequencing. Beverage Plant Res. 2022, 2, 5. [Google Scholar] [CrossRef]
- Su, W.J.; Wang, L.J.; Lei, J.; Chai, S.S.; Liu, Y.; Yang, Y.Y.; Yang, X.S.; Jiao, C.H. Genome-wide assessment of population structure and genetic diversity and development of a core germplasm set for sweet potato based on specific length amplified fragment (SLAF) sequencing. PLoS ONE 2017, 12, e0172066. [Google Scholar] [CrossRef]
- Wadl, P.A.; Olukolu, B.A.; Branham, S.E.; Jarret, R.L.; Yencho, G.C.; Jackson, D.M. Genetic diversity and population structure of the USDA sweetpotato (Ipomoea batatas) germplasm collections using GBSpoly. Front. Plant Sci. 2018, 9, 1166–1178. [Google Scholar] [CrossRef]
- Meegahakumbura, M.K.; Wambulwa, M.C.; Thapa, K.K.; Li, M.M.; Möller, M.; Xu, J.C.; Yang, J.B.; Liu, B.Y.; Ranjitkar, S.; Liu, J.; et al. Indications for three independent domestication events for the tea plant (Camellia sinensis (L.) O. Kuntze) and new insights into the origin of tea germplasm in China and India revealed by nuclear microsatellites. PLoS ONE 2016, 11, e0155369. [Google Scholar] [CrossRef] [PubMed]
- Chen, J.I.; Yang, X.Q.; Huang, X.M.; Duan, S.; Long, C.; Chen, J.K.; Rong, J. Leaf transcriptome analysis of a subtropical evergreen broadleaf plant, wild oil-tea camellia (Camellia oleifera), revealing candidate genes for cold acclimation. BMC Genom. 2017, 18, 211–224. [Google Scholar] [CrossRef] [PubMed]
- Hardigan, M.A.; Bamberg, J.; Buell, C.R.; Douches, D.S. Taxonomy and genetic differentiation among wild and cultivated germplasm of solanum sect Petota. Plant Genome 2015, 8, plantgenome2014.06.0025. [Google Scholar] [CrossRef] [PubMed]
- Leinonen, P.H.; Sandring, S.; Quilot, B.; Clauss, M.J.; Mitchell-Olds, T.; Agren, J.; Savolainen, O. Local adaptation in European populations of Arabidopsis lyrata (Brassicaceae). Am. J. Bot. 2019, 96, 1129–1137. [Google Scholar] [CrossRef]


| Number | Sample Number | Source/Origin | Area | Collection Data | Number | Sample Number | Source/Origin | Area | Collection Data |
|---|---|---|---|---|---|---|---|---|---|
| 1 | WY01 | Xingcun in Wuyishan City | WY | Liu21111401 | 70 | WY70 | Guangze | WY | Liu21111233 |
| 2 | WY02 | Xingcun in Wuyishan City | WY | Liu21111402 | 71 | WY71 | Jianyang | WY | Liu21112101 |
| 3 | WY03 | Xingcun in Wuyishan City | WY | Liu21111403 | 72 | WY72 | Jianyang | WY | Liu21112102 |
| 4 | WY04 | Xingcun in Wuyishan City | WY | Liu21111404 | 73 | WY73 | Jianyang | WY | Liu21112103 |
| 5 | WY05 | Xingcun in Wuyishan City | WY | Liu21111405 | 74 | WY74 | Jianyang | WY | Liu21112104 |
| 6 | WY06 | Xingcun in Wuyishan City | WY | Liu21111406 | 75 | WY75 | Jianyang | WY | Liu21112105 |
| 7 | WY07 | Xingcun in Wuyishan City | WY | Liu21111407 | 76 | WY76 | Jianyang | WY | Liu21112106 |
| 8 | WY08 | Xingcun in Wuyishan City | WY | Liu21111408 | 77 | WY77 | Jianyang | WY | Liu21112107 |
| 9 | WY09 | Xingcun in Wuyishan City | WY | Liu21111409 | 78 | WY78 | Jianyang | WY | Liu21112108 |
| 10 | WY10 | Xingcun in Wuyishan City | WY | Liu21111410 | 79 | WY79 | Jianyang | WY | Liu21112109 |
| 11 | WY11 | Xingcun in Wuyishan City | WY | Liu21111411 | 80 | WY80 | Jianyang | WY | Liu21112110 |
| 12 | WY12 | Xingcun in Wuyishan City | WY | Liu21111412 | 81 | WY81 | Jianyang | WY | Liu21112111 |
| 13 | WY13 | Xingcun in Wuyishan City | WY | Liu21111413 | 82 | WY82 | Jianyang | WY | Liu21112112 |
| 14 | WY14 | Xingcun in Wuyishan City | WY | Liu21111414 | 83 | WY83 | Jianyang | WY | Liu21112113 |
| 15 | WY15 | Xingcun in Wuyishan City | WY | Liu21111415 | 84 | WY84 | Jianyang | WY | Liu21112114 |
| 16 | WY16 | Xingcun in Wuyishan City | WY | Liu21111416 | 85 | WY85 | Jianyang | WY | Liu21112115 |
| 17 | WY17 | Xingcun in Wuyishan City | WY | Liu21111417 | 86 | WY86 | Jian ‘ou | WY | Liu21112116 |
| 18 | WY18 | Xingcun in Wuyishan City | WY | Liu21111418 | 87 | WY87 | Jian ‘ou | WY | Liu21112117 |
| 19 | WY19 | Xingcun in Wuyishan City | WY | Liu21111419 | 88 | EF01 | Shouning | EF | Liu21102601 |
| 20 | WY20 | Xingcun in Wuyishan City | WY | Liu21111420 | 89 | EF02 | Shouning | EF | Liu21102602 |
| 21 | WY21 | Xingcun in Wuyishan City | WY | Liu21111421 | 90 | EF03 | Shouning | EF | Liu21102603 |
| 22 | WY22 | Xingcun in Wuyishan City | WY | Liu21111422 | 91 | EF04 | Shouning | EF | Liu21102604 |
| 23 | WY23 | Xingcun in Wuyishan City | WY | Liu21111423 | 92 | EF05 | Shouning | EF | Liu21102605 |
| 24 | WY24 | Xingcun in Wuyishan City | WY | Liu21111424 | 93 | EF06 | Shouning | EF | Liu21102606 |
| 25 | WY25 | Xingcun in Wuyishan City | WY | Liu21111425 | 94 | EF07 | Fu’an | EF | Liu21102701 |
| 26 | WY26 | Xingcun in Wuyishan City | WY | Liu21111426 | 95 | EF08 | Fu’an | EF | Liu21102702 |
| 27 | WY27 | Xingcun in Wuyishan City | WY | Liu21111427 | 96 | EF09 | Fu’an | EF | Liu21102703 |
| 28 | WY28 | Xingcun in Wuyishan City | WY | Liu21111428 | 97 | EF10 | Fu’an | EF | Liu21102704 |
| 29 | WY29 | Tongmuguan in Wuyishan City | WY | Liu21111429 | 98 | EF11 | Fu’an | EF | Liu21102705 |
| 30 | WY30 | Tongmuguan in Wuyishan City | WY | Liu21111430 | 99 | EF12 | Fu’an | EF | Liu21102706 |
| 31 | WY31 | Tongmuguan in Wuyishan City | WY | Liu21111431 | 100 | EF13 | Pingnan | EF | Liu21102801 |
| 32 | WY32 | Tongmuguan in Wuyishan City | WY | Liu21111901 | 101 | EF14 | Pingnan | EF | Liu21102802 |
| 33 | WY33 | Tongmuguan in Wuyishan City | WY | Liu21111902 | 102 | EF15 | Pingnan | EF | Liu21102803 |
| 34 | WY34 | Tongmuguan in Wuyishan City | WY | Liu21111903 | 103 | SF01 | Anxi | SF | Liu21101301 |
| 35 | WY35 | Tongmuguan in Wuyishan City | WY | Liu21111904 | 104 | SF02 | Anxi | SF | Liu21101302 |
| 36 | WY36 | Tongmuguan in Wuyishan City | WY | Liu21111905 | 105 | SF03 | Anxi | SF | Liu21101303 |
| 37 | WY37 | Tongmuguan in Wuyishan City | WY | Liu21111906 | 106 | SF04 | Anxi | SF | Liu21101304 |
| 38 | WY38 | Guangze | WY | Liu21111201 | 107 | SF05 | Anxi | SF | Liu21101305 |
| 39 | WY39 | Guangze | WY | Liu21111202 | 108 | SF06 | Anxi | SF | Liu21101306 |
| 40 | WY40 | Guangze | WY | Liu21111203 | 109 | SF07 | Anxi | SF | Liu21101307 |
| 41 | WY41 | Guangze | WY | Liu21111204 | 110 | SF08 | Anxi | SF | Liu21101308 |
| 42 | WY42 | Guangze | WY | Liu21111205 | 111 | SF09 | Anxi | SF | Liu21101309 |
| 43 | WY43 | Guangze | WY | Liu21111206 | 112 | SF10 | Anxi | SF | Liu21101310 |
| 44 | WY44 | Guangze | WY | Liu21111207 | 113 | SF11 | Anxi | SF | Liu21101311 |
| 45 | WY45 | Guangze | WY | Liu21111208 | 114 | SF12 | Anxi | SF | Liu21101312 |
| 46 | WY46 | Guangze | WY | Liu21111209 | 115 | SF13 | Anxi | SF | Liu21101313 |
| 47 | WY47 | Guangze | WY | Liu21111210 | 116 | SF14 | Anxi | SF | Liu21101314 |
| 48 | WY48 | Guangze | WY | Liu21111211 | 117 | SF15 | Anxi | SF | Liu21101315 |
| 49 | WY49 | Guangze | WY | Liu21111212 | 118 | FWL01 | Youxi | FWL | Liu21120501 |
| 50 | WY50 | Guangze | WY | Liu21111213 | 119 | FWL02 | Youxi | FWL | Liu21120502 |
| 51 | WY51 | Guangze | WY | Liu21111214 | 120 | FWL03 | Youxi | FWL | Liu21120503 |
| 52 | WY52 | Guangze | WY | Liu21111215 | 121 | FWL04 | Youxi | FWL | Liu21120504 |
| 53 | WY53 | Guangze | WY | Liu21111216 | 122 | FWL05 | Youxi | FWL | Liu21120505 |
| 54 | WY54 | Guangze | WY | Liu21111217 | 123 | FWL06 | Datian | FWL | Liu21120601 |
| 55 | WY55 | Guangze | WY | Liu21111218 | 124 | FWL07 | Datian | FWL | Liu21120602 |
| 56 | WY56 | Guangze | WY | Liu21111219 | 125 | FWL08 | Datian | FWL | Liu21120603 |
| 57 | WY57 | Guangze | WY | Liu21111220 | 126 | FWL09 | Datian | FWL | Liu21120604 |
| 58 | WY58 | Guangze | WY | Liu21111221 | 127 | FWL10 | Datian | FWL | Liu21120605 |
| 59 | WY59 | Guangze | WY | Liu21111222 | 128 | FWL11 | Yunxiao | FWL | Liu21121701 |
| 60 | WY60 | Guangze | WY | Liu21111223 | 129 | FWL12 | Yunxiao | FWL | Liu21121702 |
| 61 | WY61 | Guangze | WY | Liu21111224 | 130 | FWL13 | Yunxiao | FWL | Liu21121703 |
| 62 | WY62 | Guangze | WY | Liu21111225 | 131 | FWL14 | Yunxiao | FWL | Liu21121704 |
| 63 | WY63 | Guangze | WY | Liu21111226 | 132 | FWL15 | Yunxiao | FWL | Liu21121705 |
| 64 | WY64 | Guangze | WY | Liu21111227 | 133 | FWL16 | Zhao ‘an | FWL | Liu21121801 |
| 65 | WY65 | Guangze | WY | Liu21111228 | 134 | FWL17 | Zhao ‘an | FWL | Liu21121802 |
| 66 | WY66 | Guangze | WY | Liu21111229 | 135 | FWL18 | Zhao ‘an | FWL | Liu21121803 |
| 67 | WY67 | Guangze | WY | Liu21111230 | 136 | FWL19 | Zhao ‘an | FWL | Liu21121804 |
| 68 | WY68 | Guangze | WY | Liu21111231 | 137 | FWL20 | Zhao ‘an | FWL | Liu21121805 |
| 69 | WY69 | Guangze | WY | Liu21111232 |
| Locus | I | Ho | He | F |
|---|---|---|---|---|
| cs1 | 0.559 | 0.454 | 0.375 | −0.160 |
| cs115 | 0.513 | 0.553 | 0.368 | −0.500 |
| cs15 | 0.409 | 0.349 | 0.272 | −0.226 |
| cs201 | 0.496 | 0.289 | 0.320 | 0.149 |
| cs217 | 0.329 | 0.283 | 0.215 | −0.236 |
| cs5 | 0.573 | 0.242 | 0.387 | 0.388 |
| cs68 | 0.295 | 0.238 | 0.187 | −0.100 |
| cs84 | 0.401 | 0.289 | 0.255 | −0.078 |
| cs202 | 0.597 | 0.544 | 0.409 | −0.279 |
| cs218 | 0.492 | 0.461 | 0.333 | −0.289 |
| cs30 | 0.539 | 0.455 | 0.369 | 0.034 |
| cs51 | 0.515 | 0.353 | 0.342 | 0.014 |
| cs104 | 0.569 | 0.394 | 0.383 | −0.029 |
| cs117 | 0.350 | 0.258 | 0.223 | −0.098 |
| cs207 | 0.371 | 0.263 | 0.238 | −0.102 |
| cs219 | 0.386 | 0.155 | 0.229 | 0.270 |
| cs31 | 0.587 | 0.500 | 0.403 | −0.230 |
| cs44 | 0.603 | 0.585 | 0.414 | −0.388 |
| cs88 | 0.691 | 0.615 | 0.497 | −0.237 |
| cs105 | 0.615 | 0.719 | 0.430 | −0.601 |
| cs118 | 0.428 | 0.298 | 0.278 | −0.066 |
| cs132 | 0.556 | 0.479 | 0.380 | −0.239 |
| cs157 | 0.623 | 0.681 | 0.434 | −0.509 |
| cs32 | 0.488 | 0.313 | 0.316 | 0.118 |
| cs54 | 0.635 | 0.475 | 0.444 | −0.060 |
| cs75 | 0.103 | 0.072 | 0.062 | −0.168 |
| cs9 | 0.580 | 0.389 | 0.404 | 0.016 |
| cs16 | 0.240 | 0.100 | 0.135 | 0.171 |
| cs91 | 0.643 | 0.621 | 0.452 | −0.367 |
| cs112 | 0.656 | 0.550 | 0.464 | −0.179 |
| cs12 | 0.397 | 0.323 | 0.249 | −0.214 |
| cs212 | 0.293 | 0.094 | 0.163 | 0.315 |
| cs25 | 0.400 | 0.285 | 0.253 | −0.111 |
| cs36 | 0.662 | 0.452 | 0.469 | 0.035 |
| cs93 | 0.224 | 0.100 | 0.141 | 0.380 |
| cs113 | 0.281 | 0.118 | 0.155 | 0.159 |
| cs122 | 0.636 | 0.810 | 0.447 | −0.711 |
| cs198 | 0.385 | 0.223 | 0.229 | 0.047 |
| cs213 | 0.406 | 0.233 | 0.252 | 0.025 |
| cs8 | 0.328 | 0.160 | 0.197 | 0.241 |
| cs94 | 0.568 | 0.461 | 0.384 | −0.129 |
| cs124 | 0.618 | 0.641 | 0.427 | −0.485 |
| cs146 | 0.644 | 0.655 | 0.453 | −0.443 |
| cs166 | 0.526 | 0.396 | 0.364 | −0.076 |
| cs20 | 0.320 | 0.029 | 0.224 | 0.873 |
| cs215 | 0.508 | 0.436 | 0.330 | −0.292 |
| cs95 | 0.672 | 0.888 | 0.480 | −0.829 |
| Sample | cs115 | cs201 | cs51 | cs117 | cs207 | cs88 | cs32 | cs54 | cs112 | cs12 | cs36 | cs93 | cs213 | cs8 | cs94 | cs146 | cs166 | cs20 | cs215 | cs95 |
|---|---|---|---|---|---|---|---|---|---|---|---|---|---|---|---|---|---|---|---|---|
| WY01 | A A | G A | C C | A A | T T | C C | G G | T C | C T | A A | T C | G C | A A | C A | G A | C T | C C | T T | T T | T C |
| WY04 | A A | G G | T C | A A | T G | C C | G A | T C | C C | A C | T T | G G | A A | C C | G G | C T | T T | T T | T T | T C |
| WY07 | A A | G A | C C | A A | T T | T C | G G | T C | C T | A A | C C | G G | A A | C C | G A | C C | C C | T T | T T | T C |
| WY08 | A A | G A | C C | A A | T G | T C | G G | T C | C C | A A | T C | G C | A A | C C | G G | C C | C C | T T | T T | T C |
| WY10 | A G | G A | C C | A A | T T | T C | G A | T T | C T | A C | T T | G C | G A | C C | G G | C T | T T | T T | C T | T C |
| WY12 | A G | G G | C C | A A | T G | T T | G G | T T | C T | A A | T C | G G | A A | C A | G G | C T | T T | T T | T T | T C |
| WY30 | A G | A A | T T | A C | T T | T C | G A | T C | C T | A C | T T | G C | G A | C A | G A | C T | C C | T A | C T | T T |
| WY33 | A G | AA | T C | A A | T T | T C | G A | T C | C T | A A | T C | G G | A A | C A | G G | T T | T C | A A | C T | T C |
| WY38 | A G | A A | C C | A C | TT | T C | A A | T T | C T | A C | T T | C C | G A | A A | G A | C C | T T | A A | C T | T T |
| WY49 | A G | A A | C C | A C | T T | T C | G G | T C | C T | A C | T T | G C | G A | C C | G A | C T | C C | A A | C T | T T |
| WY53 | A G | A A | T C | A C | T T | T T | G G | T C | C T | A A | T T | G G | G A | C A | G G | T T | T C | A A | C T | T C |
| WY71 | A G | A A | T C | A C | T T | T C | G G | T C | C T | A A | T C | G C | A A | A A | G A | C C | T C | A A | C T | T C |
| WY73 | A G | A A | T C | A C | T T | T C | G G | T C | C T | A C | T T | G C | A A | C A | G A | C T | T T | A A | C T | T C |
| EF06 | A G | G A | C C | A A | T G | C C | G G | T T | T T | A C | C C | C C | A A | C C | G G | C T | T C | T T | T T | T C |
| EF08 | A G | G G | C C | A A | T G | T T | G G | T T | C C | A C | T C | G G | A A | C C | G G | C C | T T | T T | C T | T C |
| EF11 | A G | G G | C C | A A | T T | T C | G G | T T | C C | A A | T T | G C | A A | C C | G G | C T | T C | T T | T T | T C |
| SF03 | A A | G G | C C | A A | T T | T C | G G | T C | C T | A A | C C | G G | G A | C C | G A | C T | T C | T T | T T | T C |
| SF04 | A A | G G | T C | A A | T T | T C | G A | T T | T T | A A | C C | G G | A A | C C | G A | C T | T T | T T | T T | T C |
| SF09 | A A | G G | T C | A C | T T | C C | G A | C C | C T | A C | C C | G G | A A | A A | G A | C T | C C | T T | T T | T C |
| FWL03 | A G | G A | T T | A A | T T | T C | A A | T T | C C | A A | C C | G G | A A | C A | G A | C T | C C | T T | C T | T C |
| FWL07 | A G | G A | T T | A A | T T | T C | A A | T C | C T | A A | T C | G G | G A | C C | G A | C T | C C | T T | C T | T C |
| FWL11 | A G | G G | T C | A A | T T | T C | A A | T C | C C | A A | C C | G G | A A | C C | G A | C T | T C | T T | C T | T C |
| Areas | WY | EF | SF | FWL |
|---|---|---|---|---|
| WY | 0.053 | 0.074 | 0.143 | |
| EF | 0.067 | 0.069 | 0.144 | |
| SF | 0.093 | 0.085 | 0.110 | |
| FWL | 0.183 | 0.188 | 0.122 |
| Source of Variation | Degree of Freedom | Sum of Square | Mean of Square | Components of Covariance | |
|---|---|---|---|---|---|
| Sigma | % | ||||
| Between populations | 3 | 559.791 | 186.597 | 6.881 | 34% |
| Within populations | 133 | 1769.595 | 13.305 | 13.305 | 66% |
| Total | 136 | 2329.387 | 199.902 | 20.186 | 100% |
Publisher’s Note: MDPI stays neutral with regard to jurisdictional claims in published maps and institutional affiliations. |
© 2022 by the authors. Licensee MDPI, Basel, Switzerland. This article is an open access article distributed under the terms and conditions of the Creative Commons Attribution (CC BY) license (https://creativecommons.org/licenses/by/4.0/).
Share and Cite
Liu, C.; Yu, W.; Cai, C.; Huang, S.; Wu, H.; Wang, Z.; Wang, P.; Zheng, Y.; Wang, P.; Ye, N. Genetic Diversity of Tea Plant (Camellia sinensis (L.) Kuntze) Germplasm Resources in Wuyi Mountain of China Based on Single Nucleotide Polymorphism (SNP) Markers. Horticulturae 2022, 8, 932. https://doi.org/10.3390/horticulturae8100932
Liu C, Yu W, Cai C, Huang S, Wu H, Wang Z, Wang P, Zheng Y, Wang P, Ye N. Genetic Diversity of Tea Plant (Camellia sinensis (L.) Kuntze) Germplasm Resources in Wuyi Mountain of China Based on Single Nucleotide Polymorphism (SNP) Markers. Horticulturae. 2022; 8(10):932. https://doi.org/10.3390/horticulturae8100932
Chicago/Turabian StyleLiu, Caiguo, Wentao Yu, Chunping Cai, Shijian Huang, Huanghua Wu, Zehan Wang, Pan Wang, Yucheng Zheng, Pengjie Wang, and Naixing Ye. 2022. "Genetic Diversity of Tea Plant (Camellia sinensis (L.) Kuntze) Germplasm Resources in Wuyi Mountain of China Based on Single Nucleotide Polymorphism (SNP) Markers" Horticulturae 8, no. 10: 932. https://doi.org/10.3390/horticulturae8100932
APA StyleLiu, C., Yu, W., Cai, C., Huang, S., Wu, H., Wang, Z., Wang, P., Zheng, Y., Wang, P., & Ye, N. (2022). Genetic Diversity of Tea Plant (Camellia sinensis (L.) Kuntze) Germplasm Resources in Wuyi Mountain of China Based on Single Nucleotide Polymorphism (SNP) Markers. Horticulturae, 8(10), 932. https://doi.org/10.3390/horticulturae8100932