Article

Identification of QTLs Controlling Radish Root Shape Using Multiple Populations

Institute of Vegetables Research, Zhejiang Academy of Agricultural Sciences, Hangzhou 310021, China
*
Authors to whom correspondence should be addressed.
Horticulturae 2022, 8(10), 931; https://doi.org/10.3390/horticulturae8100931
Submission received: 18 August 2022 / Revised: 6 October 2022 / Accepted: 7 October 2022 / Published: 10 October 2022
(This article belongs to the Special Issue Omics Technologies and Their Applications in Vegetable Plant Research)

Abstract

:
Root shape is an important characteristic that affects the commodity of radish (Raphanus sativus L.), which can be measured using the ratio of root length (RL) to root diameter (RD). Although it is known that root shape is controlled by quantitative trait loci (QTLs), reliable QTLs for radish root shape are still lacking. In the present study, we used three F2 populations (1902, 1908 and 1909) derived from the crossing of five radish cultivars with highly divergent root shapes to perform QTL-seq. A total of 1282 individuals of the three F2 populations were measured to determine the root length and maximum diameter. High-depth resequencing of six extreme pools and five parents was performed, and QTL-seq was used to detect the QTLs controlling the radish root shape. We identified seven QTLs for root shape distributing on five radish chromosomes (R1, R2, R4, R5 and R7), among which rs7.1 and rs7.2 had an overlap of 1.02 Mb (13.79–14.81 Mb). In addition, two QTLs, rs4.1 and rs4.2, were adjacent to each other on chromosome R4. In conclusion, this study provides an important foundation for the fine mapping and functional analysis of the QTLs controlling the root shape and breeding for root shape in radish.

1. Introduction

Radish (Raphanus sativus L.), belonging to the Brassicaceae, is an important root vegetable crop, especially in east Asia. The radish root is generally composed of the upper part, which develops from the hypocotyls, and the lower part, consisting of true root tissue [1]. The thick and succulent root can be cooked, processed with salt or consumed fresh. The diverse consuming habits of radish root in different regions result in demands for different root shapes. The shapes of roots directly affect the yield and quality of radish; thus, root shape is an important target trait in radish breeding [2]. The root shape of radish can be measured using the ratio of the root length (RL) to the root diameter (RD) at the maximum part of the root, which displays abundant diversity [1]. Based on radish germplasm resources, the diameter of radish roots ranges from 1 to 30 cm, whereas the length of the root ranges from 3 to 200 cm [3]. In general, the fleshy roots of radish are divided into 15 main shapes, including cylindrical, conical, oval, oblate, pear-shaped and round [4].
Radish roots are controlled by complex genetic, environmental and physiological factors [5]. The shape of radish roots is a quantitative trait. However, the QTLs for the root shape have rarely been found. Tsuro et al. [1] constructed a genetic map containing 198 markers using isolated F2 populations and detected three QTLs associated with the root shape index, accounting for 42.4% of the phenotypic variation. At the same time, two QTLs associated with root diameter were detected, among which the QTL on linkage group 8 affected the root shape by affecting the diameter [1]. Hashida et al. [6] identified three QTLs associated with fleshy root weight using a recombinant inbred line (RIL) population combined with two-year trait data. Yu et al. [7] constructed a radish genetic map containing 258 SSR markers and detected 18 QTLs for root characteristics in radish, including weight, length, diameter and shape. However, the marker density of the previously reported radish linkage maps is insufficient, and the linkage groups refer to different genome versions. Recently, a high-density genetic map was constructed in radish with 378 738 SNPs; five QTLs were detected for radish root length, diameter and weight [8]. Nonetheless, at present, there are few studies on gene mapping of the fleshy root shape traits, whereas QTL mapping for radish root shape is in the preliminary stage. Effective molecular markers closely linked to fleshy root traits are still not available. Most of the research on the development of fleshy radish roots focuses on transcriptome studies at different developmental stages [3,9,10], and a number of genes across different developmental stages of fleshy radish roots have been identified. However, the genes directly regulating the root shape of radish remain to be found and verified, and the molecular mechanisms of fleshy root enlargement have not been elucidated.
QTL-seq has been successfully applied to identify the quantitative traits and extreme traits in rice and has been widely used in many other crops, such as tomato and cucumber [11,12,13,14,15]. This method has also been used to detect the genes for root cuticular and interior color in radish [16,17]. Genome-wide single nucleotide polymorphism (SNP) analysis allowed the detection of a genomic region harboring the major QTL, whereas QTL-seq provided a cost-effective and time-efficient method for the identification of multiple QTLs.
With the development of sequencing technology and the reduction in sequencing costs, the genomic sequences of five radishes have been published [3,18,19,20,21,22]. The quality of the radish genome is under continuous improvement, the latest version of which uses single-molecule real-time sequencing technology, with a genome contig N50 of 1.2 Mb. The improvement in the genomic integrity greatly facilitates the detection of key genes involved in the formation of fleshy roots of different shapes. The main objectives of this study were to identify reliable major QTLs regulating fleshy root size in radish and develop closely linked molecular markers to assist radish breeding with target root shape, which could provide a foundation for radish. In the present study, we performed QTL-seq combined with the bulk-segregant approach using three F2 populations to identify the QTLs controlling the root shape of radish. The results provide an important basis for further exploration of key genes regulating the fleshy root shape and marker-assistant cultivar improvement of root shape in radish.

2. Materials and Methods

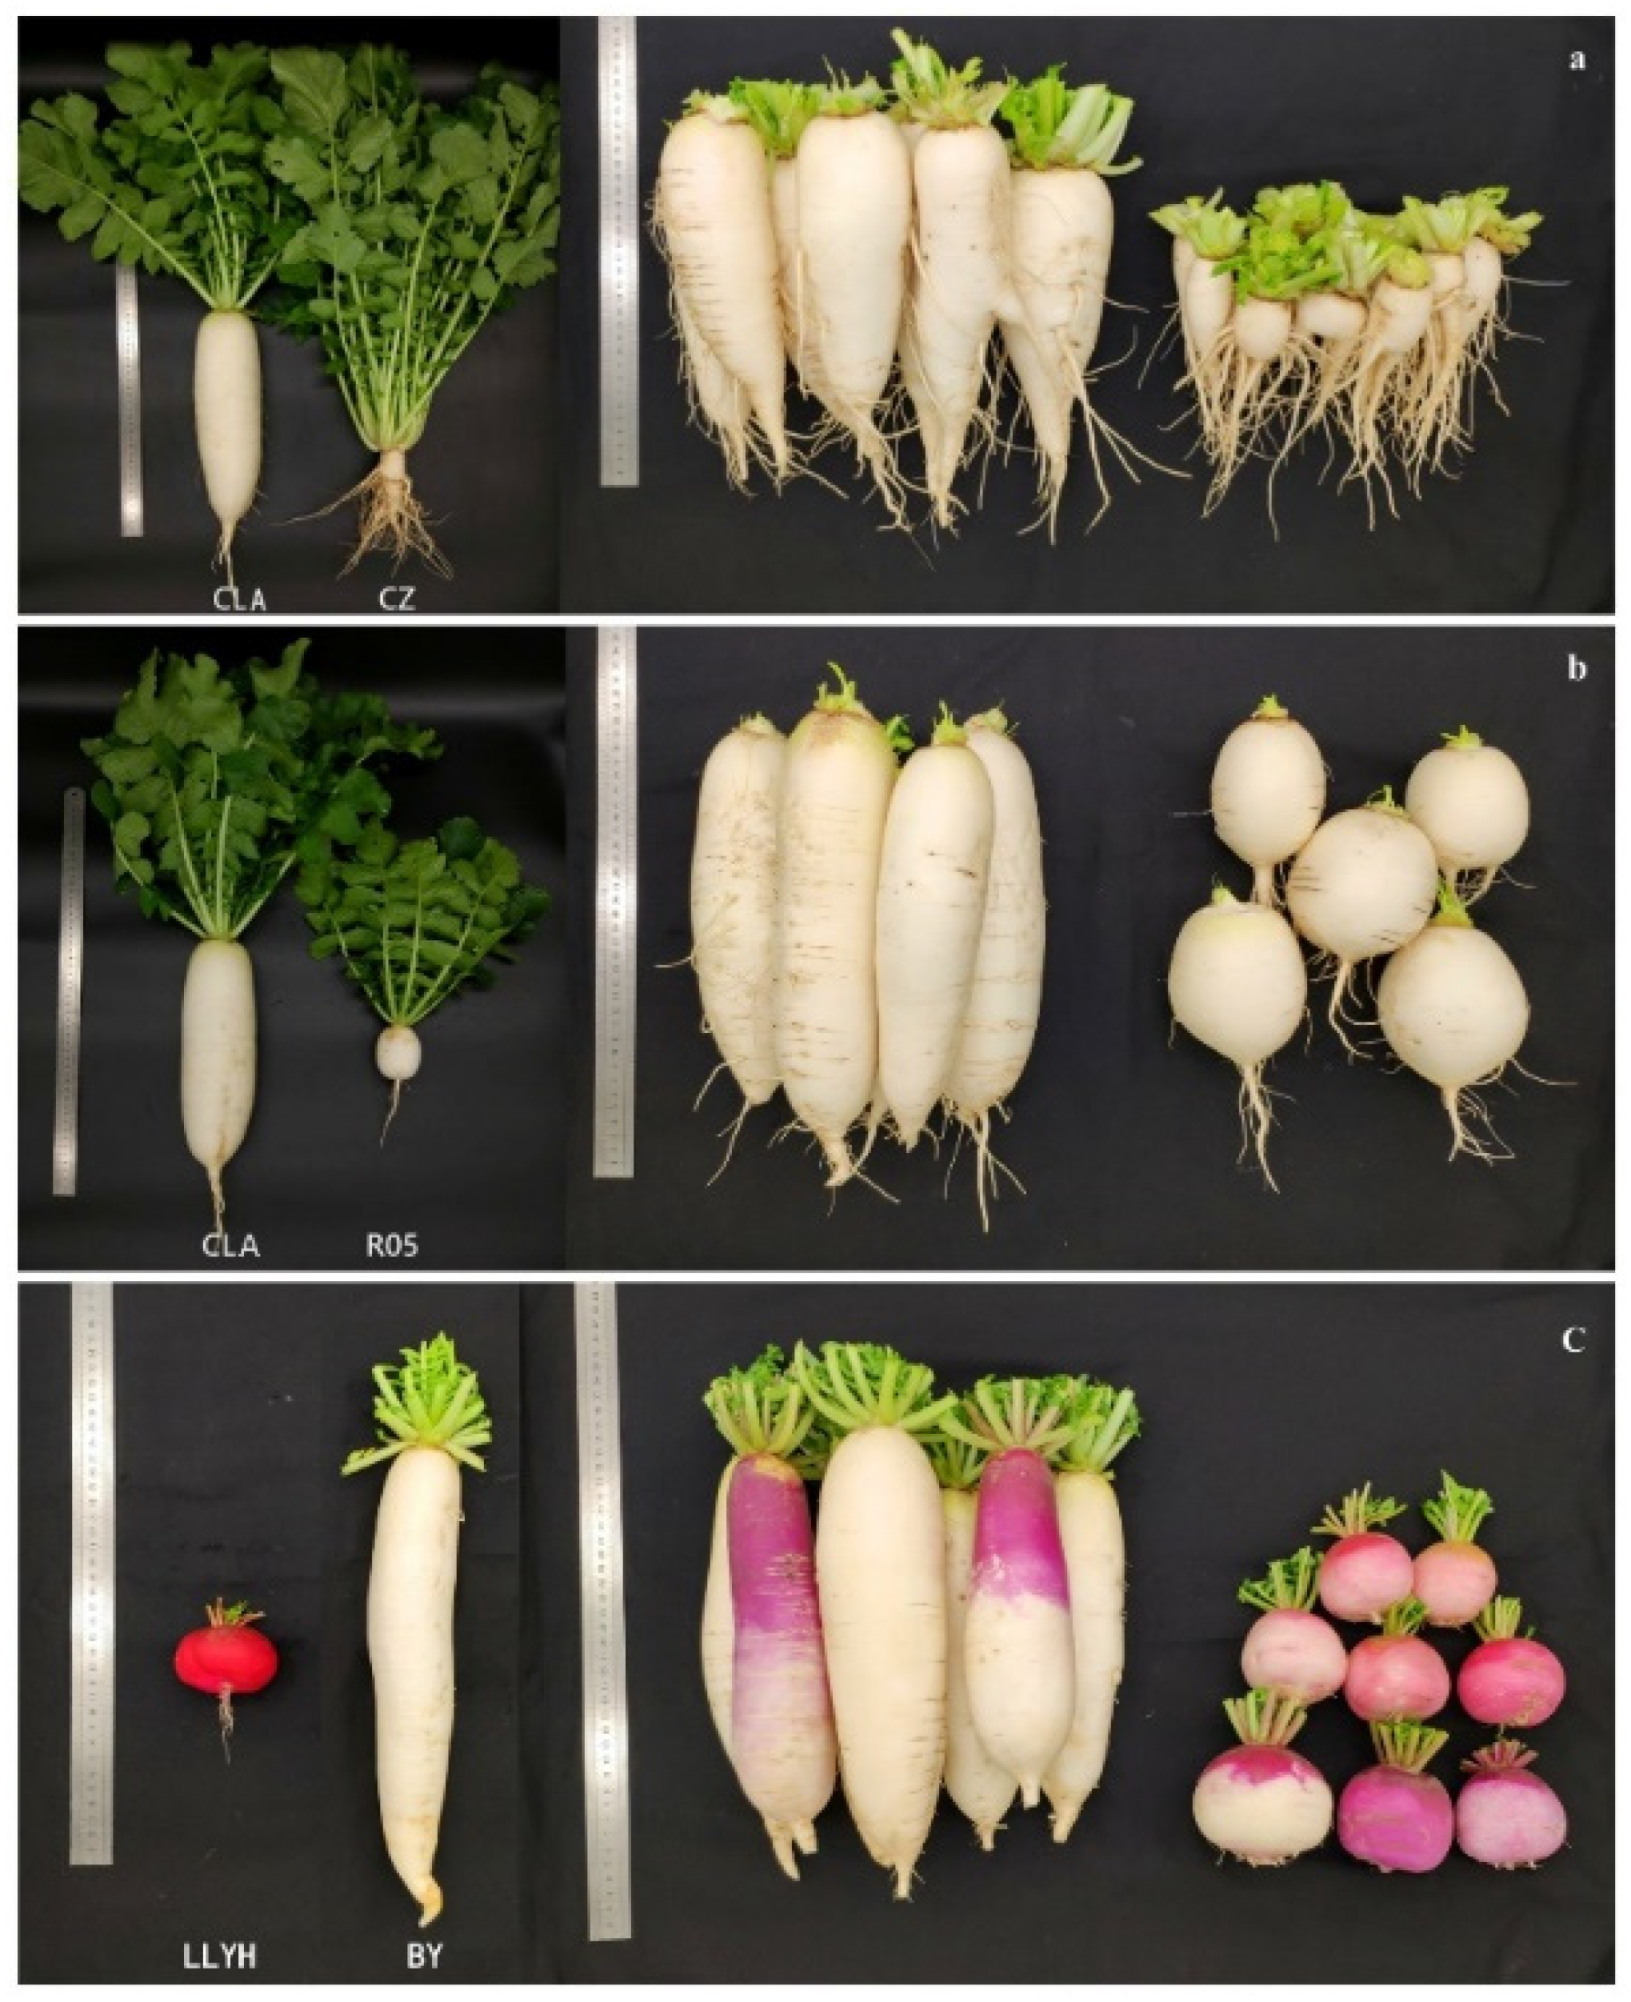
2.1. Plant Materials

Three F2 populations derived from independent crosses were developed and evaluated regarding their root shape index (Figure 1; Table 1). A total of five inbred line parents were used, among which CZ was leaf radish without enlarged fleshy roots. LLYH was a small oblate radish with a fleshy root length of 3.0 cm and a maximum diameter of 3.5 cm at normal maturity. CLA was a large, long white radish, with fleshy roots that were oblate, long and conical, had a normal maturity length of approximately 50.0 cm and had a maximum diameter of approximately 8.0 cm. R05 was a small oval radish with a normal maturity length of 5.5 cm and a maximum diameter of 5.0 cm. BY was a slender white radish with a normal maturity length of approximately 60.0 cm and a maximum diameter of approximately 7.0 cm. The root length and diameter values mentioned above are approximate values corresponding to the normal commercial maturity stage of radish. The five parents were grown in September 2016. The F1 generation was obtained by hybridization in April 2017, which was then sown in September. The seeds of the F2 populations were obtained by the F1 in April 2018. Then, the F2 populations and the parents were planted in September, and phenotype data were calculated and analyzed. There were 432 individuals in the 1902 population, 397 individuals in the 1908 population and 453 individuals in the 1909 population.

2.2. Phenotypic Analysis

Since the growth period of the parents of the F2 population is quite different, the growth and maturity periods of each single F2 plant were expected to be different. However, to facilitate the statistical analysis of the phenotypic data of radish roots grown underground, we chose the same growth days for the measurement of phenotypic data. The parental F1 and F2 plants were grown in fall 2018 at the Qiaosi experimental field of Zhejiang Academy of Agricultural Sciences, Hangzhou, China. The seeds were sown on September 28. They were spaced 25.0 cm apart with ridges spaced 50.0 cm apart and grown under natural conditions. The radishes were all pulled up and measured on November 12 [1]. The root length and the maximum root diameter of 1282 F2 populations were measured regardless of the growth cycle and the fact that a growth time of 45 d was used, since the growing stages did not affect the root shape characteristic [2]. The RL/RD ratio was calculated as the root shape index value. The statistical analysis on phenotypic data was performed using Microsoft Excel 2019 (Microsoft, Seattle, WA, USA). The correlation coefficient R between the phenotypes was calculated according to the root length, root diameter and root shape index of the three F2 populations. Positive numbers of the R values represent a positive correlation, whereas negative numbers represent a negative correlation. All the measurements were performed with 30.0 cm digital display Vernier calipers.

2.3. DNA Isolation and Sequencing of Pooled Samples

The young leaves of the parents and F2 plants were sampled, and the samples were frozen with liquid nitrogen and stored in a −80 °C cryogenic refrigerator for later use. According to the calculated value of the root shape index, bulks containing the individual plants with extreme traits were selected for QTL-seq from each F2 population, except for the 1902 population. This is because the extremely small root shape individual in the 1902 population is the same as the parent CZ, which is rootless. According to the phenotypic data, approximately 35, 40 and 45 individuals with extreme phenotypes were selected for mixed pool sequencing for the F2 populations 1902, 1908 and 1909, respectively. The modified CTAB method was used to extract the DNA from each selected plant [23]. The quality of the DNA was detected by agarose gel electrophoresis, and the concentration of the DNA was simultaneously detected by NanoDrop. Then, the sample DNA was combined based on equal concentrations, and the small root shape index pool (S) and large root shape index pool (L) were formed. DNA samples from the five parents and six extreme pools of three F2 populations of radish were sequenced using the Illumina sequencing technology platform (Illumina, San Diego, CA, USA).

2.4. QTL-Seq Analysis

Using the newly published radish genome as a reference genome [22], BWA software (0.6.1-r104, WTSI, Cambridge, UK) was used to compare and localize the clean reads to the reference genome [24]. Then, we used the Picard analysis for repeat sequences (http://sourceforge.net/projects/picard/, accessed on 16 May 2019) to ensure the accuracy of the SNPs detected by GATK (Version 3.8, Cambridge, MA, USA) [25]. Partial rematching and base mass value correction were performed; GATK was used for SNP detection and filtering, and the final SNP data were obtained. The filtering of the SNPs was carried out as follows. SNPs with multiple genotypes were removed; then, SNPs with identical genotypes between the mixed pools and SNPs with recessive alleles in the mixed pools but not the parents were filtered out. Finally, high-quality credible SNPs were obtained. According to the QTL-seq method, we calculated the SNP index using a 1 Mb sliding window and 10 kb for the walking window [11]; then, we calculated the average value in each sliding window using the DISTANCE method to fit the ΔSNP index.

2.5. Gene Annotation and Expression Analysis of QTL Regions

SNPEFF software (Version: 4.3, Detroit, MI, USA) was used to annotate the variation in the SNPs located in QTL regions [26]. According to the regional variation in loci and the gene position information from the reference genome, the SNPs occurring in the intergenic regions, gene regions or CDS regions were analyzed and classified as synonymous mutations or nonsynonymous mutations. The GO (https://www.geneontology.org/, accessed on 7 June 2019) and KEGG (https://www.genome.jp/kegg/, accessed on 10 June 2019), databases were annotated in depth using BLAST software [27,28,29]. The location intervals of the QTLs on radish chromosomes R4 and R7 were combined and compared to the radish reference genome to obtain candidate genes [22]. The expression trends of candidate genes were analyzed based on the published transcriptome data of radish fleshy root development (7 d, 14 d, 20 d, 40 d, 60 d, 90 d) [3] using omicshare tools (https://www.omicshare.com/tools/, accessed on 14 September 2022).

3. Results

3.1. Phenotypic Data Analysis of the Radish Root Shape Characteristics

Three F2 populations (1902, 1908 and 1909) were constructed by the following crosses: CZ × CLA, R05 × CLA, LLYH × BY, respectively. Phenotypic data were collected from the three F2 populations and six parents. The growth periods of the parental radishes showed relatively large differences. For example, compared with the large, long white radish CLA, which usually needs ~80 days to become mature, the small oval radish LLYH only needs ~35 days. Meanwhile, BY needs ~70 days to reach maturity, and R05 needs ~50 days. A previous study showed that the root shape can be efficiently selected even 40 days after sowing, and breeding efficiency may improve by starting the selection at an early growth stage [2]. Combined with the maturing period of the five radish parents, the three F2 populations and parents were harvested and measured at 45 days of growth. The photographs of the parents at normal maturity and the extreme F2 plants at 45 days of growth are shown in Figure 1. The phenotypic data of the parents at 45 days of growth and the sequencing information from the mixed pools were collected (Table 1 and Table S1). The root length ranged greatly among the F2 individuals and parents, from 2.87 cm to 20.10 cm. By contrast, the root diameter ranged slightly, from 3.46 cm to 5.18 cm. The root shape index varied from 0.82 to 5.52. The largest root shape index was found for BY, with an average value of 5.52, followed by CLA at 4.82, LLYH at 0.82 and R05 at 1.01. Unlike the rest of the radish parents, which are usually consumed as root vegetables, CZ is mainly consumed as a leaf vegetable without enlarged fleshy roots. Thus, no phenotypic data were collected for root characteristics (Figure 1; Table 1). Notably, although one parent of the F2 population 1902 was a leaf radish, most individuals of the F2 plants formed enlarged fleshy roots (Table S1).

3.2. Inheritance of the Root Shape Index and Mixed Pools

The frequency distribution of the root shape index in the three F2 populations in radish was calculated. The root shape index in all the F2 populations showed a normal distribution (Figure 2), suggesting that the root shape index was inherited as a quantitative trait controlled by multiple genes [1]. The phenotypic data for root length and diameter from 1282 F2 individuals were statistically analyzed (Table S1), among which 432 plants were from the F2 population 1902, 397 plants were from the F2 population 1908, and 453 plants were from the F2 population 1909. Among them, approximately 10.07% and 9.93% of the individual plants with extreme phenotypes were selected for mixed pool sequencing for populations 1908 and 1909, respectively. For population 1902, because one of the parents was a leaf radish, and most of the F2 individuals had more fibrous roots, the number of individual plants in the mixed sequencing pools was reduced, accounting for approximately 8.10% of the population. In the 1902 population, the value of the root shape index ranged from 0.608 to 4.109. The 1909 population had the largest root index value of 4.468. In the 1908 population, the range of the root shape index was 0.847–3.643, which was smaller than that in the 1902 and 1909 populations. However, the minimum mean value of the three extremely small pools was 0.893 in the 1909 population, and the maximum mean value of the three extremely large pools was 3.253 in the 1902 population (Table 2).

3.3. Correlation among the Root Shape Characteristics in Radish

The correlation analysis was conducted based on the phenotypic data of the 1282 F2 individuals. The results showed that root length had a highly positive correlation with the root shape index, and root diameter was negatively correlated with the root shape index (Table S1). In the three F2 populations, the correlation between root length and the root shape index was 0.667, 0.800 and 0.845, and the correlation between root diameter and the root shape index was −0.294, −0.438 and −0.299. There was no significant correlation between root length and root diameter. Therefore, the root shape was predominantly determined by root length.

3.4. Sequencing of the Parents and Mixed Pools

A total of 152.11 Gb of data were generated, with the average Q30 reaching 93.12% and the GC content ranging from 37.26% to 38.00% (Table 3). The average mapping efficiency between the samples and the reference genome was 96.23%. The mapping rate was mostly around 96%, whereas it was only 92.54% between the leaf radish CZ and the reference genome, which was the lowest among all the samples. The average sequencing depth of the parents was 16.40×, and the average depth of the extreme pools was 23.00×. The genome coverage was 87.00% (at least one base coverage). The quality of the sequencing data was appropriate for meeting the requirements of the QTL-seq analysis.

3.5. Detection of QTLs

A total of seven QTLs associated with the root shape index were detected using QTL-seq, which were distributed on five radish chromosomes: chromosome 1 (R1; rs1.1), chromosome 2 (R2; rs2.1), chromosome 4 (R4; rs4.1 and rs4.2), chromosome 5 (R5; rs5.1) and chromosome 7 (R7; rs7.1 and rs7.2) (Figure 3, Table 4). rs4.1 was detected in the 1902 population and located within the 40.51–42.59 Mb region of chromosome R4, while the rs4.2 (42.71–45.81 Mb) locus was detected in the 1909 population and was very close to rs4.1. Nonetheless, there was no overlapping between the two QTLs on chromosome 4. rs7.1 was detected in the 1908 population (9.92–14.81 Mb), and rs7.2 was detected in the 1909 (13.79–15.35 Mb) population, with an overlap of 1.02 Mb (13.79–14.81 Mb). However, the two populations did not share common parents. Although the 1902 and 1908 populations shared a common parent (CLA), we did not detect the same QTLs. rs1.1 (13.06–16.37 Mb) and rs5.1 (27.54–28.60 Mb) were detected only in the 1902 population, while rs2.1 (32.07–33.43 Mb) was detected only in the 1909 population. The number of SNPs ranged from 2106 to 7471 SNPs in the seven QTL regions, among which 94,368 nonsynonymous SNPs were found. Detailed information on the SNPs and annotation information for the genes with nonsynonymous SNPs are listed in Tables S2 and S3. Further work is still needed to obtain the candidate genes that regulate the root shape from these SNPs, such as fine mapping or comprehensive omics analyses, to screen and obtain the candidate genes and carry out functional verification.

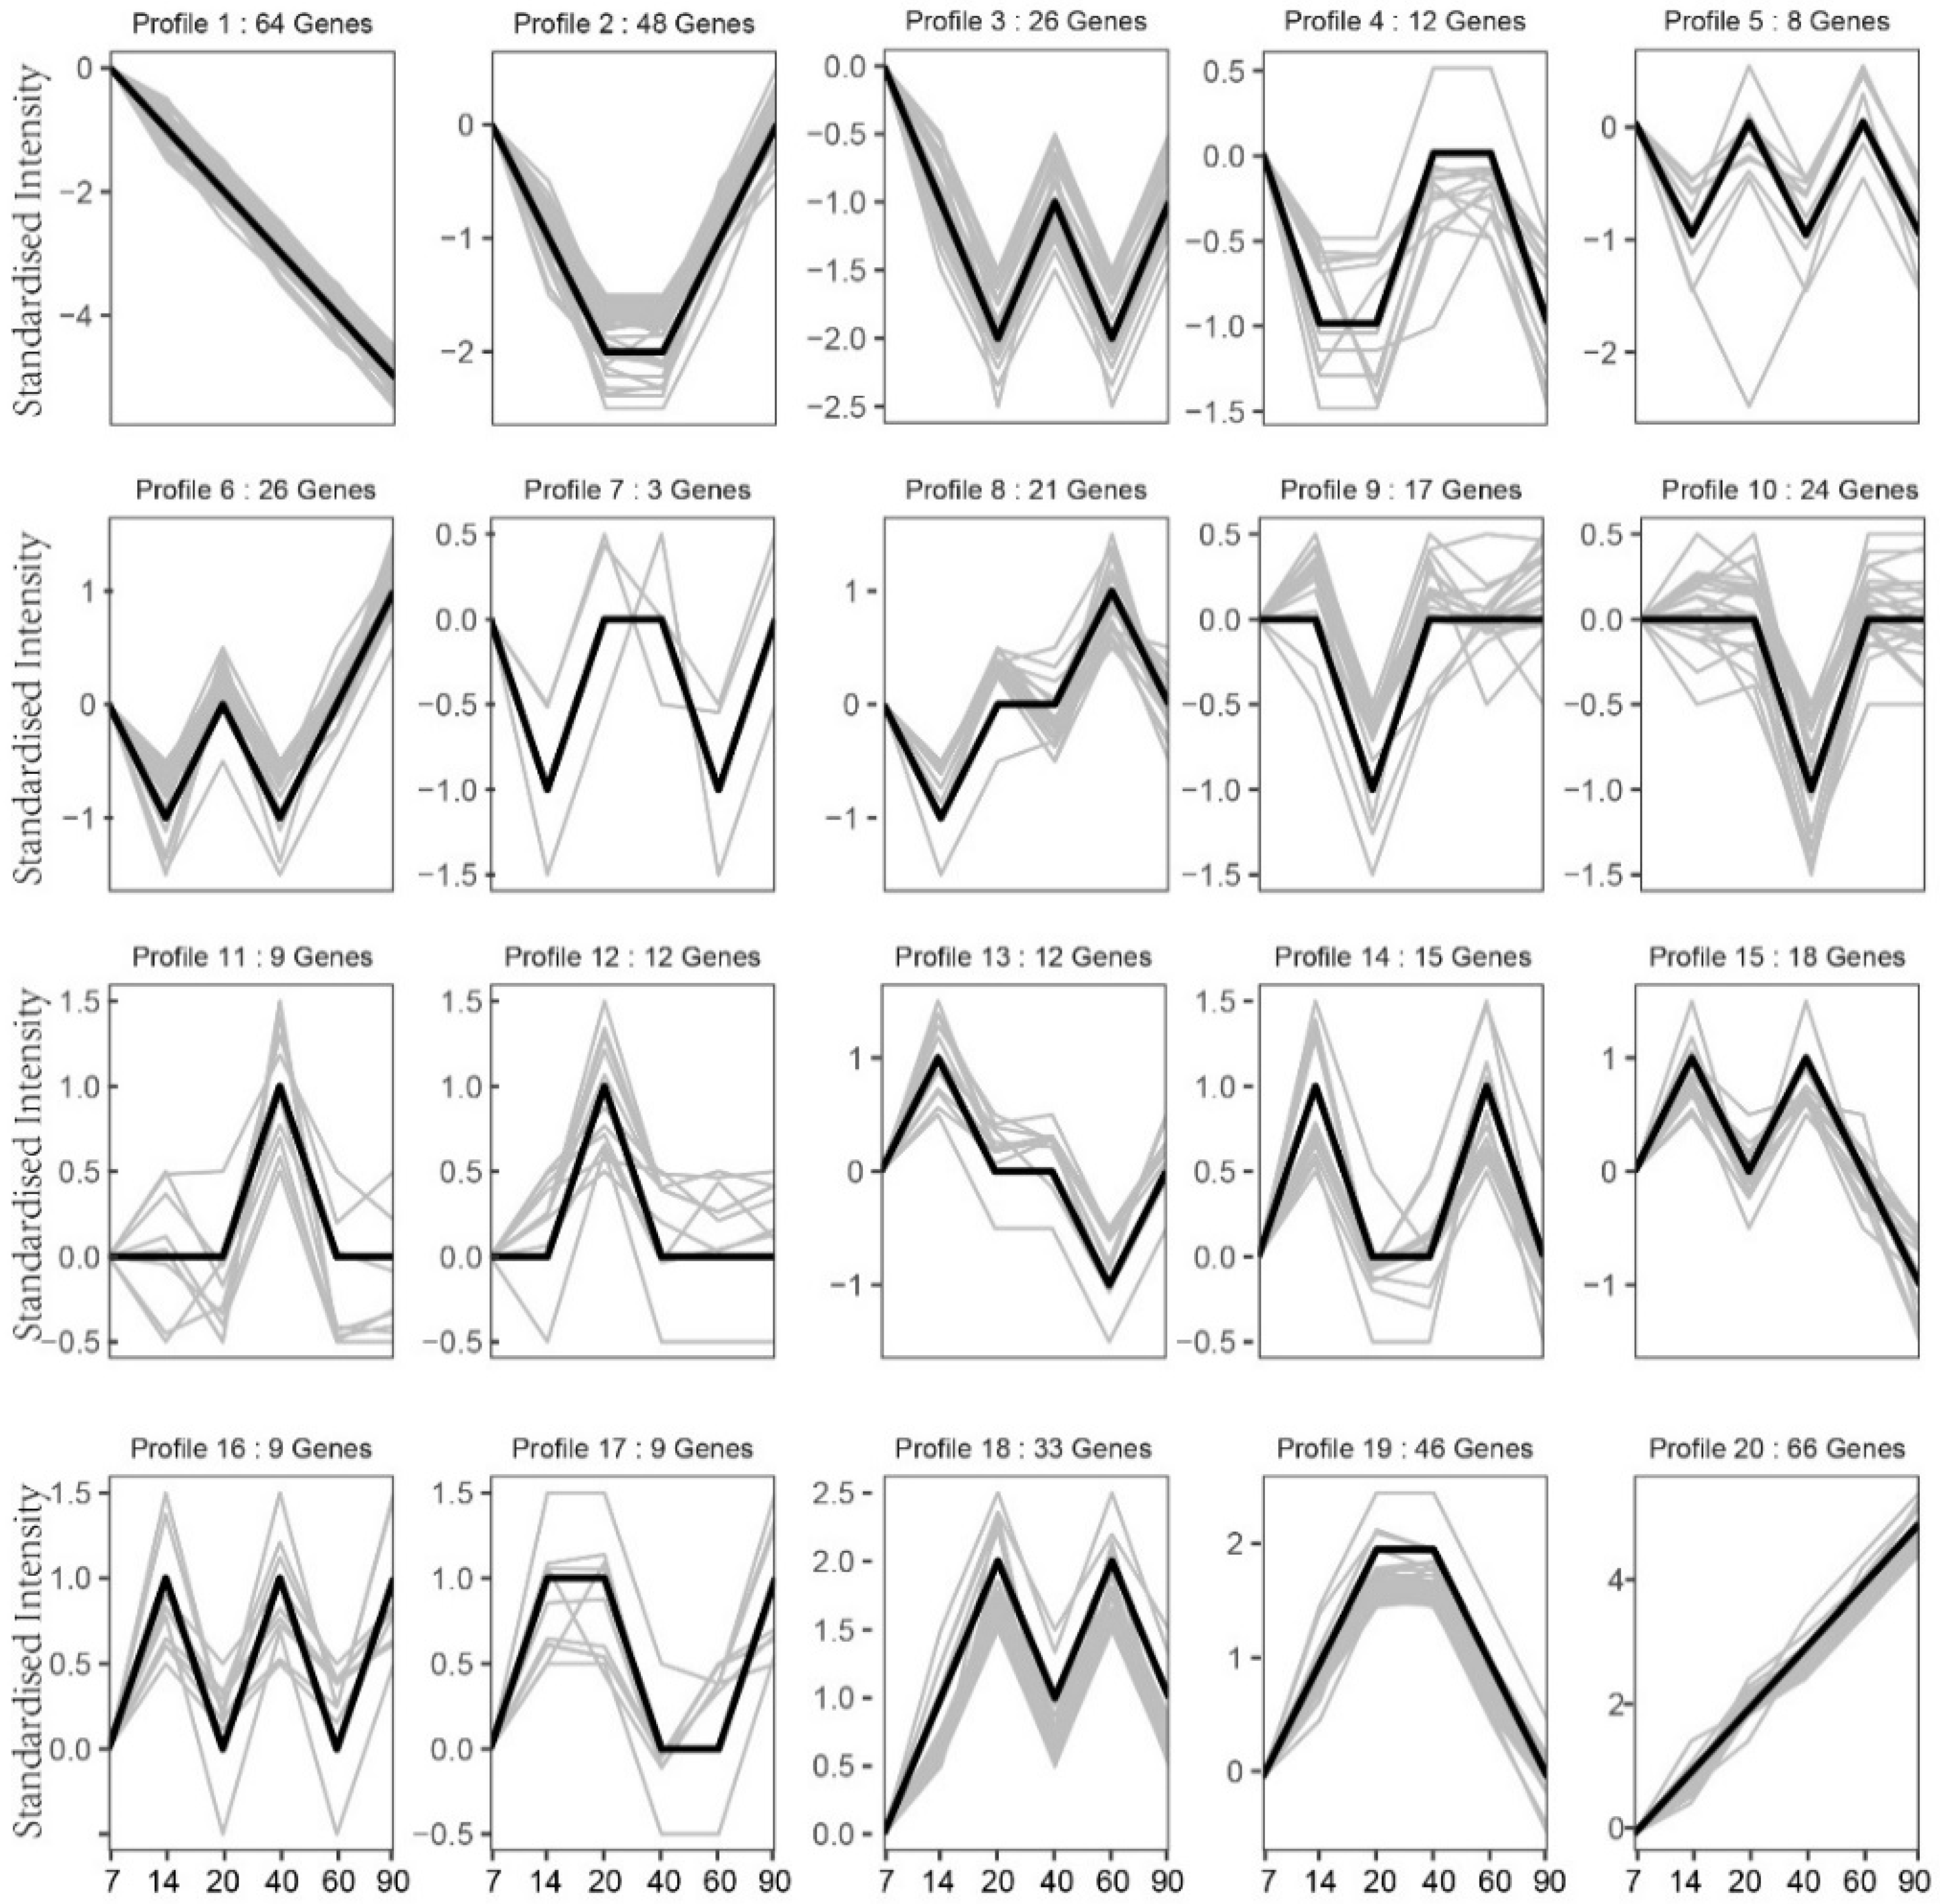
3.6. Gene Expression Trend Analysis

To further narrow down the number of candidate genes, the union sets of QTL regions (rs4.1 and rs4.2; rs7.1 and rs7.2) were analyzed. The expression patterns of genes in the region were investigated using the published transcriptome data of radish fleshy root development (7 d, 14 d, 20 d, 40 d, 60 d, 90 d) [3]. A total of 20 different expression patterns were found (Profile 1–20, Table S4). The expression patterns of Profile19 genes (46 genes) were upregulated at 7–20 days and maintained at a high expression level for 20–40 days, then gradually decreasing at 40–90 days (Figure 4). This expression pattern is consistent with the fleshy root development of radish. The expression patterns of Profile20 genes increased continuously with the development of radish fleshy roots (7 d to 90 d), which included 66 genes in total. Thereby, Profile19 and Profile20 genes are potentially the candidate genes related to the fleshy root shape of radish. The expression patterns of Profile19 and Profile20 genes were mainly annotated to three GO items: Biological Process, Cellular Component and Molecular Function. The Pfam annotation showed that the genes are associated with proteins such as bHLH-MYC/R2R3-MYB transcription factors, Auxin canalization and Glycosyl transferase family 2, etc. However, further work is still needed to find key candidate genes for radish root shape.

4. Discussion

Root formation is an essential process for radish cultivars, which are consumed fresh or cooked, especially in Asia [6]. Radish root shape is an important trait that determines commercial quality, which is not only regulated by multiple QTL genes but also affected by many complex factors. Studies have shown that external factors, such as light, temperature, moisture, carbon dioxide and soil conditions, could affect the length and diameter of fleshy radish roots, thus affecting the root shape index [30,31]. At the same time, radish root shape is also influenced by hormones, including auxin, cytokinin, gibberellin and ethylene [32,33]. Consequently, the mapping/fine mapping of QTLs or related genes is difficult due to the influence of these factors. In this study, five radish parents showing great differences in their root shape indices were used to construct three separate F2 populations (Figure 1). The growth periods of the parental radishes showed comparatively large differences. Since radish roots grow underground and must be harvested to measure traits, it is inapplicable to measure the phenotypic data directly. However, the interaction between genetic effects and growth stages did not appreciably affect the inheritance of root shape among the growth stages, and root shape can be efficiently selected at an early stage [2]. Therefore, centralized and unified harvesting was adopted in this study. Phenotypic data on the fleshy root length and diameter were measured on the 45th day of the growth period.
At present, few studies have been conducted on the QTL mapping of radish root shape index traits. For decades, the QTL mapping in radish has been conducted based on genetic linkage maps. The first genetic map in the genus Raphanus was constructed using 85 F2 and 54 BC1 populations derived from an interspecific hybrid between R. sativus and R. raphanistrum, which comprised 236 RFLPs and nine linkage groups [34]. Since then, over thirteen genetic maps have been constructed using various kinds of linkage markers, such as AFLPs, RAPDs, SSRs and SNPs [35]. However, there are several constraints for linkage-map-based QTL mapping in radish, such as insufficient marker number and population size, which resulted in more than nine linkage groups in the initial linkage maps. To date, more than five radish genome assemblies have been published, including chromosome-level genomes, providing an excellent opportunity for QTL mapping based on resequencing technologies. In the present study, QTL sequencing was performed combined with BSA on radish root shape using three F2 populations. Seven QTLs controlling radish root shape were detected and mapped to the chromosome-level radish genome [22], distributing on five chromosomes: two QTLs on R4 and R7, respectively, and one QTL for each of the R1, R2 and R5 (Figure 3, Table 4). In previous studies, QTLs for radish root characteristics were also identified using genetic maps. Three QTLs were detected for the root shape index of radish located on three linkage groups: LG3, 8 and 9 [1]. Moreover, two QTLs controlling root diameter were also detected on LG4 and LG8, among which the QTL on LG 8 also affected root shape via diameter [1]. Nonetheless, the genetic map was constructed using a segregated F2 population that comprised 14 linkage groups and fewer than 200 markers. According to Shirasawa and Kitashiba [35], the above linkage groups LG3, 4, 8 and 9 corresponded to radish chromosomes Rs3, 5, 4 and 1, respectively. Therefore, a common radish chromosome (R4) was shared by the root shape QTLs between the present study and those described in Ref [1]. Hashida et al. [6] constructed a genetic map composed of 322 markers with a recombinant inbred line (RIL) population and assigned the linkage groups to radish chromosomes. Seven QTLs were associated with fleshy root weight, which were located on two radish chromosomes: chromosome H (Rs7) and chromosome I (Rs2). In another study, 210 F2 populations and 258 SSR markers were used to construct a radish genetic map and detect QTLs for 11 morphological traits [7]. Among them, 18 QTLs were associated with radish root characteristics, including weight, length, diameter and shape. However, the QTLs in Yu et al. [7] were initially mapped to radish scaffolds in accordance with the Arabidopsis thaliana chromosomes. Recently, Luo et al. [8] constructed a high-density genetic map containing 378,738 SNPs in nine radish linkage groups (LGs). Five QTLs were detected for radish root length, diameter and weight on five linkage groups LG1, 2, 5 and 8, which shared three common chromosomes with the root shape QTLs detected in the present study (Figure 3). Although previous studies have been reported on root shape mapping using genetic maps, it is difficult to compare the genetic intervals with each other or the results from the present study due to the insufficient information on the genetic maps and markers. The seven QTLs identified in this study were mapped to a ‘physical’ map using the latest chromosome-level radish genome, making it a good foundation for further QTL mapping of root shape characters.
Among the two QTLs on radish chromosome 7, the rs7.1 in the 1908 population and rs7.2 in the 1909 population had an overlapping region of 1.02 Mb, despite the two populations not sharing common parents. On the other hand, the 1902 population and 1908 population had a common large root parent CLA, but no common QTLs were detected in the two populations. Several reasons are probably attributed to this result. Firstly, the radish parent CZ in the 1902 population has no intumescent fleshy root, whereas the parent ‘R05’ in the 1908 population has a small, white root. The common parent CLA is a large white root type. There may be a number of QTL sites involved in the radish domestication/evolution from non-intumescent fleshy roots to small turnip roots and finally to large fleshy roots. The QTL loci may play the main role in some of the radish cultivars or be lost during the domestication process of other radish cultivars or even be replaced by other QTL sites. Secondly, many factors affected the phenotype of radish fleshly root, such as soil environment, temperature, light or other growth environment, and timing of phenotypic data collection, which would lead to the differences of QTL mapping. We used three F2 populations to detect QTL sites related to radish fleshy root shape in order to discover reliable QTL sites that could be repeatedly detected. Since radish fleshy roots grow underground and are affected by environmental factors, recombinant inbred line (RIL) populations are needed in the future QTL mapping studies. In this way, multiple repeated phenotypes of individuals and multi-year experiments can increase the accuracy of the radish root shape measurement for QTL mapping. Meanwhile, more QTL mapping studies on the radish root shape index are needed to find consistent QTLs in combination with special populations.
Previous studies have focused on the transcriptome, miRNA and proteome of radish roots at different developmental stages. Eleven genes were found associated with radish fleshy root shapes using suppression subtractive hybridization [5]. Mitsui et al. [3] conducted transcriptome analyses and found that genes related to carbohydrate metabolism were active in the developing roots. Moreover, the sucrose synthase (SUS1) gene was also related to the development of roots [3]. Two sucrose metabolism genes (RsSuSy1 and RsSPS1) and the RsCLE41 and RsSAUR genes were cloned and analyzed and were found related to root formation in radish [32]. Muvva et al. [36] identified 48 conserved miRNAs in radish and predicted 16 potential genes involving radish root shape. The differentially expressed genes found in the above studies are useful for the mining of candidate genes in the QTL region and verifying whether the candidate genes are related to the shape of the radish root. However, differences between the referred genome versions make it difficult to analyze the related sequence information of these genes. In this study, we analyzed the expression patterns of genes within the union sets of the QTL regions (rs4.1 and rs4.2; rs7.1 and rs7.2). In the 20 different expression patterns (Table S4), the expression patterns of Profile19 (46 genes) and Profile20 genes (66 genes) corresponded to the development of radish fleshy root (Figure 4). These genes were mainly annotated to three GO items: Biological Process, Cellular Component and Molecular Function. It is still necessary to narrow down the QTL interval to obtain the key candidate genes regulating the root shape as well as function verification. In addition, comparative transcriptomics and metabolomics analysis combined with fine mapping would be helpful. The present study laid a foundation for subsequent fine mapping and gene mining associated with radish root shape characteristics.

5. Conclusions

In this study, three segregating F2 populations derived from independent crosses were developed and evaluated for root shape index traits. Combined with the latest radish reference genome, seven QTLs related to the root shape index were obtained by QTL-seq analysis. The number of SNPs within the seven QTL regions was calculated, and the genes associated with the nonsynonymous SNPs were annotated. These results laid a foundation for the development of molecular markers linked to root shape index traits and provided an important reference for fine mapping the genes controlling the root shape.

Supplementary Materials

The following supporting information can be downloaded at: https://www.mdpi.com/article/10.3390/horticulturae8100931/s1, Table S1: Phenotypic data of three F2 populations. Table S2: SNP index data statistics of QTL candidate regions. Table S3: Gene and annotation information in QTL candidate regions. Table S4: Expression levels of the candidate genes within the QTLs regions on radish chromosomes R4 and R7.

Author Contributions

Conceptualization, C.B. and T.H.; Data curation, Q.W., J.W., W.W. and H.H.; Funding acquisition, C.B. and T.H.; Investigation, Q.W. and W.W.; Methodology, Q.W. and J.W.; Project administration, C.B.; Supervision, Y.Y.; Validation, H.H. and Y.Y.; Writing—original draft, Q.W.; Writing—review & editing, Y.Y., C.B. and T.H.. All authors offered suggestions on various drafts of the manuscript. All authors have read and agreed to the published version of the manuscript.

Funding

This research was funded by Zhejiang Provincial Natural Science Foundation of China under Grant No. LGN19C060002, National Technology System of Commodity Vegetable Industry-radish under Grant No. CARS-23-A09 and New Variety Breeding Project of the Major Science Technology Projects of Zhejiang under Grant No. 2021C02051-2-2.

Data Availability Statement

Raw sequence reads have been submitted to the NCBI Sequence Read Archive under the accession number PRJNA836770.

Conflicts of Interest

The authors declare no conflict of interest.

References

  1. Tsuro, M.; Suwabe, K.; Kubo, N.; Matsumoto, S.; Hirai, M. Mapping of QTL controlling root shape and red pigmentation in radish, Raphanus sativus L. Breed. Sci. 2008, 58, 55–61. [Google Scholar] [CrossRef] [Green Version]
  2. Iwata, H.; Niikura, S.; Matsuura, S.; Takano, Y.; Ukai, Y. Interaction between genetic effects and soil type in diallel analysis of root shape and size of Japanese radish (Raphanus sativus L.). Breed. Sci. 2004, 54, 313–318. [Google Scholar] [CrossRef] [Green Version]
  3. Mitsui, Y.; Shimomura, M.; Komatsu, K.; Namiki, N.; Shibata-Hatta, M.; Imai, M.; Katayose, Y.; Mukai, Y.; Kanamori, H.; Kurita, K.; et al. The radish genome and comprehensive gene expression profile of tuberous root formation and development. Sci. Rep. 2015, 5, 10835. [Google Scholar] [CrossRef] [PubMed] [Green Version]
  4. Li, X.X.; Shen, D. The Description Criterion of Radish Germplasm; China Agriculture Press: Beijing, China, 2008; pp. 25–26. [Google Scholar]
  5. Zaki, H.E.M.; Yokoi, S.; Takahata, Y. Identification of genes related to root shape in radish (Raphanus sativus) using suppression subtractive hybridization. Breed. Sci. 2010, 60, 130–138. [Google Scholar] [CrossRef] [Green Version]
  6. Hashida, T.; Nakatsuji, R.; Budahn, H.; Schrader, O.; Peterka, H.; Fujimura, T.; Kubo, N.; Hirai, M. Construction of a chromosome-assigned, sequence-tagged linkage map for the radish, Raphanus sativus L. and QTL analysis of morphological traits. Breed. Sci. 2013, 63, 218–226. [Google Scholar] [CrossRef] [Green Version]
  7. Yu, X.N.; Choi, S.R.; Dhandapani, V.; Rameneni, J.J.; Li, X.N.; Pang, W.X.; Lee, J.Y.; Lim, Y.P. Quantitative Trait Loci for Morphological Traits and their Association with Functional Genes in Raphanus sativus. Front. Plant Sci. 2016, 7, 255. [Google Scholar] [CrossRef] [Green Version]
  8. Luo, X.B.; Xu, L.; Wang, Y.; Dong, J.H.; Chen, Y.L.; Tang, M.J.; Fan, L.X.; Zhu, Y.L.; Liu, L.W. An ultra-high-density genetic map provides insights into genome synteny, recombination landscape and taproot skin colour in radish (Raphanus sativus L.). Plant Biotechnol. J. 2020, 18, 274–286. [Google Scholar] [CrossRef] [Green Version]
  9. Wang, S.F.; Wang, X.F.; He, Q.W.; Liu, X.X.; Xu, W.L.; Li, L.B.; Gao, J.W.; Wang, F.D. Transcriptome analysis of the roots at early and late seedling stages using Illumina paired-end sequencing and development of EST-SSR markers in radish. Plant Cell Rep. 2012, 31, 1437–1447. [Google Scholar] [CrossRef]
  10. Yu, R.G.; Wang, J.; Xu, L.; Wang, Y.; Wang, R.H.; Zhu, X.W.; Sun, X.C.; Luo, X.B.; Xie, Y.; Everlyne, M.; et al. Transcriptome profiling of taproot reveals complex regulatory networks during taproot thickening in radish (Raphanus sativus L.). Front. Plant Sci. 2016, 7, 1210. [Google Scholar] [CrossRef] [Green Version]
  11. Takagi, H.; Abe, A.; Yoshida, K.; Kosugi, S.; Natsume, S.; Mitsuoka, C.; Uemura, A.; Utsushi, H.; Tamiru, M.; Takuno, S.; et al. QTL-seq: Rapid mapping of quantitative trait loci in rice by whole genome resequencing of DNA from two bulked populations. Plant J. 2013, 74, 174–183. [Google Scholar] [CrossRef]
  12. Lu, H.F.; Lin, T.; Klein, J.; Wang, S.H.; Qi, J.J.; Zhou, Q.; Sun, J.J.; Zhang, Z.H.; Weng, Y.Q.; Huang, S.W. QTL-seq identifies an early flowering QTL located near Flowering Locus T in cucumber. Theor. Appl. Genet. 2014, 127, 1491–1499. [Google Scholar] [CrossRef] [PubMed]
  13. Illa-Berenguer, E.; Van Houten, J.; Huang, Z.J.; van der Knaap, E. Rapid and reliable identification of tomato fruit weight and locule number loci by QTL-seq. Theor. Appl. Genet. 2015, 128, 1329–1342. [Google Scholar] [CrossRef] [PubMed]
  14. Anurag, D.; Sweta, D.; Rishi, S.; Saurabh, B.; Singh, A.K.; Pinky, A.; Parida, S.K.; Tyagi, A.K. An efficient strategy combining SSR markers and advanced QTL-seq-driven QTL mapping unravels candidate genes regulating grain weight in rice. Front. Plant Sci. 2016, 7, 1535. [Google Scholar]
  15. Wei, Q.Z.; Fu, W.Y.; Wang, Y.Z.; Qin, X.D.; Wang, J.; Li, J.; Lou, Q.F.; Chen, J.F. Rapid identification of fruit length loci in cucumber (Cucumis sativus L.) using next-generation sequencing (NGS)-based QTL analysis. Sci. Rep. 2016, 6, 27496. [Google Scholar] [CrossRef]
  16. Liu, T.J.; Wang, J.L.; Wu, C.H.; Zhang, Y.J.; Zhang, X.H.; Li, X.M.; Wang, H.P.; Song, J.P.; Li, X.X. Combined QTL-seq and traditional linkage analysis to identify candidate genes for purple skin of radish fleshy taproots. Front. Genet. 2019, 10, 808. [Google Scholar] [CrossRef]
  17. Wang, Q.B.; Wang, Y.P.; Sun, H.H.; Sun, L.; Zhang, L. Transposon-induced methylation of the RsMYB1 promoter disturbs anthocyanin accumulation in red-fleshed radish. J. Exp. Bot. 2020, 71, 2537–2550. [Google Scholar] [CrossRef]
  18. Kitashiba, H.; Li, F.; Hirakawa, H.; Kawanabe, T.; Zou, Z.W.; Hasegawa, Y.; Tonosaki, K.; Shirasawa, S.; Fukushima, A.; Yokoi, S.; et al. Draft sequences of the radish (Raphanus sativus L.) genome. DNA Res. 2014, 21, 481–490. [Google Scholar] [CrossRef] [Green Version]
  19. Moghe, G.D.; Hufnagel, D.E.; Tang, H.B.; Xiao, Y.L.; Dworkin, I.; Town, C.D.; Conner, J.K.; Shiu, S.H. Consequences of whole-genome triplication as revealed by comparative genomic analyses of the wild radish Raphanus raphanistrum and three other Brassicaceae Species. Plant Cell 2014, 26, 1925–1937. [Google Scholar] [CrossRef] [Green Version]
  20. Zhang, X.H.; Yue, Z.; Mei, S.Y.; Qiu, Y.; Yang, X.H.; Chen, X.H.; Cheng, F.; Wu, Z.Y.; Sun, Y.Y.; Jing, Y.; et al. A de novo genome of a Chinese Radish Cultivar. Hortic. Plant J. 2015, 1, 155–164. [Google Scholar]
  21. Jeong, Y.M.; Kim, N.; Ahn, B.O.; Oh, M.; Chung, W.H.; Chung, H.; Jeong, S.; Lim, K.B.; Hwang, Y.J.; Kim, G.B.; et al. Elucidating the triplicated ancestral genome structure of radish based on chromosome-level comparison with the Brassica genomes. Theor. Appl. Genet. 2016, 129, 1357–1372. [Google Scholar] [CrossRef]
  22. Shirasawa, K.; Hirakawa, H.; Fukino, N.; Kitashiba, H.; Isobe, S. Genome sequence and analysis of a Japanese radish (Raphanus sativus) cultivar named ‘Sakurajima Daikon’ possessing giant root. DNA Res. 2020, 27, dsaa010. [Google Scholar] [CrossRef] [PubMed]
  23. Murray, M.G.; Thompson, W.F. Rapid isolation of high molecular weight plant DNA. Nucleic Acids Res. 1980, 8, 4321–4326. [Google Scholar] [CrossRef] [PubMed]
  24. Li, H.; Durbin, R. Fast and accurate short read alignment with Burrows-Wheeler transform. Bioinformatics 2009, 25, 1754–1760. [Google Scholar] [CrossRef] [PubMed] [Green Version]
  25. Mckenna, A.; Hanna, M.; Banks, E.; Sivachenko, A.; Cibulskis, K.; Kernytsky, A.; Garimella, K.; Altshuler, D.; Gabriel, S.; Daly, M. The Genome Analysis Toolkit: A MapReduce framework for analyzing next-generation DNA sequencing data. Genome Res. 2010, 20, 1297–1303. [Google Scholar] [CrossRef] [Green Version]
  26. Cingolani, P.; Platts, A.; Wang, L.L.; Coon, M.; Nguyen, T.; Wang, L.; Land, S.J.; Lu, X.Y.; Ruden, D.M. A program for annotating and predicting the effects of single nucleotide polymorphisms, SnpEff: SNPs in the genome of Drosophila melanogaster strain w1118; iso-2; iso-3. Fly 2012, 6, 80–92. [Google Scholar] [CrossRef] [Green Version]
  27. Altschul, S.F.; Madden, T.L.; Schaffer, A.A.; Zhang, J.H.; Zhang, Z.; Miller, W.; Lipman, D.J. Gapped BLAST and PSI-BLAST: A new generation of protein database search programs. Nucleic Acids Res. 1997, 25, 3389–3402. [Google Scholar] [CrossRef] [Green Version]
  28. Ashburner, M.; Ball, C.A.; Blake, J.A.; Botstein, D.; Cherry, J.M. Gene ontology: Tool for the unification of biology. The Gene Ontology Consortium. Nat. Genet. 2000, 25, 25–29. [Google Scholar] [CrossRef] [Green Version]
  29. Kanehisa, M.; Goto, S.; Kawashima, S.; Okuno, Y.; Hattori, M. The KEGG resource for deciphering the genome. Nucleic Acids Res. 2004, 32, D277–D280. [Google Scholar] [CrossRef] [Green Version]
  30. Choi, E.Y.; Seo, T.C.; Lee, S.G.; Cho, I.H.; Stangoulis, J. Growth and physiological responses of Chinese cabbage and radish to long-term exposure to elevated carbon dioxide and temperature. Hortic. Environ. Biotechnol. 2011, 52, 376–386. [Google Scholar] [CrossRef]
  31. Samuolien, G.; Sirtautas, R.; Brazaityt, A.; Sakalauskait, J.; Sakalauskien, S.; Duchovskis, P. The impact of red and blue light-emitting diode illumination on radish physiological indices. Cent. Eur. J. Biol. 2011, 6, 821–828. [Google Scholar] [CrossRef]
  32. Yu, R.G.; Wang, Y.; Xu, L.; Zhu, X.W.; Zhang, W.; Wang, R.H.; Gong, Y.Q.; Limera, C.; Liu, L.W. Transcriptome profiling of root microRNAs reveals novel insights into taproot thickening in radish (Raphanus sativus L.). BMC Plant Biol. 2015, 15, 30. [Google Scholar] [CrossRef] [PubMed] [Green Version]
  33. Geupil, J.; Jung-Hun, L.; Khushboo, R.; Suhyoung, P.; Sang-Hun, O.; Ji-Young, L. Cytokinin-dependent secondary growth determines root biomass in radish (Raphanus sativus L.). J. Exp. Bot. 2015, 66, 4607–4619. [Google Scholar]
  34. Bett, K.E.; Lydiate, D.J. Genetic analysis and genome mapping in Raphanus. Genome 2003, 46, 423–430. [Google Scholar] [CrossRef] [PubMed]
  35. Shirasawa, K.; Kitashiba, H. Genetic maps and whole genome sequences of Radish. In The Radish Genom; Nishio, T., Kitashiba, H., Eds.; Springer: Cham, Switzerland, 2017; Volume 3, pp. 31–42. [Google Scholar]
  36. Muvva, C.; Tewari, L.; Aruna, K.; Ranjit, P.; Zahoorullah, S.; Matheen, K.; Veeramachaneni, H. In silico identification of miRNAs and their targets from the expressed sequence tags of Raphanus sativus. Bioinformation 2012, 8, 98–103. [Google Scholar] [CrossRef] [PubMed]
Figure 1. Roots of the parents at their corresponding complete growth periods and the roots of individuals with extreme phenotypes at 45 d of growth. (a) Parents of the CZ × CLA cross and extreme individuals from the 1902 population. (b) Parents of the R05 × CLA cross and extreme individuals from the 1908 population. (c) Parents from the LLYH × BY cross and extreme individuals from the 1909 population.
Horticulturae 08 00931 g001
Figure 2. Frequency distribution of the root shape index in three radish F2 populations.
Horticulturae 08 00931 g002
Figure 3. The Δ(SNP index) distribution of the QTLs for the root shape index detected by QTL-seq. (a) The Δ(SNP index) distribution of the 1902 population. (b) The Δ(SNP index) distribution of the 1908 population. (c) The Δ(SNP index) distribution of the 1909 population. The red lines represent the threshold lines with confidence of 0.99.
Horticulturae 08 00931 g003
Figure 4. Expression patterns of the candidate genes within the QTL regions. Profile 1–20 represent different expression patterns of the clusters of candidate genes within the union sets of QTL regions on R4 and R7 during the developmental process (7 d, 14 d, 20 d, 40 d, 60 d, 90 d). The number of genes is displayed at the top of each panel.
Horticulturae 08 00931 g004
Table 1. Phenotypic data of the parents at 45 days of growth. Three biological replicates were recorded.
F2 PopulationParentRoot Length/cmRoot Diameter/cmRoot Shape Index
1902CZ///
CLA18.66 ± 0.373.87 ± 0.094.82 ± 0.03
1908R055.23 ± 0.395.18 ± 0.391.01 ± 0.09
CLA18.66 ± 0.373.87 ± 0.094.82 ± 0.03
1909LLYH2.87 ± 0.063.46 ± 0.170.82 ± 0.04
BY20.10 ± 0.513.64 ± 0.085.52 ± 0.05
Table 2. Information on the mixed pools and phenotypic data for the three F2 populations.
F2 PopulationNumber of PlantsThe Minimum Value of the Root Shape IndexThe Maximum Value of the Root Shape IndexNumber of Plants in the Extreme PoolsMean Value of the Extremely Small PoolMean Value of the Extremely Large Pool
19024320.6084.109351.1053.253
19083970.8473.643401.1422.880
19094530.694.468450.8932.957
Table 3. Statistics of the sequencing data for the five parents and extreme pools.
NameClean ReadsClean BaseQ30 (%)GC (%)Mapped (%)Coverage Ratio 1× (%)Average Depth
CZ40,770,99312,203,297,05292.8138.0092.5484.6216
LLYH38,237,71211,441,633,03693.5737.4095.9182.7917
BY35,629,29910,664,593,30092.3137.5496.8683.0616
CLA34,695,07910,383,258,02692.8937.4596.6482.8215
R0537,984,42111,363,953,12692.9537.4096.7381.9518
S-pool-153,006,85015,872,724,85892.3637.4396.6790.2022
L-pool-152,964,01515,850,467,63493.9237.3496.6690.2523
S-pool-256,828,84117,010,808,84493.2037.2696.8390.2324
L-pool-253,796,88216,102,268,42893.7437.3296.8490.2623
S-pool-352,592,83615,736,253,79493.8537.3096.5890.1023
L-pool-351,721,71915,485,509,05492.7537.3696.2890.7122
Table 4. Summary of QTLs detected for the root shape index with QTL-seq.
PopulationQTLChr.StartEndInterval (Mb)No. of SNPs in the IntervalNo. of Genes with Nonsynonymous Mutations
1902rs1.1R113.0616.373.314753222
rs4.1R440.5142.592.085597215
rs5.1R527.5428.601.06227994
1908rs7.1R79.9214.814.897471368
1909rs2.1R232.0733.431.365514132
rs4.2R442.7145.812.102106122
rs7.2R713.7915.351.564954137
Publisher’s Note: MDPI stays neutral with regard to jurisdictional claims in published maps and institutional affiliations.

