Article

Development of an Optical System Based on Spectral Imaging Used for a Slug Control Robot

1
Department of Agricultural and Biosystems Engineering, University of Kassel, Nordbahnhofstr. 1a, 37213 Witzenhausen, Germany
2
Leibniz Institute for Agricultural Engineering and Bioeconomy (ATB), Max-Eyth Allee 100, 14469 Potsdam, Germany
3
Faculty of Life Sciences, Humboldt-University of Berlin, Hinter der Reinhardtstr. 8-18, 10115 Berlin, Germany
*
Author to whom correspondence should be addressed.
Horticulturae 2022, 8(1), 77; https://doi.org/10.3390/horticulturae8010077
Submission received: 8 December 2021 / Revised: 6 January 2022 / Accepted: 10 January 2022 / Published: 14 January 2022
(This article belongs to the Special Issue New Insights into Pest Management in Horticultural Production)

Abstract

:
The state-of-the-art technique to control slug pests in agriculture is the spreading of slug pellets. This method has some downsides, because slug pellets also harm beneficials and often fail because their efficiency depends on the prevailing weather conditions. This study is part of a research project which is developing a pest control robot to monitor the field, detect slugs, and eliminate them. Robots represent a promising alternative to slug pellets. They work independent of weather conditions and can distinguish between pests and beneficials. As a prerequisite, a robot must be able to reliably identify slugs irrespective of the characteristics of the surrounding conditions. In this context, the utilization of computer vision and image analysis methods are challenging, because slugs look very similar to the soil, particularly in color images. Therefore, the goal of this study was to develop an optical filter-based system that distinguishes between slugs and soil. In this context, the spectral characteristics of both slugs and soil in the visible and visible near-infrared (VNIR) wavebands were measured. Conspicuous maxima followed by conspicuous local minima were found for the reflection spectra of slugs in the near infrared range from 850 nm to 990 nm]. Thus, this enabled differentiation between slugs and soils; soils showed a monotonic increase in the intensity of the relative reflection for this wavelength. The extrema determined in the reflection spectra of slugs were used to develop and set up a slug detector device consisting of a monochromatic camera, a filter changer and two narrow bandpass filters with nominal wavelengths of 925 nm and 975 nm. The developed optical system takes two photographs of the target area at night. By subtracting the pixel values of the images, the slugs are highlighted, and the soil is removed in the image due to the properties of the reflection spectra of soils and slugs. In the resulting image, the pixels of slugs were, on average, 12.4 times brighter than pixels of soil. This enabled the detection of slugs by a threshold method.

1. Introduction

Slugs are a known pest of significant economic importance in agriculture [1,2]. The species Deroceras reticulatum and Arion vulgaris are harmful to crops such as canola (Brasicca napus), wheat (Triticum L.) and sugar beet (Beta vulgaris) [3,4,5]. The most common method for slug control is the spreading of slug pellets containing either metaldehyde or iron-III-phosphate as a molluscicide. These baits attract and harm insects or beneficial snails and slugs; however, they often fail because their efficiency is strongly dependent on weather conditions [6]. According to [7], pest control is a task that could be taken over by field robots. Slugs can be seen as easy prey for pest control robots, because they are relatively large and slow-moving [8]. Field robots represent a paradigm shift compared with the predominant large and heavy agricultural machines [9]. Agricultural field robots are practicable, because they increase the efficiency of products [10]. As [11] showed, the use of agricultural robots in the field has been the subject of many studies, and the technical feasibility has been largely proven. Within smart farming technologies, robotics plays an essential role in digitalization and has attracted increased attention in recent years. Fleets of robots have been used to increase crop quality and improve the health and safety of production operators while controlling pests [7]. Ref. [12] presents an example of the possibility of robot applications in the context of controlling slugs. Ref. [12] developed a robot that detects and collects slugs to feed a small-scale biogas reactor carried by the robot as a primary energy source.
Methods to investigate the chemical or physical properties behind the optical appearance of different surfaces or items by hyperspectral imaging have been established in different fields. For instance, [13,14] used hyperspectral imaging to detect plant diseases such as anthracnose in tea plants or powdery mildew disease in squash. Ref. [15] used hyperspectral imaging technique to detect pests, while working on striped stem-borer (Chilo suppressalis Walker)-infested rice seedling. Another study [16] used a portable hyperspectral camera to classify plants for weed control. Pest detection and classification in crops using machine learning based on proximal images and hyperspectral imaging techniques was reviewed in [17]. Ref. [18] developed a computer vision method which could detect invertebrates on crops coupled with machine learning techniques. In another study by this group, a multispectral machine vision system for invertebrate detection on green leaves was developed [19]. Furthermore, [20] reported a review of the detection of insects and demonstrated the challenges for detecting insects as a special problem of computer vision and applications of image classification in this context.
A robot to control slugs must be used directly after sowing. The risk to germinating plants is high at this point, and small marks of feeding may lead to the death of the entire plant. In addition, the use of robots to control pests at this early plant stage has the advantage that the robot may not need to differentiate between plants. Furthermore, slugs cannot hide under parts of the plant because the field is free of plants at this stage. To fight slugs with a field robot, a robust pest detection device is necessary. For instance, for the detection of D. reticulatum, [8] developed a detector where LEDs of visible to near-infrared light (VNIR—780 nm and above) and a filter to capture images of D. reticulatum on a field with a monochromatic camera was used. A threshold image processing method was developed to detect slugs in the taken images. However, technical details such as the wavelength of the light source or the used filters are not specified in their publication. In this study, we considered the fact that slugs mainly appear in the late evening or the early morning on the surface of the field, based on the study described by [12]. Furthermore, due to the darkness, no cover for shade was needed to avoid surrounding light effects on the image quality. The findings of [8] show that slugs of the varieties A. vulgaris and D. reticulatum cannot be detected by sensors. Both slugs are pests; therefore, the detection of both species is required for a pest-controlling field robot.
Hence, in this study, hyperspectral imaging was employed to detect slugs in the field. The objective of this study was to investigate the relative reflection of D. reticulatum and A. vulgaris on different soils to develop a slug detection device to be used in a slug control robot.

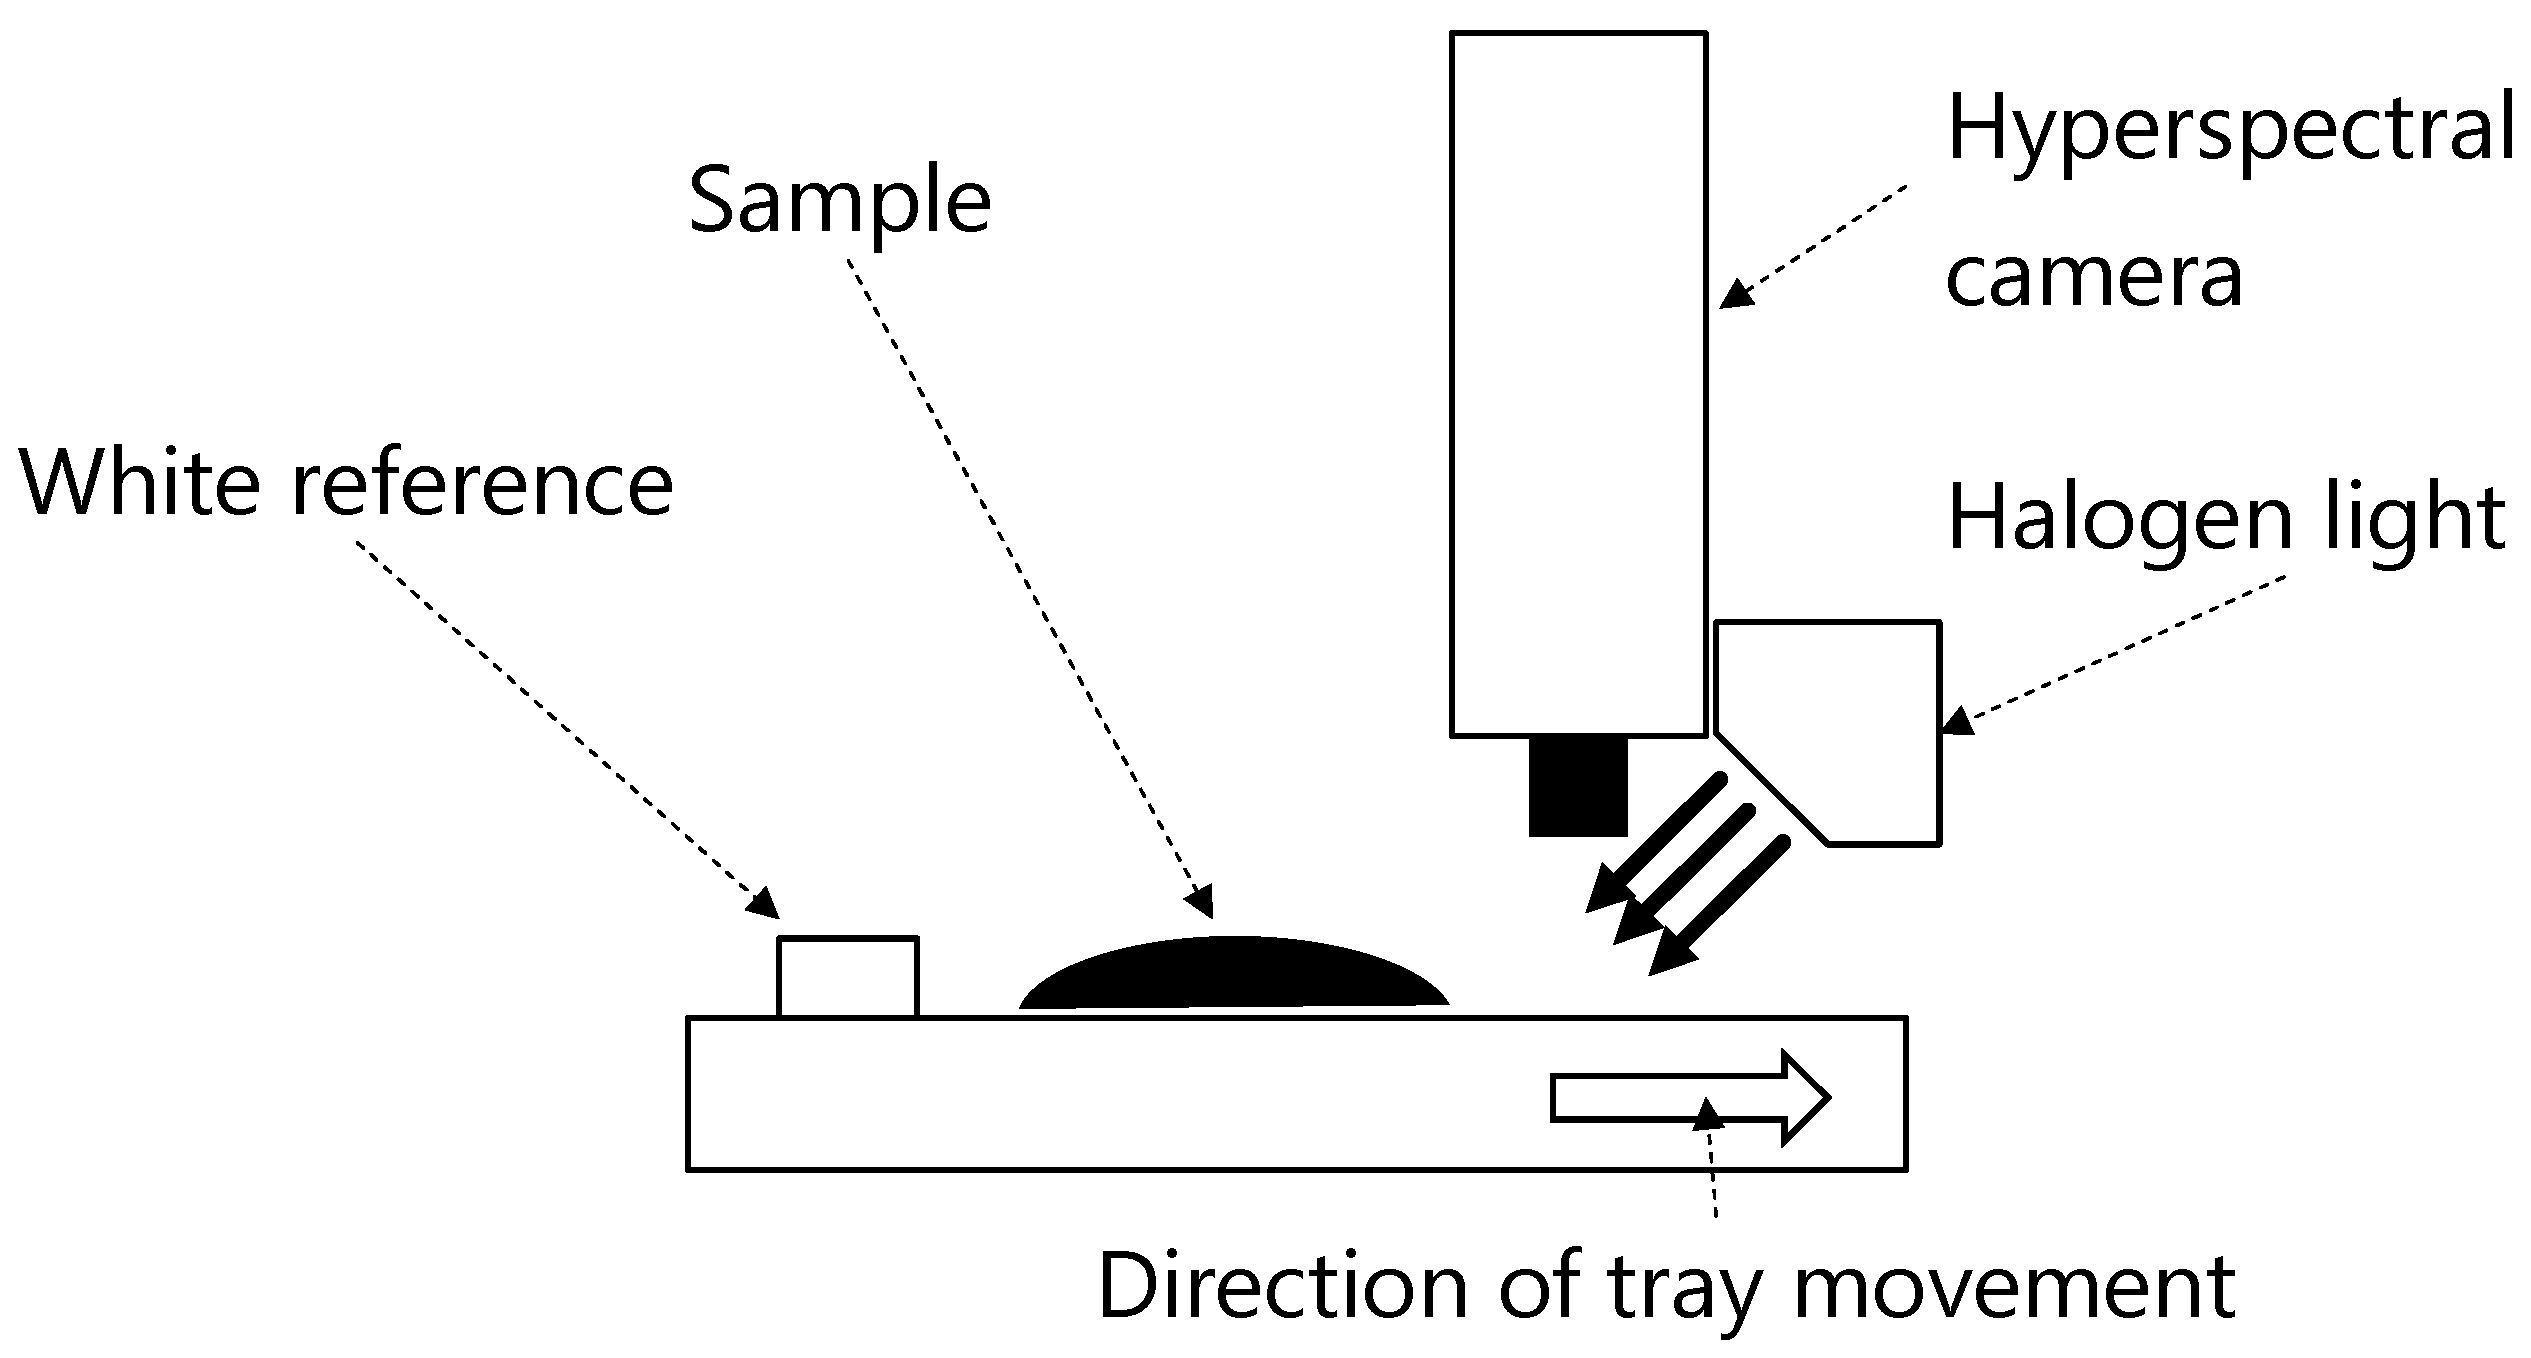
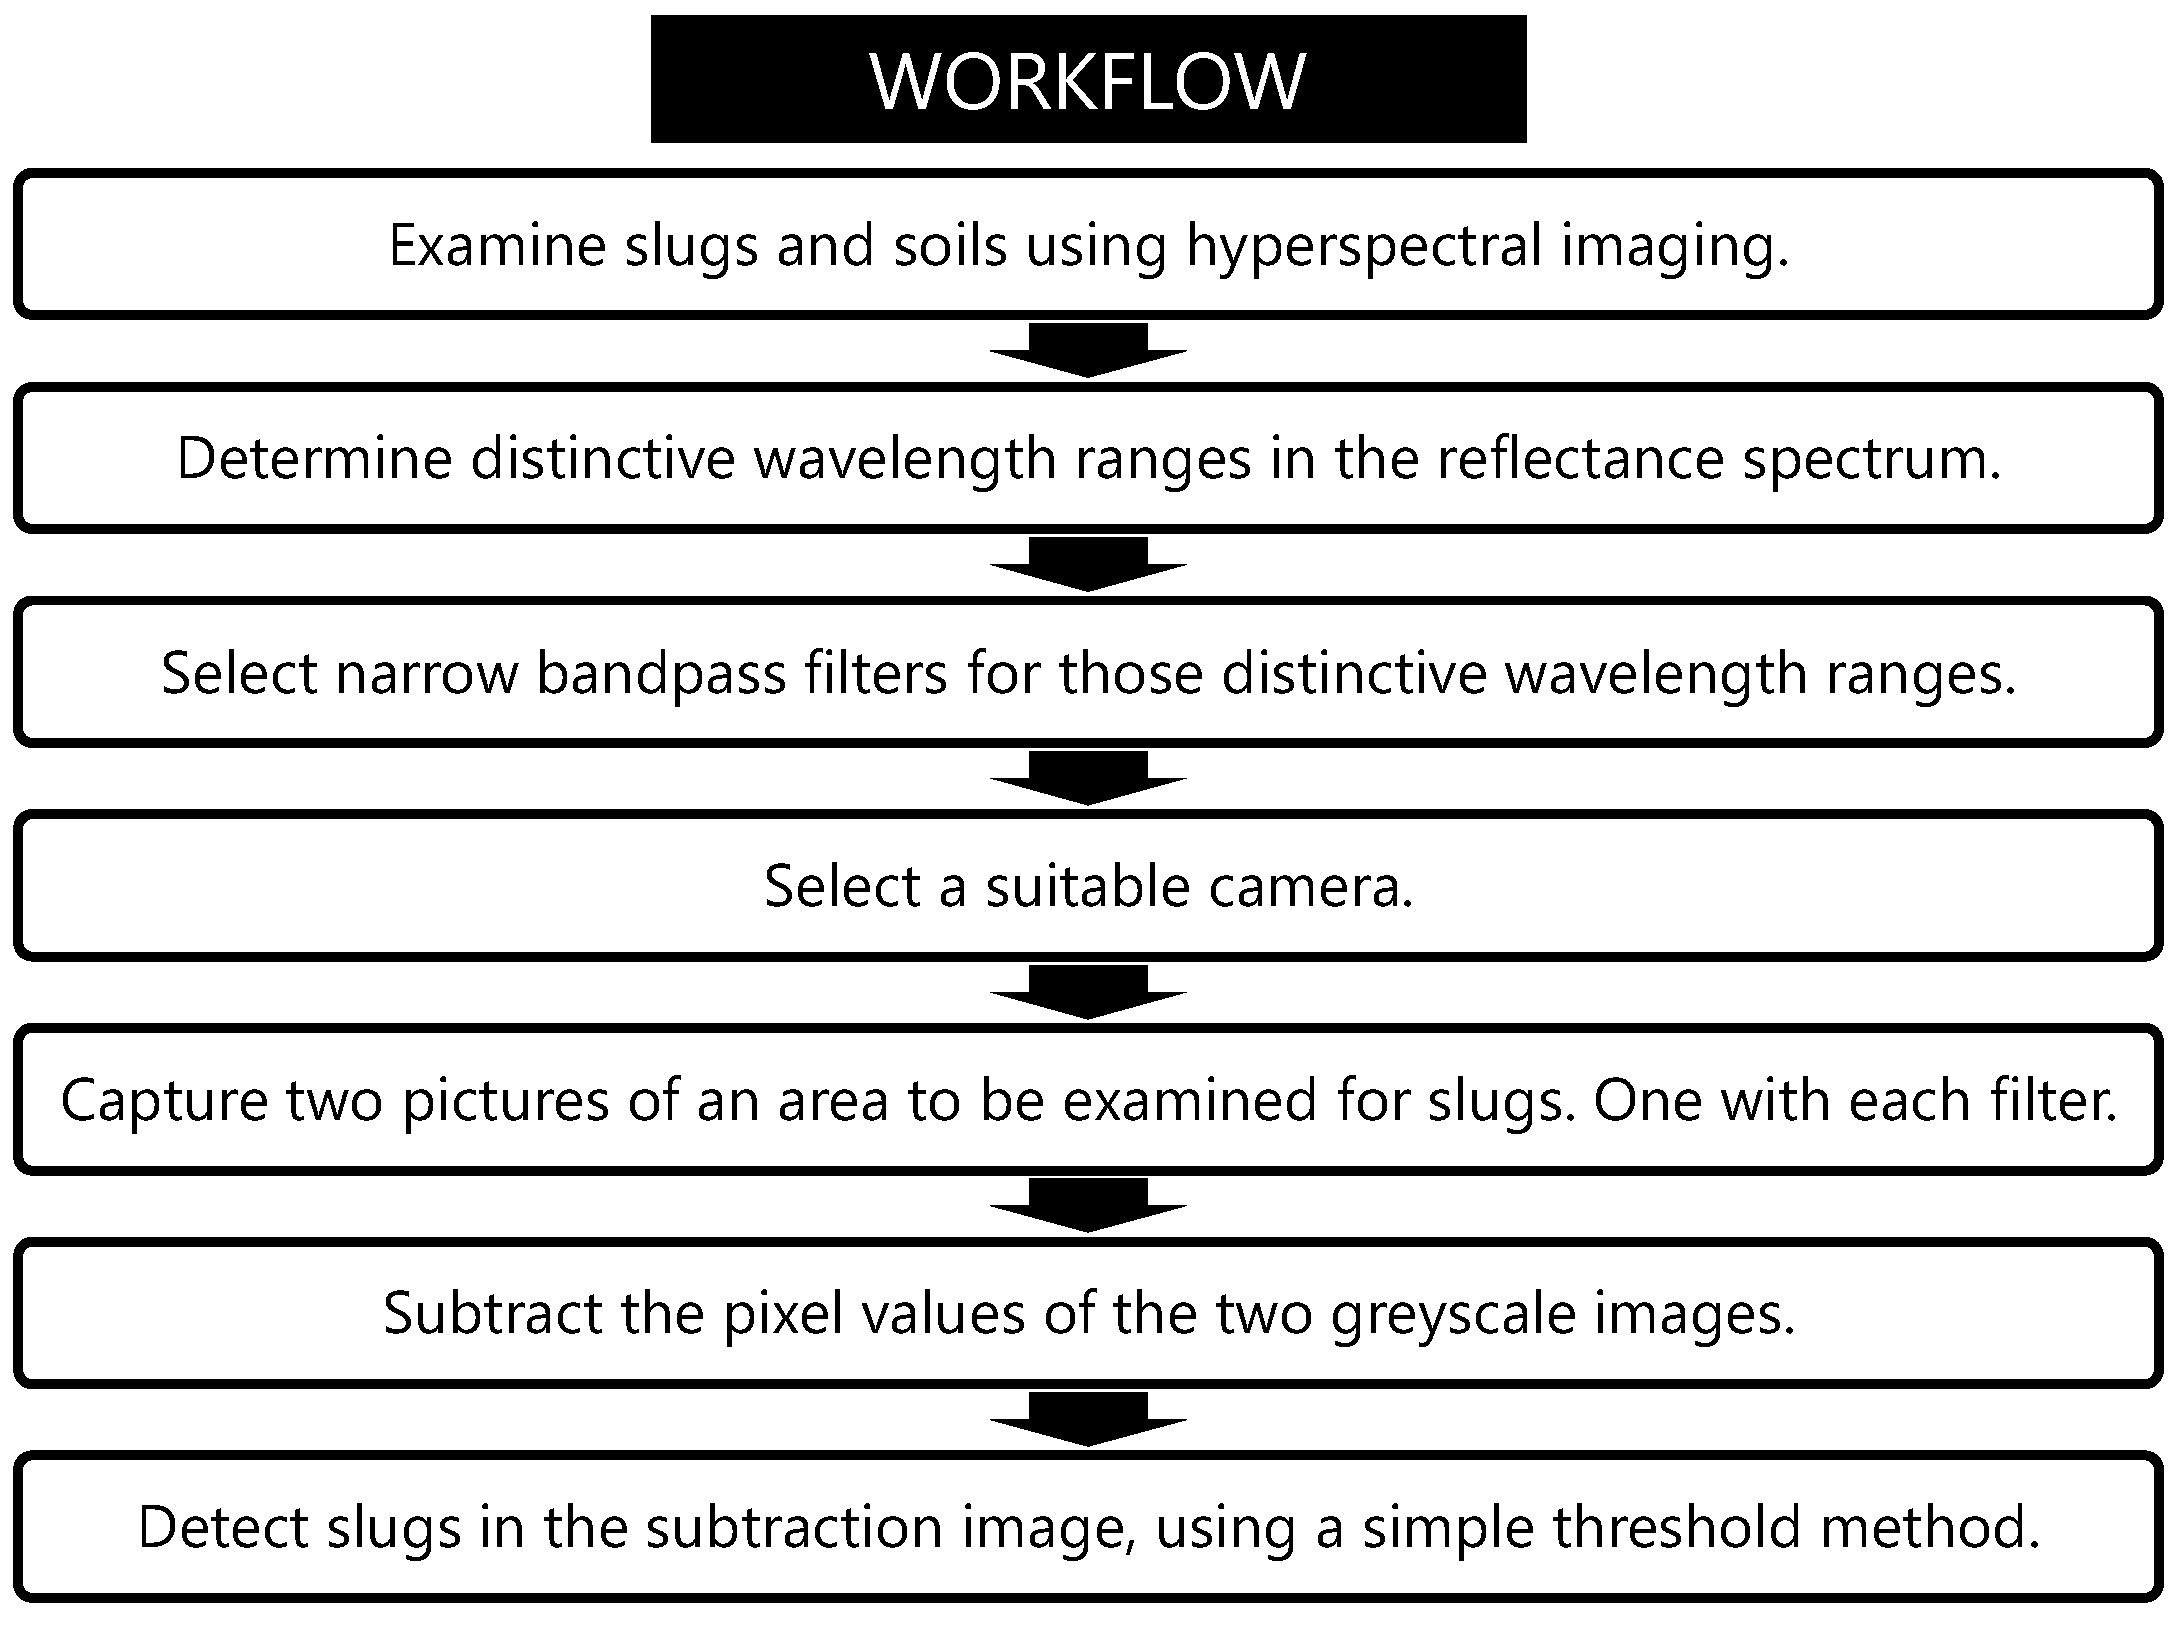
2. Materials and Methods

In this study, 60 individuals of the species D. reticulatum and A. vulgaris were taken directly from the field and maintained individually in screw jars. Each screw jar was filled with a 1 cm layer of terrarium bedding. The slugs were watered every day, using a spray bottle, and had ad libitum access to food (lettuce leaves). In the hyperspectral imaging phase, the living slugs were positioned on the tray of the hyperspectral camera and scanned while crawling on it.
In order to map the real farming conditions, different soils were taken from seven different arable fields in the Werra-Meißner area in central Germany. The soil samples were oven-dried for 24 h at 105 °C [21], sieved, and moistened to three different moisture levels, which represented the expected range of soil moisture levels in the field. Table 1 shows the moisture levels of the soil samples and the method for sample adjustment. In total, 63 soil samples were used within the trials.
The samples were examined in the laboratory with a hyperspectral camera. The data obtained were analyzed and the results were used to develop a slug detection device.
For the hyperspectral imaging, quantities of the sampled soils were filled into plastic cylinders. For every type of soil, there was a sample for each moisture level. The plastic cylinders’ dimensions were 30 mm in diameter and 5 mm in height.
Images were acquired using a Specim V10E PFD camera with a linear translation stage (Specim Spectral Imaging Ltd., Oulu, Finland) using a Schneider 35 mm lens (Xenoplan 1.9/35, Schneider Optische Werke GmbH, Göttingen, Germany). Figure 1 shows a layout of the hyperspectral imaging used in this study. The distance between the lens and sample was 27 cm. Illumination was provided by 3 × 60 W GU10 halogen bulbs. The translation stage moved at 8 mm/s to produce a spatial area of 0.03 mm2 per pixel. The reflectance spectra of wavelengths from 400 nm to 1000 nm were captured in 1.5 nm increments. All image processing was carried out in MATLAB® 2013a, utilizing the method described in previous investigations by [23,24,25]. The image processing of the hyperspectral images resulted in a reflectance spectrum for each imaged sample. The images for the soil samples were taken individually. The images of the slugs were taken with two or three slugs of the same type at a time.
The reflectance spectra acquired from the hyperspectral images were filtered and smoothed using a simple moving average (mMA), as used in the analysis of time series, and shown in Equation (1):
m M A ( n ) ( t ) = 1 n   i = 0 n 1 x ( t i )
where n represents the order of the moving average and x is the given value of a reflectance that shall be smoothed, and t is the wavelength. To center the moving average, the calculated average was shifted by the group delay (τ), which was calculated using Equation (2):
τ = n 1 2
All local maxima and minima were estimated using a derivative test. A derivative test uses the first and second derivative of a function to locate the critical points of a function and determine whether each point is a local maximum, a local minimum, or a saddle point. The derivative of a function for a given input value measures the slope of the tangent line to the graph of the function at that point [26]. That slope is calculated by Equation (3):
d f ( x 1 ) d ( x 1 ) = x 1 y 1
An extreme point will be when the slope of the tangent is zero; therefore, Equation (4) is true:
d f ( x 1 ) d ( x 1 ) !; 0   E x t r e m e p o i n t   f o r f ( x 1 )
All extreme points of the reflectance spectra of soil and slugs were analyzed to identify the best maxima and minima to distinguish between the captured reflectance spectra of soil and slugs.
Figure 2 shows the workflow followed in this study. The extreme points were ascertained to distinguish between slugs and soil, to configure a camera system, and to select suitable filters. The camera system consisted of two narrow bandpass filters purchased from Edmund Optics, a servo-driven filter changer, a monochromatic camera (IDS UI3860CP-M-GL_R2, CMOS, 2.12 Megapixel), and a 25 mm lens (Tamron, M118FM25, Saitama, Japan). For illumination, four 20 W halogen bulbs were used, as shown in Figure 3.
To take further factors that impact on the measured relative reflectance, polynomial regression of these factors was used. Polynomial regression is a modelling of the different independent variables and their dependent variables as a multi-dimensional polynomial.
The polynomial regression of the sensitivity of the camera, the emission of the halogen bulbs, and the reflectance of slugs and soil were used to simulate the behavior of the filter. For the simulation, it was assumed that the result of integration within the limits of the nominal wavelength of the filter (925 nm and 975 nm) over the sum of the polynomial regression mentioned was similar to the physical transmittance of the filter. The selection of the filters was limited by the manufacturer’s product range. The detection system captured a photograph of an area to check for existence of slugs using each filter. The pixel values of the two captured images were then subtracted from each other. By subtracting the captured image using the 975 nm bandpass filter (close to the maximum in the reflection spectrum of the slugs) from the captured image using the 925 nm bandpass filter (close to the minimum in the reflection spectrum of the slugs), a residual amount of the slug pixel values was preserved, and the soil was removed in the image.
To process the captured images openCV was used in a Python script implemented for this purpose. The python script controlled the servo of the filter changer and the camera during the image acquisition. The captured images were then subtracted by removing the 975 nm grayscale image from the 925 nm greyscale image in an arithmetic operation. The resulting greyscale image was transferred to a binary image using the openCV-function cv2.threshold and a fixed threshold value. Noise in the form of the remaining small objects was removed by gathering the size of each remaining object with the openCV-function cv2.connectedComponentsWithStats and removing all objects under a certain threshold in a loop.

3. Results

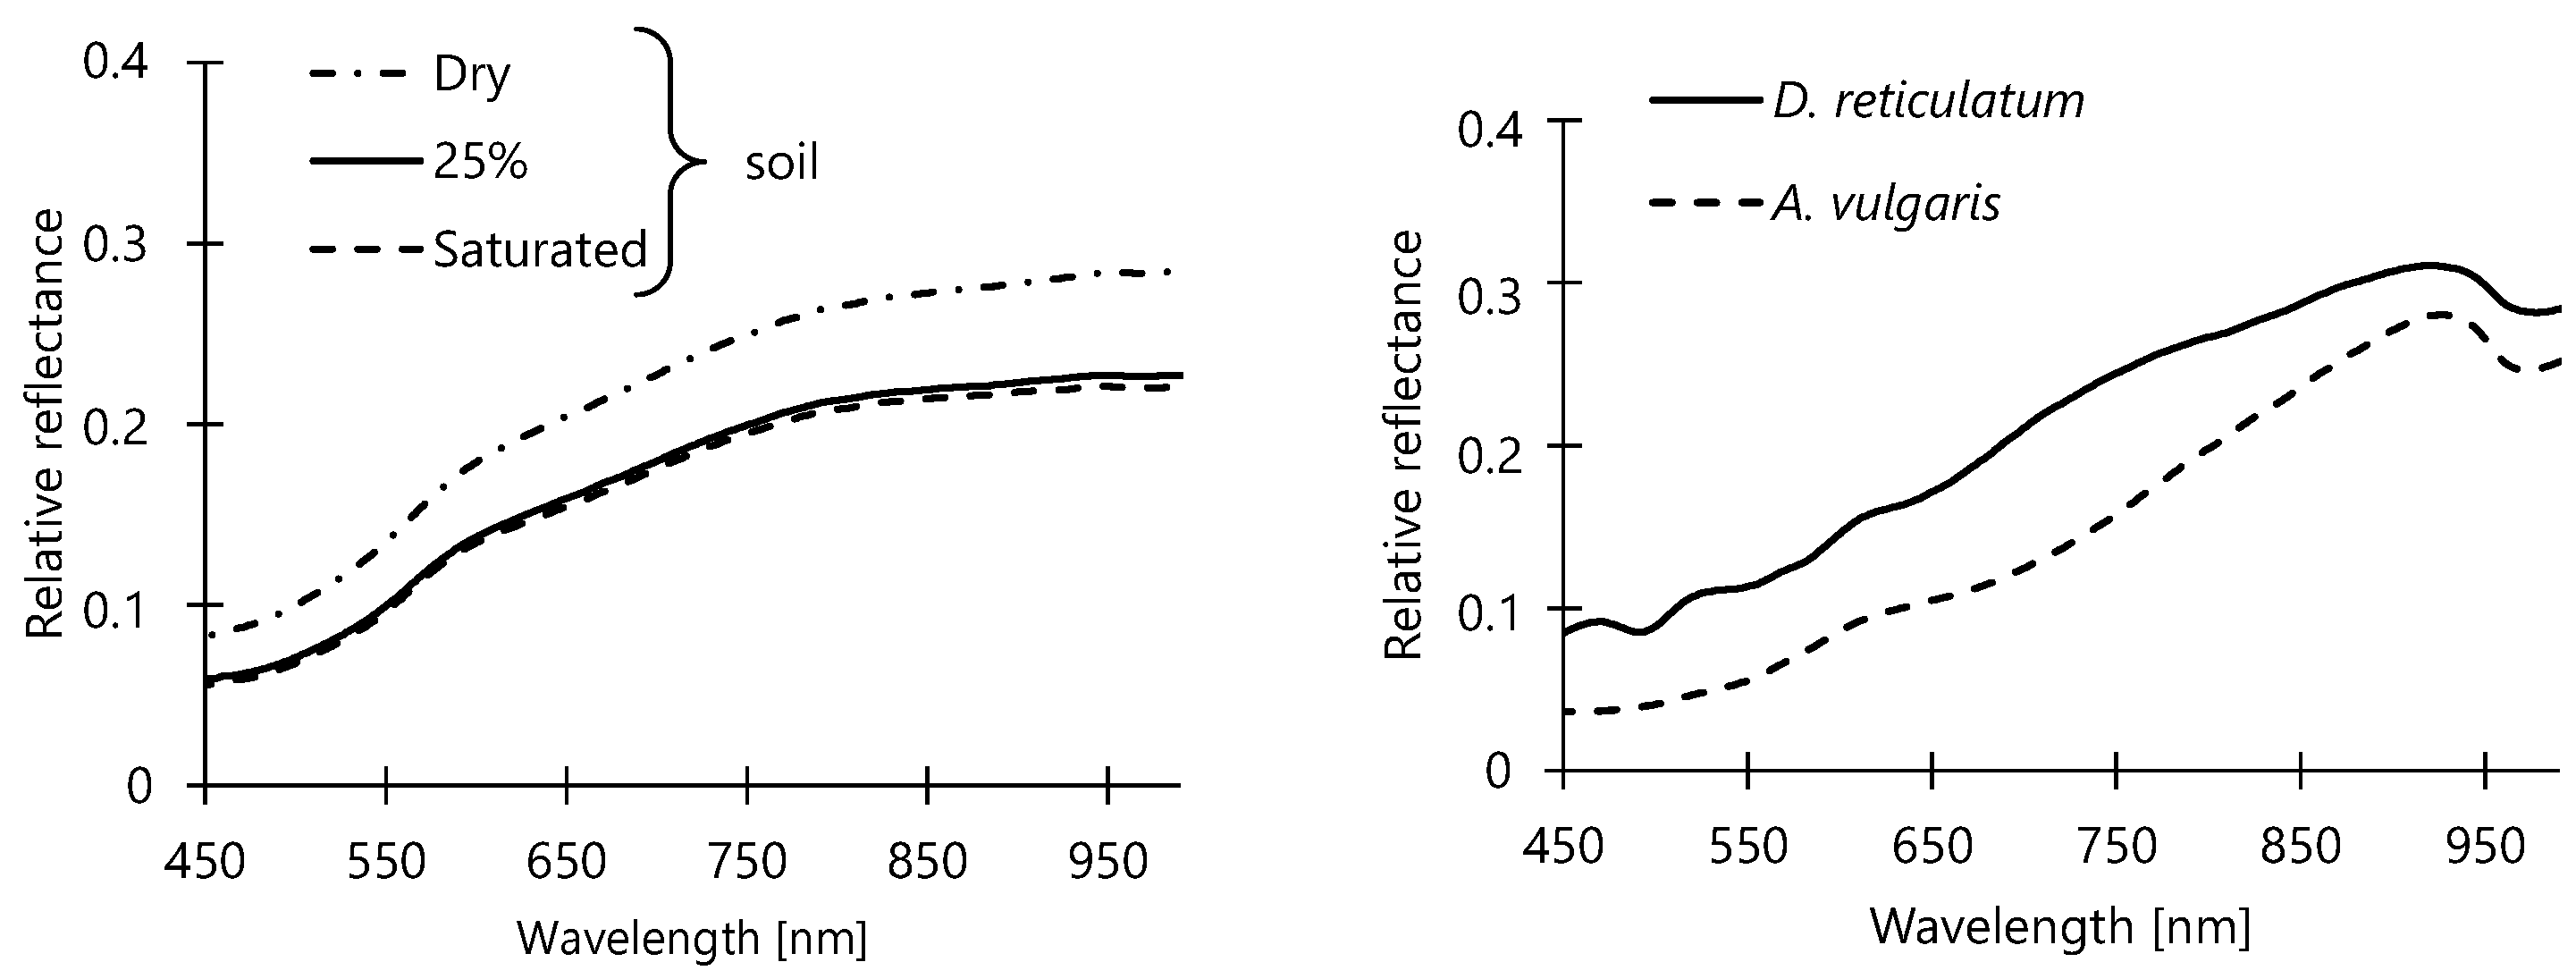
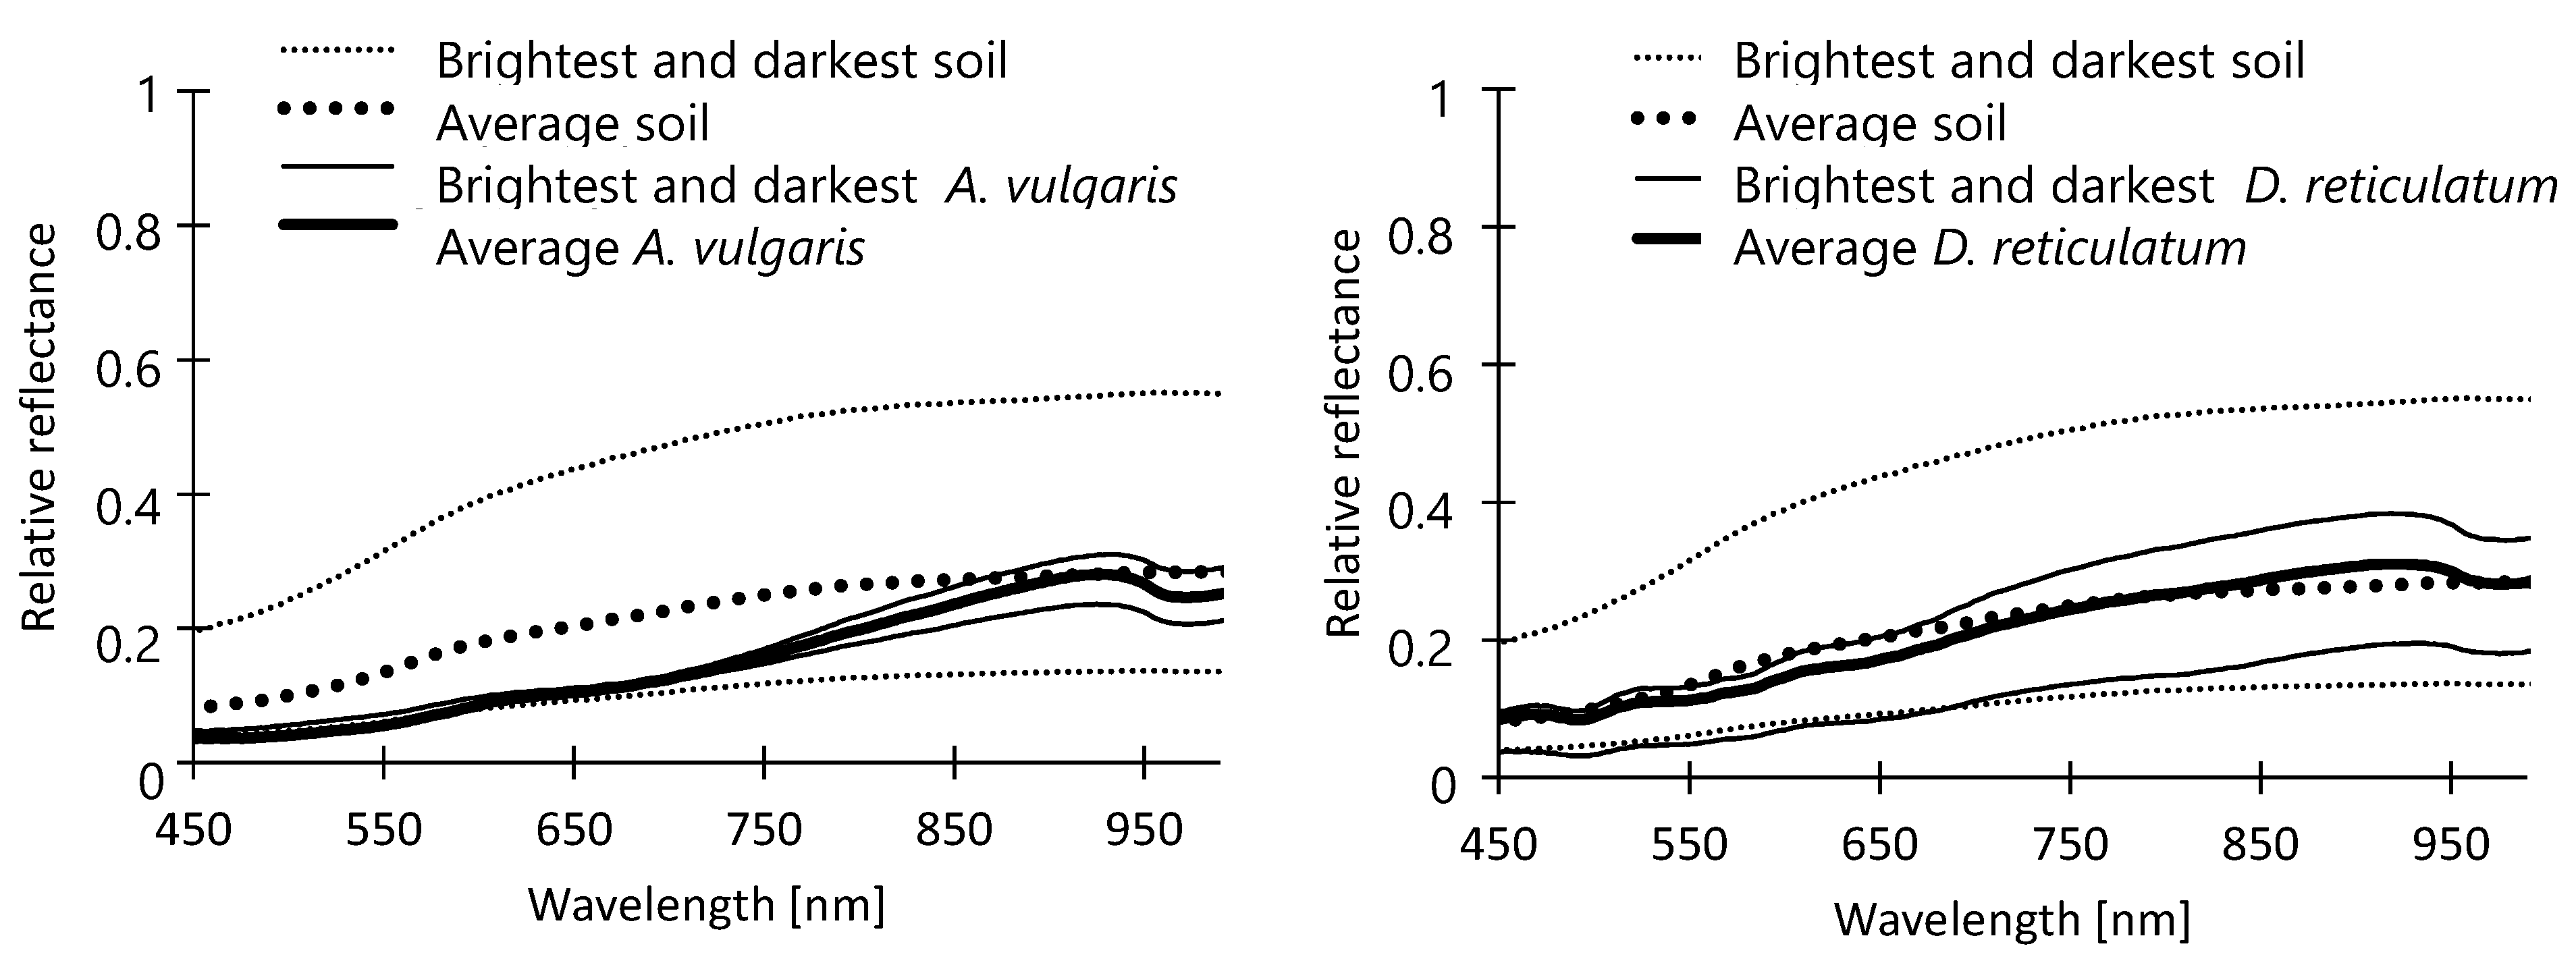
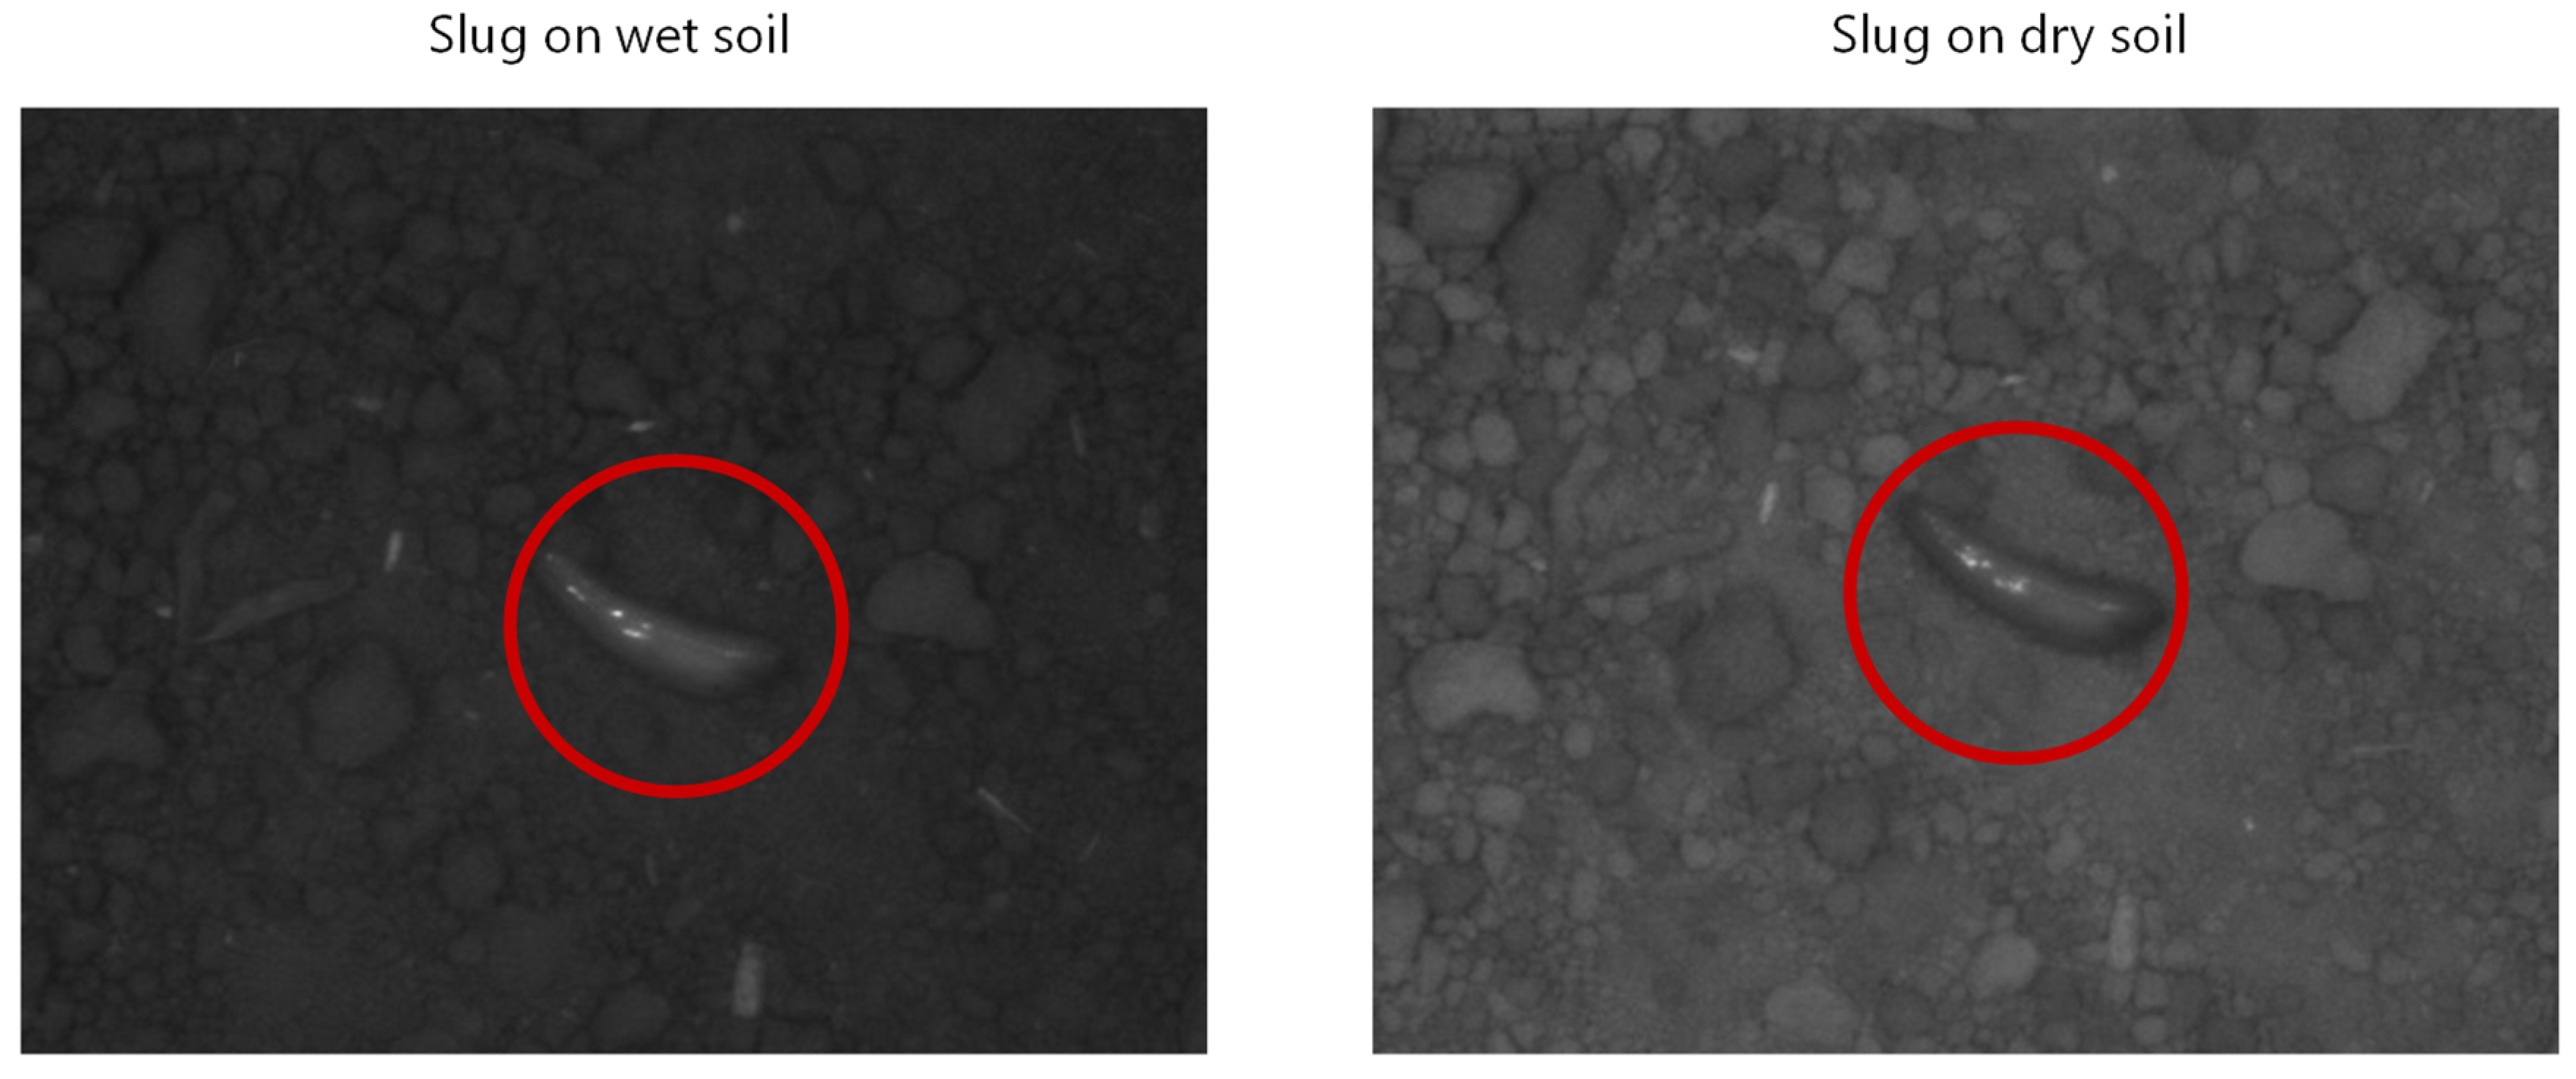
3.1. Measured Reflectance of Soil and Slug

The graphs in Figure 4 show the measured reflectance spectrum of soil and slug. The reflectance spectra as results of the hyperspectral imaging are presented as graphs in cartesian coordinate systems. The wavelength of the reflected radiation in nanometers is specified on the x-axis and the relative reflectance is specified on the y-axis. The graph on the left represents the average of different moisture levels of the seven soils at different moisture levels. In total, 63 measurements were made by the hyperspectral imaging system. According to the diagrams, the relative reflectance of the soil at all soil moisture levels increased along the wavelength. Dry soil had a higher relative reflection than wet or saturated soil. The plot on the right of Figure 4 shows the reflectance spectrum of the slugs. The graph shows the average relative reflection of D. reticulatum and A. vulgaris individuals. In the red and VNIR range, both curves (for slug) rise until they reach a maximum. This is followed by a decrease in relative reflection to a local minimum.

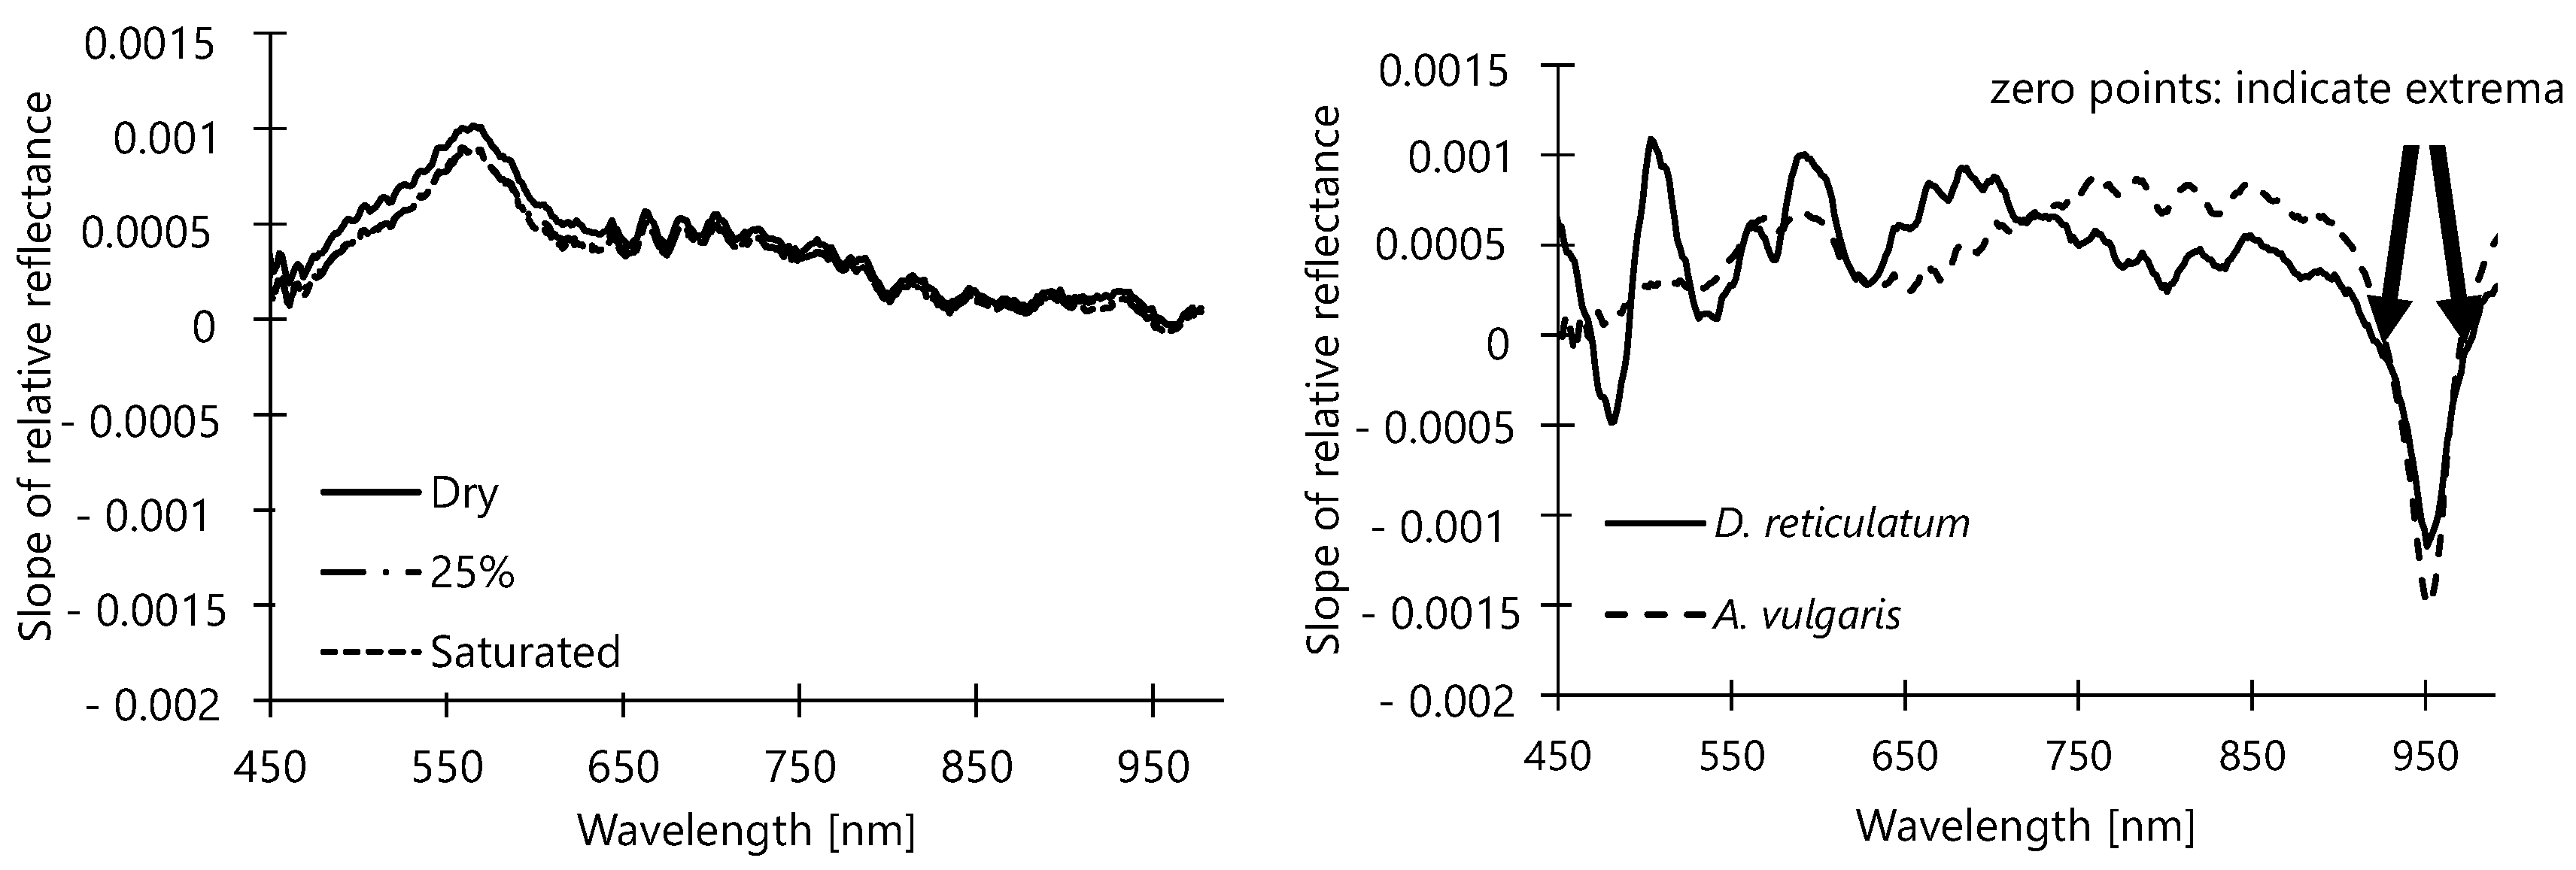
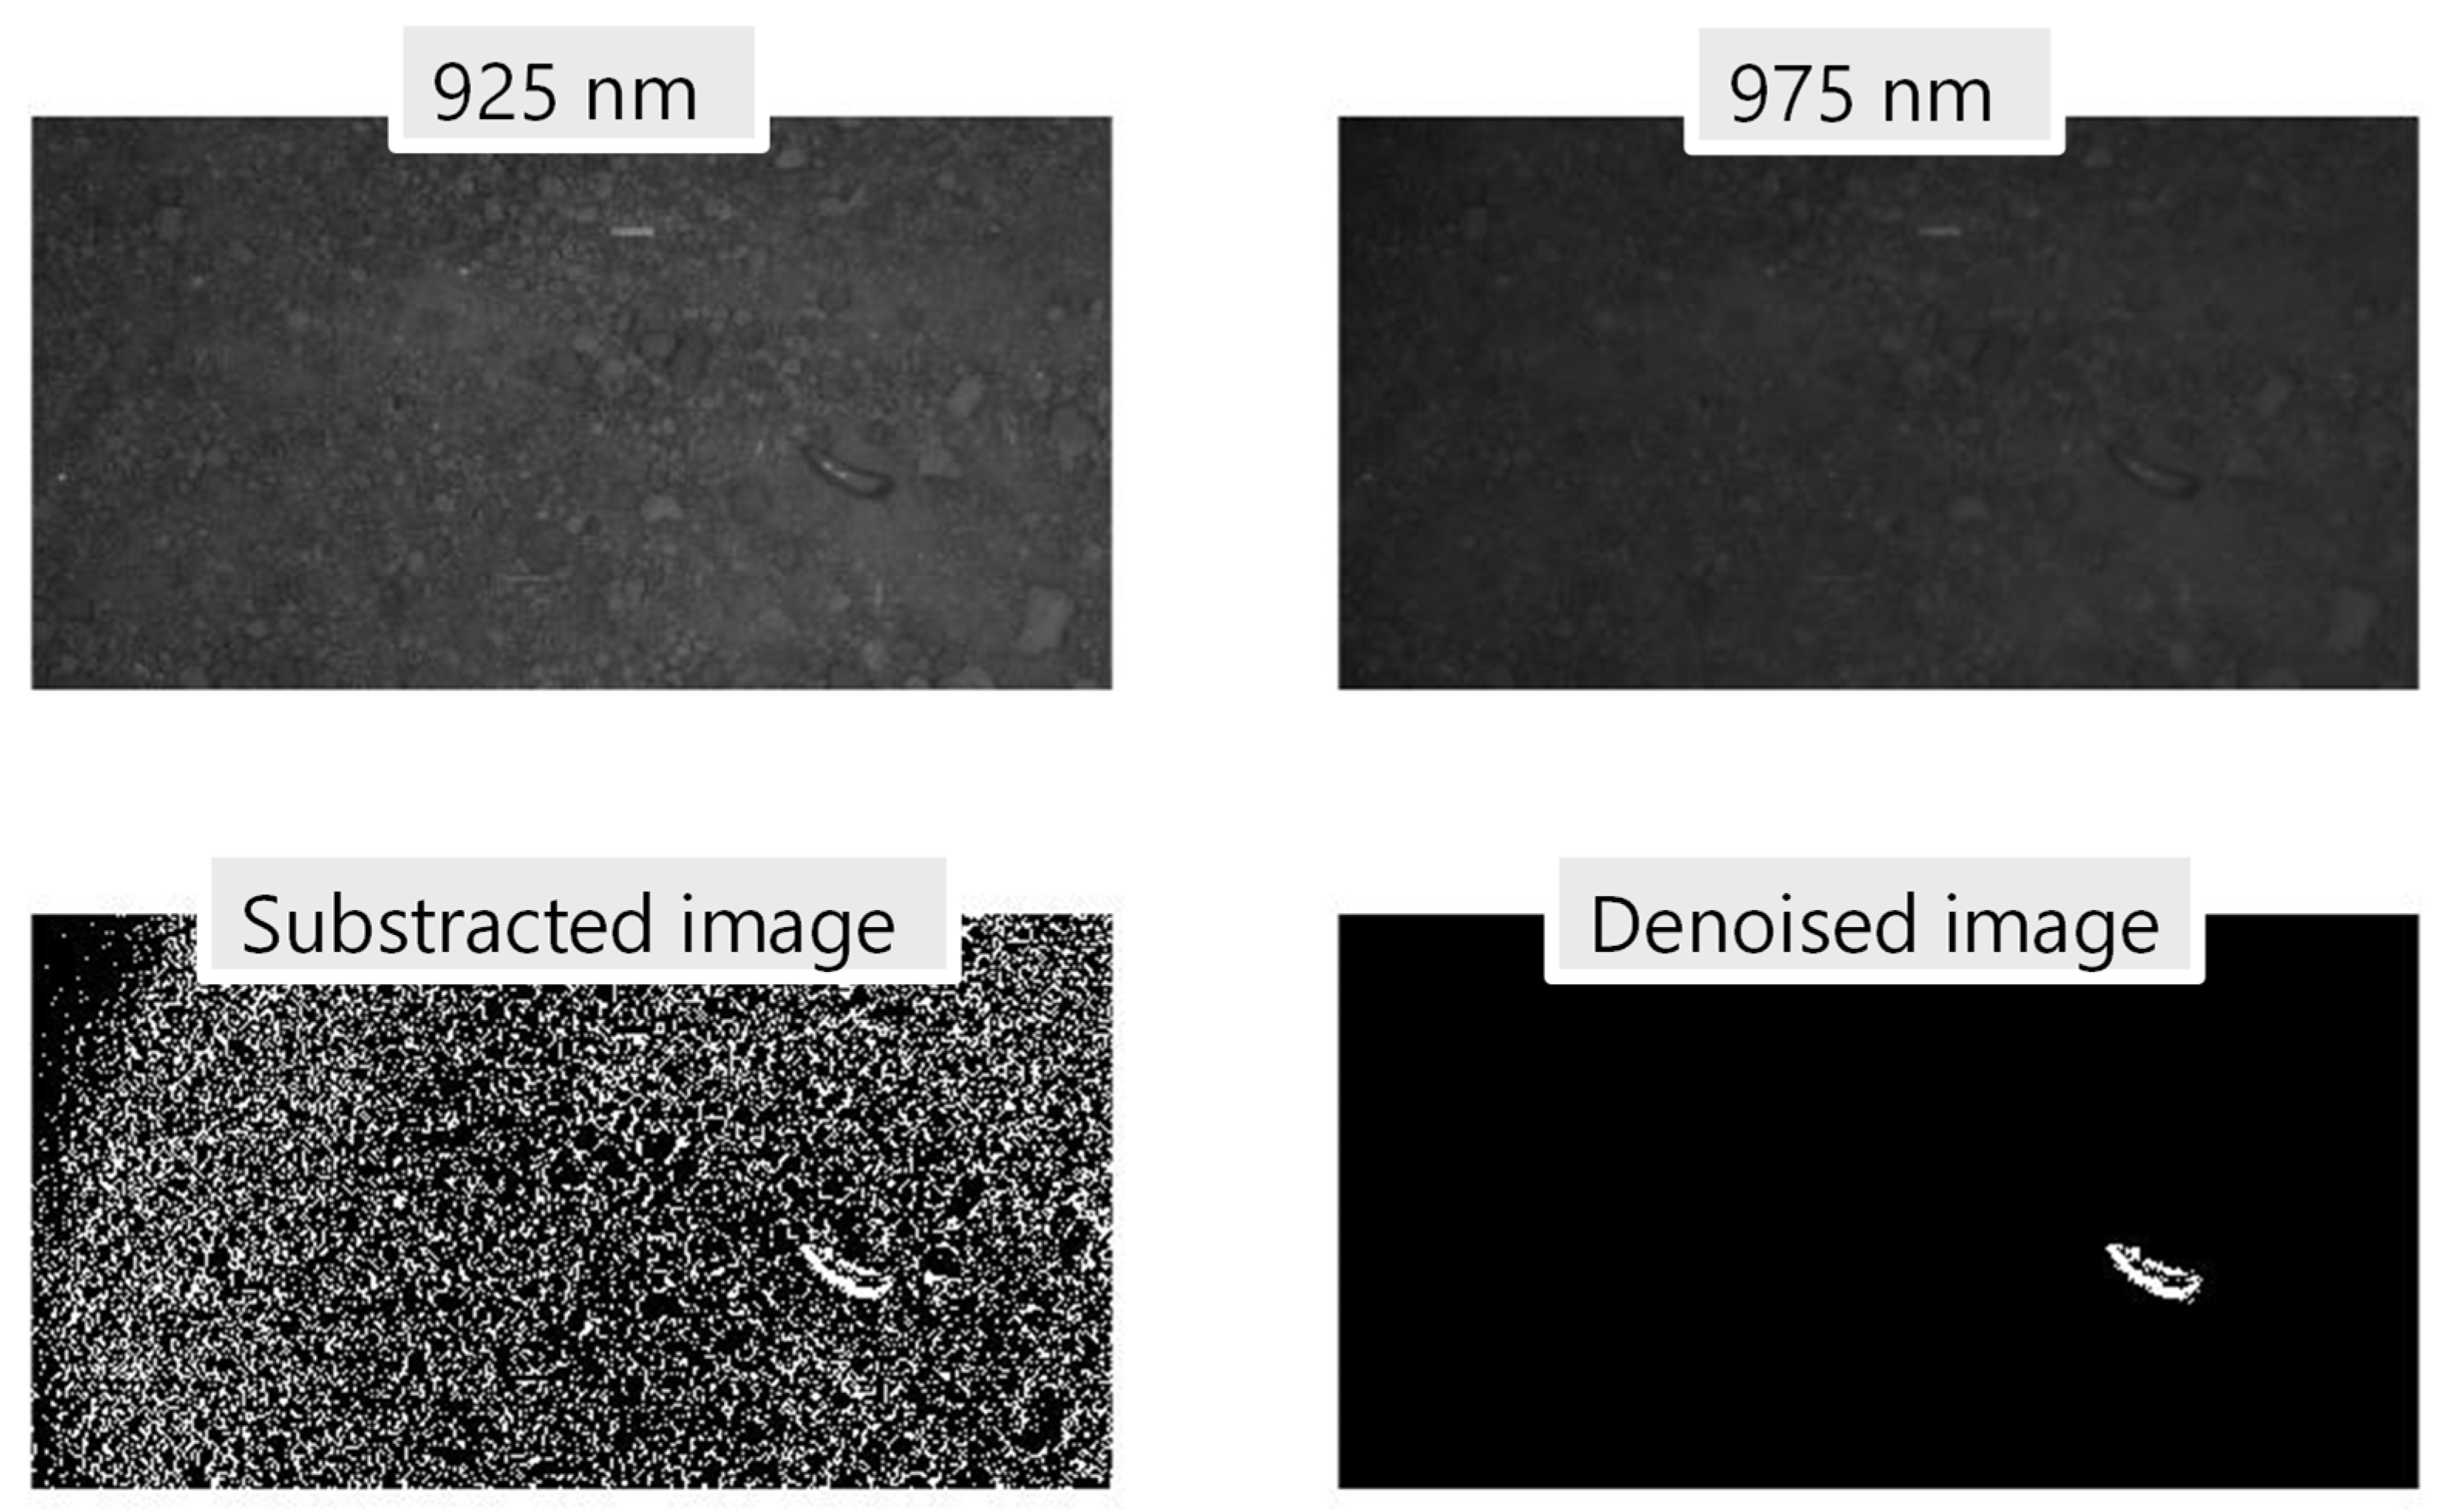
3.2. Calculation of Gradients by a Derivation Test

In Figure 5, the first derivatives of the soil and slug relative reflectance values are presented as a graph. The slope of the relative reflection of the soil is positive throughout the graph, apart from a small area in the VNIR range. Due to the zero points in the range of 946 nm and 968 nm, the soil curves could not be regarded mathematically as monotonously increasing over the entire investigated wavelength range. However, considering some necessary tolerance, a technical monotony is given.
On the other hand, the curves of the derivative of the reflectance of the slugs show some conspicuous zero points in connection with clear changes of the slopes, which indicates distinct extrema. The most promising extreme points for simple slug detection are again in the VNIR range. The maxima of the relative reflectance of the slugs were measured between wavelengths of 910.33 nm and 934.67 nm. Additionally, the minima of the relative reflectance were measured between 968.90 nm and 981.99 nm. The exact positions of the extrema depended on the species and the individual slug. The low dispersions at the measured turning points were conspicuous. These were all in a very narrow band, around a wavelength of 951 nm. The found extrema in the VNIR range are summarized in Table 2.
A comparison of the plots of the relative reflectance of D. reticulatum and A. vulgaris in Figure 3 (right) shows that D. reticulatum has some peaks in the range of 500 nm to 600 nm, whereas the relative reflectance of A. vulgaris shows a rather monotonous progression. The peaks of D. reticulatum are also indicated by the zeros of the slope of the relative reflectance of D. reticulatum in Figure 4 (right). These peaks may enable distinction between the species.
The graphs plotted on the left of Figure 6 show a comparison of the reflectance spectra of A. vulgaris and the estimated soil. The plots on the right of Figure 6 enable a comparison of the reflectance spectra of the estimated soils and D. reticulatum. In both graphs in Figure 6, dotted lines represent the soil, and solid lines represent the slugs. The thin lines show the highest and the lowest measured values, and the thicker lines show the average of all samples. The plots in Figure 6 show that the variations in color, and therefore, relative reflection, are much higher among D. reticulatum than among A. vulgaris. Thus, some individuals of the variety D. reticulatum are brighter than A. vulgaris.
In addition to the variety of slug, the soil condition had an impact on the appearance of the slug on the soil in an image. In Figure 7, two 925 nm narrow bandpass-filtered images of the same individual of D. reticulatum on the same soil are shown. In the left image, the slug was positioned on wet soil. On the right image, the slug was positioned on dry soil. In the left image, the slug appears bright; in the right image, the slug appears dark.
Figure 8 shows a box plot of the subtraction of the 975 nm relative reflection values from the 925 nm relative reflection values for all soil samples and all slugs used in this experiment. Notably, the differences in the relative reflection of all slug samples are significantly higher than the differences in the relative reflection of the soil samples. On average, the difference in relative reflection of the slug samples was 12.4 times higher than the difference in relative reflection of the soil samples. This distance between the relative reflection differences enabled reliable differentiation between slugs and soils. All slug individuals investigated in this study were detected correctly on different soils (100% accuracy).

4. Discussion

The results presented in Figure 4, Figure 5 and Figure 6 show a maximum in the range of 920 nm to 930 nm and a minimum in a range around 970 nm for the relative reflectance of slugs, whereas the relative reflection of the soil technically monotonously increased in this range. The minimum at 970 nm was caused by an overtone of OH bonds [27,28]. The maximum at 925 nm was simply a global maximum because the measurements stopped at 1000 nm and the depression caused by the overtone of the OH bonds was not yet fully overcome at that point. Slugs do contain a significantly higher water content (77% to 92% wet weight [29]) then even the wettest soil in this trial (25% wet weight), which was visible in the spectra of the relative reflectance.
The spectra of the soils shown in Figure 4 and Figure 6 are in line with some other reported studies [30,31,32]. The chemical composition of slug mucus has been investigated using IR spectroscopy [33]. It was found that the measured spectra can be used to determine not only the molecular composition of mucus, but also the type of slug. The difference in the slope of the relative reflection as shown in Figure 5 indicates that it is also possible to distinguish between the slug species by spectroscopy in the visible light range. The spectrum of relative reflection was used to distinguish the slug species in this research; thus, it might be possible to distinguish useful and harmful slug species through a similar approach. In temperate latitudes, all snails (shelled gastropods in contrast to slugs as shell-less gastropods) are beneficial organisms [34]. A distinction between pests (slugs) and beneficials (snails) could also be made by comparing the geometric shape following the procedure in [35], where a machine-vision-inserted ellipse was used to distinguish between object shapes.
Slugs of the variety A. vulgaris could not be detected with the approach presented in [8]. As shown in Figure 6, D. reticulatum varies more in color than A. vulgaris. The relatively bright individuals of D. reticulatum are those which could be detected with the setup in [8], and appeared bright under infrared light. A simple threshold-based slug detection method, such as that used by ref. [8], was not able to detect all slugs on any soil, because slugs do not always appear bright if photographed under VNIR light, as shown above in Figure 7.
The presented results were used to establish a slug detector as described in Section 2. The narrow bandpass filters were chosen according to the distinguished extrema in the reflectance spectra of the slugs. Their nominal wavelengths were 925 nm and 975 nm. The performance of the resulting slug detector and the image subtraction conducted as described in chapter 2 can be seen in Figure 9, with the 925 nm image on the top left and 975 nm images on the top right. The result of the subtraction is shown on the bottom left, and a denoised image of the slug without any soil is shown on the bottom right of the figure.
The detector demonstrated an excellent performance. The image processing steps shown in Figure 9 were carried out on 60 individual slugs, and all were detected correctly on different soils. The boxplot in Figure 7 shows that the difference in the relative reflection after the subtraction was big enough to detect the slugs in any case. This is important for applications of a robot for slug detection on different farms with different soil conditions without a need for calibration.
In this study, due to the use of novel optical system for the detection of different slugs on agricultural fields to be used as a detector in a slug control robot, sufficient performance for practical use was realized. The spectral-based imaging device developed in this study could be a valuable tool to detect slugs in real-time conditions in a robot to improve sustainability as well as crop health using non-chemical approaches. The output of the developed algorithm can be used as an input for a slug-collecting device to detect and localize target pests in agricultural fields. However, this new technique needs to be adapted and evaluated with a wider range of farm and slug conditions (e.g., soil, moisture, type of insect and plant) in future, which may require different optical and lighting conditions coupled with state-of-the art machine learning techniques with a greater number of images [35].

5. Conclusions

This study showed that the detection of D. reticulatum and A. vulgaris slugs on different soils is possible with the threshold method for image processing if the spectral properties of the slugs are considered by a detection method adapted with narrow bandpass filters of 925 nm and 975 nm wavelength. All (100%) of the 60 individual slugs of two species investigated in this study were detected correctly on seven different soils. Additionally, by considering spectral properties, it was also possible to differentiate between the two studied species. This could also be realized in technical applications, if a more complex detection unit measuring more than two narrow bands of wavelengths is acceptable for the user. By considering the use of more narrow bandpass filters, it might be possible to use the differences in the relative reflection of slug species to distinguish between beneficial and harmful species. It is also possible to include geometric information to separate harmful slugs from beneficials.
Future research should test the developed detection system in different farm conditions. The described setup of the detector was designed to detect slugs directly after the sowing and before the sprouting of the plants. By adding more narrow bandpass filters, it will also be possible to distinguish between plants and slugs. Consequently, the detector could also be used to detect slugs on plants (e.g., lettuce, cabbage), where partially damaging leaves and traces of slime and excrement may cause harm.
Other possible improvements, including better adaptions of the camera as a detection system for the robot is essential for future works. A camera with greater sensitivity in the VNIR range could capture images that are easier to process. It would also be conceivable to dispense with the filter changer by redirecting or splitting the light entering the camera lens on several complementary metal-oxide semiconductor sensors (CMOS). This would enabled slug detection in a video stream, employing the physical principle presented here.

Author Contributions

Conceptualization, C.H., B.S. and A.N.; methodology, C.H. and S.R.; investigation, C.H., A.N. and S.R.; resources, O.H.; writing—original draft preparation, C.H.; writing—review and editing, O.H., B.S., S.R. and A.N.; supervision, O.H.; project administration, C.H.; funding acquisition, O.H. All authors have read and agreed to the published version of the manuscript.

Funding

This research was funded by the Federal Office of Agriculture and Food (BLE) and the Federal Ministry of Food and Agriculture (BMEL) of Germany, grant number 2815704415.

Institutional Review Board Statement

Not applicable.

Informed Consent Statement

Not applicable.

Data Availability Statement

Not applicable.

Acknowledgments

The authors would like to thank the staff of the Department of Agricultural and Biosystems Engineering, who made the trials and thus this study possible by their support. Special thanks to Alica Meder, for assistance in the capturing and processing of the hyperspectral images; to Roman Kälberloh, for help with setting up the cameras and illumination; to Florian Pforte, for help with the bandpass filters and optics; and to Verena Höing, for support with logistics and organization.

Conflicts of Interest

The authors declare no conflict of interest.

References

  1. Glen, D.M.; Moens, R. Agriolimacidae, Arionidae and Milacidae as pests in west European cereals. In Molluscs as Crop Pests; Barker, G.M., Ed.; CABI Publishing: Wallingford, UK, 2002; pp. 271–300. [Google Scholar]
  2. Moens, R.; Glen, D.M. Agriolimacidae, Arionidae and Milacidae as pests in west European oilseed rape. In Molluscs as Crop Pests; Barker, G.M., Ed.; CABI Publishing: Wallingford, UK, 2002; pp. 425–439. [Google Scholar]
  3. Barker, G.M. Molluscs as Crop Pests; CABI Publishing: Wallingford, UK, 2002. [Google Scholar]
  4. Nash, M.A.; Thomson, L.J.; Hoffmann, A.A. Slug control in Australian canola, monitoring, mulluscicidal baits and economic thresholds. Pest Manag. Sci. 2007, 63, 851–859. [Google Scholar] [CrossRef]
  5. South, A. Terrestrial Slugs, Biology Ecology and Control; Chapman and Hall: London, UK, 1992. [Google Scholar]
  6. Bailey, S.E.R. Molluscicidal baits for control of terrestrial gastropods. In Molluscs as Crop Pests; Barker, G.M., Ed.; CABI Publishing: Wallingford, UK, 2002; pp. 33–54. [Google Scholar]
  7. Gonzalez-de-Santos, P.; Ribeiro, A.; Fernandez-Quintanilla, C.; Lopez-Granados, F.; Brandstoetter, M.; Tomic, S.; Pedrazzi, S.; Peruzzi, A.; Pajares, G.; Kaplanis, G.; et al. Fleets of robots for environmentally-safe pest control in agriculture. Precis. Agric. 2017, 18, 574–614. [Google Scholar] [CrossRef]
  8. Kelly, I.; Melhuish, C. A slug detection system for the slug bot. In Proceedings of the 3rd British Conference on Autonomous Mobile Robots, Nashua, NH, USA, 21–26 May 2001. [Google Scholar]
  9. Van Straten, G. Field robot event, Wageningen 5–6 June 2003. Comput. Electron. Agric. 2003, 42, 51–58. [Google Scholar] [CrossRef]
  10. Blackmore, S.; Stout, B.; Wang, M.; Runov, B. Robotic agriculture—The future of agricultural mechanisation. In Proceedings of the 5th European Conference on Precision Agriculture, Uppsala, Sweden, 8–11 June 2005; pp. 621–628. [Google Scholar]
  11. Bechar, A.; Vigneault, C. Agricultural robots for field operations: Concept and components. Biosyst. Eng. 2016, 149, 94–111. [Google Scholar] [CrossRef]
  12. Greenman, J.; Holland, O.; Kelly, I.; Kendall, K.; McFarland, D.; Meluish, C. Towards robot autonomy in the natural world: A robot in predator’s clothing. Mechatronics 2003, 13, 195–228. [Google Scholar] [CrossRef]
  13. Yuan, L.; Yan, P.; Han, W.; Huang, Y.; Wang, B.; Zhang, J.; Zhang, H.; Bao, Z. Detection of anthracnose in tea plants based on hyperspectral imaging. Comput. Electron. Agric. 2019, 167, 105039. [Google Scholar] [CrossRef]
  14. Abdulridha, J.; Ampatzidis, Y.; Roberts, P.; Kakarla, S.C. Detecting powdery mildew disease in squash at different stages using UAV-based hyperspectral imaging and artificial intelligence. Biosyst. Eng. 2020, 197, 135–148. [Google Scholar] [CrossRef]
  15. Fan, Y.; Wang, T.; Qiu, Z.; Peng, J.; Zhang, C.; He, Y. Fast Detection of Striped Stem-Borer (Chilo suppressalis Walker) Infested Rice Seedling Based on Visible/Near-Infrared Hyperspectral Imaging System. Sensors 2017, 17, 2470. [Google Scholar] [CrossRef] [PubMed]
  16. Okamoto, H.; Murata, T.; Kataoka, T.; Hata, S.-I. Plant classification for weed detection using hyperspectral imaging with wavelet analysis. Weed Biol. Manag. 2007, 7, 31–37. [Google Scholar] [CrossRef]
  17. Barbedo, J. Detecting and classifying pests in crops using proximal images and machine learning: A review. Artif. Intell. 2020, 1, 312–328. [Google Scholar] [CrossRef]
  18. Liu, H.; Chahl, J. Proximal detecting invertebrate pests on crops using a deep residual convolutional neural network trained by virtual images. Artif. Intell. Agric. 2021, 5, 13–23. [Google Scholar] [CrossRef]
  19. Liu, H.; Chahl, J. A multispectral machine vision system for invertebrate detection on green leaves. Comput. Elecronics Agric. 2018, 150, 279–288. [Google Scholar] [CrossRef]
  20. Martineau, M.; Conte, D.; Raveaux, R.; Arnault, I.; Munier, D.; Venturini, G. A survey on image-based insect classification. Pattern Recognit. 2017, 65, 273–284. [Google Scholar] [CrossRef] [Green Version]
  21. Schulte, E.E.; Hopkins, B.G. Estimation of Soil Organic Matter by Weight Loss-On-Ignition. In Soil Organic Matter: Analysis and Interpretation; Magdoff, F.R., Ed.; SSSA Special Publication: Madison, WI, USA, 1996; Volume 46. [Google Scholar]
  22. DIN EN ISO 11274: Soil Quality—Determination of the Water-Retention Characteristic—Laboratory Methods. 2018. Available online: https://www.iso.org/obp/ui/#iso:std:iso:11274:ed-2:v1:en (accessed on 1 May 2021).
  23. Crichton, S.O.J.; Kirchner, S.M.; Porley, V.; Retz, S.; von Gersdorff, G.; Hensel, O.; Weygandt, M.; Sturm, B. Classification of organic beef Freshness using VNIR hyperspectral imaging. Meat Sci. 2017, 129, 20–27. [Google Scholar] [CrossRef]
  24. Crichton, S.O.J.; Shrestha, L.; Hurlbert, A.; Sturm, B. Use of hyperspectral imaging for prediction of moisture content and chromaticity of raw and pretreated apple slices during convection drying. Dry. Technol. 2017, 36, 804–816. [Google Scholar] [CrossRef]
  25. Amjad, W.; Crichton, S.O.J.; Munir, A.; Hensel, O.; Sturm, B. Hyperspectral imaging for determination of potato slices moisture content and chromaticity during convective hot airdrying process. Biosyst. Eng. 2018, 166, 170–183. [Google Scholar] [CrossRef]
  26. Scheid, H.; Schwarz, W. Elemente der Linearen Algebra und der Analysis; Springer: Heidelberg, Germany, 2009; pp. 316–322. [Google Scholar]
  27. Bobelyn, E.; Serban, A.-S.; Nicu, M.; Lammertyn, J.; Nicolai, B.; Saeys, W. Postharvest quality of apple predicted by NIR-spectroscopy: Study of the effect of biological variability on spectra and model performance. Postharvest Biol. Technol. 2009, 55, 133–143. [Google Scholar] [CrossRef]
  28. Cen, H.; Lu, R.; Mendoza, F.; Beaudry, R.M. Relationship of the optical absorption and scattering properties with mechanical and structural properties of apple tissue. Postharvest Biol. Technol. 2013, 85, 30–38. [Google Scholar] [CrossRef]
  29. Lyth, M. Water-Content of Slugs (Gastropoda: Pulmonata) Maintained in Standardiesed Culture Conditions. J. Molluscan Stud. 1982, 48, 214–218. [Google Scholar]
  30. Ben-Dor, E.; Irons, J.R.; Epema, G.F. Soil reflectance. In Remote Sensing for the Earth Sciences, Manual of Remote Sensing; Rencz, N., Ed.; John Wiley & Sons: New York, NY, USA, 1999; pp. 111–188. [Google Scholar]
  31. Shepherd, K.D.; Walsh, M.G. Development of Reflectance Spectral Libraries for Characterization of Soil Properties. Soil Sci. Soc. Am. J. 2002, 66, 988–998. [Google Scholar] [CrossRef]
  32. Skingsley, D.R. Analysis of Pulmonate Mucus by Infrared Spectroscopy. J. Molluscan Stud. 2000, 66, 363–372. [Google Scholar] [CrossRef]
  33. Vasques, G.M.; Demattê, J.A.M.; Viscarra Rossel, R.A.; Ramírez-López, L.; Terra, F.S. Soil classification using visible/near-infrared diffuse reflectance spectra from multiple depths. Geoderma 2014, 223–225, 73–78. [Google Scholar] [CrossRef]
  34. Allgaier, C.; Albert, R. Schadschnecken, Biologie, Arten und Bekämpfung; Aid Infodienst: Bonn, Germany, 2014. [Google Scholar]
  35. Nasirahmadi, A.; Hensel, O.; Edward, S.; Sturm, B. Using machine vision for investigation of changes in pig proup lying patterns. Comput. Electron. Agric. 2015, 119, 184–190. [Google Scholar] [CrossRef] [Green Version]
Figure 1. Basic setup of the hyperspectral imaging.
Horticulturae 08 00077 g001
Figure 2. The workflow to develop a slug detection device for a robot.
Horticulturae 08 00077 g002
Figure 3. The developed set up of the detection device.
Horticulturae 08 00077 g003
Figure 4. Average of reflectance spectra of soils at different moisture levels (left) and slug species (right).
Horticulturae 08 00077 g004
Figure 5. First derivative of the relative reflectance of soils (left) and slugs (right).
Horticulturae 08 00077 g005
Figure 6. Comparison of soil vs. A. vulgaris (left) and soil vs. D. reticulatum (right).
Horticulturae 08 00077 g006
Figure 7. Two images photographed using a 925 nm narrow bandpass filter. Both show the same D. reticulatum individual on the same soil. On the left image, the soil is wet. On the right image, the soil is dry.
Horticulturae 08 00077 g007
Figure 8. Boxplot of the result of the subtraction of 975 nm reflection from 925 nm reflection for slugs and soil.
Horticulturae 08 00077 g008
Figure 9. Result of the detection methodology in this study.
Horticulturae 08 00077 g009
Table 1. Moisture levels of soil samples and method for sample adjustment.
Moisture Level of Soil SampleMethod for Sample Adjustment
SaturatedSaturated according to DIN EN ISO 11274 [22].
Water content 25%Mixed with water to a weight ratio of 25% water content.
Dry sampleOven-dried and sieved into plastic cylinders.
Table 2. Exact points of the extrema determined for the slugs and the ranges of the results.
SpeciesD. reticulatumA. vulgaris
MaximumTurn. pt.MinimumMaximumTurn. pt.Minimum
Mean Wavelength [nm]920.60950.95977.99926.71951.28972.50
Highest Wavelength [nm]931.42950.95981.99934.67952.58975.44
Lowest Wavelength [nm]910.33950.95975.44921.68950.95968.90
Publisher’s Note: MDPI stays neutral with regard to jurisdictional claims in published maps and institutional affiliations.

