Article

Analysis of Compounds with Oenological Interest in Somatic Variants of Grapevines

by
Ana Jiménez-Cantizano
1,*,
Pau Sancho-Galán
1,
Gerardo F. Barbero
2,
Víctor Palacios
1 and
Antonio Amores-Arrocha
1
1
Department of Chemical Engineering and Food Technology, Vegetal Production Area, Faculty of Sciences, The Wine and Food Research Institute (IVAGRO), Agrifood Campus of International Excellence (ceiA3), University of Cadiz, 11510 Puerto Real, Cadiz, Spain
2
Department of Analytical Chemistry, Faculty of Sciences, The Wine and Food Research Institute (IVAGRO), Agrifood Campus of International Excellence (ceiA3), University of Cadiz, 11510 Puerto Real, Cadiz, Spain
*
Author to whom correspondence should be addressed.
Horticulturae 2022, 8(1), 22; https://doi.org/10.3390/horticulturae8010022
Submission received: 15 November 2021 / Revised: 21 December 2021 / Accepted: 22 December 2021 / Published: 24 December 2021
(This article belongs to the Special Issue Grapevine Breeding and Oenological Potential)

Abstract

:
Grapevine varieties can be identified genetically by microsatellite markers. However, these molecular markers are not available to discriminate between somatic mutations that give rise to clones. Therefore, the study of compounds with oenological interest could be used to identify variability in grapevine somatic variants. In this research, sugars (glucose, fructose), acids (tartaric and malic acid) and polyphenols (22 phenolic compounds, including 13 anthocyanins) were analyzed in grape berries of two somatic variants known with different names—‘Graciano’ and ‘Tintilla de Rota’—cultivated in the same vineyard under warm climate conditions. The organic acid results show significant differences between the performance of the two accessions. Regarding phenolic compound (excluding anthocyanins) content, significant differences were observed between the two accessions. Kaempferol, caftaric acid and epicatechin were the compounds responsible for the reported differences. Differences in anthocyanin content showed opposite behavior between ‘Tintilla de Rota’ and ‘Graciano’. In this sense, ‘Graciano’ accession showed an increase in all forms of anthocyanins, with a remarkable increment of peonidin 3-O-glucoside. Principal component analysis of polyphenolic compounds revealed clearly distinguished behaviors concerning these compounds, besides showing similar tendencies between the two accessions during the ripening stage. These results could allow for the discrimination of the two accessions into somatic variants highlighting their individual identity.

1. Introduction

Grapevine (Vitis vinifera L.) is one of the world’s most widely produced and economically valuable fruit crops [1,2] and shows a wide genetic and phenotypic diversity that is currently maintained in germplasm banks distributed worldwide [3]. Although, only a small part of this diversity is used by vine growers of the world’s 10,000 known grapevine varieties. For example, only 13 varieties cover more than one-third of the world’s vineyard area and 33 varieties cover the 50% [4]. However, many of these grapevine varieties have been cultivated for centuries and their continuous vegetative multiplication has led to the accumulation of a large number of somatic mutations generating a rich intravarietal diversity [5]. This intravarietal diversity has led to grapevine adaptation and its evolution under changing environmental and cultivation conditions [6] and represents a huge reservoir of diversity for several traits, in particular, those related with quality and abiotic stress [7]. Clonal selection tries to exploit such variation by selecting the vines with useful features for grape growers. In addition, when clones or somatic variants of the same variety have phenotypes different enough to be grown for the production of different wines, they are grouped in different cultivars [8]. Grapevine variety names are used by growers to distinguish plants in their vineyards, associating them with agronomic behaviors and oenological aptitudes. Moreover, they provide pedigree and a sense of origin to wines from territories where they are predominantly grown, often working as a communication key from producers to consumers [9]. In this sense, ‘Graciano’ is considered a Spanish variety autochthonous from Rioja and Navarra (northern Spain) that is used for its intense red color, powerful aroma and high acidity [10]. Currently, this variety is grown in other winemaking regions, such as Australia, the United States and Argentina, and is also grown in the French-Midi and South Africa with the name ‘Morrastel’, and ‘Tinta Miuda’ in Portugal [11]. On the other hand, there is written evidence from 1807 of the cultivation of a variety known as ‘Tintilla de Rota’ in Andalusia (southern Spain) [12]. This variety is used to make famous wines produced in the town of Rota (Cadiz, Spain). Currently, the cultivation of this variety is limited to the region known as Marco de Jerez, considered the southernmost wine-growing region in Europe. According to the information of the genotype available in the Vitis International Variety Catalogue (VIVC) European database [13], this variety is considered to be another synonym of the ‘Graciano’. However, different published research studies based on the morphological characterization of both accessions show minor differences between ‘Tintilla de Rota’ and ‘Graciano’ cultivars [14,15]. In many cases, the descriptors that are established to identify grapevine varieties [16] are not resolutive enough to detect clear oenological differences between somatic variants. Grapevine DNA discrimination through microsatellite profiles in viticulture has become the technique of choice for grape varietal identification and distinction [17]. Old grapevine varieties develop mutants that have the same microsatellite profile than the original variety. In this sense, these mutants or somatic variants only could be identified using morphological or biochemical descriptors. The trend to cultivate only certain varieties has contributed to the disappearance of many local cultivars, but recently this trend is starting to change, and some wineries, grape growers and consumers are looking for ‘new’ local products [18].
For this reason, it is necessary to establish studies on oenological compounds of interest that can help to enhance the value of somatic variants conserved in the vineyards of different wine regions. Grape chemical composition contains a great variety of nitrogenous compounds, aromatic precursors, glucides, peptides, fatty acids, polyphenolic compounds, organic acids and sugars. These compounds, having the greatest organoleptic and technological influence on wines, are distributed heterogeneously throughout the berry: sugars, organic acids and polyphenolic compounds [19]. Additionally, there are studies that show the discrimination of mutants in a variety by analyzing the polyphenolic profile [20]. The complete study of these oenological compounds (sugars, organic acids and polyphenolic compounds) could be used to identify variability in somatic variants of grapevine. Therefore, the main objective of this research focuses on the analysis of these compounds in grapevine accessions ‘Tintilla de Rota’ and ‘Graciano’ grown under the same environmental conditions in a warm climate region.

2. Materials and Methods

2.1. Plant Material

Grape berries of ‘Graciano’ and ‘Tintilla de Rota’ accessions were used for this study. Both accessions are planted in a private winery located in the municipality of Jerez de la Frontera, in the same plot (36°49′4.523″ N, 5°54′36.198″ W) at an altitude of 143 m above sea level, on albariza soil (limestone mainly) and with a planting frame of 2.30 × 1.15 m. The vines are trained in double cordon with a 3-wire trellis training system and a height of 1.5 m.

2.2. Chemical Compounds

The standards of caftaric acid, (+)-catechin, (−)-epicatechin gallate, quercetin 3-galactoside, rutin and quercetin 3-rhamnoside used for the purposes of this study were purchased from Extrasynthese (Lyon, France). The (−)-epicatechin, kaempferol, quercetin and malvidin chloride used were purchased from Merck KGaA (Darmstadt, Germany). The methanol and acetonitrile, both grade HPLC, were obtained from Panreac (Barcelona, Spain). The acetic acid and formic acid, grade HPLC, were purchased from Merck KGaA (Darmstadt, Germany). The ultra-pure water was obtained from a Milli-Q water purification system from Millipore (Bedford, MA, USA).

2.3. Genetic Analysis

In order to confirm the genotype of the two accessions studied in this work, a genetic analysis was carried out with a total of 22 microsatellite loci following the methodology established by Jiménez-Cantizano et al. [21]. The genotypes obtained were compared with the genetic profiles provided by the databases Vitis International Variety Catalogue (VIVC) [13] and the Rancho de la Merced Germplasm Bank database [14].

2.4. Sample Processing

In order to analyze the evolution of the different compounds during grape ripening, five sampling dates were established, distributed between the periods of veraison and grape ripening (0, 5, 10, 15 and 20 days, between August and September). The last sample was taken the day before the optimum harvest date, determined by the winery itself.
Prior to sample collection, a total of 30 vines per accession were selected and marked. For this purpose, the criteria established by Santesteban et al. [22] were used, based on the selection of vines with a similar trunk cross-sectional area (TCSA). In order to achieve these objectives, the trunk diameter of a total of 100 vines per accession was measured at 30 cm height from the ground, using a Maurer 93,110 digital Vernier caliper (Padua, Italy). Thirty plants with the closest value to the mean TCSA value ±10% were selected in order to minimize the internal variability of the samples taken and thus reduce most of the sources of variation in the assay. In each sampling date, 500 berries for accession from the thirty different vines selected were collected randomly from clusters of the selected vines. The 100-berry weight was 180 ± 8.7 g and 440 ± 21.8 g for ‘Tintilla de Rota’ and ‘Graciano’, respectively.
After sampling, grape berries were kept frozen at a temperature of −20 °C, maintaining the cold preservation chain at all times. Prior to analysis, grapes were flash-frozen at −80 °C for 12 h and freeze-dried in a Telstar® LyoQuest freeze-dryer (Terrassa, Spain) for 5 days. Once all the samples were freeze-dried, seeds were manually removed from the berries to avoid any interference by compounds contained in seeds, using only the grape skins and pulp. Finally, the freeze-dried grapes were crushed in a Thermomix TM31 (Wuppertal, Germany) at speed 7 for 40 s in 5 s fractions and stored again at −20 °C in the absence of light until analysis.

2.5. Ultrasound-Assisted Extraction

Analytical measurements were carried out on freeze-dried and homogenized grape samples in triplicate. In order to determine the content of sugars, organic acids and phenolic compounds, including anthocyanins in grape samples, the ultrasound-assisted extraction technique was used to maximize the solid-liquid extraction yield. For this purpose, an ultrasound probe coupled to a Hielscher Ultrasound Technology UP200S model (Berlin, Germany) and a P-Selecta Frigiterm-10 thermostatic unit (P-Selecta, Barcelona, Spain) was used to control the extraction process and its temperature.
For the different compound extraction (sugars, organic acids and phenolic compounds, including anthocyanins), the conditions followed were the ones proposed by Sancho-Galán et al. [23]. Solvents and conditions used are shown in Table S1. Once the extracts were obtained, they were taken to a final volume of 25 mL using their respective solvent and preserved at –20 °C until analysis.

2.6. Analytical Measurements

2.6.1. Sugars

For the separation and determination of glucose and fructose content in samples, ion exchange chromatography was employed using a Metrohm® 930 Compact IC Flex (Herisau, Switzerland) with a Metrosep Carb-2 150/4.0 column combined with an amperometric detector equipped with a gold electrode. Operating conditions were as described by Amores-Arrocha [24]: elution was carried out with an isocratic flow rate of 0.5 mL/min at a temperature of 30.0 °C and a pressure of 8.1 mPa. The eluents used were 300 mM sodium hydroxide and 1 mM sodium acetate. Prior to the measurement of the compounds, the extracts were filtered with 0.45 μm pore diameter nylon filters and a 1:10 dilution was prepared with milli-Q water for each sample.

2.6.2. Organic Acids

To determine the malic acid and tartaric acid content in samples, a Metrohm® 930 Compact IC Flex (Herisau, Switzerland), equipped with a conductimetric detector and a Metrosep Organic Acids 250 × 7.8 mm column was used. The separation of the different acids was carried out following the specifications of Sancho-Galán et al. [25] using as eluent the mixture 0.4 mmol/L sulfuric acid +12% acetone at an isocratic flow rate of 0.4 mL/min.

2.6.3. Phenolic Compounds (Excluding Anthocyanins)

The analysis of phenolic compounds was carried out on an ACQUITY UPLC® H-Class System (Waters Corporation, Milford, MA, USA) coupled to a photodiode array detector (PAD eλ Detector), a fluorescence detector (FLR Detector) and a quaternary eluent management system (Quaternary Solvent Manager), controlled by Empower TM 3 Software (Waters Corporation, Milford, MA, USA). A reverse phase column, Acquity UPLC® BEH C18 (1.7 μm, 2.1 × 100 mm, Waters, Milford, MA, USA) was used. The methodology followed and all the analytical parameters used (including r2, equations of the calibration curves, LOD, LOQ, linear range of standard compounds) are those proposed by de Peredo et al. [26].

2.6.4. Identification of Anthocyanins

The anthocyanin content in the grape skin and pulp extracts was identified by using an ultra-high performance liquid chromatograph (UHPLC) coupled to a quadrupole-time of flight mass spectrometer (QToF-MS) detector (Xevo G2 QToF, Waters Corporation, Milford, MA, USA). Extracts were filtered with 0.22 μm syringe filters (Membrane Solutions, Dallas, TX, USA). The injection volume was 3 μL. Chromatographic separation and MS conditions were carried out with the methodology proposed by Pereira et al. [27] in reverse phase conditions on a 2.1 mm × 100 mm and 1.7 μm particle size C18 column (Acquity UPLC CSH C18, Waters Corporation, Milford, MA, USA).

2.6.5. Analysis of Anthocyanins

Once the anthocyanins were identified, they were separated in the extracts obtained by ultra-high-performance liquid chromatography (UHPLC) with an Elite HPLC LaChrome Ultra equipment (Hitachi, Tokyo, Japan), composed of a column oven adjusted to 50 °C (L-2420U), an autosampler (L-2200U), two pumps (L-2160U), a Kinetex C-18 column (2.6 μm, 2.1 × 100 nm, Phenomenex, Torrance, CA, USA) and a UV-Vis detector (L-2420U) at an absorption wavelength of 520 nm.
The method employed was the one published by Pereira et al. [27]. A malvidin chloride (commercial anthocyanidin standard) calibration curve in a range from 0.36 to 34 mg/L of malvidin chloride (y = 232219.58x − 3574.06) with a correlation coefficient (r2 = 0.9997) was employed. The 13 anthocyanin concentrations were calculated using the above-mentioned curve, considering equivalent molar absorptivities for all anthocyanins and taking into account their molecular weights. The analyses were carried out in duplicate.

2.7. Data Analysis

For all results, mean values, standard deviations and all significant differences were determined by ANOVA analysis using Bonferroni Multiple Range (BSD) test with 95% confidence (p < 0.05) with GraphPad Prism 6.01 software for Windows (GraphPad Software). Principal Components Analysis (PCA) was performed using the SPSS 24.0 statistical computer package (SPSS Inc., Chicago, IL, USA). Rotated component matrix loadings, with “varimax” Kaiser normalization as the factor extraction method was used.

3. Results and Discussion

3.1. Genetic Analysis

Six microsatellite loci are considered as the minimal standard marker set for grapevine accession identification [16]; additionally, another group of sixteen microsatellite loci were analyzed in order to proceed to a more accurate grape accession authentication. The genotypes obtained for ’Tintilla de Rota’ and ‘Graciano’ accessions at 22 microsatellite loci are shown in Table S2. The two accessions presented the same genetic profile at all microsatellite loci analyzed. The genotype obtained was compared and confirmed with the Rancho de la Merced Germplasm Bank genotype database [14] and European databases [13].

3.2. Sugar Evolution during Ripening Period

Table 1 shows the evolution of sugar content (glucose, fructose and its addition) expressed in mg per gram of dry extract obtained on each of the sampling days for the two grape accessions studied (‘Graciano’ and ‘Tintilla de Rota’). In both cases, glucose and fructose content, as well as its addition, showed a similar behavior during the different days of study and between both accessions. It is necessary to point out that, in all cases, no significant differences were found neither when comparing the different sugar concentrations during the days of evolution of the study in each accession, nor between each accession for each day of sampling (ANOVA, p < 0.05).
During the ripening period, the vine begins to accumulate sugars in the berries and, therefore, the content of these compounds increases progressively in grape musts until reaching the point of technological ripeness [28]. However, the results obtained do not reflect this same behavior given that prior to the analysis of sugars, the samples underwent a freeze-drying process, in which the total water content of the grapes analyzed was extracted. Nevertheless, at all times it was possible to verify how a ratio of 0.5 was maintained between the fructose and glucose content, with respect to the total sum of both sugars, as indicated by several authors [29,30,31].

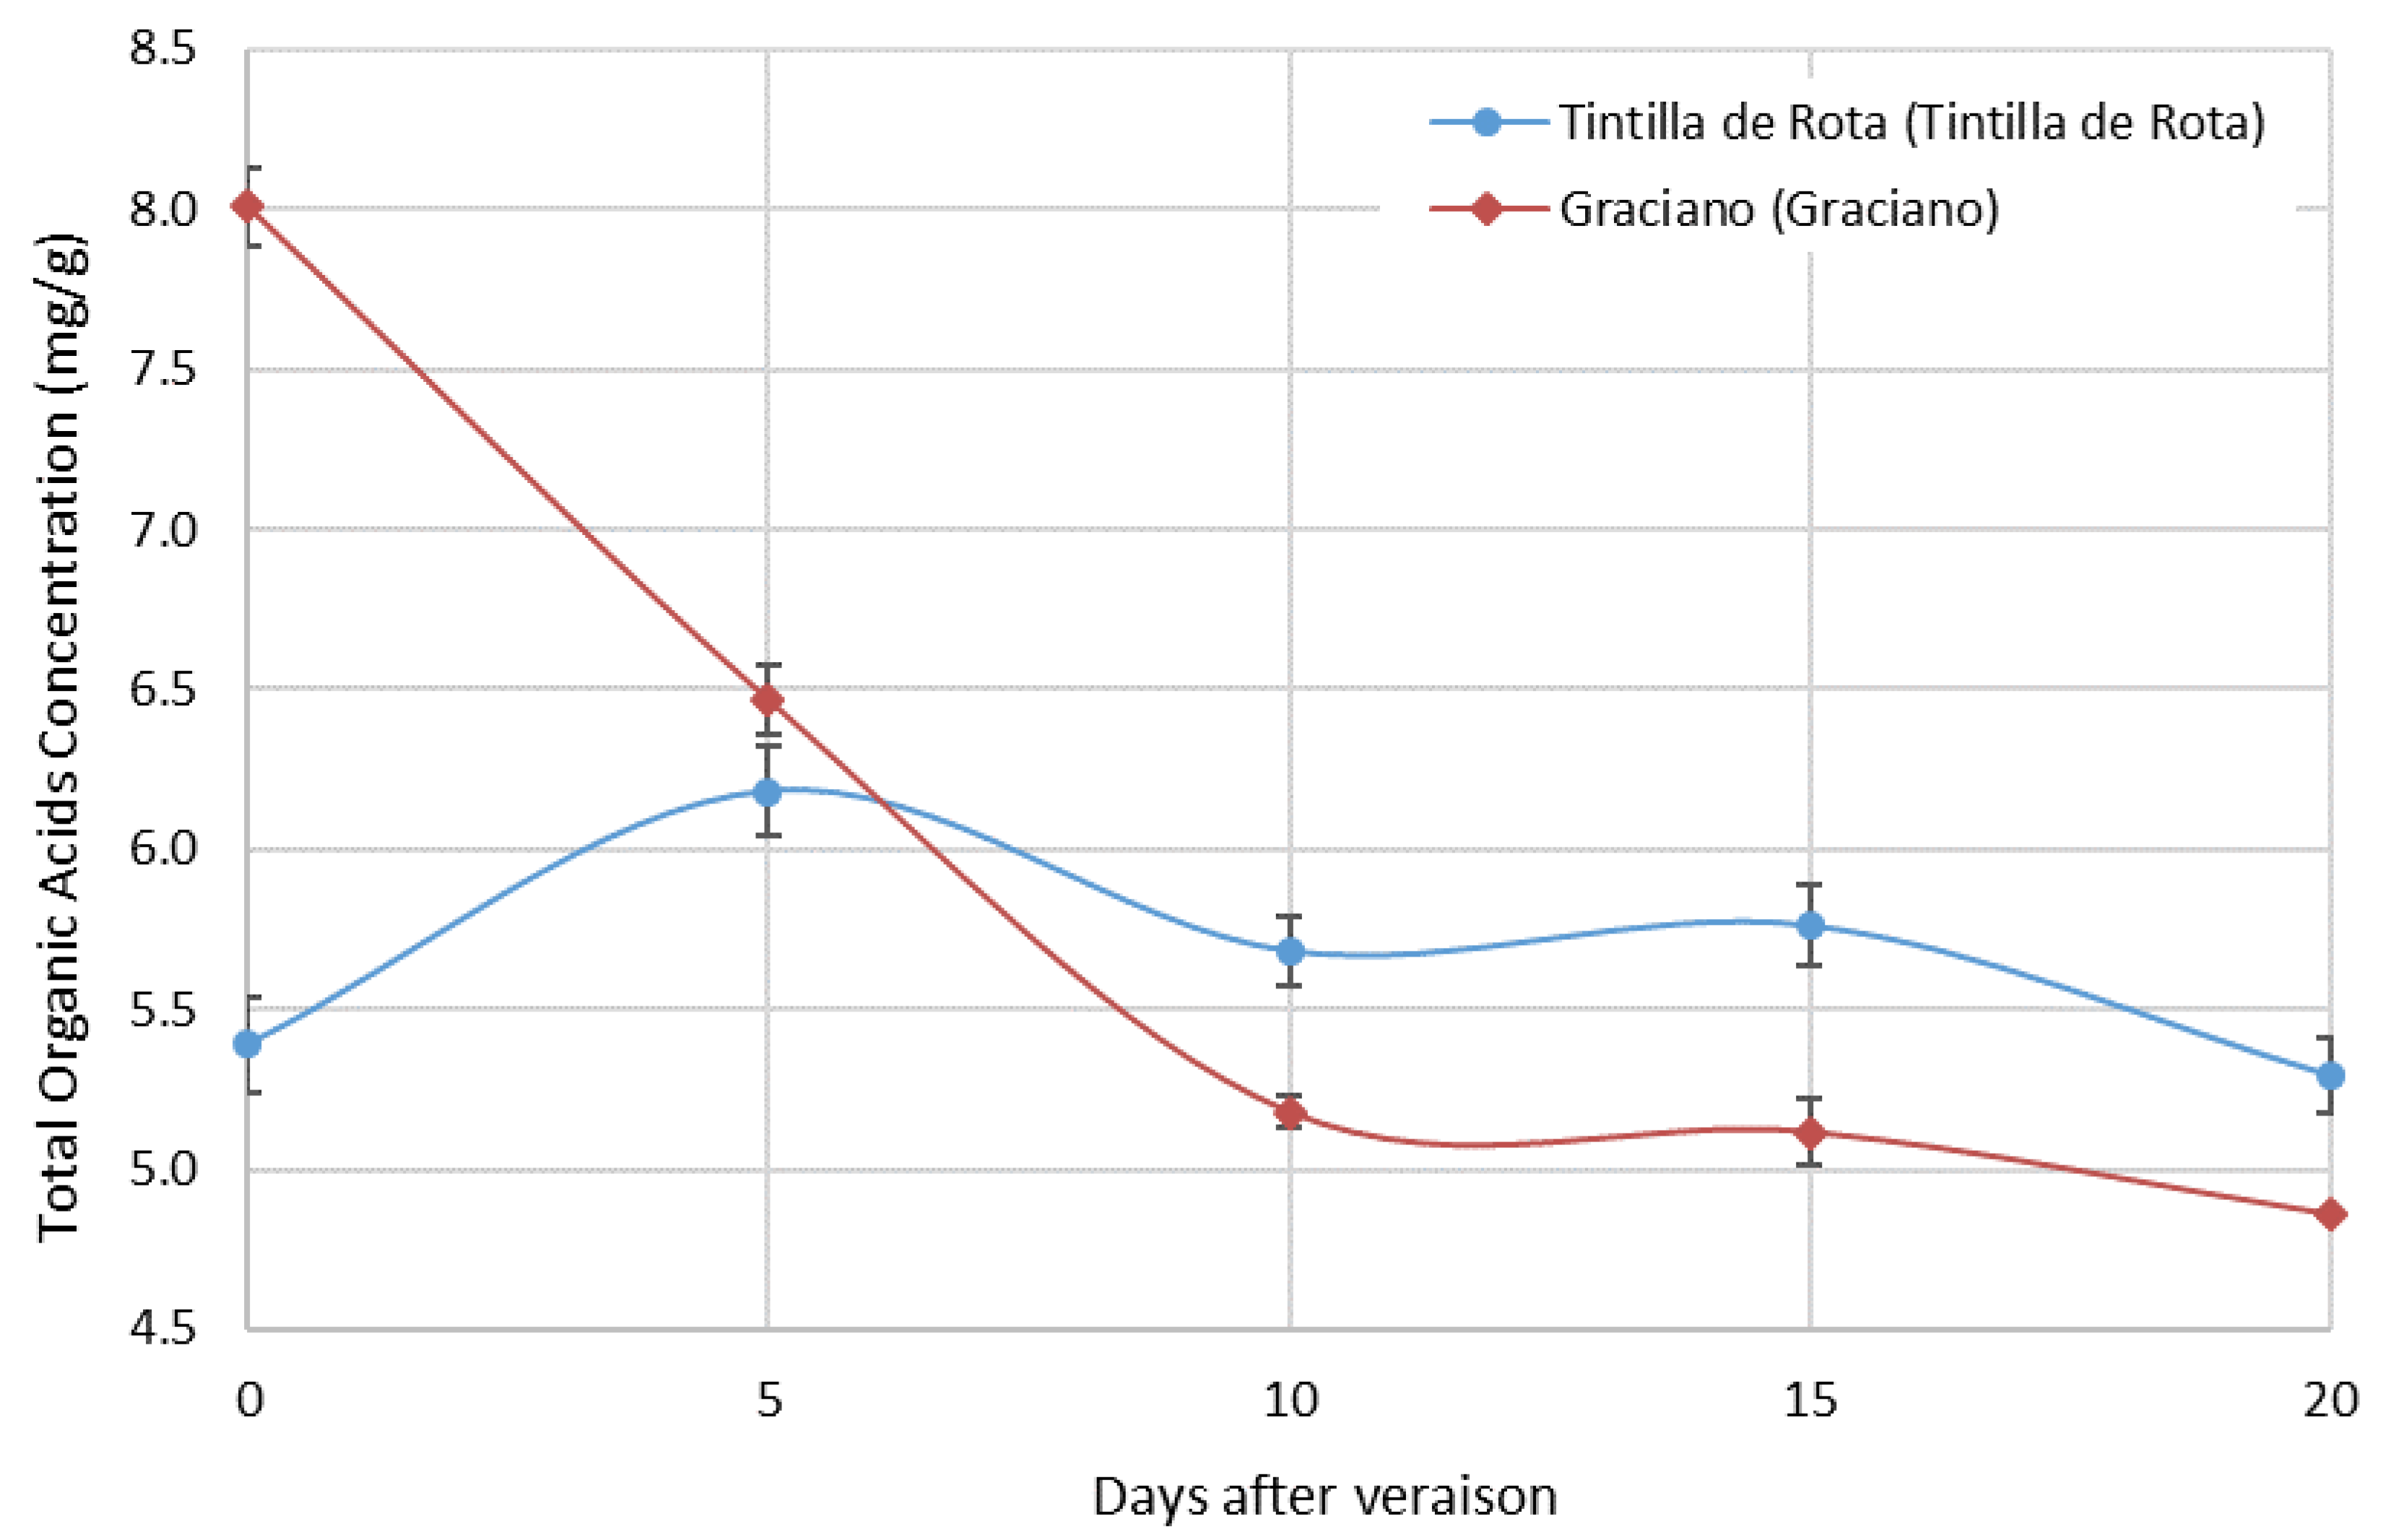
3.3. Organic Acid Content during Grape Ripening

Figure 1 shows the evolution of the total organic acid content expressed in mg/g of dry extract for the two accessions studied.
In general, both accessions showed a slightly different behavior. The total organic acid content on the first day of sampling was very different between the two accessions. While ‘Graciano’ showed a total content of 8.009 ± 0.070 mg/g, ‘Tintilla de Rota’ showed a content of 5.392 ± 0.338 mg/g, which was the significantly smaller difference observed (ANOVA p < 0.05). Occasionally, the values obtained for ‘Tintilla de Rota’ seem to indicate that the same level of ripening had not yet been reached between the two accessions. However, already in the second sampling point, it was observed that the behavior between both accessions was very similar. Thereafter, in both cases a slight oscillation in total acid content was observed, ‘Graciano’ being the accession with the lowest values compared to ‘Tintilla de Rota’.
Figure 2a,b shows the detailed study of the evolution of tartaric acid (Figure 2a) and malic acid (Figure 2b) content for each accession.
The greatest differences in the content of both acids between the two accessions can be observed on the first and second day of sampling, presenting a behavior slightly similar to that already observed in Figure 1. ‘Graciano’ showed significantly higher values for both tartaric acid and malic acid on day 0 and 5 of sampling compared to ‘Tintilla de Rota’. However, these differences disappeared and the values were equalized from the 10th day until the end of sampling for tartaric acid. Malic acid presented a considerable difference between the two accessions after day 5. For ‘Tintilla de Rota’, tartaric acid content showed an oscillating behavior with slight increases and decreases during the different sampling days. Regarding the concentration of malic acid, it should be noted that, in both cases the behavior was very similar, with a decrease in the concentration of this acid during the period sampled with respect to the initial values. As can be seen, this decrease in malic acid is more pronounced in ‘Graciano’, where significant differences were observed in the concentration of this compound between sampling days 0 and 10, 15 and 20 compared to ‘Tintilla de Rota’ (ANOVA, p < 0.05). In historical references, Roxas Clemente describes ‘Tintilla de Rota’ [12] as a grapevine variety with thick skin berries. In this sense, this distinctive trait of grape berries could be related to a deceleration in the loss of malic acid by respiratory combustion [1,32] during grape ripening compared to ‘Graciano’.
The results obtained in these analyses showed that ‘Graciano’ presents a normal behavior during ripening with respect to other authors’ descriptions [33,34,35], observing a decrease in the concentration of acids throughout the ripening process. This decrease in total acidity during the ripening period is mainly due to the decrease in the concentration of tartaric acid, since it is the acid with the greatest influence on the acidity behavior of grape musts compared to malic acid. The decrease in tartaric acid content could be related to the salification of the free forms of tartaric acid with potassium ions in grape berries [36,37].
Regarding the evolution of malic acid, the observed behavior was very similar to that studied by several authors [28,38] who observed a drop in malic acid during the ripening process. This drop could be explained by the grapevine metabolism, since, during this period of the grapevine cycle, it oxidizes malic acid as a source of carbon and energy [39], where malic acid would be oxidized and degraded into pyruvic acid and CO2 for its incorporation into the Krebs cycle [40,41].

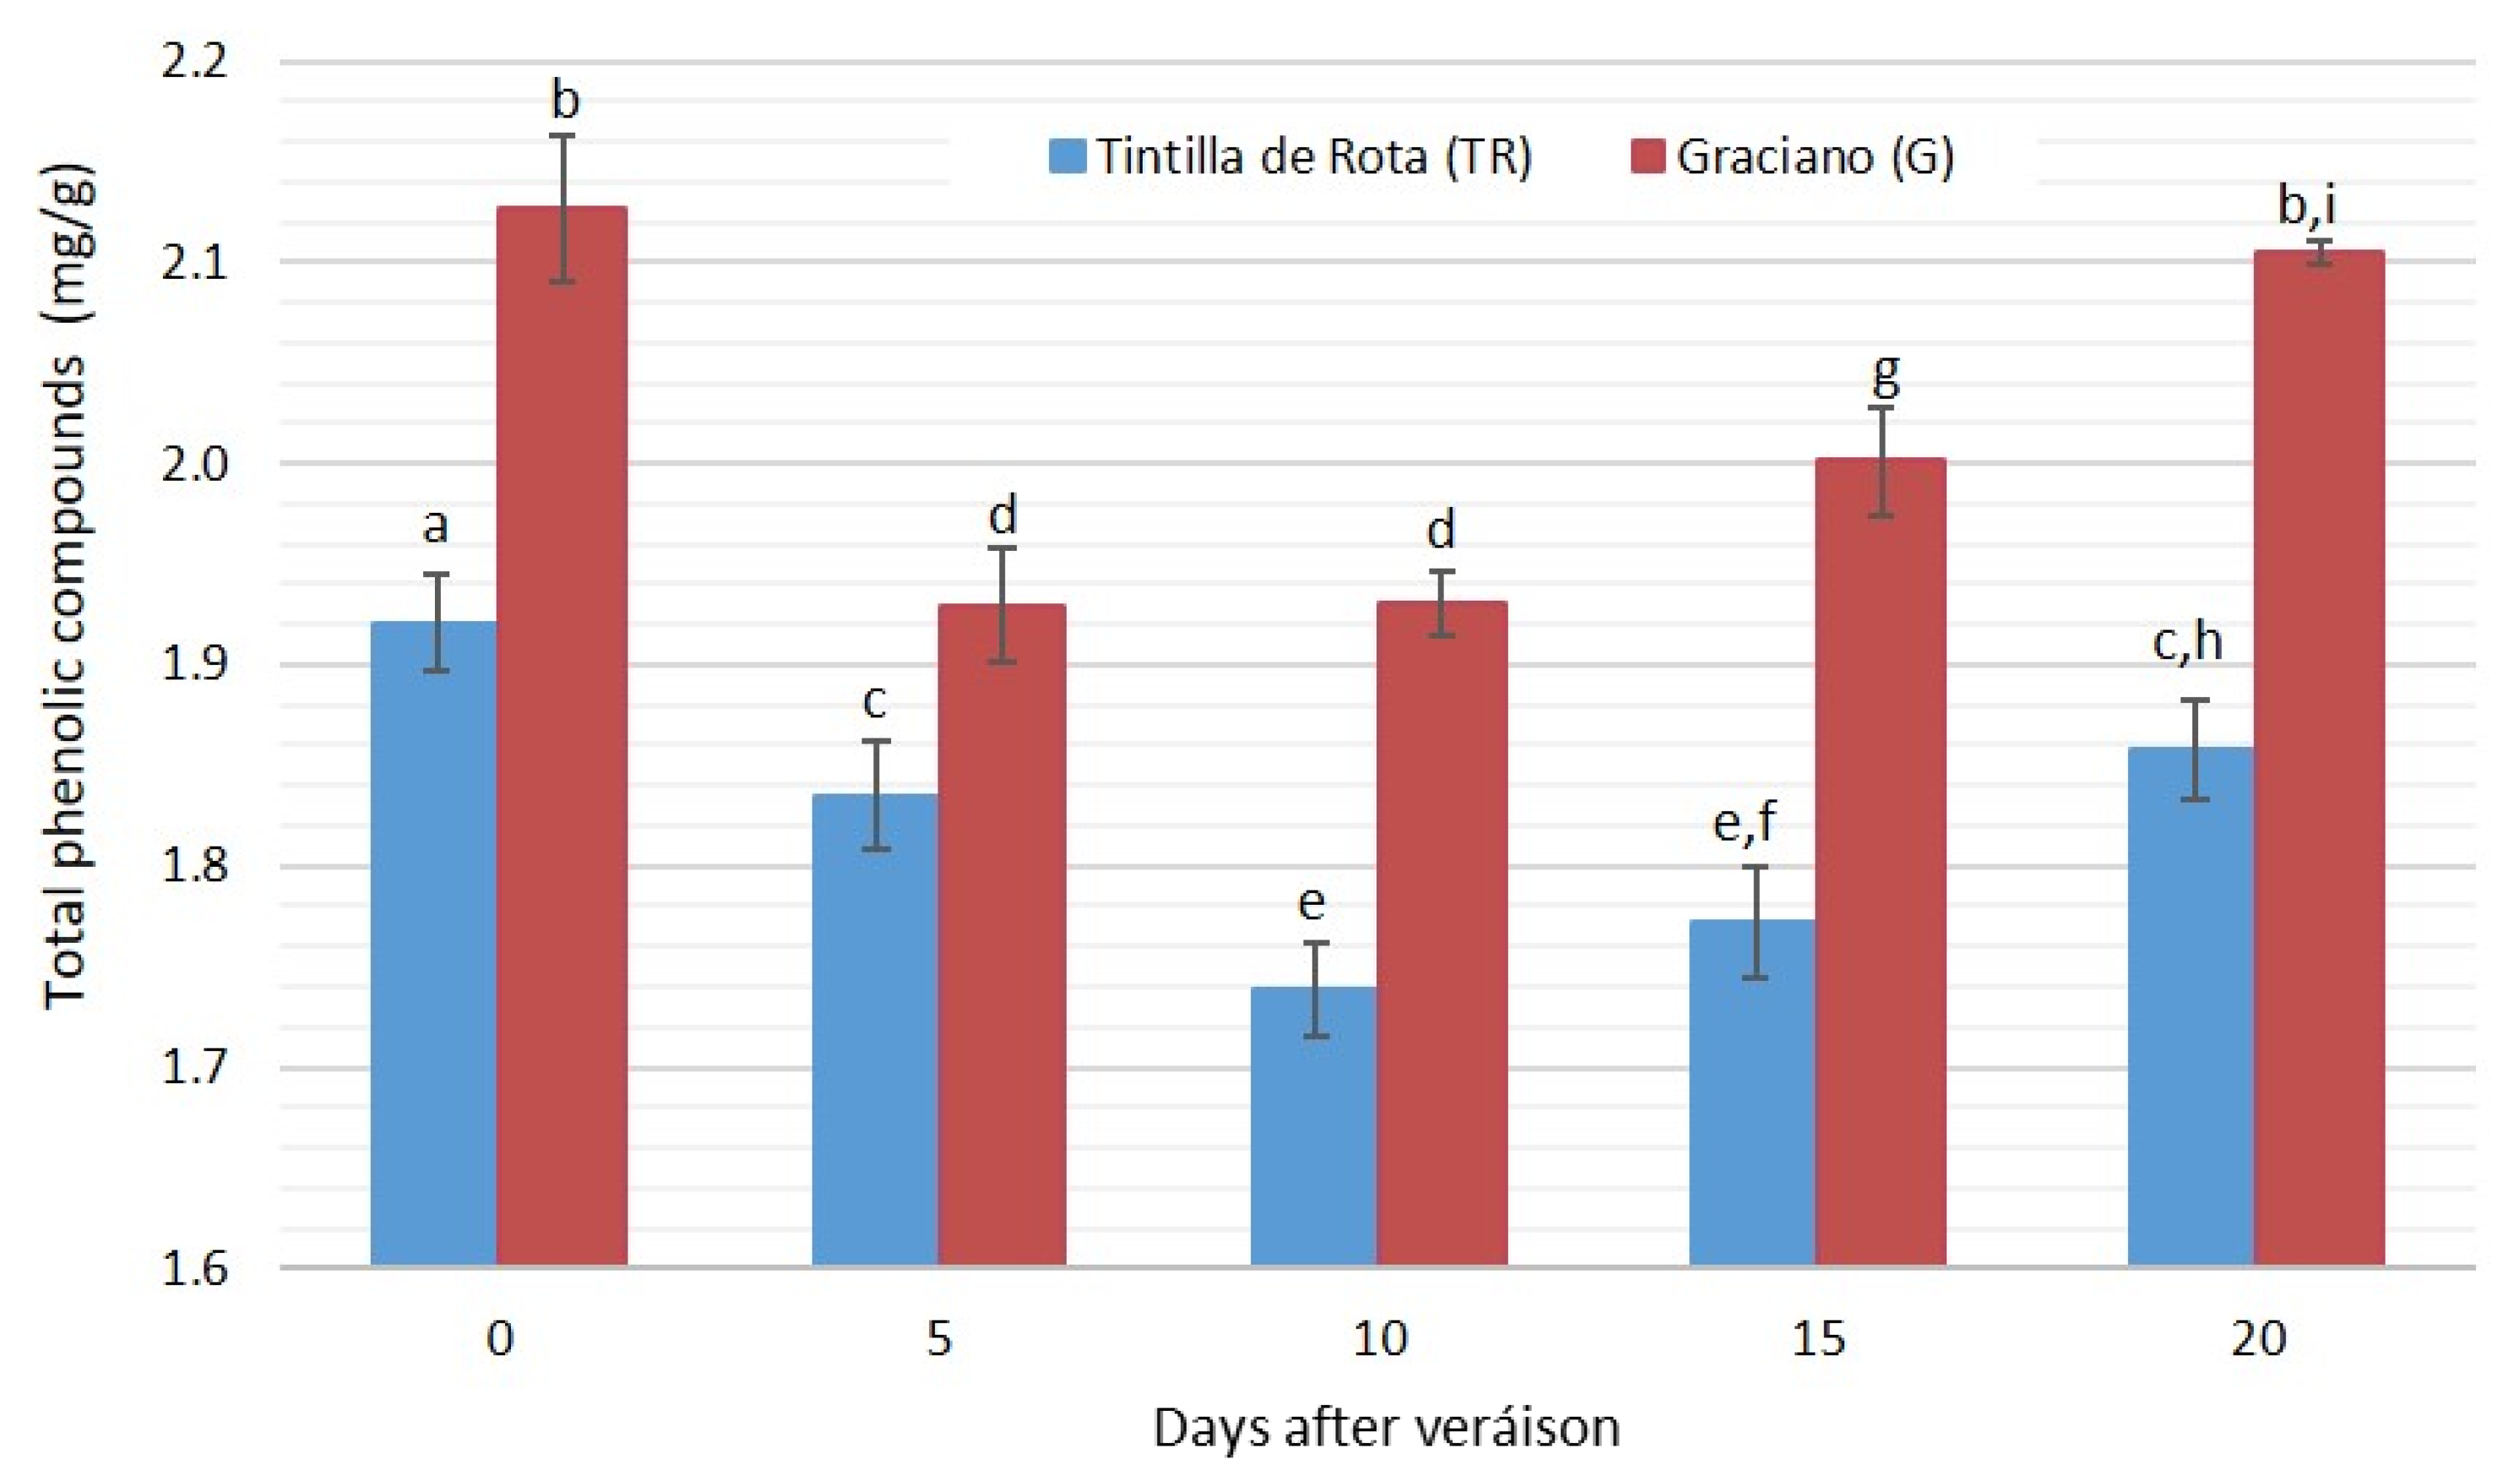
3.4. Phenolic Compound Evolution during Grape Ripening (Excluding Anthocyanins)

The following individual phenolic compounds were identified: caftaric acid, catechin, epicatechin, epicatechin gallate, quercetin 3-galactoside (Q-3-gal), rutin, quercetin 3-rhamnoside (Q-3-rahm), kaempferol and quercetin. Figure 3 shows the evolution of the total amount of phenolic compounds identified versus time (ripening period). After its analysis, nine different phenolic compounds were identified. Among them, kaempferol, quercetin and epicatechin stand out for having a significantly higher concentration than the rest of the phenols identified (Table 2).
In general, a similar trend was observed for both accessions, in which a continuous decrease in the total amount of phenolic compounds was observed from day 0 to day 10. From this day on, the trend was reversed, increasing to levels similar to those obtained on day 0 in the case of ‘Tintilla de Rota’ and on the fifth day in the case of ‘Graciano’. Despite the fact that both accessions showed the same trend during the whole period sampled, it can be noted that for ‘Graciano’ accession, the concentration of phenolic compounds during the whole period is significantly higher with respect to ‘Tintilla de Rota’ (ANOVA p < 0.05) (Figure 3).
As for the individual phenolic compounds analyzed, nine different compounds (excluding anthocyanins) were detected (Table 2). Five flavonols were identified (quercetin, kaempferol, rutin, quercetin-3-galactoside and quercetin-3-rhamnoside), as well as one form of hydroxycinnamic acid (caftaric acid) and three forms of flavanols (catechin, epicatechin and epicatechin gallate). For all the identified compounds, kaempferol showed concentrations between 1.45 and 1.50 mg/g, epicatechin showed values between 0.2 and 0.1 mg/g and quercetin showed concentrations between 0.12 and 0.18 mg/g of dry extract, which stood out with higher concentrations.
Important differences were observed in both accessions in the different compound concentrations along the sampling period, with the exception of quercetin, which did not show relevant differences in ‘Tintilla de Rota’. The rest of the phenolic species differed significantly between both accessions both in concentration and evolution throughout the period studied, while ‘Graciano’ was the accession with the highest content of caftaric acid, quercetin 3-O-galactoside, rutin and quercetin. On the other hand, it was observed that ‘Graciano’ undergoes a positive evolution for the described compounds except for quercetin 3-O-galactoside, which decreases significantly (ANOVA p < 0.05) to values close to 0.04 mg/g of extract.
In general, phenolic compounds found in both the skin and pulp are either synthesized or regulated by various enzymes, which are sensitive to environmental conditions and environmental factors [42]. One of the environmental factors that can affect these enzymes is radiation. High radiation and temperatures on grape bunches are closely related to the production of polyphenols, since these compounds have photoprotective functions [43]. An increase in temperature and an increase in dryness may be climatic conditions influencing the production of anthocyanin or polyphenols in grapes [44], these conditions being similar to those found in a warm climate zone such as the one where the study was conducted. On the other hand, factors such as the abundance of nitrogen in the chemical composition of the soil or low water stress in the vineyard could decrease the production of polyphenols, due to the change in the role of the enzyme phenylalanine ammoniolase (PAL), from being present in the synthesis of polyphenols to being present in the synthesis of compounds related to the vegetative development of the vine [37]. Thus, it should also be highlighted that during the analyses, relatively high concentrations of flavanols were detected, compounds that tend to polymerize and give rise to different tannins, which are difficult to detect with the chosen analysis technique and therefore give large variations in the amount of total phenolic compounds.

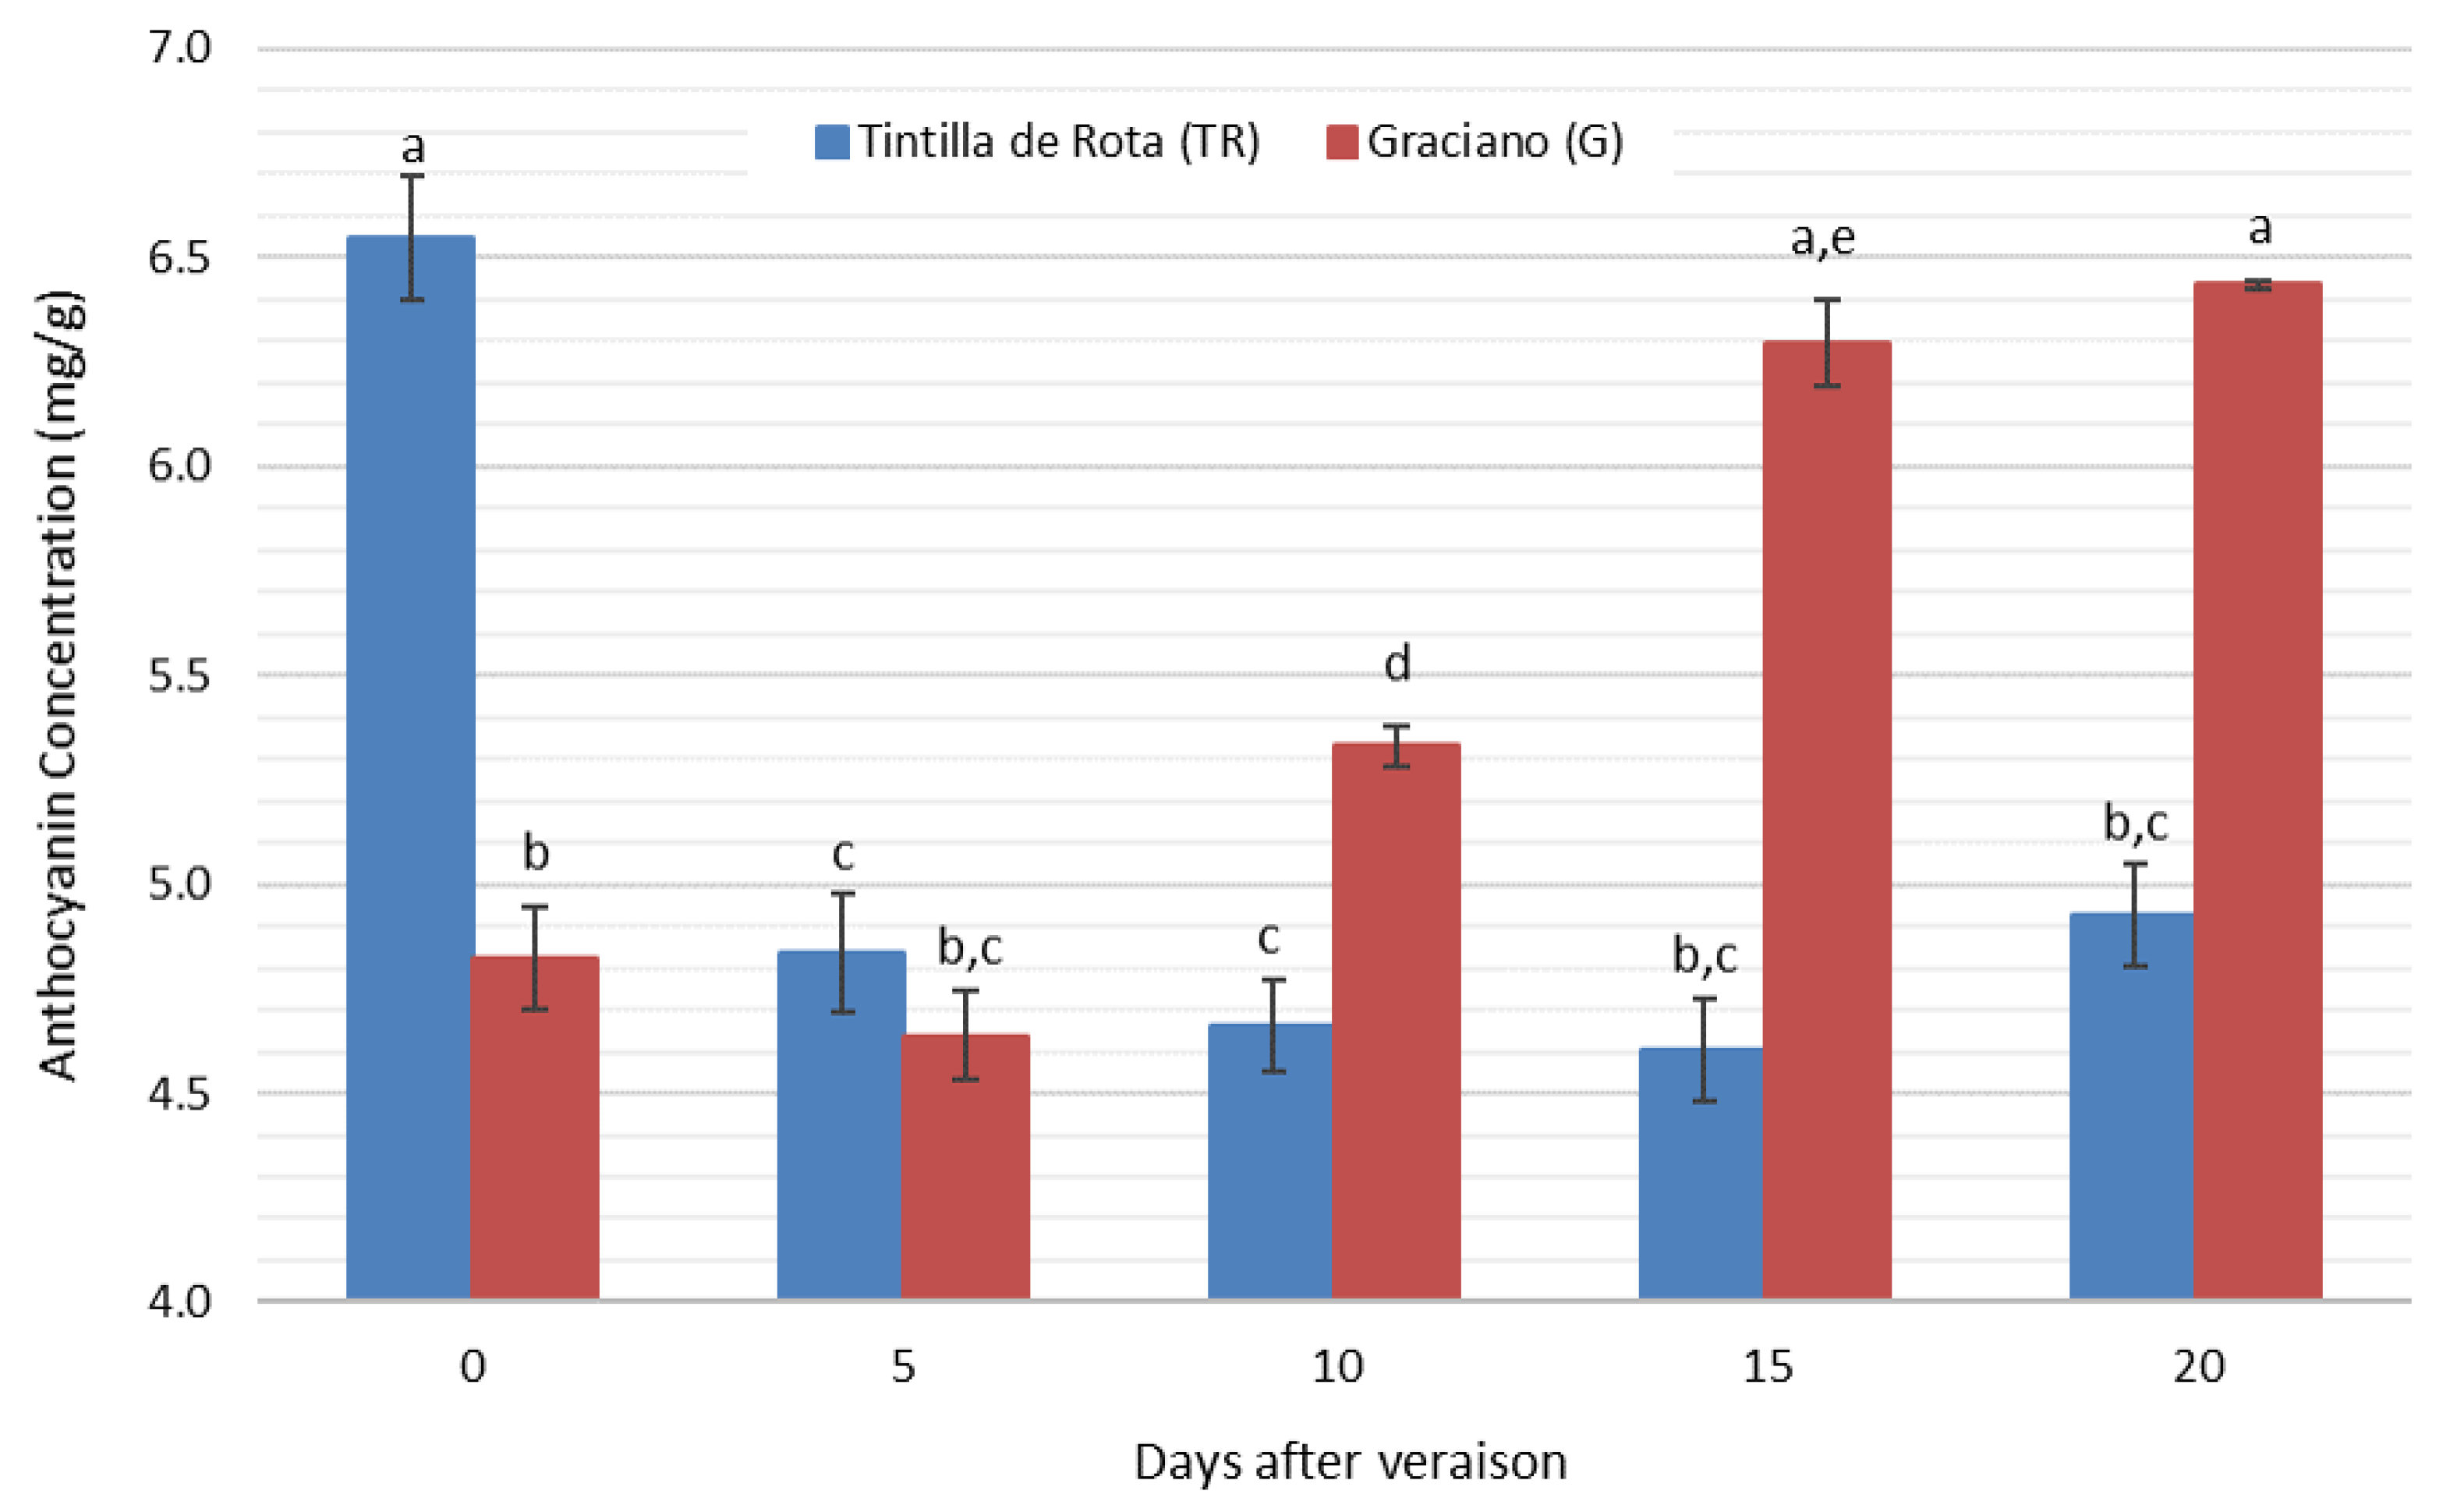
3.5. Anthocyanin Concentration Evolution during Grape Ripening

The following anthocyanins were identified in the samples: delphinidin 3-O-glycoside (Del3Glu, m/z = 465), cyanidin 3-O-glycoside (Cy3Glu, m/z = 449), petunidin 3-O-glycoside (Pet3Glu, m/z = 479), peonidin 3-O-glycoside (Peo3Glu, m/z = 463), malvidin 3-O-glycoside (Mal3Glu, m/z = 493), delphinidin 3-O-(6″-acetyl)-glucoside (Del36AcG, m/z = 507), cyanidin 3-O-(6″-acetyl)-glucoside (Cy36AcG, m/z = 491), petunidin 3-O-(6″-acetyl)-glucoside (Pet36AcG, m/z = 521), peonidin 3-O-(6″-acetyl)-glucoside (Peo36AcG, m/z = 505), malvidin 3-O-(6″-acetyl)-glucoside (Mal36AcG, m/z = 535), cyanidin 3-O-(6″-p-coumaryl)-glucoside (Cy36CuG, m/z = 595), petunidin 3-O-(6″-p-coumaroyl)-glucoside (Pet36CuG, m/z = 625) and peonidin 3-O-(6″-p-coumaroyl)-glucoside (Peo36CuG, m/z = 609).
The evolution of the total amount of anthocyanins analyzed is shown in Figure 4. The results of the analytical determinations showed the identification and quantification of 13 different anthocyanins.
Figure 4 displays how both accessions showed different behaviors. It can be seen how they exhibited differences in the amount of anthocyanins at the beginning of the sampling period, where ‘Tintilla de Rota’ accession presented higher levels of anthocyanins than ‘Graciano’. As ripening progressed, this concentration decreased in the case of ‘Tintilla de Rota’ until day 15 of sampling. For ‘Graciano’ accession, it was found that the behavior of the total anthocyanin concentration was similar until the fifth day of study, increasing significantly until day 15 of sampling, where the values stabilized until the end of the period studied. The observed behavior was unusual, since during grape ripening the concentration of anthocyanin increases from veraison and throughout the ripening period due to the accumulation of these compounds in the skin cell vacuoles [45]. Furthermore, some authors reported decreases in the concentrations of these compounds due to their degradation either by biotic and/or abiotic factors [46]. The origin of these drops could be due to a multitude of phenomena, such as high temperatures causing inhibition of the enzymes that synthesize these compounds [47] and changes in pH or oxidations [48] that could indicate a lag in phenolic ripeness. The anthocyanin profile studied can be separated into three groups depending on the concentration range in which they can be found. A first group would be the one comprising a concentration range from 3 to 5 mg/g of dry extract, malvidin-3-O-glucoside being the only anthocyanin in this group, a second group of anthocyanins would be the one formed by peonidin 3-O-(6″-acetyl)-glucoside, peonidin 3-O-glucoside, peonidin 3-O-glucoside, petunidin 3-O-glucoside and delphinidin 3-O-glucoside in concentrations between 0.15 and 0.71 mg/g of grape dry extract, and a last group of anthocyanin would be the one with a concentration lower than 0.15 mg/g, in which the rest of the identified compounds found can be grouped.
The results of this particular phenolic fraction were studied individually due to the relevance of these compounds in oenology and their capacity as molecular markers [49]. Considering each of the anthocyanins individually in this range, in both accessions the behavior of malvidin showed a similar trend to the total anthocyanin of each of the accessions. On the other hand, in ‘Tintilla de Rota’, each and every one of the different compounds identified decreased in concentration, with the exception of peonidin-3-glucoside. In contrast, ‘Graciano’ showed a different behavior in these compounds, in which all forms of anthocyanin increased in concentration, with a remarkable increase in peonidin 3-O-glucoside.

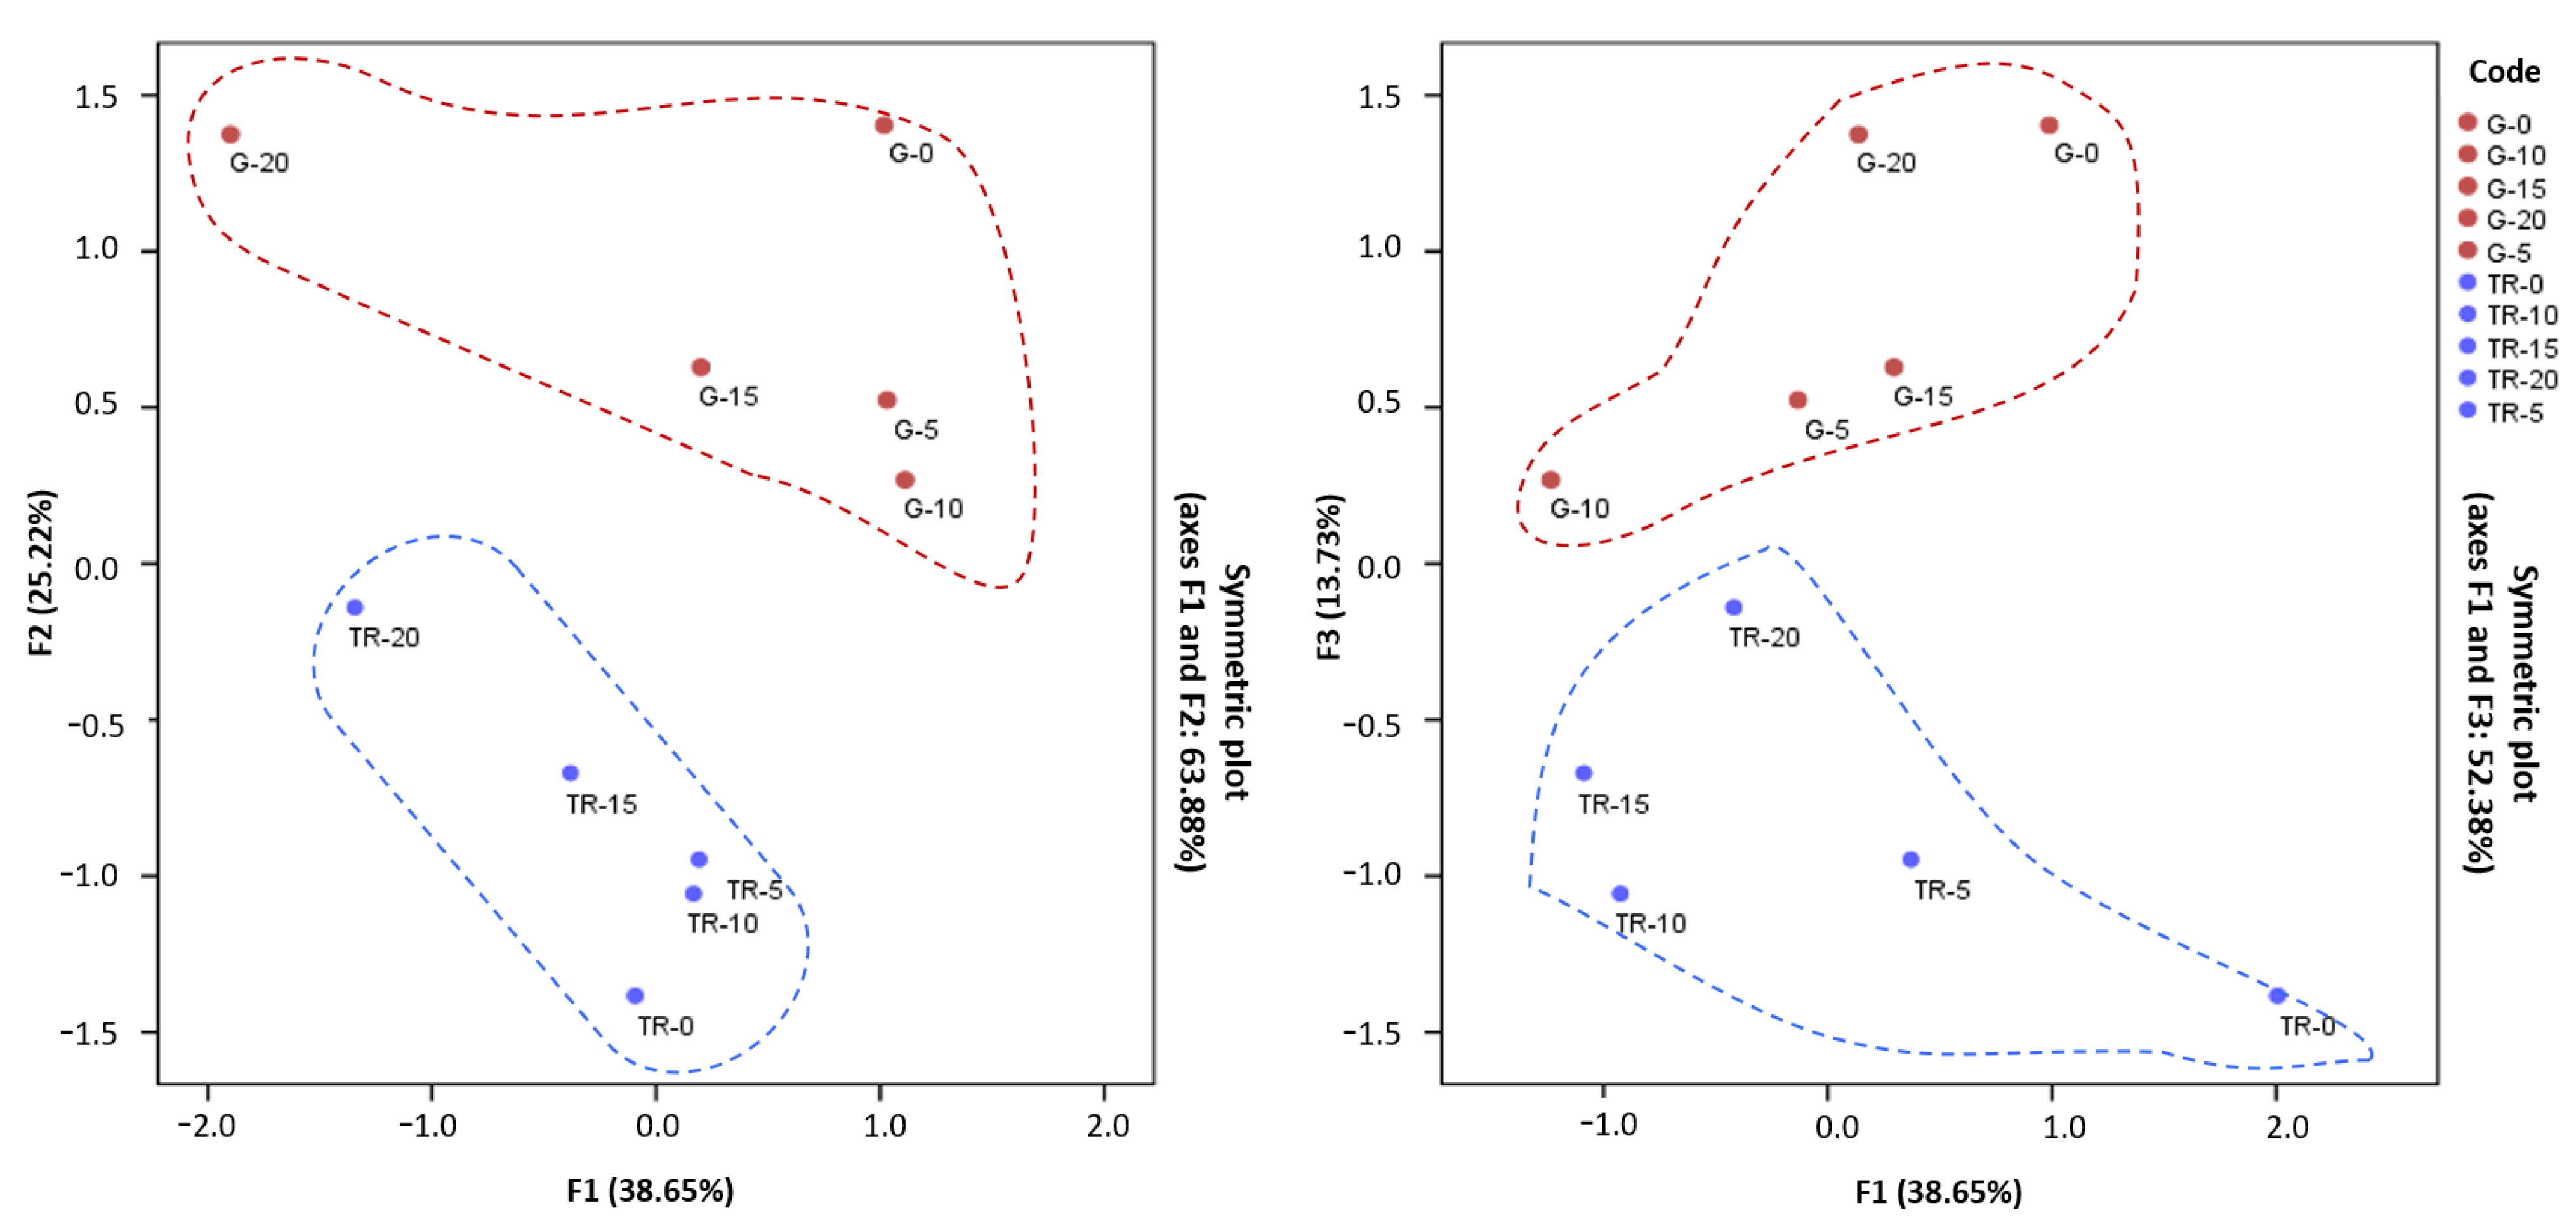
3.6. Principal Component Analysis (PCA)

Table 3 shows the factor loading results of the principal component analysis (PCA) performed over the data set, evaluating as variables the concentration of nine phenolic compounds (caftaric acid, catechin, epicatechin, epicatechin gallate, quercetin 3-galactoside, rutin, quercetin 3-rhamnoside, kaempferol and quercetin) including 13 anthocyanins (delphinidin 3-O-glycoside, cyanidin 3-O-glycoside, petunidin 3-O-glycoside, peonidin 3-O-glycoside, malvidin 3-O-glycoside, delphinidin 3-O-(6″-acetyl)-glucoside, cyanidin 3-O-(6″-acetyl)-glucoside, petunidin 3-O-(6″-acetyl)-glucoside, peonidin 3-O-(6″-acetyl)-glucoside, malvidin 3-O-(6″-acetyl)-glucoside, cyanidin 3-O-(6″-p-coumaryl)-glucoside, petunidin 3-O-(6″-p-coumaroyl)-glucoside and peonidin 3-O-(6″-p-coumaroyl)-glucoside). PCA extracted three factors, which explained 77.61% of the total variance of the data. Factor 1 (F1) was positively correlated with caftaric acid, rutin, quercetin 3-galactoside, quercetin, malvidin 3-O-(6″-acetyl)-glucoside, petunidin 3-O-(6″-p-coumaroyl)-glucoside and peonidin 3-O-(6″-p-coumaroyl)-glucoside, and negatively with delphinidin 3-O-(6″-acetyl)-glucoside, cyanidin 3-O-(6″-acetyl)-glucoside, petunidin 3-O-(6″-acetyl)-glucoside, peonidin 3-O-(6″-acetyl)-glucoside and to a lesser extent cyanidin 3-O-(6″-p-coumaryl)-glucoside. Factor 2 (F2) correlated positively with quercetin 3-galactoside, rutin and malvidin 3-O-glycoside, and negatively with catechin, cyanidin 3-O-glycoside and peonidin 3-O-glycoside. Factor 3 (F3) correlated positively with epicatechin gallate, delphinidin 3-O-glycoside, petunidin 3-O-glycoside and to a lesser extent with epi-catechin, and negatively with quercetin 3-rhamnoside and kaempferol.
As shown in Figure 5, F1 tended to increase with increasing concentrations of the phenolic compounds caffeic acid and rutin, while it shifted towards negative values with increasing concentrations of the anthocyanins Del36AcG, Peo36AcG and Cy36AcG. As can be seen in Figure 5, the major differences in anthocyanin content correspond to ‘Graciano’, while in ‘Tintilla de Rota’ these differences were less pronounced. Regarding F2, the displacement towards positive values corresponds to the increase in Mal3Glu, mainly, while the catechin, Cy3Glu and Peo3Glu cause the negative displacement in F2 as their concentration increases. According to Arozarena et al. [50], Mal3Glu and Peo3Glu compounds were able to discriminate between red grape varieties. As for Factor 3, the positive shift is mainly due to the increase in epicatechin gallate and the anthocyanin Del3Glu and Pet3Glu. Figure 5 shows how the behavior generated by these compounds (Catechin, Cy3Glu, Peo3Glu, Mal3Glu, epicatechin gallate, Del3Glu and Pet3Glu) could be attributed to the mutant character, due to the marked differences among the two accessions cultivated on the same vineyard. Because of the genetic differences and several environmental factors, such as light, temperature, and humidity, the extraction method remarkably affects the phenolic composition [51]. Furthermore, a relationship seems to exist between the evolution of the concentration of these compounds and the ripening stage of the grape in the case of ‘Tintilla de Rota’. As the ripening period increases, there occurs a tendency towards more positive values, both at F2 and F3, for this accession.

4. Conclusions

Genetic analysis confirmed the identity of the ‘Tintilla de Rota’ and ‘Graciano’ accessions. Both accessions showed a single microsatellite profile, which led to the interpretation that they are synonymous varieties. However, the analysis of compounds of enological interest during the ripening period allowed for the discrimination of both accessions in terms of organic acid content and phenolic compounds, including anthocyanins. There were no significant differences in sugar content (glucose and fructose). The PCA analysis allowed us to verify the differences in polyphenol and anthocyanin composition, finding marked differences in catechin, Cy3Glu, Peo3Glu, Mal3Glu, epicatechin gallate, Del3Glu and Pet3Glu analyzed during the ripening period.
These results show the need to continue studying grapevine varieties considered as synonymies by genetic analysis before ruling out their identity or duplicity. This plant material may contain some variability with respect to the original genotype and is a source of diversity to exploit in the vineyards by the clonal selection of these somatic variants. In addition, the preservation of this somatic variability may be a possible strategy to maintain the typicality of the wines made from them.

Supplementary Materials

The following are available online at https://www.mdpi.com/article/10.3390/horticulturae8010022/s1, Table S1: Extraction conditions for sugars, organic acids, anthocyanin and phenolic compounds. Table S2: Genetic profiles obtained for ‘Tintilla de Rota’ and ‘Graciano’ accessions at 22 microsatellite loci. Alleles sizes are given in base pairs (bp).

Author Contributions

Conceptualization, A.A.-A., P.S.-G., G.F.B., V.P. and A.J.-C.; data curation, P.S.-G., A.A.-A. and A.J.-C.; formal analysis, A.A.-A., P.S.-G. and A.J.-C.; funding acquisition, A.J.-C. and V.P.; investigation, P.S.-G., A.A.-A., G.F.B. and A.J.-C.; methodology, A.A.-A., P.S.-G., G.F.B., V.P. and A.J.-C.; project administration, A.J.-C. and V.P.; supervision, A.J.-C. and A.A.-A.; writing—original draft, P.S.-G., A.A.-A. and A.J.-C.; writing—review and editing, P.S.-G., A.A.-A., A.J.-C. and G.F.B. All authors have read and agreed to the published version of the manuscript.

Funding

This research was funded by PALOMINOSWINES research contract, fund number OT2018−093 and GRAPEGEN and RF2006-00011-00-00 grant and RTA2008-00032-C01-02, from Ministerio de Ciencia y Tecnología (INIA-Spain). This work has also been supported by the project “EQC2018-005135-P” (equipment for liquid chromatography using mass spectrometry and ion chromatography) of the State Subprogram of Research Infrastructures and Technical Scientific Equipment.

Institutional Review Board Statement

Not applicable.

Informed Consent Statement

Not applicable.

Acknowledgments

The authors thank the vine growers of the private vineyards for providing the grapes for the development of this research.

Conflicts of Interest

The authors declare no conflict of interest.

References

  1. Sancho-Galán, P.; Amores-Arrocha, A.; Palacios, V.; Jiménez-Cantizano, A. Effect of Grape Over-Ripening and Its Skin Presence on White Wine Alcoholic Fermentation in a Warm Climate Zone. Foods 2021, 10, 1583. [Google Scholar] [CrossRef] [PubMed]
  2. Riaz, S.; De Lorenzis, G.; Velasco, D.; Koehmsted, A.; Maghradze, D.; Bobokashvili, Z.; Musayev, M.; Zdunic, G.; Laucou, V.; Walker, M.A.; et al. Genetic diversity analysis of cultivated and wild grapevine (Vitis vinifera L.) accessions around the Mediterranean basin and Central Asia. BMC Plant Biol. 2018, 18, 137. [Google Scholar] [CrossRef]
  3. Jiménez-Cantizano, A.; García de Lujan, A.; Arroyo-García, R. Molecular characterization of table grape varieties preserved in the Rancho de la Merced Grapevine Germplasm Bank (Spain). Vitis 2018, 57, 93–101. [Google Scholar]
  4. Distribution of the World’s Grapevine Varieties. Available online: https://www.oiv.int/public/medias/5888/en-distribution-of-the-worlds-grapevine-varieties.pdf (accessed on 11 November 2021).
  5. Moncada, X.; Pelsy, F.; Merdinoglu, D.; Hinrichsen, P. Genetic diversity and geographical dispersal in grapevine clones revealed by microsatellite markers. Genome 2006, 49, 1459–1472. [Google Scholar] [CrossRef]
  6. Carbonell-Bejerano, P.; Royo, C.; Mauri, N.; Ibáñez, J.; Martínez-Zapater, J.M. Somatic variation and cultivar innovation in grapevine. In Advances in Grape and Wine Biotechnology, 1st ed.; Morata, A., Loira, I., Eds.; Intechopen: London, UK, 2016; p. 8. [Google Scholar]
  7. This, P.; Martínez-Zapater, J.M.; Péros, J.P.; Lacombe, T. Natural Variation in Vitis. In Genetics, Genomics and Breeding of Grapes, 1st ed.; Adam-Blondon, A.F., Martínez-Zapater, J.M., Kole, C., Eds.; Science Publishers: New York, NY, USA, 2011; p. 30. [Google Scholar]
  8. Bourisquot, J.M.; This, P. Essai de définition du cépage. Prog. Agric. Vitic. 1999, 116, 359–361. [Google Scholar]
  9. Graça, A.; Manso, J.; Sandeman, G. A systematic approach to organize grapevine varieties’ naming at the international level while retaining their cultural heritage and allegiance across different countries and wine regions. In Proceedings of the 37th OIV World Congress of Vine and Wine, Mendoza, Argentina, 9–14 November 2014. [Google Scholar]
  10. Niculcea, M.; Martínez-Lapuente, L.; Guadalupe, Z.; Sanchez-Díaz, M.; Ayestarán, B.; Antolín, C. Characterization of phenolic composition of Vitis vinifera L. ‘Tempranillo’and ‘Graciano’ subjected to deficit irrigation during berry development. Vitis 2015, 54, 9–16. [Google Scholar]
  11. Dominguez, N.; García-Escudero, E.; Romero, I.; Benito, A.; Martín, I. Leaf blade and petiole nutritional evolution and variability throughout the crop season for Vitis vinifera L. cv. Graciano. Span. J. Agric. Res. 2015, 13, e0801. [Google Scholar] [CrossRef] [Green Version]
  12. Roxas Clemente, S. Ensayo Sobre las Variedades de vid que Vegetan en Andalucía, 1st ed.; Imprenta de Villapando: Madrid, Spain, 1807; pp. 111–113. [Google Scholar]
  13. Vitis International Variety Catalogue. Available online: www.vivc.de (accessed on 11 November 2021).
  14. Jiménez-Cantizano, A. Caracterización Molecular del Banco de Germoplasma de vid del Rancho de la Merced. Ph.D. Thesis, Universidad de Cadiz, Cadiz, Spain, 2014. [Google Scholar]
  15. Puertas, B.; Lara, M.; Serrano, M.J.; Varcárcel, M.; Cruz, S.; Jiménez Cantizano, A.; Garcia de Luján, A. Caracterización vitícola y enológica de las variedades tintas Graciano, Monastrell, Tempranillo y Tintilla de Rota, cultiva-das en zona cálida. In Proceedings of the Congreso Nacional de Enologos, Santiago de Compostela, Spain, 26–28 April 2002. [Google Scholar]
  16. Organisation Internationale de la Vigne et du Vin (OIV). OIV Descriptor List for Grape Varieties and Vitis Species, 2nd ed.; OIV: Paris, France, 2009. [Google Scholar]
  17. This, P.; Jung, A.; Boccacci, P.; Borrego, J.; Botta, R.; Costantini, L.; Crespan, M.; Dangl, G.S.; Eisenheld, C.; Ferreira-Monteiro, F.; et al. Development of a standard set of microsatellite reference alleles for identification of grape cultivars. Theor. Appl. Genet. 2004, 109, 1448–1458. [Google Scholar] [CrossRef] [PubMed]
  18. Zinelabidine, L.H.; Cunha, J.; Eiras-Dias, J.E.; Cabello, F.; Martínez-Zapater, J.M.; Ibáñez-Marcos, J. Pedigree analysis of the Spanish grapevine cultivar ‘Hebén’. Vitis 2015, 54, 81–86. [Google Scholar]
  19. Moreno-Vigara, J.J.; Peinado-Amores, R.A. Química Enológica, 1st ed.; Ediciones Mundi-Prensa; AMV Ediciones: Madrid, Spain, 2010. [Google Scholar]
  20. Ferreira, V.; Fernandes, F.; Pinto-Carnide, O.; Valentão, P.; Falco, V.; Martín, J.P.; Ortiz, J.M.; Arroyo-García, R.; Andrade, P.B.; Castro, I. Identification of Vitis vinifera L. grape berry skin color mutants and polyphenolic profile. Food Chem. 2016, 194, 117–127. [Google Scholar] [CrossRef] [PubMed]
  21. Jiménez Cantizano, A.; Amores Arrocha, A.; Gutiérrez Escobar, R.; Palacios, V. Identification and relationship of the autochthonous ‘Romé’ and ‘Rome Tinto’ grapevine cultivars. Span. J. Agric. Res. 2018, 16, e07SC02. [Google Scholar] [CrossRef]
  22. Santesteban, L.G.; Miranda, C.; Royo, J.B. Vegetative growth, reproductive development and vineyard balance. In Methodologies and Results in Grapevine Research, 1st ed.; Delrot, S., Medrano, H., Or, E., Bavaresco, L., Grando, S., Eds.; Springer: New York, NY, USA, 2010; pp. 45–56. [Google Scholar]
  23. Sancho-Galán, P.; Amores-Arrocha, A.; Jiménez-Cantazino, A.; Ferreiro-González, M.; Palacios, V.; Barbero, G.F. Ultrasound-assisted extraction of anthocyanins and total phenolic compounds in Vitis vinifera L. Tempranillo winemaking lees. Vitis 2019, 58, 39–47. [Google Scholar]
  24. Amores-Arrocha, A. Aplicación del Polen de abeja como Activador en el Proceso de Fermentación Alcohólica. Ph.D. Thesis, Facultad de Ciencias, Universidad de Cádiz, Cádiz, Spain, July 2018. [Google Scholar]
  25. Sancho-Galán, P.; Amores-Arrocha, A.; Jiménez-Cantizano, A.; Palacios, V. Use of Multiflora Bee Pollen as a Flor Velum Yeast Growth Activator in Biological Aging Wines. Molecules 2019, 24, 1761. [Google Scholar] [CrossRef] [PubMed] [Green Version]
  26. de Peredo, A.V.G.; Vázquez-Espinosa, M.; Piñeiro, Z.; Espada-Bellido, E.; Ferreiro-González, M.; Barbero, G.F.; Palma, M. Development of a rapid and accurate UHPLC-PDA-FL, method for the quantification of phenolic compounds in grapes. Food Chem. 2021, 334, 127569. [Google Scholar] [CrossRef]
  27. Pereira, D.T.V.; Tarone, A.G.; Cazarin, C.B.B.; Barbero, G.F.; Martínez, J. Pressurized liquid extraction of bioactive compound from grape marc. J. Food Eng. 2019, 240, 105–113. [Google Scholar] [CrossRef]
  28. Ribéreau-Gayon, P.; Dubourdieu, D.; Donèche, B.; Lonvaud, A. Handbook of Enology, 2nd ed.; John Wiley & Sons Ltd.: Chichester, UK, 2006. [Google Scholar]
  29. Kliewer, W.M. The Glucose-Fructose Ratio of Vitis Vinifera Grapes. Am. J. Enol. Vitic. 1967, 18, 33–41. [Google Scholar]
  30. Kuhn, N.; Guan, L.; Dai, Z.W.; Wu, B.; Lauvergeat, V.; Gomès, E.; Li, S.H.; Godoy, F.; Arce-Johnson, P.; Delrot, S. Berry ripening: Recently heard through the grapevine. J. Exp. Bot. 2014, 65, 4543–4559. [Google Scholar] [CrossRef] [PubMed] [Green Version]
  31. Liang, Z.; Sang, M.; Fan, P.; Wu, B.; Wang, L.; Duan, W.; Li, S. Changes of Polyphenols, Sugars, and Organic Acid in 5 Vitis Genotypes during Berry Ripening. J. Food Sci. 2011, 76, 1231–1238. [Google Scholar] [CrossRef]
  32. Chivite, J.; Raventós, M.; Castro, E. Gestión de pH en El Vino de Calidad, 1st ed.; Fundación Para la Cultura Del Vino: Madrid, Spain, 2005; pp. 9–15. [Google Scholar]
  33. Gil, P.L.O. Efectos del Deshojado Precoz, Durante Cuatro Años, Sobre las Características de la Producción en las Variedades Tempranillo, Mazuelo y Graciano (Vitis vinífera L.). Ph.D. Thesis, Universidad de La Rioja, Logroño, Spain, 2010. [Google Scholar]
  34. Tardaguilloa, J.; de Toda, F.M.; Poni, S.; Diago, M.P. Impact of early leaf removal on yield and fruit and wine composition of Vitis vinifera L. Graciano and Carignan. Am. J. Enol. Vitic. 2010, 61, 372–381. [Google Scholar]
  35. Gutiérrez-Gamboa, G.; Portu, J.; López, R.; Santamaría, P.; Garde-Cerdán, T. Elicitor and nitrogen applications to Garnacha, Graciano and Tempranillo vines: Effect on grape amino acid composition. J. Sci. Food Agric. 2018, 98, 2341–2349. [Google Scholar] [CrossRef]
  36. Dai, Z.W.; Ollat, N.; Gomès, E.; Decroocq, S.; Tandonnet, J.P.; Bordenave, L.; Pieri, P.; Hilbert, G.; Kapel, C.; Van Leeuwen, C.; et al. Ecophysiological, genetic, and molecular causes of variation in grape berry weight and composition: A review. Am. J. Enol. Vitic. 2011, 62, 413–425. [Google Scholar] [CrossRef] [Green Version]
  37. Hidalgo-Togores, J. Tratado de Enología, 2nd ed.; Ediciones Mundi-Prensa: Madrid, Spain, 2011. [Google Scholar]
  38. Kliewer, W.M. Concentration of Tartrates, Malates, Glucose and Fructose in the Fruits of the Genus Vitis. Am. J. Enol. Vitic. 1967, 18, 91–96. [Google Scholar]
  39. Conde, C.; Silva, P.; Fontes, N.; Dias, A.C.P.; Tavares, R.M.; Sousa, M.J.; Agasse, A.; Delrot, S.; Gerós, H. Biochemical Changes throughout Grape Berry Development and Fruit and Wine Quality C. Food 2007, 1, 1–22. [Google Scholar]
  40. Ruffner, P.H.; Possner, D.; Brem, S.; Rast, D. The physiological role of malic enzyme in grape ripening. Planta 1984, 160, 444–448. [Google Scholar] [CrossRef]
  41. Possner, D.; Ruffner, H.P.; Rast, D.M. Isolation and Biochemical Characterization of Grape Malic Enzyme. Planta 1981, 151, 549–554. [Google Scholar] [CrossRef]
  42. Texeira, A.; Erias-Dias, J.; Castellarin, S.D.; Gerós, H. Berry Phenolics of Grapevine under Challenging Environments. Int. J. Mol. Sci. 2013, 14, 18711–18739. [Google Scholar] [CrossRef] [PubMed] [Green Version]
  43. Mira de Orduña, R. Climate change associated effects on grape and wine quality and production. Food Res. Int. 2010, 43, 1844–1855. [Google Scholar] [CrossRef]
  44. Cincotta, F.; Verzera, A.; Prestia, O.; Tripodi, G.; Lechhab, W.; Sparacio, A.; Condurso, C. Influence of leaf removal on grape, wine and aroma compounds of Vitis vinifera L. cv. Merlot under Mediterranean climate. Eur. Food Res. Technol. 2021, 1–11. [Google Scholar] [CrossRef]
  45. Barceló, A.R.; Calderón, A.A.; Zapata, J.M.; Muñoz, R. The histochemical localization of anthocyanins in seeded and seedless grapes (Vitis vinifera). Sci. Hortic. 1994, 57, 265–268. [Google Scholar] [CrossRef]
  46. Buttrose, M.S.; Hale, C.R.; Kliewer, W.M. Effect of Temperature on the Composition of «Cabernet Sauvignon» Berries. Am. J. Enol. Vitic. 1971, 22, 71–75. [Google Scholar]
  47. Yamane, T.; Jeong, S.T.; Goto-Yamamoto, N.; Koshita, Y.; Kobayashi, S. Effects of Temperature on Anthocyanin Biosynthesis in Grape Berry Skins. Am. J. Enol. Vitic. 2006, 57, 54–59. [Google Scholar]
  48. He, F.; Mu, L.; Yan, G.L.; Liang, N.N.; Pan, Q.H.; Wang, J.; Reevez, M.J.; Duan, C.Q. Biosynthesis of anthocyanins and their regulation in colored grapes. Molecules 2010, 15, 9057–9091. [Google Scholar] [CrossRef] [PubMed] [Green Version]
  49. Núñez, V.; Monagas, M.; Gomez-Cordovés, M.C.; Bartolomé, B. Vitis vinifera L. cv. Graciano grapes characterized by its anthocyanin profile. Postharvest Biol. Technol. 2004, 31, 69–79. [Google Scholar] [CrossRef]
  50. Arozarena, I.; Ayestarán, B.; Cantalejo, M.; Navarro, M.; Vera, M.; Abril, I.; Casp, A. Anthocyanin composition of Tempranillo, Garnacha and Cabernet Sauvignon grapes from high-and low-quality vineyards over two years. Eur. Food Res. Technol. 2002, 214, 303–309. [Google Scholar] [CrossRef]
  51. Heinonen, M. Antioxidant activity and antimicrobial effect of berry phenolics–a Finnish perspective. Mol. Nutr. Food Res. 2007, 51, 684–691. [Google Scholar] [CrossRef] [PubMed]
Figure 1. Concentration development of main organic acids (tartaric acid + malic acid) in ‘Tintilla de Rota’ and ‘Graciano’ (n = 3) in dry weight.
Horticulturae 08 00022 g001
Figure 2. Variation of tartaric acid (a) and malic acid (b) concentration in ‘Tintilla de Rota’ and ‘Graciano’ accessions after veráison (n = 3) in dry weight. Different letters mean there are significant differences between samples (p < 0.05, two-way ANOVA, BSD test).
Horticulturae 08 00022 g002
Figure 3. Evolution of total phenolic compounds (excluding anthocyanins) in ‘Tintilla de Rota’ and ‘Graciano’ accessions (n = 3) in dry weight. Different letters mean there are significant differences between samples (p < 0.05, two-way ANOVA, BSD test).
Horticulturae 08 00022 g003
Figure 4. Evolution of total anthocyanin concentration quantified in ‘Tintilla de Rota’ and ‘Graciano’ accessions (n = 3) in dry weight. Different letters mean there are significant differences between samples (p < 0.05, two-way ANOVA, BSD test).
Horticulturae 08 00022 g004
Figure 5. Principal components analysis in ‘Tintilla de Rota’ and ‘Graciano’ accessions during ripening period.
Horticulturae 08 00022 g005
Table 1. Analytical results for sugars (glucose and fructose, in mg/g dry weight) during ripening period (days after veráison).
AccessionParameterDay 0Day 5Day 10Day 15Day 20
Tintilla de RotaGlucose38.50 ± 0.36 a38.97 ± 1.17 a38.55 ± 0.48 a39.14 ± 0.42 a38.05 ± 1.84 a
Fructose36.10 ± 1.40 a37.95 ± 1.42 a37.40 ± 0.76 a38.30 ± 1.04 a37.68 ± 4.29 a
Total74.59 ± 1.75 a76.92 ± 2.54 a75.95 ± 1.05 a77.44 ± 1.24 a75.72 ± 6.12 a
GracianoGlucose38.46 ± 0.43 a37.96 ± 1.05 a38.37 ± 0.81 a38.04 ± 0.77 a37.96 ± 1.72 a
Fructose36.33 ± 0.56 a37.44 ± 1.25 a40.13 ± 0.44 a39.72 ± 1.69 a40.18 ± 2.25 a
Total74.79 ± 0.85 a75.40 ± 2.31 a78.49 ± 0.96 a77.77 ± 2.42 a78.14 ± 3.95 a
(n = 3). If different letters are in superscript, it means there are significant differences between samples in each row (p < 0.05, two-way ANOVA, BSD test).
Table 2. Phenolic compound (mg/g dry weight) (including anthocyanins) development in Tintilla de Rota and Graciano accessions during the ripening period.
ParameterAccessionsDay 0Day 5Day 10Day 15Day 20
CaftaricTintilla de Rota0.010 ± 0.003 a0.026 ± 0.001 a0.021 ± 0.002 a0.012 ± 0.000 a0.077 ± 0.009 b
Graciano0.140 ± 0.002 a0.045 ± 0.003 b0.058 ± 0.001 c0.081 ± 0.004 a0.135 ± 0.009 a
CatechinTintilla de Rota0.022 ± 0.008 a0.009 ± 0.016 a0.000 ± 0.000 a0.010 ± 0.010 a0.008 ± 0.014 a
Gracianondndndnd0.040 ± 0.056
EpicatechinTintilla de Rota0.173 ± 0.044 a0.140 ± 0.058 a0.079 ± 0.027 b0.099 ± 0.057 c0.121 ± 0.020 a
Graciano0.181 ± 0.049 a0.146 ± 0.061 a0.096 ± 0.060 b0.118 ± 0.046 b0.152 ± 0.033 a
Epicatechin gallateTintilla de Rota0.047 ± 0.003 a0.027 ± 0.004 a0.023 ± 0.008 a0.019 ± 0.015 a0.032 ± 0.003 a
Graciano0.036 ± 0.000 a0.025 ± 0.011 a0.018 ± 0.003 a0.045 ± 0.019 a0.029 ± 0.041 a
Q-3-galTintilla de Rota0.033 ± 0.004 a0.026 ± 0.002 a0.013 ± 0.001 a0.014 ± 0.002 a0.006 ± 0.001 a
Graciano0.092 ± 0.006 a0.068 ± 0.012 a0.072 ± 0.004 a0.063 ± 0.004 a0.043 ± 0.000 b
RutinTintilla de Rota0.017 ± 0.003 a0.018 ± 0.002 a0.008 ± 0.002 a0.013 ± 0.001 a0.004 ± 0.001 a
Graciano0.049 ± 0.002 a0.026 ± 0.002 a0.033 ± 0.001 a0.024 ± 0.001 a0.029 ± 0.004 a
Q-3-rahmTintilla de Rota0.013 ± 0.001 a0.010 ± 0.000 a0.016 ± 0.001 a0.018 ± 0.000 a0.021 ± 0.001 a
Graciano0.011 ± 0.002 a0.007 ± 0.002 a0.019 ± 0.001 a0.020 ± 0.001 a0.019 ± 0.001 a
KaempferolTintilla de Rota1.469 ± 0.013 a1.451 ± 0.001 a1.449 ± 0.001 a1.454 ± 0.003 a1.452 ± 0.004 a
Graciano1.471 ± 0.000 a1.467 ± 0.001 a1.480 ± 0.004 a1.490 ± 0.011 a1.480 ± 0.003 a
QuercetinTintilla de Rota0.137 ± 0.010 a0.129 ± 0.004 a0.129 ± 0.003 a0.132 ± 0.003 a0.136 ± 0.006 a
Graciano0.146 ± 0.001 a0.144 ± 0.004 a0.155 ± 0.002 a0.159 ± 0.011 a0.177 ± 0.004 a
Del3GluTintilla de Rota0.310 ± 0.027 a0.204 ± 0.020 b0.176 ± 0.016 b0.161 ± 0.019 b0.177 ± 0.011 b
Graciano0.206 ± 0.009 a,b0.179 ± 0.011 a0.193 ± 0.007 a,b0.249 ± 0.009 b,c0.215 ± 0.032 a,b
Cy3GluTintilla de Rota0.034 ± 0.006 a0.025 ± 0.003 a0.023 ± 0.002 a0.025 ± 0.001 a0.039 ± 0.005 a
Graciano0.016 ± 0.001 a0.017 ± 0.002 a0.017 ± 0.001 a0.024 ± 0.001 a0.060 ± 0.009 a
Pet3GluTintilla de Rota0.363 ± 0.025 a0.249 ± 0.029 b0.227 ± 0.012 b0.208 ± 0.020 b0.220 ± 0.010 b
Graciano0.253 ± 0.009 a,b0.224 ± 0.013 a0.253 ± 0.001 a,b0.300 ± 0.011 b,c0.262 ± 0.038 a,b
Peo3GluTintilla de Rota0.468 ± 0.028 a0.466 ± 0.054 a0.511 ± 0.040 a,b0.560 ± 0.049 b0.715 ± 0.031 c
Graciano0.293 ± 0.013a0.363 ± 0.016 b,c0.383 ± 0.031 c0.503 ± 0.007 d0.936 ± 0.015 e
Mal3GluTintilla de Rota4.494 ± 0.030 a3.236 ± 0.026 b,e3.132 ± 0.014 c3.055 ± 0.030 d3.255 ± 0.138 e
Graciano3.532 ± 0.142 a3.315 ± 0.169 b3.884 ± 0.056 c,e4.571 ± 0.092 d3.836 ± 0.051 e
Del36AcGTintilla de Rota0.032 ± 0.003 a0.022 ± 0.002 a0.018 ± 0.001 a0.017 ± 0.002 a0.018 ± 0.002 a
Graciano0.011 ± 0.000 a0.012 ± 0.000 a0.013 ± 0.001 a0.015 ± 0.001 a0.017 ± 0.002 a
Cy36AcGTintilla de Rota0.020 ± 0.005 a0.009 ± 0.001 a0.009 ± 0.000 a0.011 ± 0.002 a0.010 ± 0.000 a
Graciano0.006 ± 0.000 a0.007 ± 0.001 a0.006 ± 0.001 a0.011 ± 0.002 a0.011 ± 0.002 a
Pet36AcGTintilla de Rota0.036 ± 0.003 a0.023 ± 0.002 a0.020 ± 0.002 a0.017 ± 0.002 a0.016 ± 0.000 a
Graciano0.015 ± 0.000 a0.015 ± 0.001 a0.014 ± 0.001 a0.015 ± 0.001 a0.017 ± 0.002 a
Peo36AcGTintilla de Rota0.720 ± 0.046 a0.532 ± 0.034 b,c,d0.489 ± 0.030 c,e0.494 ± 0.006 d,e0.470 ± 0.019 e,f
Graciano0.416 ± 0.033 a0.430 ± 0.019 a,c,e0.483 ± 0.007 c,d0.519 ± 0.012 d0.480 ± 0.007 d,e
Mal36AcGTintilla de Rota0.008 ± 0.013 a0.001 ± 0.000 a0.001 ± 0.000 a0.001 ± 0.000 a0.001 ± 0.000 a
Graciano0.009 ± 0.007 a0.010 ± 0.006 a0.010 ± 0.011 a0.010 ± 0.001 a0.007 ± 0.005 a
Cy36CuGTintilla de Rota0.019 ± 0.017 a0.021 ± 0.004 a0.022 ± 0.019 a0.016 ± 0.023 a0.001 ± 0.000 a
Graciano0.001 ± 0.000 a0.011 ± 0.002 a0.023 ± 0.004 a0.004 ± 0.003 a0.015 ± 0.002 a
Pet36CuGTintilla de Rota0.015 ± 0.020 a0.014 ± 0.002 a0.009 ± 0.007 a0.009 ± 0.012 a0.001 ± 0.000 a
Graciano0.028 ± 0.006 a0.020 ± 0.007 a0.018 ± 0.008 a0.024 ± 0.003 a0.018 ± 0.005 a
Peo36CuGTintilla de Rota0.027 ± 0.044 a0.035 ± 0.007 a0.025 ± 0.021 a0.030 ± 0.005 a0.001 ± 0.000 a
Graciano0.039 ± 0.007 a0.036 ± 0.012 a0.032 ± 0.014 a0.049 ± 0.002 a0.072 ± 0.030 a
T.non-anthocyanin phenolsTintilla de Rota1.921 ± 0.043 a1.835 ± 0.071 a1.739 ± 0.028 a1.772 ± 0.078 a1.858 ± 0.015 a
Graciano2.127 ± 0.060 a1.929 ± 0.087 a1.931 ± 0.058 a2.001 ± 0.067 a2.105 ± 0.006 a
T. AnthocyaninTintilla de Rota6.546 ± 0.264 a4.836 ± 0.185 b4.663 ± 0.165 b4.604 ± 0.171 b4.926 ± 0.218 b
Graciano4.826 ± 0.230 a4.638 ± 0.260 a5.330 ± 0.144 b6.296 ± 0.144 c5.944 ± 0.200 c
Q-3-gal: Quercetin 3-galactoside, Q-3-rahm: Quercetin 3-rhamnoside, Del3Glu: Delphinidin 3-O-glycoside, Cy3Glu: Cyanidin 3-O-glycoside, Pet3Glu: Petunidin 3-O-glycoside, Peo3Glu: Peonidin 3-O-glycoside, Mal3Glu: Malvidin 3-O-glycoside, Del36AcG: Delphinidin 3-O-(6″-acetyl)-glucoside, Cy36AcG: Cyanidin 3-O-(6″-acetyl)-glucoside, Pet36AcG: Petunidin 3-O-(6″-acetyl)-glucoside, Peo36AcG: Peonidin 3-O-(6″-acetyl)-glucoside, Mal36AcG: Malvidin 3-O-(6″-acetyl)-glucoside, Cy36CuG: Cyanidin 3-O-(6″-p-coumaryl)-glucoside, Pet36CuG: Petunidin 3-O-(6″-p-coumaroyl)-glucoside, Peo36CuG: Peonidin 3-O-(6″-p-coumaroyl)-glucoside. Different letters in superscript mean significant differences between samples in each row (p < 0.05, two-way ANOVA, BSD test). nd: not detected.
Table 3. Principal component loadings of phenolic compounds, including anthocyanins, in ‘Tintilla de Rota’ and ‘Graciano’ accessions.
CompoundsF1F2F3
Caftaric0.896−0.1190.153
Catechin0.045−0.8020.276
Epicatechin0.3660.1840.582
Epicatechin gallate0.110−0.0070.795
Quercetin 3-galactoside0.6980.6760.183
Rutin0.7130.05370.207
Quercetin 3-rhamnoside−0.024−0.458−0.655
Kaempferol−0.0550.294−0.557
Quercetin0.6360.120−0.561
Delphinidin 3-O-glycoside−0.2650.3080.905
Cyanidin 3-O-glycoside0.079−0.971−0.006
Petunidin 3-O-glycoside−0.3380.5270.746
Peonidin 3-O-glycoside0.014−0.910−0.364
Malvidin 3-O-glycoside0.3720.8410.130
Delphinidin 3-O-(6″-acetyl)-glucoside−0.890−0.2620.291
Cyanidin 3-O-(6″-acetyl)-glucoside−0.700−0.4540.369
Petunidin 3-O-(6″-acetyl)-glucoside−0.843-0.0280.423
Peonidin 3-O-(6″-acetyl)-glucoside−0.9420.0590.040
Malvidin 3-O-(6″-acetyl)-glucoside0.6150.5640.275
Cyanidin 3-O-(6″-p-coumaryl)-glucoside−0.5740.155−0.370
Petunidin 3-O-(6″-p-coumaroyl)-glucoside0.6230.6460.301
Peonidin 3-O-(6″-p-coumaroyl)-glucoside0.5850.0230.076
Rotated component matrix loadings using varimax with Kaiser normalization.
Publisher’s Note: MDPI stays neutral with regard to jurisdictional claims in published maps and institutional affiliations.

