Article

Determination of Specific Parameters for Early Detection of Botrytis cinerea in Lettuce

by
Viktorija Vaštakaitė-Kairienė
*,
Neringa Rasiukevičiūtė
,
Lina Dėnė
,
Simona Chrapačienė
and
Alma Valiuškaitė
Lithuanian Research Centre for Agriculture and Forestry, Institute of Horticulture, Kauno 30, LT-54333 Babtai, Lithuania
*
Author to whom correspondence should be addressed.
Horticulturae 2022, 8(1), 23; https://doi.org/10.3390/horticulturae8010023
Submission received: 26 November 2021 / Revised: 14 December 2021 / Accepted: 22 December 2021 / Published: 24 December 2021
(This article belongs to the Special Issue Research Advances in the Physiology of Vegetable Crops)

Abstract

:
In horticulture, the demand for efficient farming processes and food industries increases rapidly. Plant diseases cause severe crop production and economic losses. Therefore, early detection and identification of the diseases in plants are critical. This study aimed to determine the specific parameters for early detection of Botrytis cinerea in lettuce. The lettuce “Little Gem” was inoculated with B. cinerea isolate spore suspension and disc to evaluate the plant response to inner and outer infection, respectively. The non-destructive measurements of leaf spectral reflectance indices and biochemical compounds (phenols, proteins, DPPH, FRAP, chlorophyll, and carotenoids) were used to evaluate the plant physiological response to inoculation with B. cinerea after 12, 18, 36, 60, and 84 h. Our data showed that lettuce responded differently to inner and outer inoculation with B. cinerea. Therefore, the findings of this study allow for the inoculation method to be chosen to determine the early plant response to infection with B. cinerea according to specific leaf spectral reflectance indexes and phytochemicals in further research.

1. Introduction

Nowadays, the demand for efficient farming processes in the horticulture and food industries increases rapidly. The state of horticulture depends on the products’ quality and quantity. Fungal diseases damage various parts of plants (for example, stems, leaves, inflorescences, and fruits), resulting in lower yields and final crop production, which leads to economic loss. Therefore, early detection, prevention, and management of plant diseases is crucial [1].
The grey mould caused by Botrytis cinerea damages many crop hosts (over 200 species) worldwide [2,3]. This fungus mainly enters the plant via direct penetration or natural openings or wounds [4,5]. B. cinerea is also a significant threat to greenhouse-grown plants, where disease control is usually challenging and expensive [6]. The soil substrate used for plants might be the primary source of fungi in the greenhouse. In addition, the pathogens can be brought into the greenhouse in water. However, the enormous numbers of Botrytis spores can be carried from outdoor plants and spread rapidly by air, infecting greenhouse crops. The chemical fungicides are used in almost all cases for disease prevention in the greenhouse. However, these are often used only after symptoms are visible, at which point a substantial epidemic may already be well underway, requiring multiple subsequent foliar sprays at regular intervals [7]. Therefore, the ability to detect consistently and quantitatively the first signs of Botrytis and monitor disease progression in a leaf can help to prevent still-intact parts of the crop production and reduce the usage of chemicals.
Several studies have addressed B. cinerea diagnosis and detection in crops. Traditionally, fungal disease-causing pathogens have been detected by visual examination of symptoms, such as blight, rotting, spots, and wilting by using available guidelines and standards for assessment [8]. Immunoassay-based diagnostic and molecular quantification based on a quantitative polymerase chain reaction (PCR) of quantifying fungal conidiospores offers increased throughput. However, these methods are destructive, require chemical and analytical steps during the analysis, and cannot be done rapidly. Therefore, the same individual plant cannot be monitored across time [9]. Additional detection methods include plating and culturing plant pathogens for identification using microscopy techniques, but again, these approaches are challenging to scale for high-throughput, high-resolution temporal analysis [10].
Plant disease symptoms are evident in various parts of plants. However, plant leaves are mainly used to detect infection. Plant leaves initiate the process of photosynthesis through which plants get their food. Diseases affect the leaves of plants so they fail to provide proper nourishment of the plant, leading to bad health or death [1]. Therefore, early diagnosis and detection of the disease would allow more effective crop management practices to prevent outbreaks in field or greenhouse settings. Furthermore, fungal infections can alter leaf morphology and light reflectance, distinguished using leaf spectral indices [11]. Again, having a rapid, simple, non-invasive way to detect the extent of Botrytis disease is essential for plant pathologists interested in quantifying infection rates [3].
Lettuce (Lactuca sativa L.) is one of the most important leafy vegetables worldwide, as it is considered a rich source of vitamins (A, C, E, K), polyphenols, and antioxidants compounds [12]. Grey mould caused by the fungus B. cinerea has been considered as a major disease in greenhouse-grown lettuce [13].
This study aimed to find out the specific parameters which could be used for the early detection of B. cinerea in lettuce. We hypothesised that non-destructive measurements could be used instead of biochemical analysis for the early detection of B. cinerea in lettuce. First, the two inculcation methods were used to evaluate the plant response to inner and outer infection with B. cinerea at different times after the inoculation. Then we measured the leaf spectral reflectance indices by non-destructive meters and determined phytochemicals (phenols, proteins, chlorophylls, carotenoids, and antiradical capacity) in lettuce. In the end, we compared the results of non-destructive and biochemical measurements to find out which of those parameters can potentially be used for early detection of B. cinerea in lettuce (1), and if the non-destructive measurements can be conditionally equated to biochemical analysis (2).

2. Materials and Methods

2.1. Plant Material and Growth Conditions

The experiments were performed at Lithuanian Research Centre for Agriculture and Forestry, Institute of Horticulture, in the greenhouse in July–September 2020. The lettuce “Little Gem” (Green vegetable seeds, United Kingdom) seeds were sown in the plastic trays (50 holes, 54 × 28 cm) with peat substrate (Terraerden, Latvia) with NPK (100–160; 110–180; 120–200 mg L−1) with microelements Mn, Cu, Mo, B, Zn and Fe (pH H2O 5.5–6.5; electrical conductivity (EC) ms cm−1 < 1.10). During vegetation experiments, the average day and night temperatures were 24 ± 5 °C/21 ± 5 °C, and the relative air humidity was 75 ± 5%. On the 10th day after sowing, the seedlings were transferred to plastic pots (9 × 9 × 10 cm) and grown for an additional 17 days. Plants were watered daily with tap water. The experiments were conducted twice.

2.2. Artificial Infection In Vivo

The artificial inoculation of lettuce leaves with B. cinerea isolate was done in two ways: (1) inoculation with a pathogen disc (Infected-1), depicting the entry of the pathogen from the outside; and (2) inoculation with a spore suspension (Infected-2), depicting the entry of the pathogen from the inside.
The single spore isolates of B. cinerea from infected strawberry fruit (LT11B_BRA_189) was obtained from LAMMC IH Laboratory of plant protection isolate collection. The isolate was morphologically identified as B. cinerea and verified by species-specific PCR, according to Rasiukevičiūtė et al. (2018) [14]. The isolate was maintained in Petri dishes with potato dextrose agar (PDA) at 22 ± 2 °C for seven days.
Infected-1. The centre of lettuce leaves artificially inoculated with 7 mm B. cinerea mycelial discs cut from the periphery of 7-day-old cultures.
Infected-2. The spore suspension of 7 day-old B. cinerea was prepared by adding 1 mL of sterile sdeionised water to each plate. The spore’s concentration was counted using a Neubauer hemocytometer counting chamber. The spore concentration adjusted to 1 × 10⁴ spores mL−1. 20 µL of the suspension was applied on the surface of lettuce near the lettuce leaf’s central vein.
Non-infected. The control plants were not inoculated with B. cinerea.
The changes in non-destructive measurements of leaf spectral reflectance indices and biochemical compounds of non-infected and infected lettuces were determined after 12, 18, 36, 60, and 84 h. The same plants used for non-destructive measurements were analysed by biochemical analysis. Therefore, the different plants were evaluated at each time after the inoculation.

2.3. Non-Destructive Measurements of Leaf Spectral Indexes

The non-destructive measurements were done by putting the meter where it could avoid the main vein of the leaf. Ten different plants from each group (Non-infected, Infected-1 and Infected-2) were measured at each time of assessment after inoculation with B. cinerea.
The leaf spectral reflectance indexes were measured using a leaf spectrometer (CI-710, CID Bioscience, USA) from 9:00 to 12:00 a.m. The reflection spectra obtained were used to calculate the photochemical reflectance index (PRI), which shows changes in the xanthophyll cycle, using the following formula:
P R I = R 531 R 570 R 531 + R 570 .
The snormalised difference vegetation index (NDVI), which shows changes in biomass content, was calculated by:
N D V I = R 800 R 680 R 800 + R 680 .
The plant senescence reflectance index (PSRI), which shows changes in dry or senescent carbon, was calculated by:
P S R I = R 680 R 500 R 750 .
The carotenoid reflectance index (CRI), which shows changes in the carotenoids-to-chlorophyll ratio, was calculated by:
C R I = 1 R 510 1 R 700 ,
where R800, R750, R700, R680, R570, R531, R510 represent the leaf reflectance integrated over 10 nm wavelenght centered on 800, 750, 680, 570, 531, and 510 nm, respectively.
The relative chlorophyll (CHL), flavonols (FLA) contents, and nitrogen balance index (NBI) was measured using the non-destructive meter Dualex (Force-A, France).

2.4. Biochemical Analysis and Water Content Measurements

The conjugated biological samples of the infected leaves from three randomly selected control and inoculated with B. cinerea lettuce were used for the biochemical analysis. Fresh plant tissues were immediately frozen with 10 mL of liquid nitrogen (N2) and stored in an ultra-low freezer until the analysis.
Each plant shoot FW (g) and DW (g) was measured using an electronic analytical balance (Mettler Toledo, Columbus, OH, USA). Shoots were dried in an oven (Venticell-BMT, Czech Republic) at 70 °C for 48 h before DW measurements. Water content was calculated as the fraction of the difference between shoot FW and DW in FW and used to re-calculate biochemical compound contents in the DW of plants.

2.4.1. Total Phenolic Content

The total phenolic content of lettuce was determined spectrophotometrically [15] with modifications. 0.5 g of frozen lettuce tissue was homogenised in a ceramic mortar with 5 mL of 80% ice-cold methanol and transferred to a 15 mL polypropylene conical centrifuge tube (Labbox Labware S.L., Barcelona, Spain). The extract was incubated at 4 °C for 24 h. Samples were centrifuged (Hermle Z 300 K, Hermle Labortechnik, Wehingen, Germany) at a relative centrifugal force of 4000 rpm min−1 for 10 min at room temperature. The supernatant was filtered through a 70 mm qualitative filter paper (Frisenette ApS, Knebel, Denmark). First, 100 µL of the filtrate was diluted with 200 µL of 10% (v/v) Folin & Ciocalteu′s phenol reagent and vortexed thoroughly. Then, 800 µL of 700 mM of sodium carbonate was added. After 20 min, the absorbance of the samples was measured at 765 nm using a spectrophotometer CamSpec M501 (Spectronic CamSpec Ltd., Garforth, UK). The total phenolic content was calculated using a standard curve of gallic acid (R2 > 0.95). Data are presented as the mean of three analytical measurements of total phenolic content (in mg g−1) on a dry basis of the lettuce.

2.4.2. Total Protein Content

Total protein content was determined according to the spectrophotometric method [16]. Frozen fresh plant material was ground with N2 and extracted with 50 mM phosphate buffer containing 1 mM ethylenediaminetetraacetic acid (EDTA), 10 mM 2-mercaptoethanol, 100 μM phenylmethylsulfonyl fluoride (PMSF). The extract was centrifuged for 10 min at 4000 rpm min−1 (Hermle Z 300 K, Hermle Labortechnik, Wehingen, Germany), the supernatant was mixed with diluted (1:5) Bradford reagent. Absorbance was read at 595 nm on the CamSpec M501 spectrophotometer (Spectronic CamSpec Ltd., Garforth, UK). The bovine serum albumin calibration curve determined total protein contents. Data are presented as the mean of three analytical measurements (in mg g−1) on a dry basis of the lettuce.

2.4.3. Measurements of Antioxidant Capacity

For the ferric-reducing antioxidant power (FRAP) assay, the working reagent was prepared by mixing acetate buffer (300 mM, pH 3.6), a solution of 10 mM 2,4,6-tripyridyl-s-triazine (TPTZ) in 40 mM hydrochloric acid, and 20 mM iron (III) chloride hexahydrate (FeCl3 × 6H2O) at 10:1:1 (v/v/v) [17]. A total of 20 µL of the sample were mixed with 3 mL of working solution and incubated in the dark for 30 min. Then, the absorbance at 593 nm was read. The antioxidant power was expressed as Fe2+ antioxidant capacity (Fe2+ μmol g−1 of dry plant weight).
The antiradical activity was evaluated according to the spectrophotometric 2,2-Diphenyl-1-picrylhydrazyl (DPPH) scavenging activity method [18,19] with modifications. A total of 100 µL of 80% methanol extracts used for the total phenolic content assay were diluted with 1 mL of 60 µM DPPH solution. The absorbance was measured after 16 min using the CamSpec M501 spectrophotometer at 515 nm. The ability of plant extract to scavenge DPPH free radicals was calculated using the DPPH solution as a blank. Data are presented as the mean of three analytical samples to scavenge DPPH free radicals (in µmol g−1) on a dry basis of the plant.

2.4.4. Determination of Chlorophylls and Carotenoids by Chromatographic Method

Contents of chlorophylls (a, b) and carotenoids (neoxanthin, violaxanthin, lutein and zeaxanthin, α- and β-carotenes) were evaluated according to the methods of Edelenbos (2001) using high-performance liquid chromatography (HPLC) on a Chromegabond C30 column (3 µm particle size, 15 × 2.1 mm) (ES Industries, West Berlin, NJ, USA) [20]. Carotenoids were extracted using 80% acetone (500 mg of sample grounded with 10 mL liquid N2), centrifuged (10 min, 4000 rpm min−1), and filtrated through a 13 mm and 0.22 µm nylon syringe filter (BGB Analytik AG, Böckten, Switzerland). The HPLC 10A system (Shimadzu, Kyoto, Japan) equipped with a diode array (SPD-M 10A VP) detector was used for analysis. Peaks were detected at 440 nm. The mobile phase consisted of A (80% methanol, 20% water) and B (100% ethyl acetate). Gradient: 0 min; 20% B, 2.5 min; 22.5% B, 20–22.5 min; 50% B, 24–26 min; 80% B, 31–34 min; 100% B, 42–47 min; and 20% B, flow rate 1 mL min−1. The contents of chlorophylls and carotenoids in each group of lettuce were evaluated after 18, 36, 60, and 84 h after inoculation. The results are expressed as mg g−1 in the dry weight of plants.

2.5. Statistical Analysis

For linear regression analysis, data were processed using Microsoft 365 Excel software. For statistical analysis, data were processed using the XLSTAT software (Addinsoft, France), using one-way analysis of variance, ANOVA, and Tukey’s HSD test at confidence level p ≤ 0.05.

3. Results

3.1. Non-Destructive Measurements of Leaf Spectral Indexes

The moderate linear regression was found in non-infected (R2 = 0.546) and inoculated with B. cinerea disc (Infected-1) (R2 = 0.515) lettuce when the relative chlorophyll content (CHL) (Figure 1A and Table 1) increased with increasing time from inoculation. Contrary, the weak linear regression was evaluated in lettuce inoculated with B. cinerea spore suspension (Infected-2). A significant increment (about 26%) of CHL was found in lettuce inoculated with B. cinerea disc compared to non-infected plants after 18-h. However, after 84-h from inoculation, the CHL significantly decreased by 17.5% in Infected-2 compared to non-infected lettuce (Table 2).
The strong linear regression (R2 = 0.844) on relative flavonol content (FLA) was determined in Infected-1 lettuce (Figure 1B and Table 1). However, no significant differences were found in Infected-1 and Infected-2 compared to non-infected lettuce after 12 to 84 h (Table 2).
The weak linear regression was found on nitrogen balance index (NBI) of non-infected, Infected-1 and Infected-2 lettuce (R2 = 0.342; 0.08; 0.004, respectively) (Figure 1C and Table 1). In addition, no significant differences in NBI were found in comparing non-infected to infected lettuce throughout the investigation period (Table 2).
The weak linear regression was found on normalised difference vegetation index (NDVI), plant senescence reflectance index (PSRI), carotenoid reflectance index (CRI), photochemical reflectance index (PRI) in non-infected, Infected-1 and Infected-2 lettuce (Figure 2A–D and Table 3). The significantly lower (about 27%) CRI was determined in Infected-1 lettuce compared to non-infected plants after 12-h from infection. However, after 18-h from infection, the CRI of Infected-1 lettuce increased by 36%. In addition, the NDVI and PRI significantly increased (by 8 and 33%, respectively) in the same Infected-1 compared to non-infected lettuce (Table 2).

3.2. Total Phenolic Content, Total Protein Content and Antiradical Activity

The weak linear regression was found in changes of total phenolic content, the total protein content, and DPPH free radical scavenging activity of non-infected, Infected-1, and Infected-2 lettuce (Figure 3A,B,D and Table 4). However, the linear regression of ferric-reducing antioxidant power of Infected-1 and Infected-2 lettuce was moderate (R2 = 0.502; 0.586, respectively) (Figure 3C and Table 3).
Despite weak linear regression on biochemical measurements in lettuce throughout investigated time, significant differences were found on individual metabolites when infected lettuces were compared to non-infected plants (Table 5). After 12 h since infection, a significant increase by two times in total phenolic content was observed in lettuce, regardless of the infection method. Similar results were determined on ferric-reducing antioxidant power in lettuces. Contrary, the total protein content decreased in Infected-1 (1.3-fold) and Infected-2 (1.1-fold) lettuce compared to non-infected plants. However, after 18 to 60 h, the total phenolic content, DPPH free radical scavenging activity, and ferric-reducing antioxidant power significantly decreased by approximately 1.5- to 2.0-fold in Infected-1 lettuce, except for the antiradical activity of DPPH after 60 h, when compared to non-infected plants. A similar trend was observed in Infected-2 lettuce after 18 and 36 h from inoculation, except for DPPH free radical scavenging activity. However, after 84-h from infection, the total phenolic and protein contents and antiradical activity according to the DPPH and ferric-reducing antioxidant power methods increased from 1.1- to 1.9-fold in Infected-1 lettuce. No significant differences were found on phytochemicals in Infected-2 lettuce, except for total protein content, which decreased by 1.2-fold compared to non-infected plants.

3.3. Chlorophylls and Carotenoids

Weak linear regression of chlorophylls a and b, and violaxanthin was found in those non-infected and infected with B. cinerea lettuce. In addition, the weak linear regression was of changes in content of lutein and zeaxanthin, and α- with β-carotenes in infected lettuce, regardless of the inoculation method. To the contrary, the linear regression of these metabolites in non-infected lettuce throughout the investigation was moderate (R2 = 0.60). In addition, the linear regression of neoxanthin was moderate in non-infected, Infected-1, and Infected-2 lettuce (R2 = 0.57; 0.56; 0.74, respectively) (Figure 4A–F and Table 6).
The detailed analyses of chlorophylls and carotenoids showed no significant differences in chlorophyll a, violaxanthin, α- and β-carotene content in infected lettuce compared to non-infected, regardless of the infection method, throughout all the investigation periods. However, after 18 h from artificial infection, the significant increments of chlorophyll b (1.7-fold), neoxanthin (2.0-fold), lutein, and zeaxanthin (1.9-fold) were observed in Infected-1 when compared to non-infected lettuce. However, no significant differences in accumulation of these metabolites were found in infected lettuce after 36, 60, and 84 h from artificial infection (Table 7).

4. Discussion

Plants have developed complex sensory mechanisms to identify biotic invasion and overcome the detriment of growth, pre- and postharvest yield, and survival [21,22,23]. The plant responds to this fungal pathogen with transcriptional reprogramming of genes, which encode proteins involved in pathogen perception, signaling, transcription, hormonal signaling, secondary metabolic pathways and proteins with a diverse role in defence against biotic stress [23]. Therefore, the discovery of specific parameters indicating such mechanisms at an early stage when no visible disease symptoms appear would allow helping protect plants against further spread of the pathogen and reduce the usage of chemical fungicides.
Our study evaluated the early physiological response according to leaf spectral indices to two different inoculation methods of B. cinerea on a commercially important greenhouse crop—lettuce. Moreover, we determined main plant metabolites to know if the response according to the leaf spectral indices is the same as the biochemical level. The summarised results showed weak, moderate, or strong linear regression of leaf spectral indices and phytochemicals throughout the investigation period from 12 to 84 h after inoculation with B. cinerea.
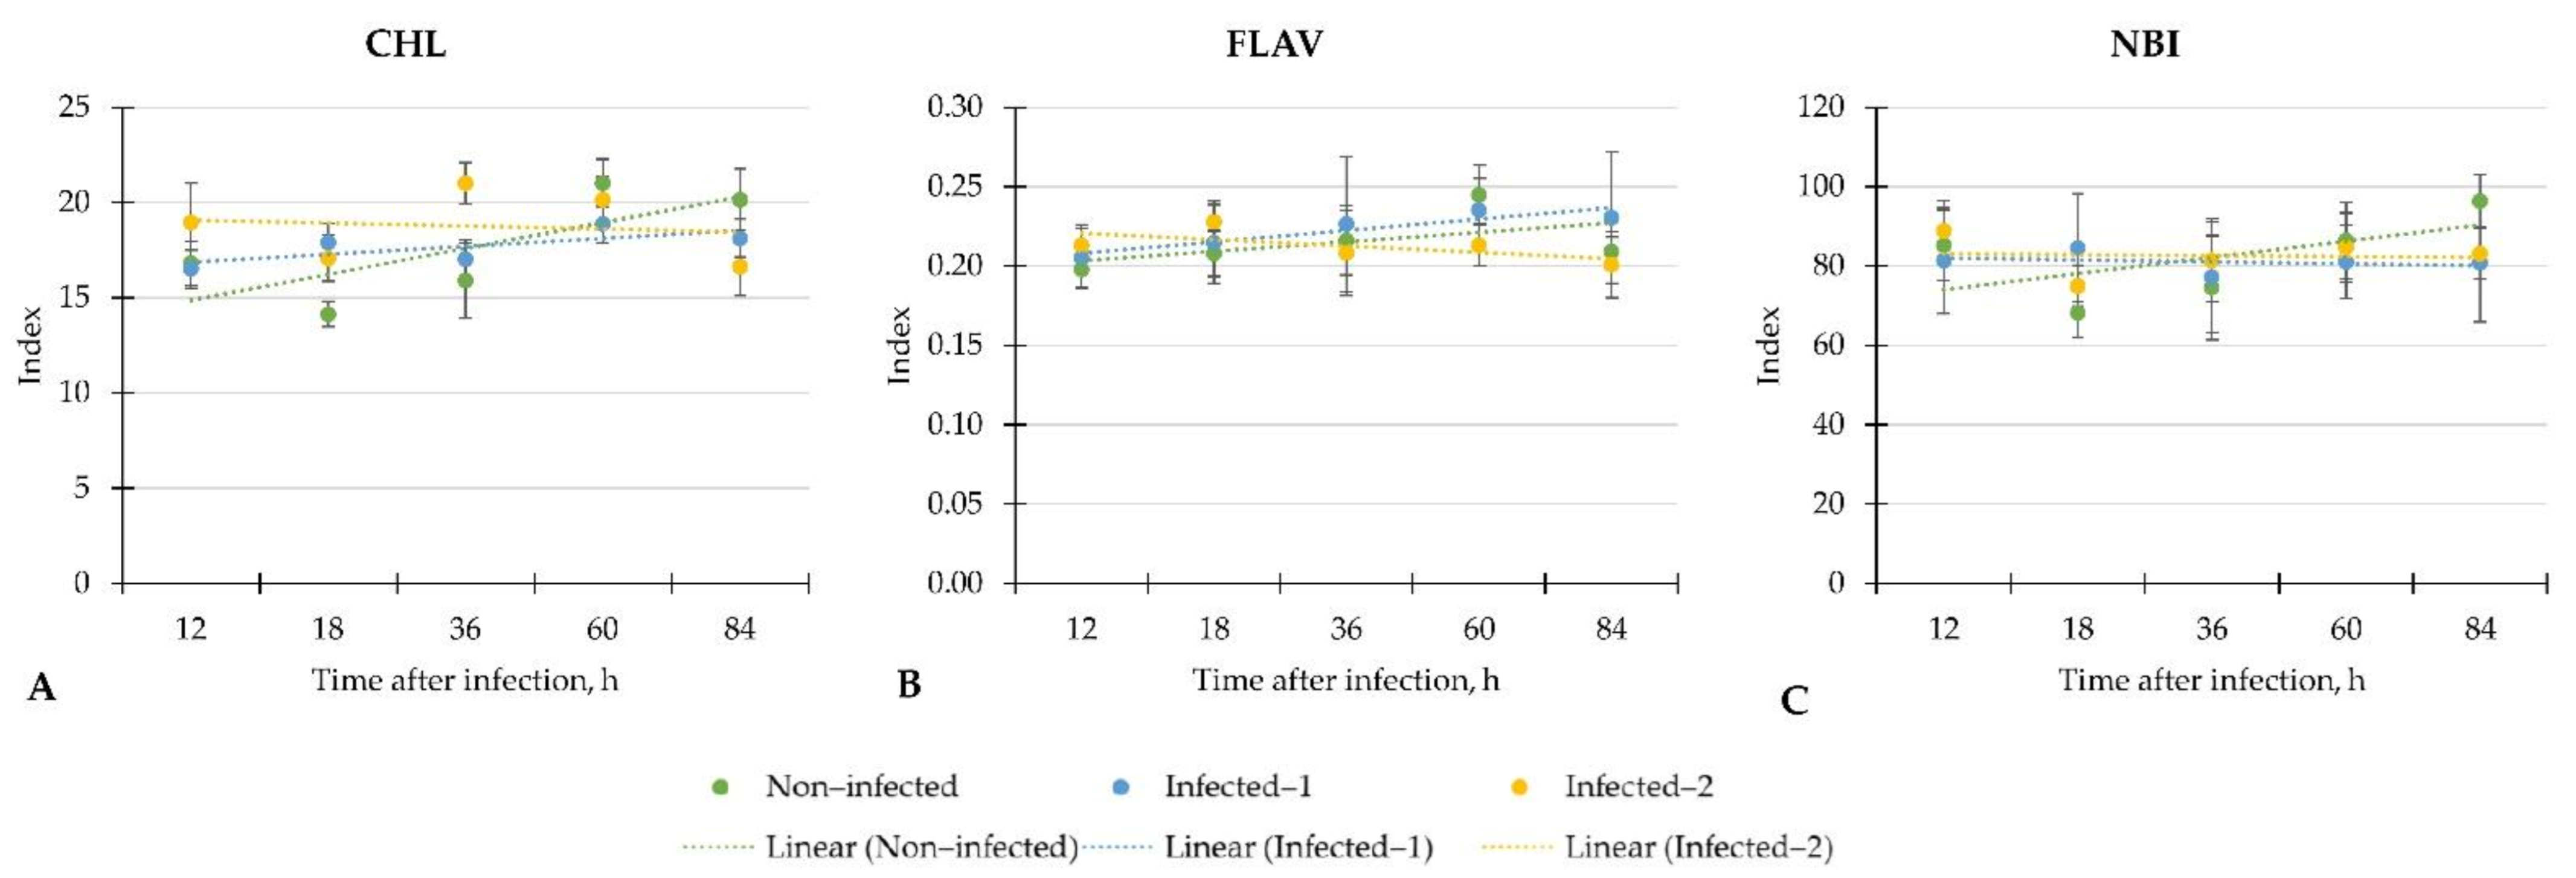
In the study, most attention was paid to the linear regression of measured indices which changed in inoculated with B. cinerea lettuce compared to non-infected plants. We found that changes depended on the inoculation method. For example, the changes of CHL in plants that were infected with pathogen spore disc were similar to non-infected plants. On the contrary, the linear regression of CHL in lettuce infected with pathogens spore suspension sealed to the central vein of the plant was weak and led to the significantly lower CHL at the end of the investigation (84 h) compared to non-infected plants. Such changes in lettuce may indicate the inconsistent plant response to inoculation with B. cinerea at different analysis times. Also, the significant increment of CHL in lettuce infected with pathogen spore disc after 18 h may be considered a plant response to the pathogen.
The strong linear regression of FLA was found in the lettuce inoculated with the pathogen spore disc. In contrast, the linear regression of FLA was similar in control and infected with spore suspension plants. However, we did not find differences in FLA in infected lettuce compared to control plants.
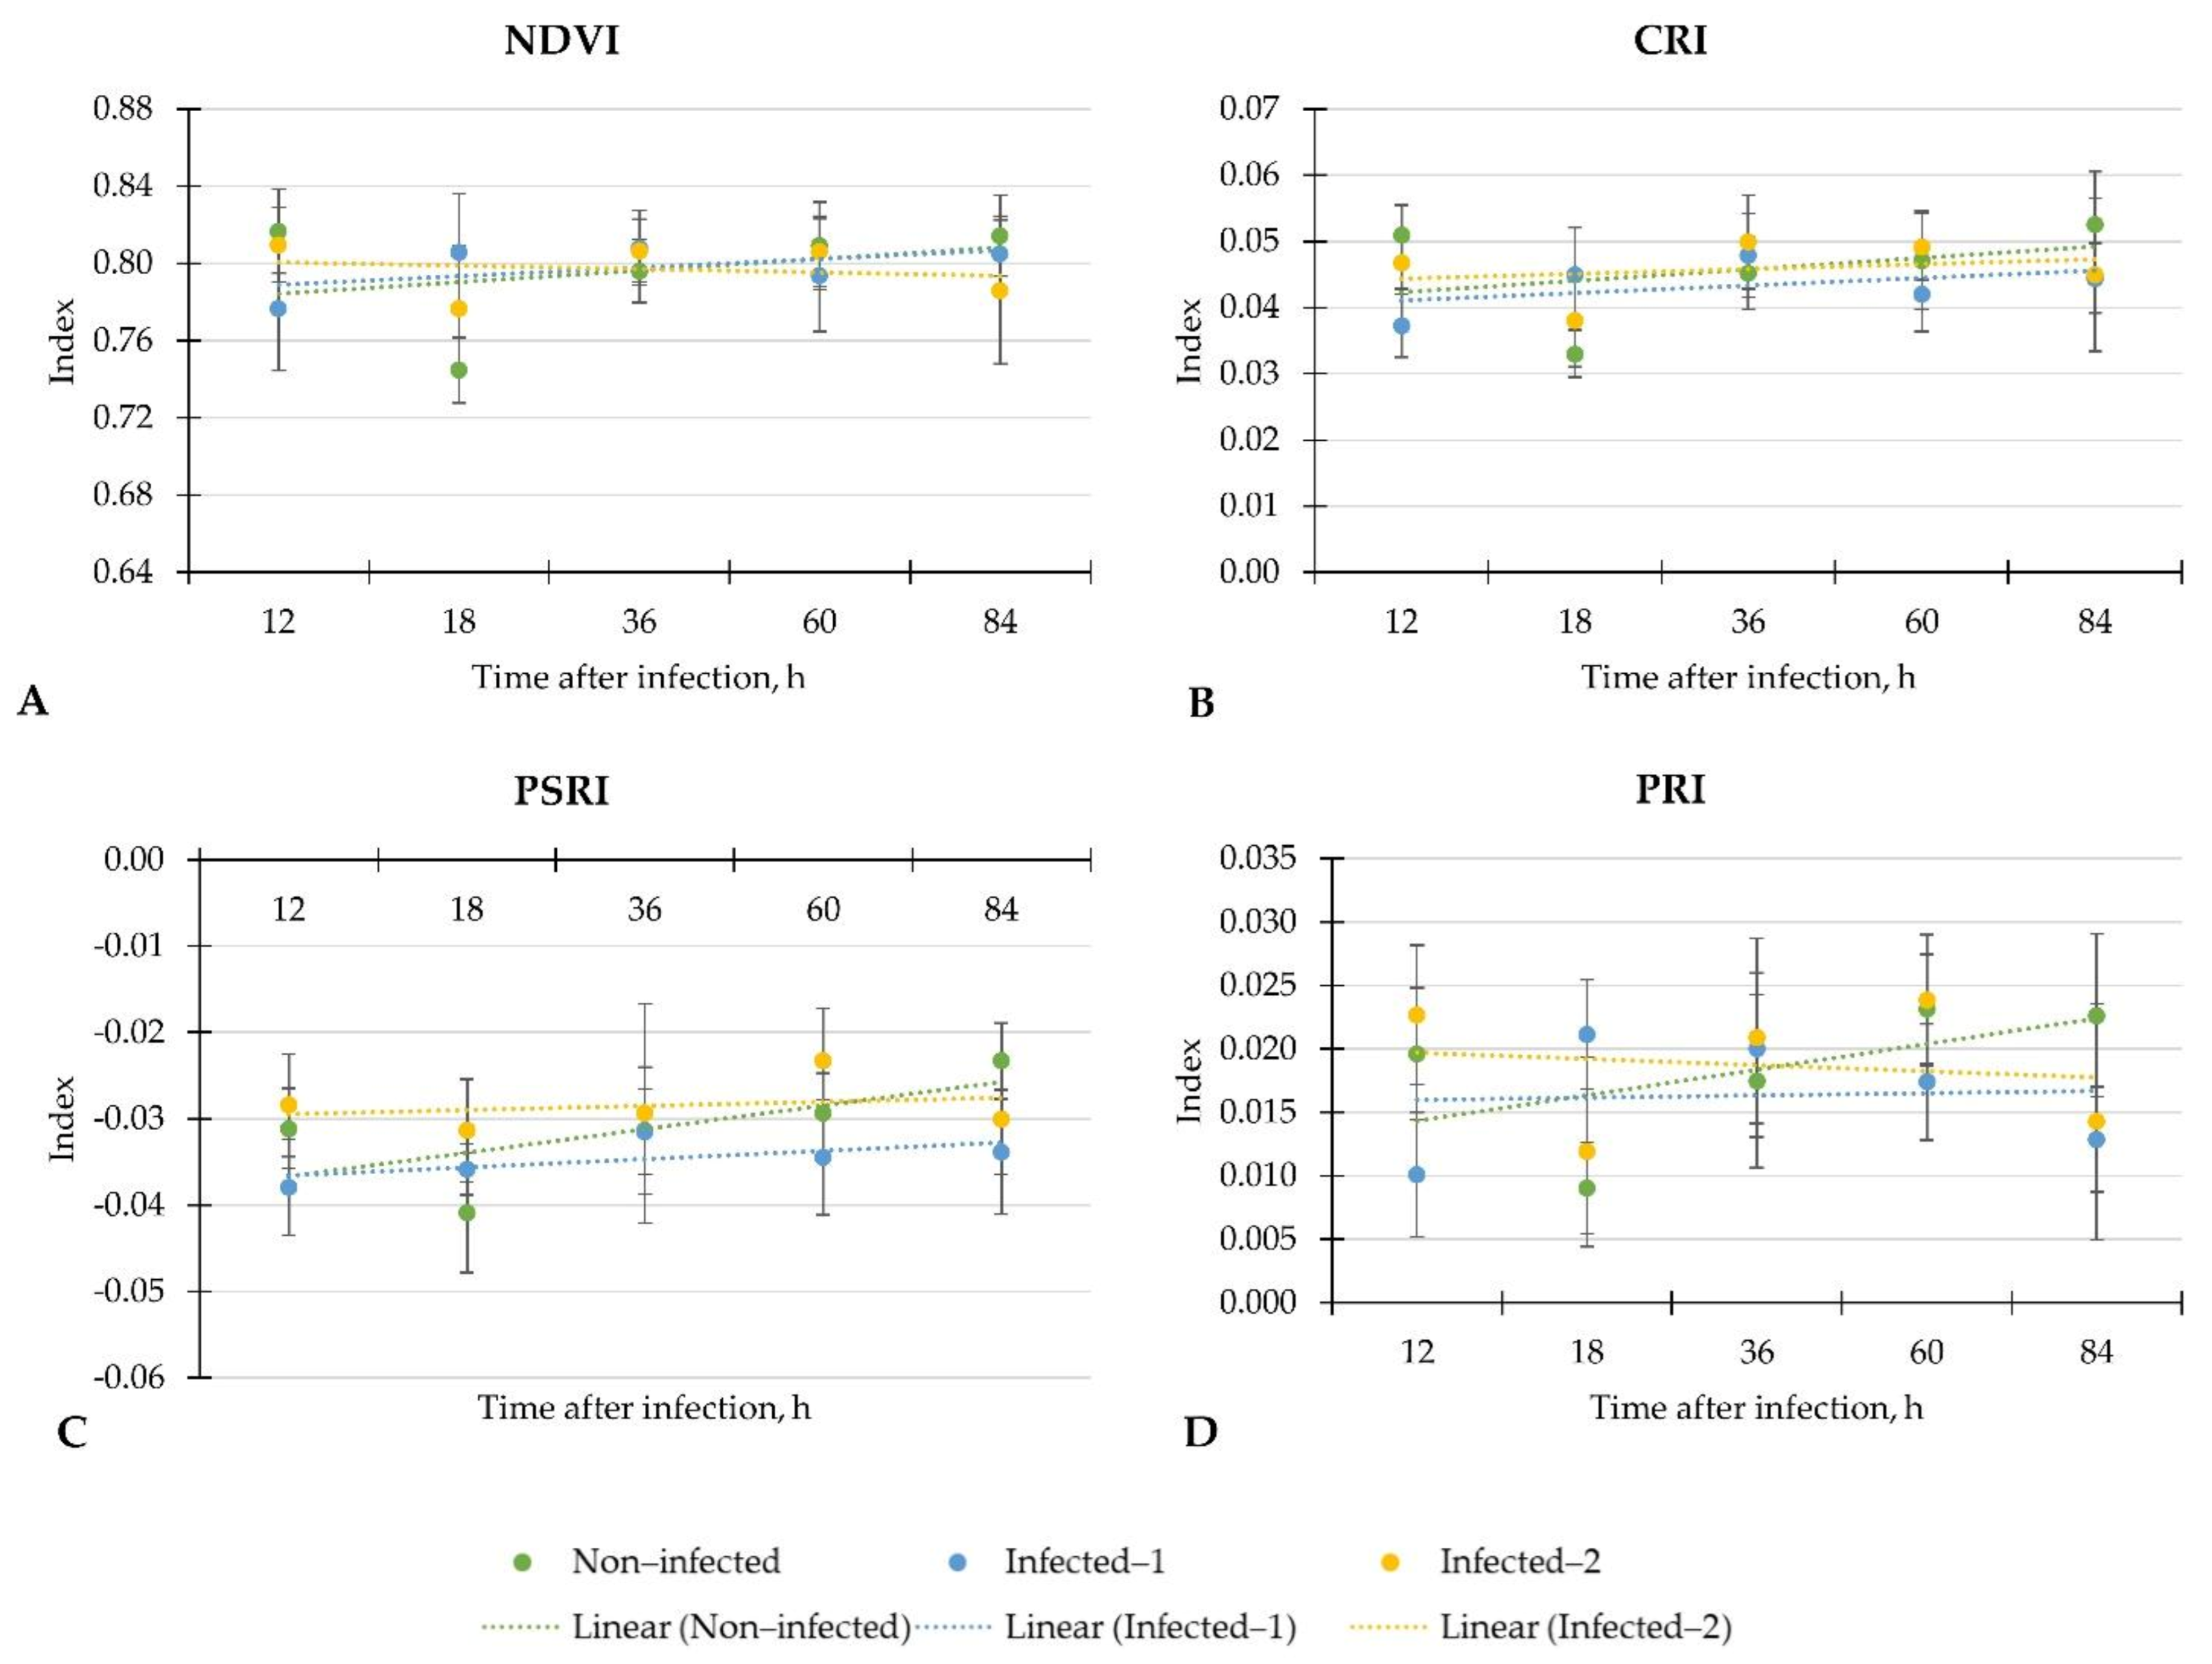
In general, the inoculation with B. cinerea did not change NBI in lettuce. Moreover, the weak regression of NBI in all investigated groups of plants showed inconsistent changes throughout the evaluation period. Similar trends were found on NDVI, PSRI, CRI, and PRI in all lettuce. However, the significant increment of CRI, NDVI and PRI in lettuce infected with pathogen spore disc compared to non-infected plants after 18 h shows the potential of these indices for early disease detection in lettuce.
Generally, the early detection of the B. cinerea infection in horticultural crops using non-destructive methods is an emerging topic. Such an evaluation method requires considering the relative position between the leaf and detector and the lighting conditions [3]. The study of Wu et al. [24] showed 85% accuracy before infection symptoms were visible in eggplant leaves when the hyperspectral visible near-infrared (VNIR) spectroradiometer to measure reflectance intensities of healthy and B. cinerea inoculated plants was used. In another study, the 552 nm and 701 nm wavelengths for detecting discolouration in lettuce leaves with over 99% accuracy were approved, but not for Botrytis fungal infection [25]. Scarboro et al. demonstrated a process for selecting optimal spectral bands integrated into a two-band multispectral (540 and 670 nm) camera imaging system and evaluating its performance for detecting B. cinerea infection on lettuce leaves to monitor disease progression producing a true positive rate of 95.25% with a false positive rate of 9.316% [3]. Such findings, as mentioned earlier, can be considered for choosing leaf spectral reflectance indices according to the wavelengths used in the formulas of their calculation.
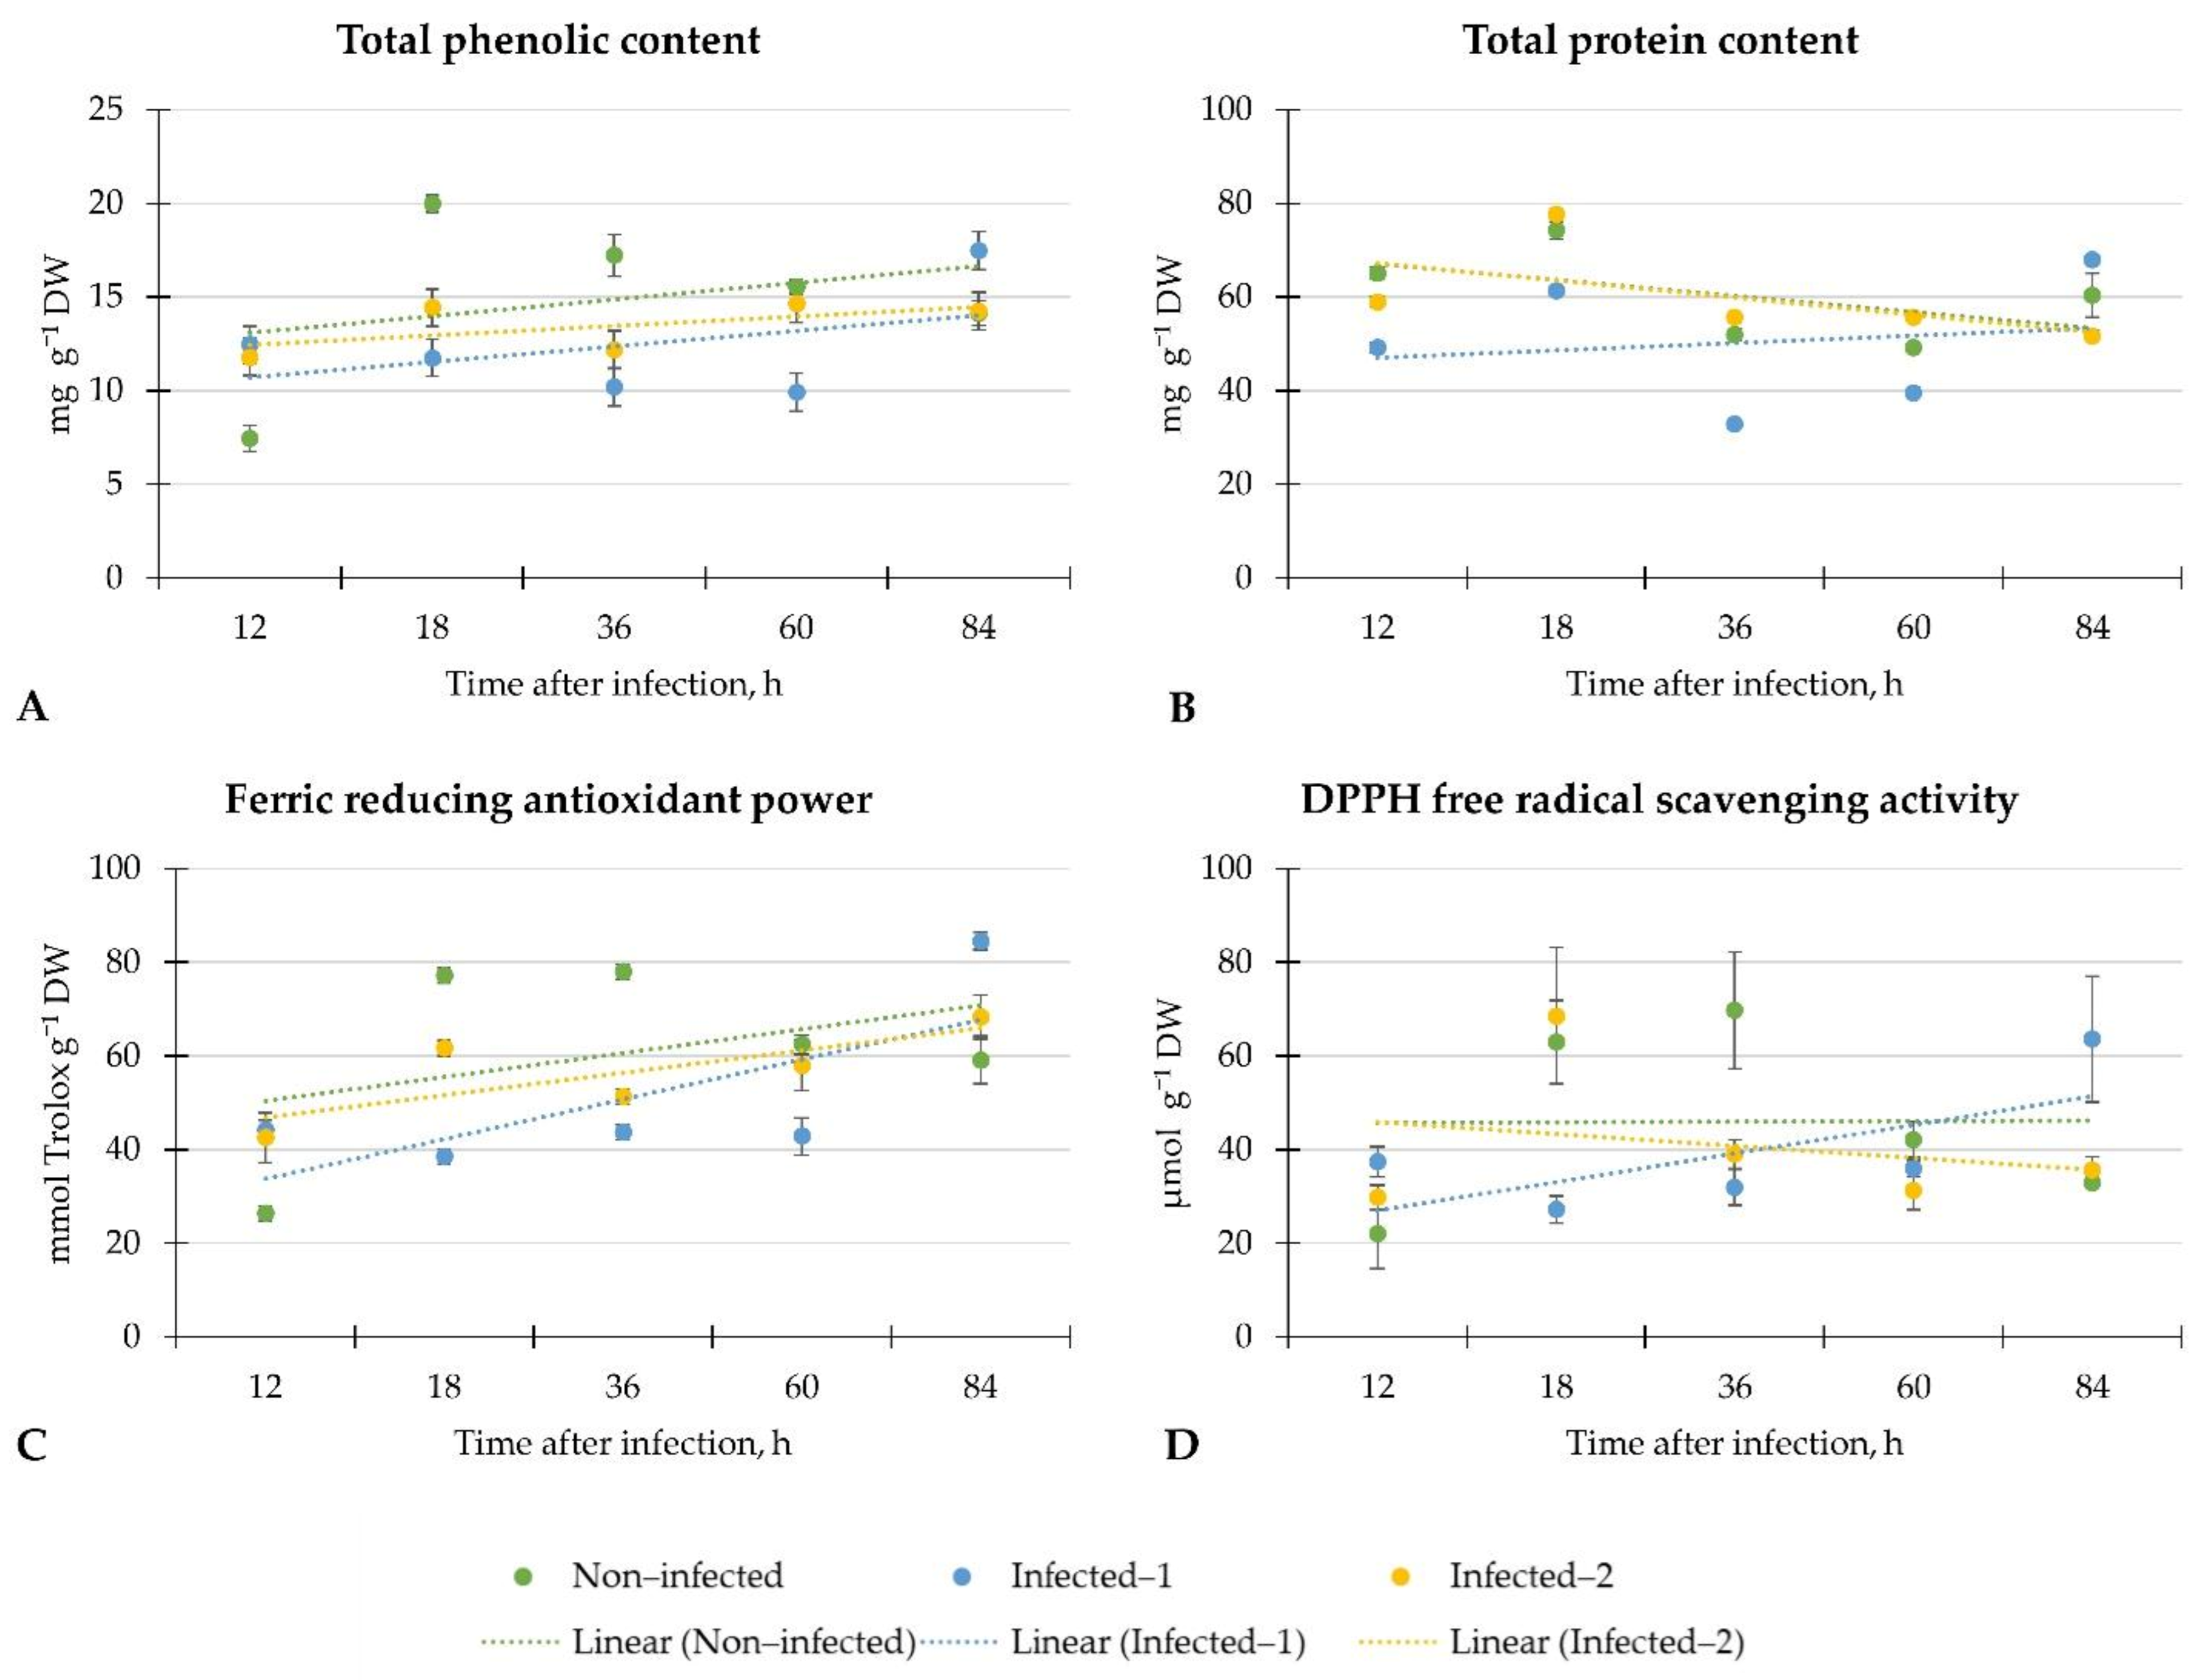
Our results demonstrated the weak linear regression of total phenolic and protein contents and DPPH free radical scavenging activity in the plants from each investigation group. Only ferric-reducing antioxidant power linear regression in infected lettuce was moderate, while in non-infected plants, it was weak. However, total phenolic content increased twice after 12 h regardless of the inoculation method, and similar results were found on ferric-reducing antioxidant power in lettuce. However, the decrement of these phytochemicals was later observed. Surprisingly, at the end of the investigation period, the total phenolic and protein content and antiradical activity according to the DPPH and ferric-reducing antioxidant power methods increased in lettuce infected with the pathogen spore disc.
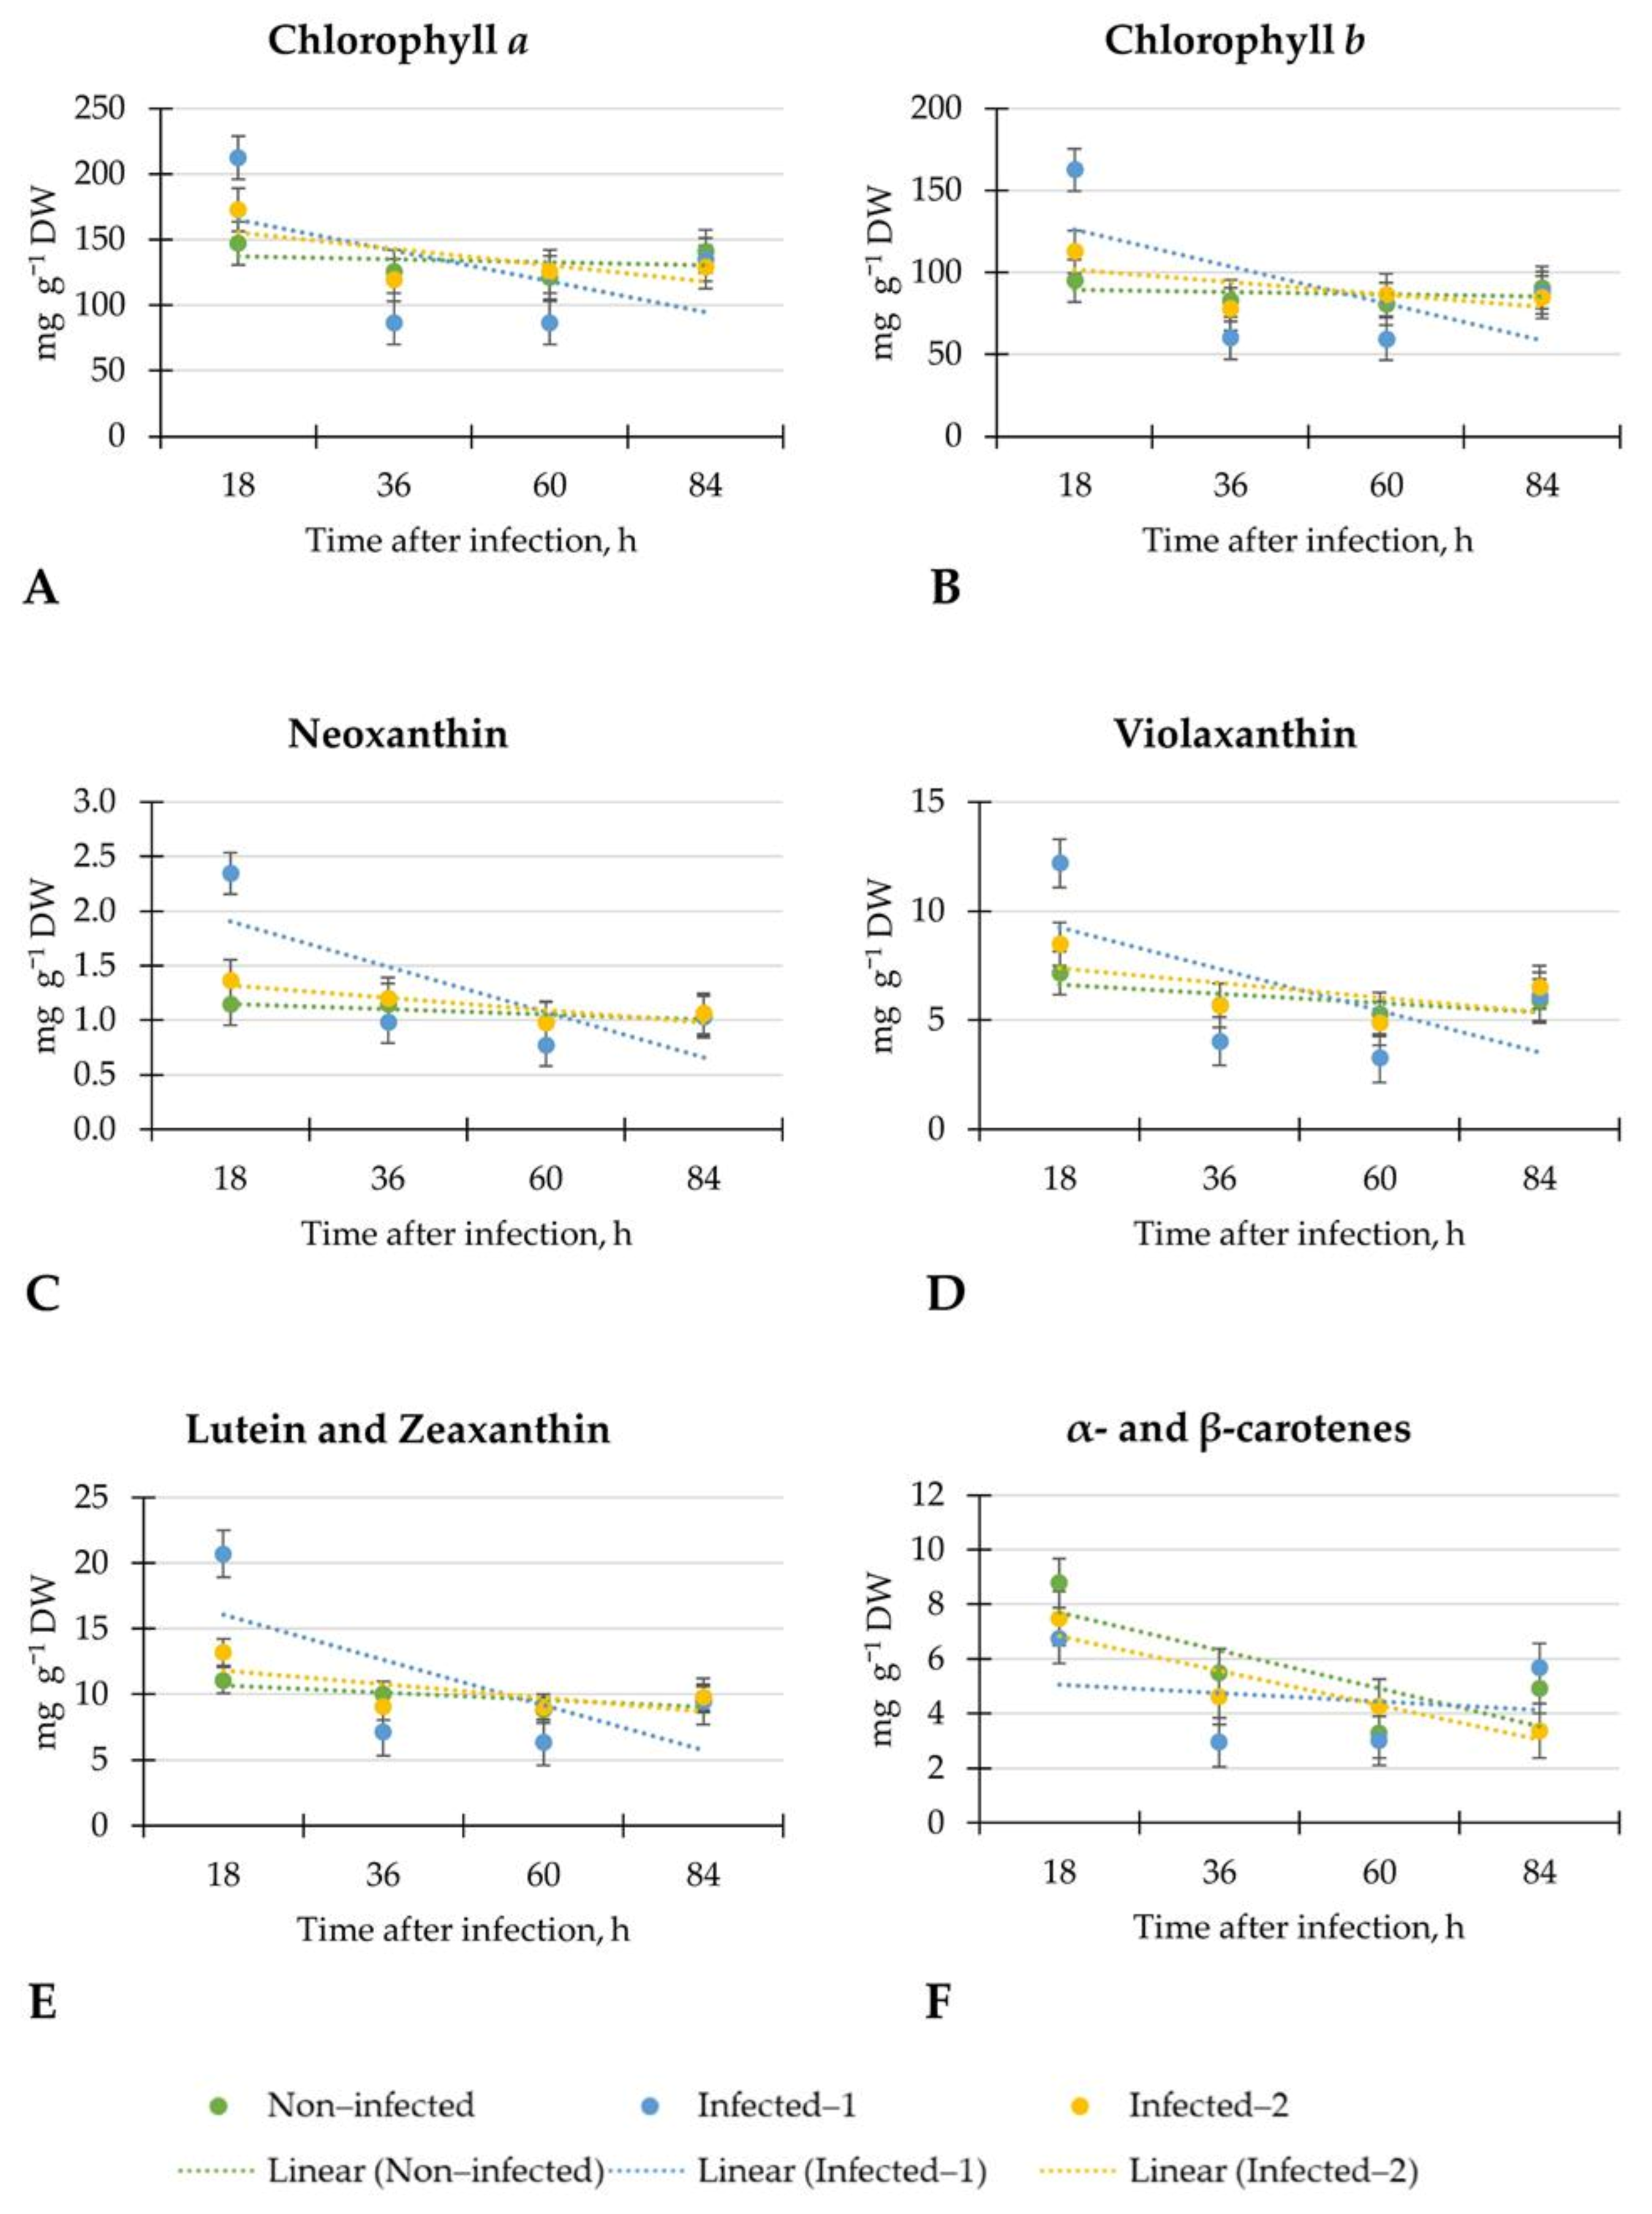
In all tested groups of lettuce, the linear regression of chlorophylls was weak, showing inconsistent plant response at each evaluation time. Similar changes were observed in contents of neoxanthin, violaxanthin, lutein, and zeaxanthin, α- and β-carotenes in all tested lettuce. However, in lettuce inoculated with pathogen spore disc, the linear regression of α- and β-carotenes was weak. It may show the inconsistent plant response because of the affected metabolism of these carotenoids. However, after 18 h, the significant increment of chlorophyll b (1.7-fold), neoxanthin (2.0-fold), lutein, and zeaxanthin (1.9-fold) were observed in inoculated with the pathogen spore disc compared to non-infected lettuce. In addition, the changes in contents of chlorophylls after 18 h were similar to non-destructive CHL measurements. There is a lack of results on early detection of B. cinerea on lettuce by non-destructive measurements of leaf spectral reflectance indices and biochemical compounds. For precise and optimal B. cinerea control, early detection is essential because when the disease can be seen visually, it is difficult to stop it.

5. Conclusions

The early physiological response of lettuce to infection with B. cinerea depends on the inoculation method according to leaf spectral indexes and changes in contents of metabolites The earliest response, 12 h after lettuce inoculation with B. cinerea, was determined by biochemical measurements of total phenolic content and ferric-reducing antioxidant power. The non-destructive measurements of relative chlorophyll content, the carotenoid reflectance index, normalised difference vegetation index, and photochemical reflectance index showed potential to detect the plant response to inoculation with B. cinerea after 18 h. The increments of chlorophylls and carotenoids might simultaneously confirm it, according to the biochemical analysis.

Author Contributions

Conceptualisation, V.V.-K. and A.V.; methodology, A.V., N.R. and V.V.-K.; software, V.V.-K.; validation, A.V., N.R. and V.V.-K.; formal analysis, L.D., S.C., N.R. and V.V.-K.; investigation, N.R., A.V., L.D., S.C. and V.V.-K.; resources, A.V.; data curation, V.V.-K., N.R. and A.V.; writing—original draft preparation, V.V.-K.; writing—review and editing, N.R., L.D., A.V. and V.V.-K.; visualisation, V.V.-K.; supervision, A.V.; project administration, A.V.; funding acquisition, A.V. All authors have read and agreed to the published version of the manuscript.

Funding

This project has received funding from the RTO Lithuania “Development of a database of specific parameters of plant pathogens for disease diagnosis by non-destructive methods” (CV-1-55 by LAMMC).

Conflicts of Interest

The authors declare no conflict of interest.

References

  1. Vishnoi, V.K.; Kumar, K.; Kumar, B. Plant disease detection using computational intelligence and image processing. J. Plant Dis. Prot. 2021, 128, 19–53. [Google Scholar] [CrossRef]
  2. Williamson, B.; Tudzynski, B.; Tudzynski, P.; Van Kan, J.A. Botrytis cinerea: The cause of grey mould disease. Mol. Plant Pathol. 2007, 8, 561–580. [Google Scholar] [CrossRef] [PubMed]
  3. Scarboro, C.G.; Ruzsa, S.M.; Doherty, C.J.; Kudenov, M.W. Detection of Gray Mold Infection in Plants Using a Multispectral Imaging System. BioRxiv 2020. [Google Scholar] [CrossRef]
  4. Holz, G.; Coertze, S.; Williamson, B. The Ecology of Botrytis on Plant Surfaces. In Botrytis: Biology, Pathology and Control; Elad, Y., Williamson, B., Tudzynski, P., Delen, N., Eds.; Springer: Dordrecht, The Netherlands, 2007; pp. 9–27. [Google Scholar]
  5. Reboledo, G.; Agorio, A.; Vignale, L.; Batista-García, R.A.; Ponce De León, I. Botrytis cinerea Transcriptome during the Infection Process of the Bryophyte Physcomitrium patens and Angiosperms. J. Fungi 2021, 7, 11. [Google Scholar] [CrossRef]
  6. Dik, A.J.; Elad, Y. Comparison of antagonists of Botrytis cinerea in greenhouse-grown cucumber and tomato under different climatic conditions. Eur. J. Plant Pathol. 1999, 105, 123–137. [Google Scholar] [CrossRef]
  7. Bilkiss, M.; Shiddiky, M.J.; Ford, R. Advanced diagnostic approaches for necrotrophic fungal pathogens of temperate legumes with a focus on Botrytis spp. Front. Microbiol. 2019, 10, 1889. [Google Scholar] [CrossRef]
  8. Ray, M.; Ray, A.; Dash, S.; Mishra, A.; Achary, K.G.; Nayak, S.; Singh, S. Fungal disease detection in plants: Traditional assays, novel diagnostic techniques and biosensors. Biosens. Bioelectron. 2017, 87, 708–723. [Google Scholar] [CrossRef]
  9. Weßling, R.; Panstruga, R. Rapid quantification of plant-powdery mildew interactions by qPCR and conidiospore counts. Plant Methods 2012, 8, 1–11. [Google Scholar] [CrossRef] [Green Version]
  10. Narayanasamy, P. Detection of fungal pathogens in plants. In Microbial Plant Pathogens-Detection and Disease Diagnosis; Springer: Dordrecht, The Netherlands, 2011. [Google Scholar]
  11. Fahrentrapp, J.; Ria, F.; Geilhausen, M.; Panassiti, B. Detection of gray mold leaf infections prior to visual symptom appearance using a five-band multispectral sensor. Front. Plant Sci. 2019, 10, 628. [Google Scholar] [CrossRef] [Green Version]
  12. Medina-Lozano, I.; Bertolín, J.R.; Díaz, A. Nutritional value of commercial and traditional lettuce (Lactuca sativa L.) and wild relatives: Vitamin C and anthocyanin content. Food Chem. 2021, 359, 129864. [Google Scholar] [CrossRef]
  13. Shim, C.K.; Kim, M.J.; Kim, Y.K.; Jee, H.J. Evaluation of lettuce germplasm resistance to gray mold disease for organic cultivations. Plant Pathol. J. 2014, 30, 90. [Google Scholar] [CrossRef] [Green Version]
  14. Rasiukevičiūtė, N.; Rugienius, R.; Šikšnianienė, J.B. Genetic diversity of Botrytis cinerea from strawberry in Lithuania. Zemdirb.-Agric. 2018, 105, 265–270. [Google Scholar] [CrossRef] [Green Version]
  15. Ainsworth, E.A.; Gillespie, K.M. Estimation of Total Phenolic Content and Other Oxidation Substrates in Plant Tissues Using Folin–Ciocalteu Reagent. Nat. Protoc. 2007, 2, 875–877. [Google Scholar] [CrossRef]
  16. Bradford, M.M. A rapid and sensitive method for the quantitation of microgram quantities of protein utilizing the principle of protein-dye binding. Anal. Biochem. 1976, 72, 248–254. [Google Scholar] [CrossRef]
  17. Ou, B.; Huang, D.; Hampsch-Woodill, M.; Flanagan, J.A.; Deemer, E.K. Analysis of antioxidant activities of common vegetables employing oxygen radical absorbance capacity (ORAC) and ferric reducing antioxidant power (FRAP) assays: A comparative study. J. Agric. Food Chem. 2002, 50, 3122–3128. [Google Scholar] [CrossRef]
  18. Sharma, O.P.; Bhat, T.K. DPPH Antioxidant Assay Revisited. Food Chem. 2009, 113, 1202–1205. [Google Scholar] [CrossRef]
  19. Mishra, K.; Ojha, H.; Chaudhury, N.K. Estimation of Antiradical Properties of Antioxidants Using DPPH Assay: A Critical Review and Results. Food Chem. 2012, 130, 1036–1043. [Google Scholar] [CrossRef]
  20. Edelenbos, M.; Christensen, L.P.; Grevsen, K. HPLC determination of chlorophyll and carotenoid pigments in processed green pea cultivars (Pisum sativum L.). J. Agric. Food Chem. 2001, 49, 4768–4774. [Google Scholar] [CrossRef]
  21. Rizhsky, L.; Liang, H.; Shuman, J.; Shulaev, V.; Davletova, S.; Mittler, R. When defense pathways collide. The response of Arabidopsis to a combination of drought and heat stress. Plant Physiol. 2004, 134, 1683–1696. [Google Scholar] [CrossRef] [Green Version]
  22. Lamers, J.; Van Der Meer, T.; Testerink, C. How plants sense and respond to stressful environments. Plant Physiol. 2020, 182, 1624–1635. [Google Scholar] [CrossRef] [Green Version]
  23. Iqbal, Z.; Iqbal, M.S.; Hashem, A.; Abd_Allah, E.F.; Ansari, M.I. Plant defense responses to biotic stress and its interplay with fluctuating dark/light conditions. Front. Plant Sci. 2021, 12, 297. [Google Scholar] [CrossRef]
  24. Wu, D.; Feng, L.; Zhang, C.; He, Y. Early detection of Botrytis cinerea on eggplant leaves based on visible and near-infrared spectroscopy. Trans. ASABE 2008, 51, 1133–1139. [Google Scholar] [CrossRef]
  25. Mo, C.; Kim, G.; Lim, J.; Kim, M.S.; Cho, H.; Cho, B.K. Detection of lettuce discoloration using hyperspectral reflectance imaging. Sensors 2015, 15, 29511–29534. [Google Scholar] [CrossRef] [Green Version]
Figure 1. Non-destructive measurements of relative chlorophyll (A; CHL), flavonols (B; FLAV) contents, and nitrogen balance index (C; NBI) of non-infected, artificial infected with B. cinerea disc (Infected-1) and infected with pathogen spore suspension (Infected-2) of “Little Gem” lettuce after 12, 18, 36, 60, and 84 h of artificial infection.
Horticulturae 08 00023 g001
Figure 2. Leaf spectral reflectance measurements of normalised difference vegetation index (A; NDVI), carotenoid reflectance index (B; CRI), plant senescence reflectance index (C; PSRI), photochemical reflectance index (D; PRI) of non-infected, artificial infected with B. cinerea disc (Infected-1) and infected with pathogen spore suspension (Infected-2) of “Little Gem” lettuce after 12, 18, 36, 60, and 84 h of artificial infection.
Horticulturae 08 00023 g002
Figure 3. Biochemical measurements of the total phenolic content (A), the total protein content (B), the ferric-reducing antioxidant power (C) and DPPH free radical scavenging activity (D) of non-infected, artificial infected with B. cinerea disc (Infected-1) and infected with pathogen spore suspension (Infected-2) of “Little Gem” lettuce after 12, 18, 36, 60, and 84 h of artificial infection. DW—dry weight.
Horticulturae 08 00023 g003
Figure 4. Biochemical measurements of the chlorophyll a (A) and b (B), neoxanthin (C), violaxanthin (D), lutein and zeaxanthin (E), and α- and β–carotenes (F) of non-infected, artificially infected with B. cinerea disc (Infected-1) and infected with pathogen spore suspension (Infected-2) of “Little Gem” lettuce after 12, 18, 36, 60, and 84 h of artificial infection. DW—dry weight.
Horticulturae 08 00023 g004
Table 1. Coefficients for linear regression equations presented in Figure 1, in the form of y = ax + b, and their correlation coefficients (R2).
TreatmentsCHLFLANBI
abR2abR2abR2
Non-infected1.35713.530.5490.0060.1980.2754.056469.980.342
Infected-10.42316.420.5150.0070.2010.844−0.46882.390.08
Infected-2−0.15719.230.017−0.0040.2250.398−0.19883.220.004
Table 2. Non-destructive measurements of leaf spectral reflectance indexes in “Little Gem” lettuce after 12, 18, 36, 60, and 84 h of artificial infection.
TreatmentsNDVIPRIPSRICRICHLFLANBI
12 hNon-infected0.817 a0.020 abcd−0.031 abc0.051 a16.801 cd0.198 b85.183 abc
Infected-10.777 ab0.010 de−0.038 bc0.037 cd16.506 cde0.205 b81.340 abc
Infected-20.810 a0.023 ab−0.028 ab0.047 abc18.947 abc0.213 ab88.923 ab
18 hNon-infected0.745 b0.009 e−0.041 c0.033 d14.136 e0.208 ab68.233 c
Infected-10.806 a0.021 abc−0.036 bc0.045 abc17.901 bcd0.215 ab84.574 abc
Infected-20.777 ab0.012 cde−0.037 bc0.038 bcd17.074 cd0.228 ab75.024 bc
36 hNon-infected0.796 a0.017 abcde−0.031 abc0.045 abc15.918 de0.216 ab74.533 bc
Infected-10.808 a0.020 abcd−0.032 abc0.048 abc17.045 cd0.226 ab77.214 bc
Infected-20.807 a0.021 abc−0.028 ab0.050 a16.756 cd0.208 ab81.448 abc
60 hNon-infected0.809 a0.023 a−0.029 ab0.047 abc21.006 a0.245 a86.381 ab
Infected-10.794 a0.017 abcde−0.034 abc0.042 abcd18.880 abc0.235 ab81.001 abc
Infected-20.806 a0.024 a−0.028 ab0.049 ab17.950 bcd0.213 ab84.614 abc
84 hNon-infected0.815 a0.023 ab−0.023 a0.053 a20.153 ab0.209 ab96.390 a
Infected-10.805 a0.013 bcde−0.034 abc0.044 abc18.131 bcd0.231 ab80.789 abc
Infected-20.786 ab0.014 abcde−0.030 abc0.045 abc16.623 cde0.201 b83.139 abc
NDVI—normalised difference vegetation index, PRI—photochemical reflectance index, PSRI—plant senescence reflectance index, CRI—carotenoid reflectance index, CHL—relative chlorophyll content, FLA—relative flavonol content; NBI—nitrogen balance index; Infected-1—inoculation with B. cinerea disc; Infected-2—inoculation with a pathogen spore suspension. Numbers followed by different letters are statistically different at confidence level p ≤ 0.05 (Tukey’s HSD test).
Table 3. Coefficients for linear regression equations presented in Figure 2, in the form of y = ax + b, and their correlation coefficients (R2).
TreatmentsNDVIPSRICRIPRI
abR2abR2abR2abR2
Non-infected0.0060.7790.1000.003−0.0390.4640.0170.0410.1260.0020.0120.312
Infected-10.0040.7850.2910.001−0.0380.4010.0010.0400.2010.0000.0160.004
Infected-2−0.0020.8030.0360.001−0.0300.0590.0010.0440.0610.0010.0200.021
Table 4. Coefficients for linear regression equations presented in Figure 3, in the form of y = ax + b, and their correlation coefficients (R2).
TreatmentsTotal Phenolic ContentTotal Protein ContentFRAPDPPH
abR2abR2abR2abR2
Non-infected0.89412.1810.091−3.44070.4630.2895.07345.3670.1470.09145.6510.005
Infected-10.8239.8840.1811.56345.4880.0298.52725.1270.5026.12420.7770.465
Infected-20.50911.9270.354−3.66970.9200.3184.77541.9700.5862.57848.4890.066
FRAP—ferric-reducing antioxidant power; DPPH—DPPH free radical scavenging activity.
Table 5. Biochemical measurements of “Little Gem” lettuce after 12, 18, 36, 60, and 84 h of artificial infection.
TreatmentsFRAPDPPHTPCTPrC
Fe2+ μmol g−1 DWµmol g−1 DWmg g−1 DWmg g−1 DW
12 hNon-infected26.333 f22.013 c7.450 g65.020 bc
Infected-144.067 e37.303 c12.447 e49.187 g
Infected-242.460 e29.740 c11.790 e58.963 de
18 hNon-infected77.133 ab62.927 ab19.973 a74.247 a
Infected-138.433 ef27.127 c11.747 e61.387 cd
Infected-261.627 cd68.430 a14.430 cd77.730 a
36 hNon-infected78.000 ab69.703 a17.213 b51.877 fg
Infected-143.700 e31.900 c10.183 f32.843 i
Infected-251.290 de38.967 c12.187 e55.590 ef
60 hNon-infected62.400 cd42.087 bc15.540 c49.253 g
Infected-142.833 e35.850 c9.910 f39.553 h
Infected-257.897 cd31.140 c14.623 cd55.600 ef
84 hNon-infected59.067 cd32.887 c14.137 d60.317 cde
Infected-184.500 a63.560 ab17.480 b67.920 b
Infected-268.200 bc35.493 c14.237 cd51.683 fg
FRAP—ferric-reducing antioxidant power; DPPH—2,2-Diphenyl-1-picrylhydrazyl free radical scavenging activity; TPC—total phenolic content; TPrC—total protein content; Infected-1—inoculation with B. cinerea disc; Infected-2—inoculation with a pathogen spore suspension. Numbers followed by different letters are statistically different at confidence level p ≤ 0.05 (Tukey’s HSD test).
Table 6. Coefficients for linear regression equations presented in Figure 4, in y = ax + b, and their correlation coefficients (R2).
TreatmentsChl aChl bNeoxViolaxLut + Zeaxα-car + β-car
abR2abR2abR2abR2abR2abR2
Non-infected−2.33139.640.06−1.4490.940.08−0.051.200.57−0.047.050.45−0.5611.260.60−1.399.070.60
Infected-1−23.42188.650.26−22.62148.970.36−0.422.330.56−1.9111.160.37−3.4619.540.45−0.315.360.04
Infected-2−12.41167.650.43−7.49109.130.40−0.111.440.74−0.678.070.31−1.0312.850.45−1.278.090.85
Chl a—chlorophyll a; Chl b—chlorophyll b; Neox—neoxanthin; Violax—violaxanthin; Lut + Zeax—lutein and zeaxanthin; α-car + β-car—α- and β–carotenes.
Table 7. Chlorophylls and carotenoids measurements of “Little Gem” lettuce after 12, 18, 36, 60, and 84 h of artificial infection.
TreatmentsChl aChl bNeoxViolaxLut + Zeaxα-car + β-car
mg g−1 DW
18 hNon-infected147.433 abc94.919 b1.144 b7.157 ab11.053 b8.778 a
Infected-1212.545 a162.681 a2.345 a12.194 a20.715 a6.734 ab
Infected-2172.571 ab112.652 ab1.367 b8.490 ab13.205 ab7.473 ab
36 hNon-infected125.647 bc82.845 b1.149 b5.679 b9.998 b5.483 ab
Infected-186.776 c60.065 b0.984 b4.029 b7.103 b2.936 b
Infected-2119.195 bc77.793 b1.202 b5.676 b9.055 b4.596 ab
60 hNon-infected120.961 bc80.790 b0.981 b5.272 b8.823 b3.273 b
Infected-186.475 c59.437 b0.773 b3.264 b6.324 b2.987 b
Infected-2125.673 bc86.319 b0.975 b4.872 b9.018 b4.266 ab
84 hNon-infected141.229 abc90.800 b1.040 b5.886 b9.584 b4.894 ab
Infected-1134.569 abc87.488 b1.029 b6.090 b9.452 b5.683 ab
Infected-2129.042 abc84.830 b1.061 b6.514 b9.772 b3.366 b
Chl a—chlorophyll a; Chl b—chlorophyll b; Neox—neoxanthin; Violax—violaxanthin; Lut + Zeax—lutein and zeaxanthin; α-car + β-car—α-carotene and β-carotene; Infected-1—inoculation with B. cinerea disc; Infected-2—inoculation with a pathogen spore suspension. Numbers followed by different letters are statistically different at confidence level p ≤ 0.05 (Tukey’s HSD test).
Publisher’s Note: MDPI stays neutral with regard to jurisdictional claims in published maps and institutional affiliations.

