Article

Real-Time Detection and Location of Potted Flowers Based on a ZED Camera and a YOLO V4-Tiny Deep Learning Algorithm

1
Key Laboratory of Modern Agricultural Equipment and Technology, Ministry of Education, Jiangsu University, Zhenjiang 212013, China
2
College of Biology and Environment, Nanjing Forestry University, Nanjing 210037, China
*
Author to whom correspondence should be addressed.
Horticulturae 2022, 8(1), 21; https://doi.org/10.3390/horticulturae8010021
Submission received: 20 November 2021 / Revised: 20 December 2021 / Accepted: 22 December 2021 / Published: 24 December 2021

Abstract

:
In order to realize the real-time and accurate detection of potted flowers on benches, in this paper we propose a method based on the ZED 2 stereo camera and the YOLO V4-Tiny deep learning algorithm for potted flower detection and location. First, an automatic detection model of flowers was established based on the YOLO V4-Tiny convolutional neural network (CNN) model, and the center points on the pixel plane of the flowers were obtained according to the prediction box. Then, the real-time 3D point cloud information obtained by the ZED 2 camera was used to calculate the actual position of the flowers. The test results showed that the mean average precision (MAP) and recall rate of the training model was 89.72% and 80%, respectively, and the real-time average detection frame rate of the model deployed under Jetson TX2 was 16 FPS. The results of the occlusion experiment showed that when the canopy overlap ratio between the two flowers is more than 10%, the recognition accuracy will be affected. The mean absolute error of the flower center location based on 3D point cloud information of the ZED 2 camera was 18.1 mm, and the maximum locating error of the flower center was 25.8 mm under different light radiation conditions. The method in this paper establishes the relationship between the detection target of flowers and the actual spatial location, which has reference significance for the machinery and automatic management of potted flowers on benches.

1. Introduction

Floriculture refers to practices involving the growing of cut flowers, potted flowering, foliage plants, and bedding plants in greenhouses and fields. Floriculture products, have the highest profit per unit area among compared to other agricultural products [1]. As the population is aging, the future of floriculture production relies on a balance between labor and technology [2], so mechanization and automation for floriculture management are important to solve problems of labor shortage. With the development of the robot or the automatic manipulator, precision management equipment can be developed to realize the automatic transplantation, grading, and harvesting for floriculture [3]. For these tasks, target detection and location are essential. So, the real-time and accurate detection of potted flowers is necessary [4].
Machine vision technology has been used to achieve the precise management of flowers. Through the method of machine vision, researchers can realize flower detection [5,6], classification [7], and calculate the number of flowers [8,9] in a specific area. Compared with manual methods, this method can improve economic efficiency [10]. Therefore, the counting and handling of flowers can be handled by machine vision, which can optimize the management process of flowers to a large extent. For the effective detection and tracking of flower targets, Zhuang et al. (2018) proposed a robust detection method for citrus fruits based on a monocular vision system and used the adaptive enhancement of red and green chromaticity maps to identify citrus regions [11]. Ryan et al. (2017) developed a set of estimation methods for the growth density of peach blossoms based on a UAV [12]. Aleya et al. (2013) used a k-means algorithm to separate flowers from backgrounds and detected damaged flowers according to a histogram distribution of flowers [6]. Aggelopoulou et al. (2011) set a black cloth screen behind fruit trees to collect images at a specific time and extract flowers according to the color threshold [13]. Sarkate et al. (2013) combined computer vision and image segmentation to predict the yield of gerbera flowers [14]. Zhao et al. (2016) combined the adaptive red/blue (RB) chromaticity diagram and the sum of absolute transformation differences to segment citrus regions [15].
The above-mentioned traditional methods use visual features, such as shape, texture, color, or size, to complete target recognition. However, there are many interferences where crops are grown (such as the type of the crop, lighting condition, and the growth background, and so on) [16], and these interferences can easily affect the recognition effect, thereby affecting the accuracy of detection [17]. With the development of computer vision technology and the deep learning model, a CNN (convolutional neural network) model was used for the detection of the target and the improvement of the detection performance in the implementation of agricultural production [7,18,19,20,21]. In these studies, the CNN is trained by a large number of samples. The trained CNN model can be used to detect the target more accurately than the traditional recognition methods, and the ability to resist external interference is stronger. However, under the condition of ensuring accuracy, the detection speed of this method will be reduced, and the hardware equipment requirements are high. Compared with other neural network detection models, the YOLO model has significantly improved the detection speed while ensuring detection accuracy [22,23,24], which is suitable for deployment on embedded devices. For example, the apple flower [25], Phalaenopsis [26], and mobile flower [27] can be recognized. Redmon et al. (2017) trained YOLO9000 simultaneously on the COCO detection dataset and ImageNet classification dataset using the joint training of target detection and classification [28]. This method can predict the detection of object classes without marked detection data. Wu et al. proposed an apple blossom detection method based on the YOLO V4 deep learning algorithm and simplified the apple blossom detection model through a channel pruning algorithm. This method can accurately detect apple blossoms in a natural environment [25]. So, by collecting the dataset of different growth statuses, growth environment, and the types of the crop, the training of the CNN model can be used to match the requirements of the detection and location for accuracy.
The real-time detection and location of potted flowers suffer from a high time consumption and a low detection accuracy. In order to improve the detection and location accuracy and real-time, in this study, the YOLO V4-Tiny model was used to detect potted flowers. This model has a fast recognition speed, a high precision, and a small size, and it is easy to have arranged in a mobile terminal [29]. Firstly, samples were used to train the YOLO V4-Tiny model, and the trained model was then deployed on a mobile terminal to achieve the accurate and rapid detection of flowers. Finally, a ZED 2 stereo camera was used to process the recognized flower images, and the location of the flowers was realized through camera coordinates and 3D point cloud information, so as to quickly and accurately detect and locate flowers.

2. Materials and Methods

2.1. Process of the Flower Detection and Location Based on the ZED 2 Stereo Camera and the YOLO V4-Tiny Model

YOLO (you only look once) [24] is a convolutional neural network (CNN) algorithm that is different from the target detection method in two stages of the Flyer R-CNN (the target candidate box is formed and then classified). It divides the input image into a grid of S*S, and each grid is responsible for detecting the target falling into it. It predicts the bounding box, positioning confidence, and probability vectors of all categories of targets contained in all grids, so it has good real-time performance. In order to meet the real-time accuracy requirements on mobile terminals and edge computing devices at one time, YOLO V4-Tiny is obtained by simplifying YOLO V3 [22], it is a single-stage target detection model that performs well balance between accuracy and speed, and the trained weight file is small can be transferred to the mobile terminal. [30]. the structure of the model was shown in Figure 1a. The convolution layer of the CSP (Cross Stage Pritial connection) was compressed, and the FPN is set as 2.
The ZED 2 stereo camera is an integrated binocular camera that adopts advanced sensing technology based on stereo vision and provides technologies such as video acquisition, depth information acquisition, and real-time position information. It has been applied to object reconstruction [31], position acquisition [32,33,34], etc.
The processes for potted flower detection based on the ZED 2 stereo camera and YOLO V4-Tiny are shown in Figure 1b. In this study, the artificial labeled flower dataset was constructed to train the CNN model of YOLO V4. The model can accurately detect the flowers and mark the prediction box, and the flower center point on the pixel plane of flowers is obtained according to the prediction box. With the match of the RGB image and depth point cloud image collected by the ZED 2 stereo camera, the location coordinates of the flowers can be obtained.

2.2. Potted Flower Detection Based on the YOLO V4-Tiny Model

2.2.1. Data Collection for YOLO V4-Tiny Model Training

The images were collected from Changshu Jiasheng Agricultural Co. LTD (120°38′47″, 31°33′44.24″) on 26 March 2019, and from Qiyi Flower Co. Ltd. (119°23′38″, 32°0′18″) on 9 January 2021, respectively. The pictures of the flowers were collected by a digital camera (Canon EOS M3, Canon Co. LTD, Tokyo, Japan), and the camera was about 100 cm above the flower canopy, so the flower canopy is mainly located in the center of the image. Figure 2 shows images of poinsettias and cyclamens.
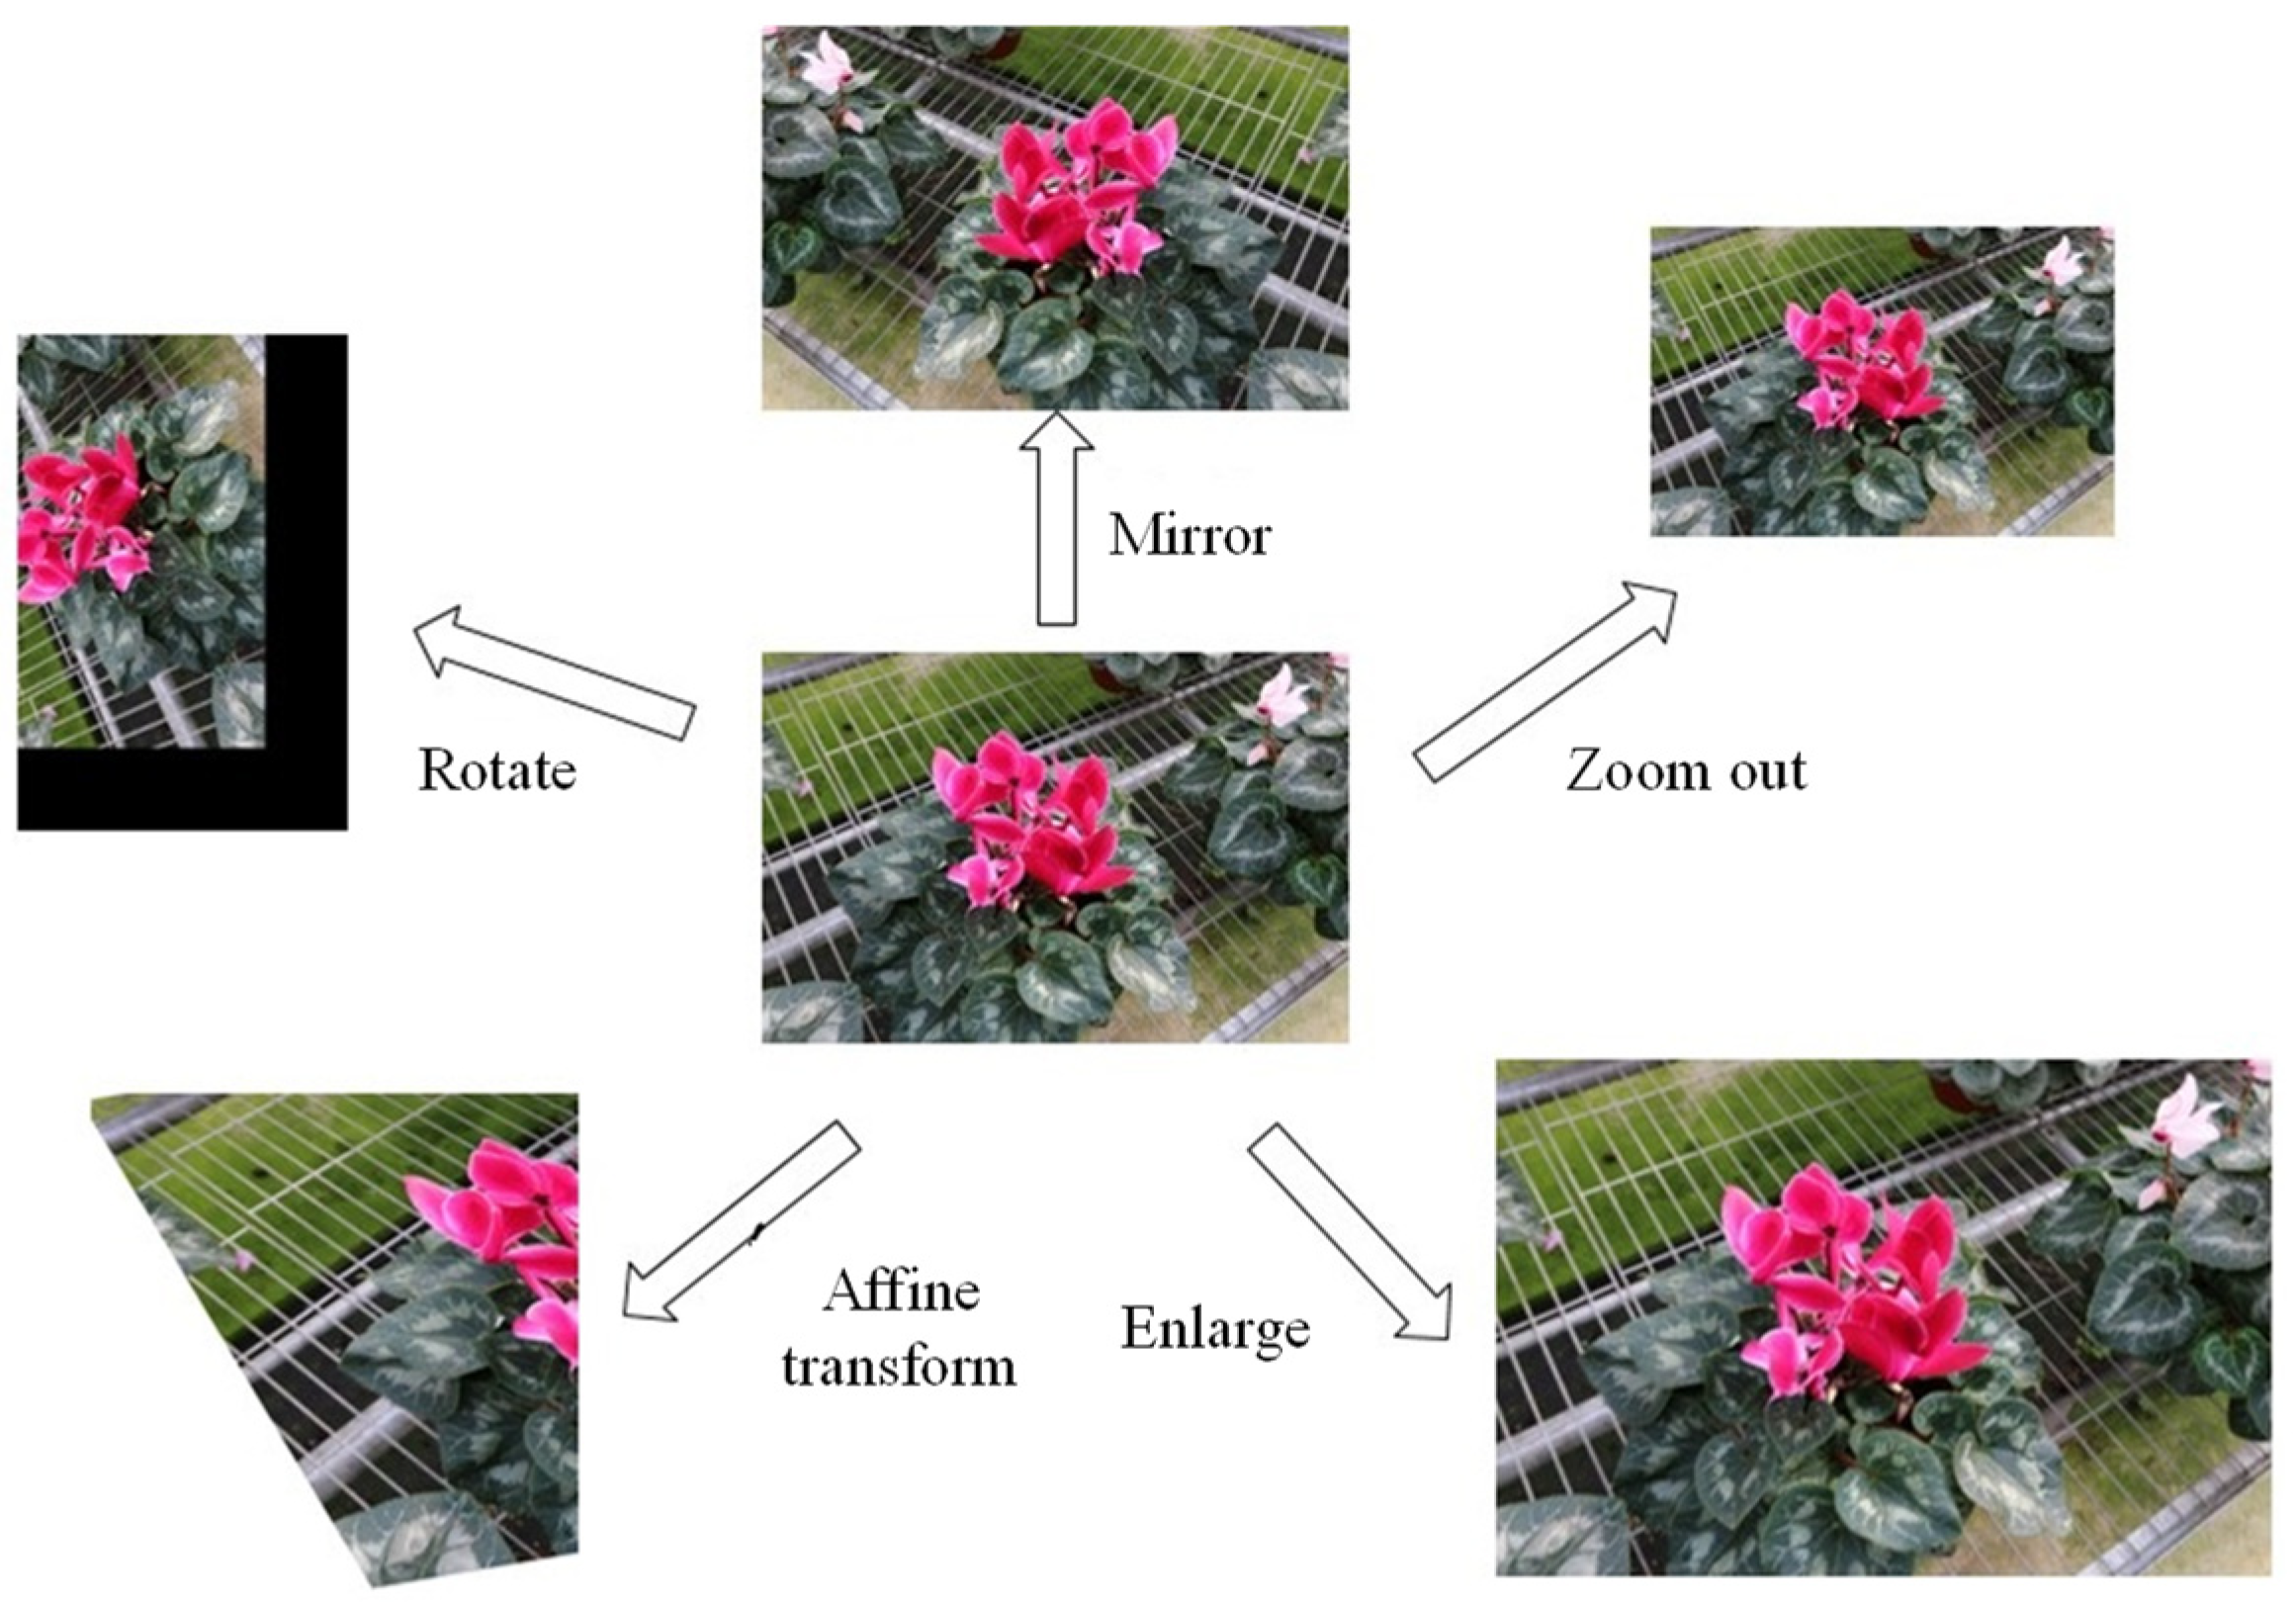
Considering the influences of different light intensities in the natural environments and the camera parameters, 1000 images of poinsettias and cyclamens under different light intensities, camera parameters, and shooting angles were selected during data collection. In order to increase the training images, and to prevent over-fitting in the training, the selected images were mirrored, shrunk, enlarged, rotated, and affine-transformed to enhance the dataset, as shown in Figure 3. The images were then selected again, and images of flowers that were too repetitive and that were missing due to data augmentation were deleted. The number of final images for model training was 3000.

2.2.2. Model Training

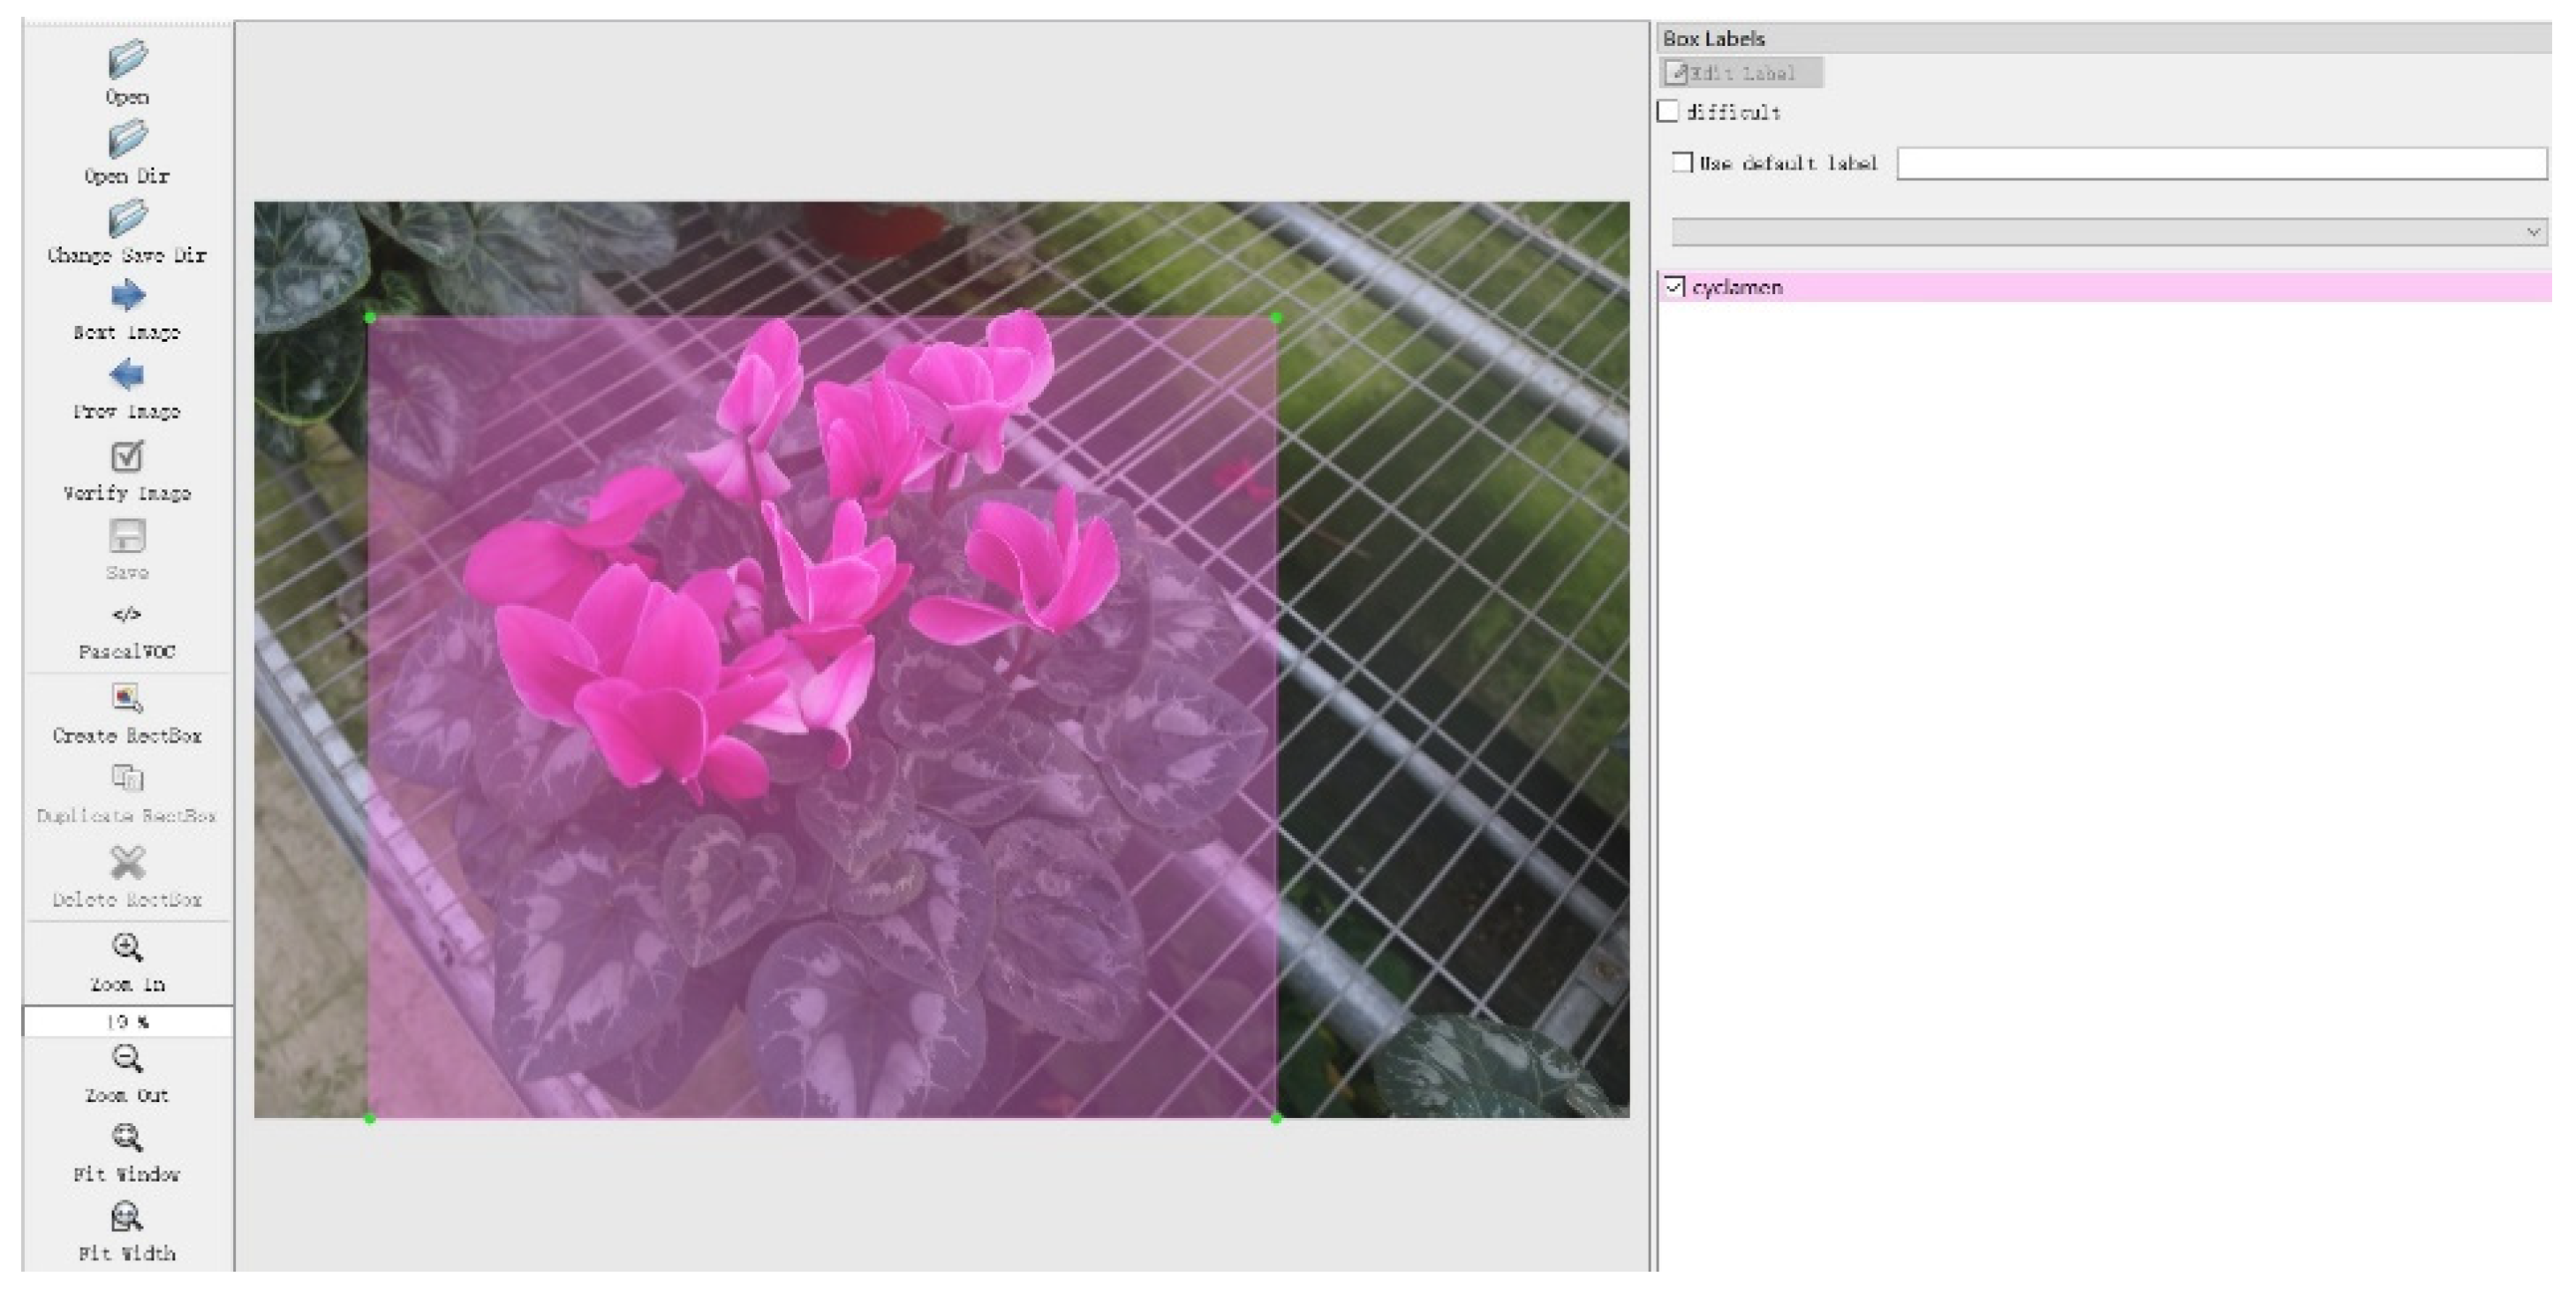
In order to train the CNN model, an annotation XMLdataset based on PASCAL VOC data format, formatted by labeling with the LabelImg software, was constructed. Two categories, cyclamen and poinsettia, were customized in LabelImg’s data, and the outline of the flowers was selected using the rectangular box to label the target, shown in Figure 4. The application generated coordinates containing the four vertices of the rectangular box. The labeled dataset was imported to the YOLO for model training.
In addition, in order to accelerate model convergence and reduce training time, the YOLO V4-Tiny weight file (YOLO V4-Tiny. Conv.29) without a full connection layer was used for transfer learning. The weight file was obtained by training 80 categories on the COCO dataset. Shared-parameter-based transfer learning consisted of training the weights of the feature extraction part in the YOLO layer in advance to find common parameters or prior distributions between the spatial model of the source data and the target data (for the purpose of migration).
CNN model training was carried out on a computer. The main hardware configuration of the computer was an Intel Core i5-9300H, an NVIDIA GeForce GTX 1650 GPU, and 16G of memory, and CUDA and CUDNN were used to accelerate the calculation during training.

2.3. Real-Time Detection Based on the ZED 2 Camera and the Jetson TX2

In order to obtain the real-time location of flowers, a detection system was constructed with the ZED 2 stereo camera (Stereolabs Inc., San Francisco, CA, USA) and the Jetson TX2 (NVIDIA Co., Santa Clara, CA, USA) AI computing module. The ZED 2 camera was used to obtain an RGB image and a depth point cloud of the flowers in real-time, and the Jetson TX2 computing module processed the RGB image of flowers and obtained the plane position of the flowers by the trained CNN model, transferred from the computer. The spatial location of the flowers was obtained by matching the RGB image and the depth point cloud obtained by the ZED 2 camera. Due to the RGB and depth image having different dimensions and resolutions, the resolutions of the RGB image and depth image were both set up as 1080P@30FPS with the right-hand coordinate system. With this mode, the ZED has the balance between depth accuracy and processing time [32].

2.3.1. Plane Location Based on the YOLO V4-Tiny Detection Result

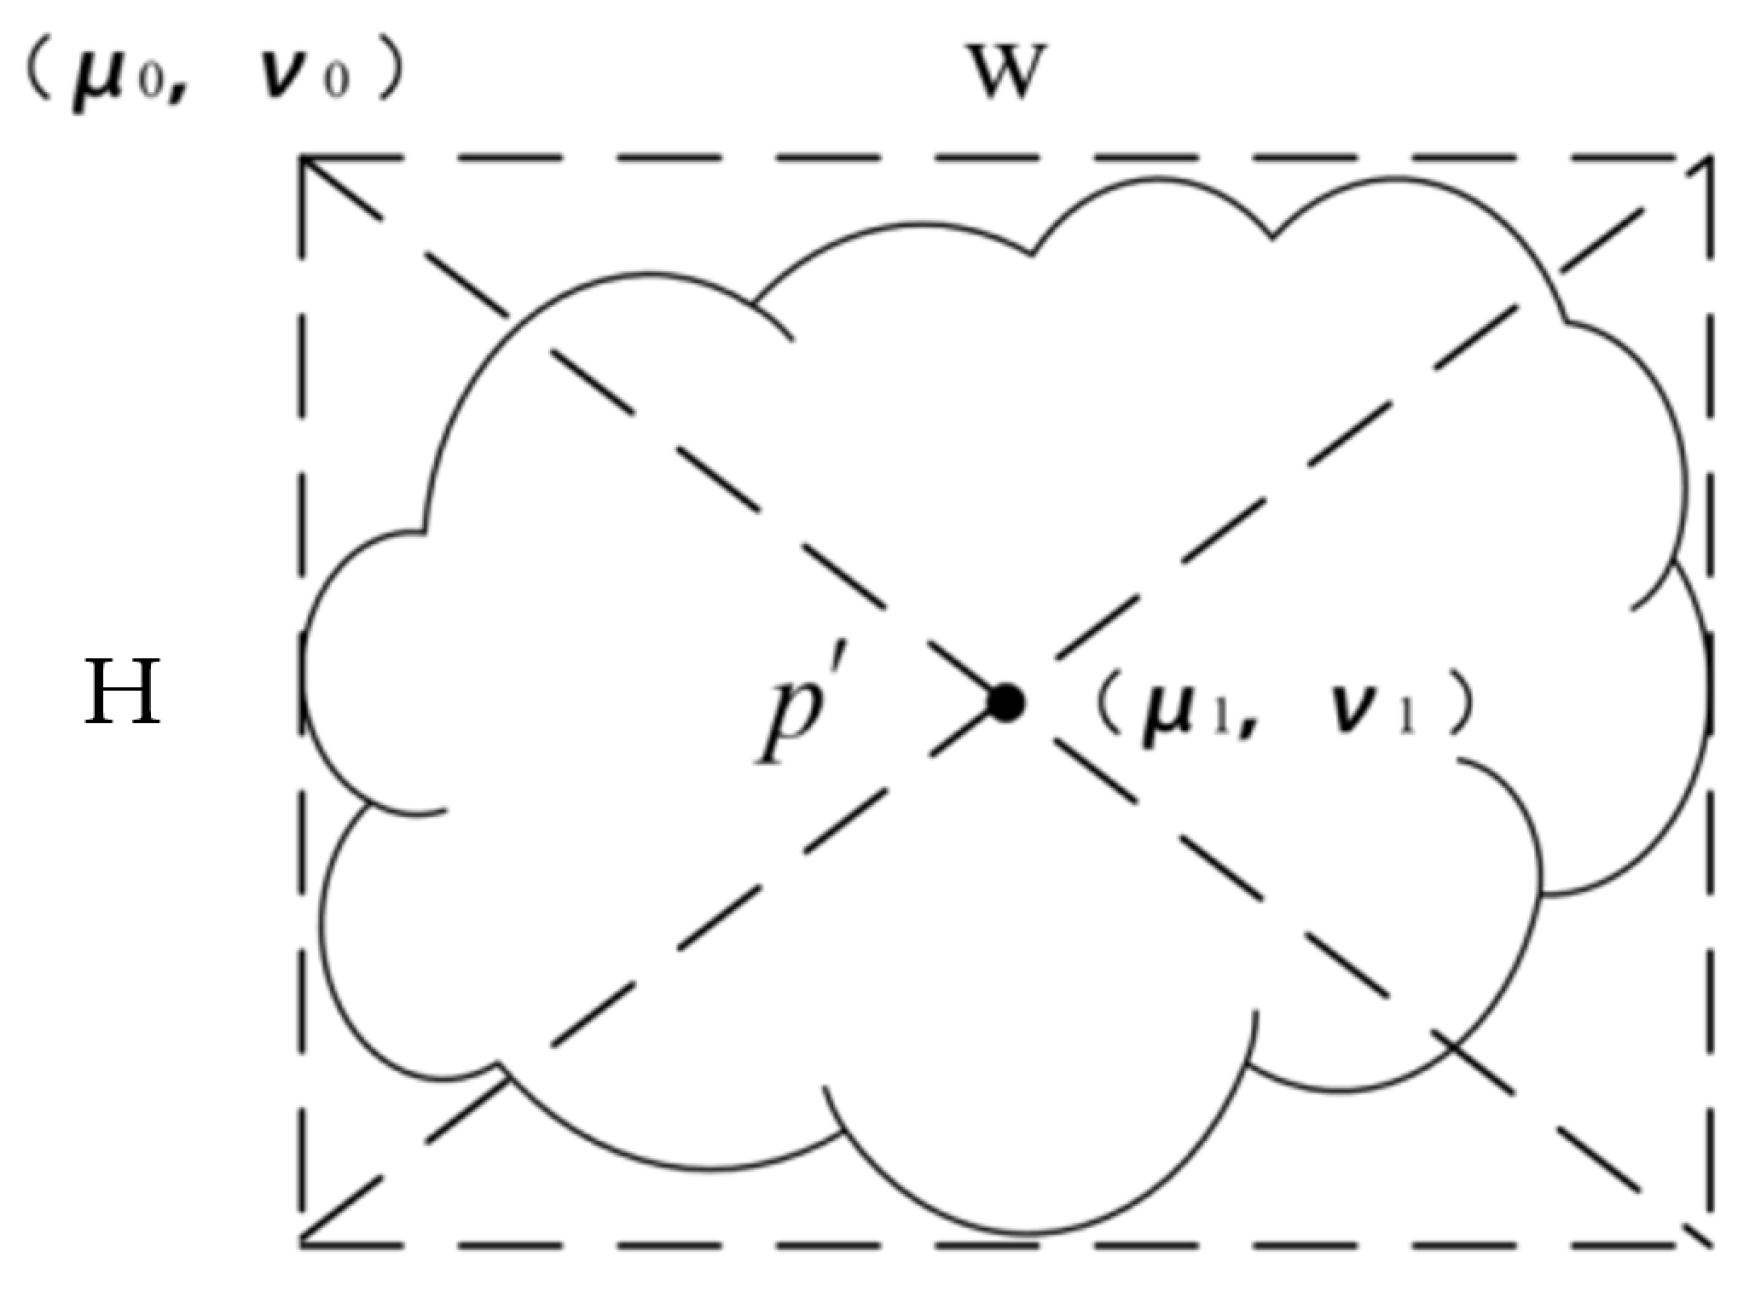
Due to the canopy of the cyclamen and poinsettia being approximately round or elliptic, and the prediction box of the flowers obtained by YOLO V4-Tiny was close to the outline of the flowers. Therefore, the center point of the prediction box obtained by the YOLO V4-Tiny can be used as the central coordinate of flowers in the plane coordinate. Figure 5 is the plane relation of the flower central coordinate. The point ( μ 0 ,   v 0 ) is the vertex coordinate of the prediction box detected by the YOLO V4-Tiny model, and W and H are the width and height of the prediction box, respectively. Accordingly, the center point coordinate p ( μ 1 ,   v 1 ) can be calculated as
μ 1 = μ 0 + W / 2 v 1 = v 0 + H / 2

2.3.2. Spatial Location Based on the ZED 2 Stereo Camera

With the depth sensor of the ZED 2 camera to obtain the 3D point cloud of the flower. The spatial corresponding relationship between the pixel plane of the flowers and the camera is shown in Figure 6. p ( x , y , z ) are the spatial coordinates of the central point of the flower canopy. With the center point coordinate p ( u 1 ,   v 1 ) analyzed by the YOLO V4-Tiny detection method, the pixel plane of the point cloud can be obtained by matching the RGB image and the depth point cloud, and the corresponding depth of the central point can be obtained. More specifically, the position of the flower can be converted to the spatial coordinates p ( x , y , z ) with the camera’s left lens as the origin.

2.4. Detection Accuracy Affected by a Different Overlap Ratio

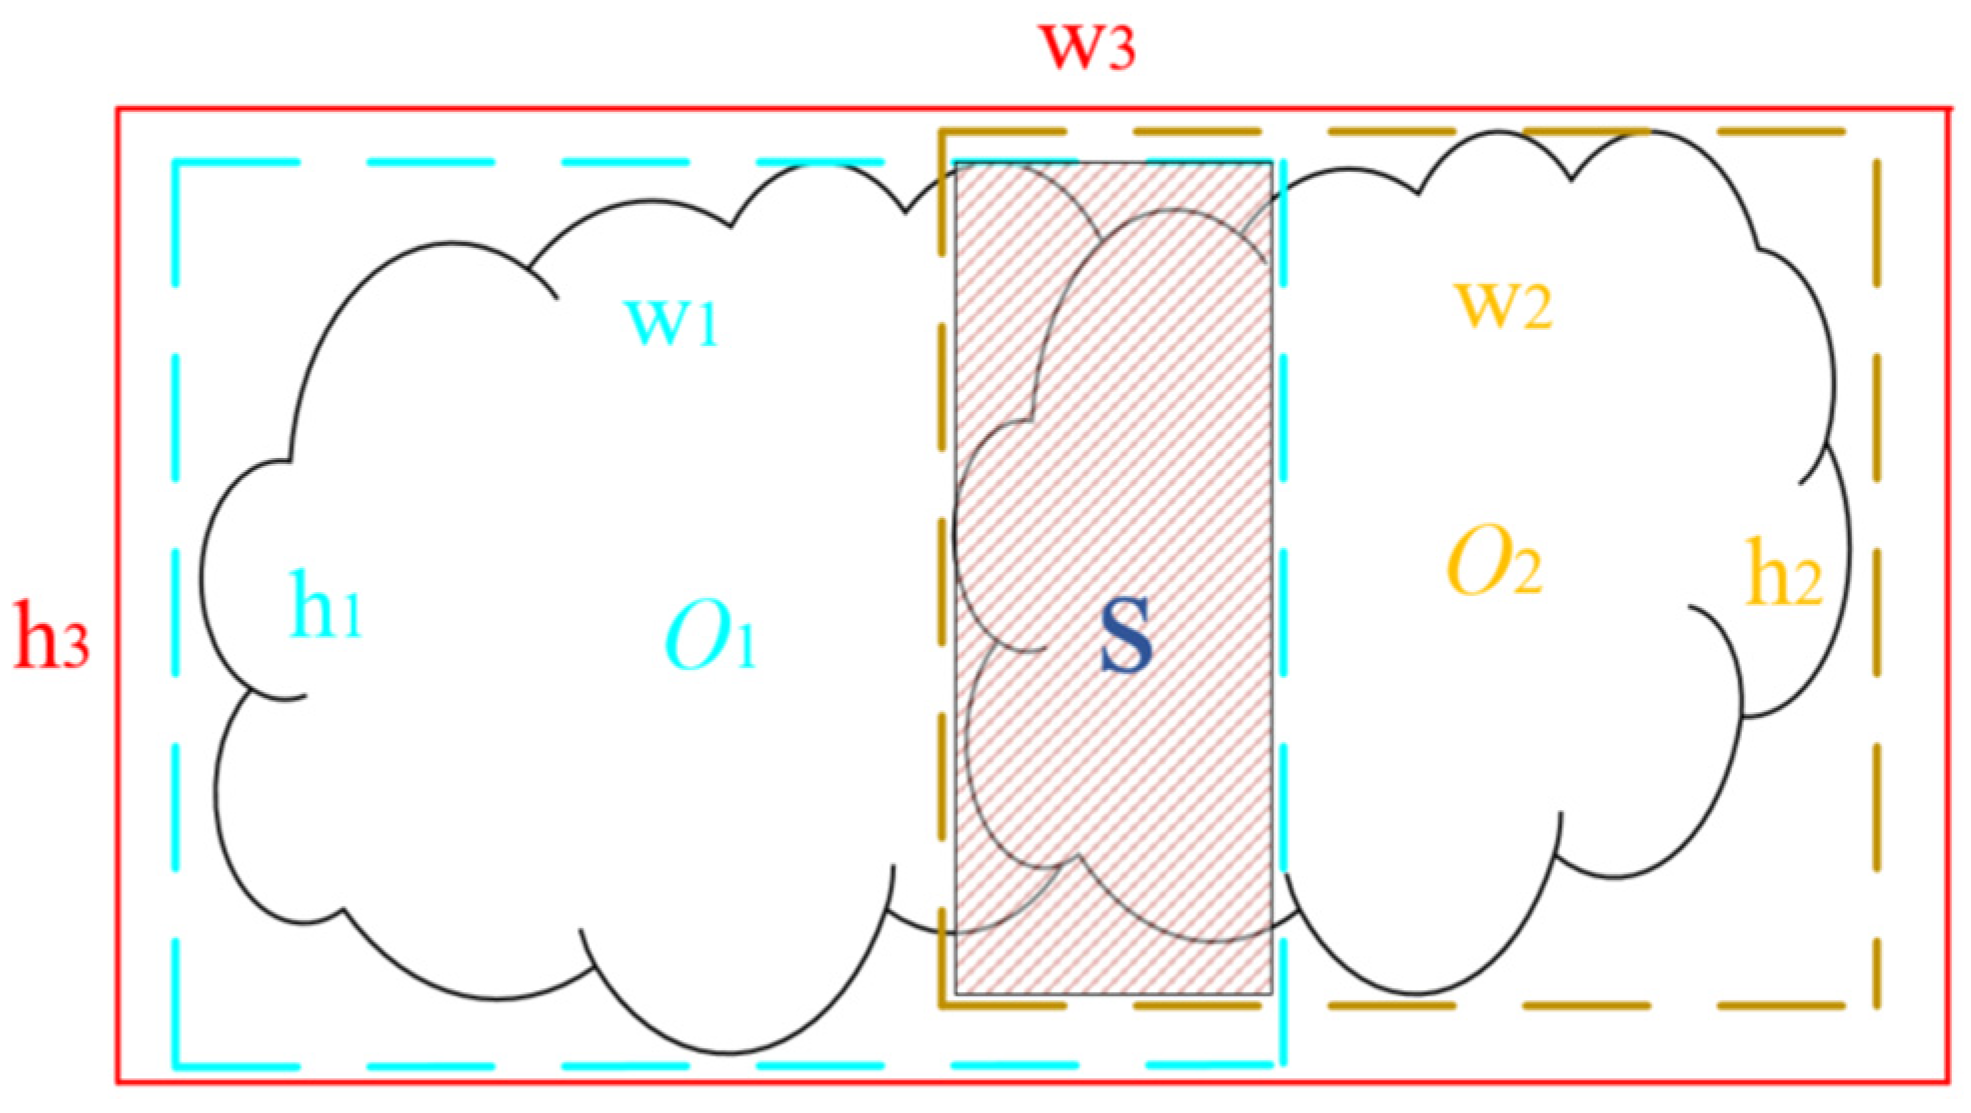
With the growth of flowers, the plant canopy experiences an overlapping of each other. The overlap ratio affects the accuracy of the detection result. Figure 7 shows the overlapped flowers. The widths and the heights of the two flowers’ canopy are w1, w2, h1, and h2, respectively, and w3 and h3 are the total width and height of the two flowers. The overlap ratio (s) is defined as
s = ( 1 w 3 × h 3 w 1 × h 1 + w 2 × h 2 ) × 100 %
In order to determine the minimum distance of the two flowers, by adjusting the distance between the two flowers, when the two potted flowers were detected as one potted flower, the distance between the two flowers was defined as the minimal distance between the two potted flowers, and the s calculated by Equation (2) is the maximal overlap degree.

2.5. Detection Accuracy Affected by Natural Light

The detection of the flowers by the ZED 2 camera was implemented in the greenhouse. The radiation of the natural environment affects the detection and location accuracy. In order to obtain the effect of the radiation, by using the ZED 2 camera and Jetson TX2, the detection and location results for 15 pots of flowers at 9:00, 13:00, 15:00, and 17:00, in the greenhouse as well as the radiation density, were collected by LightScout quantum light sensor 3668I (Spectrum Tech., Inc., Haltom, TX, USA) at the same time.

3. Results

3.1. Training Results of the YOLO V4-Tiny Model

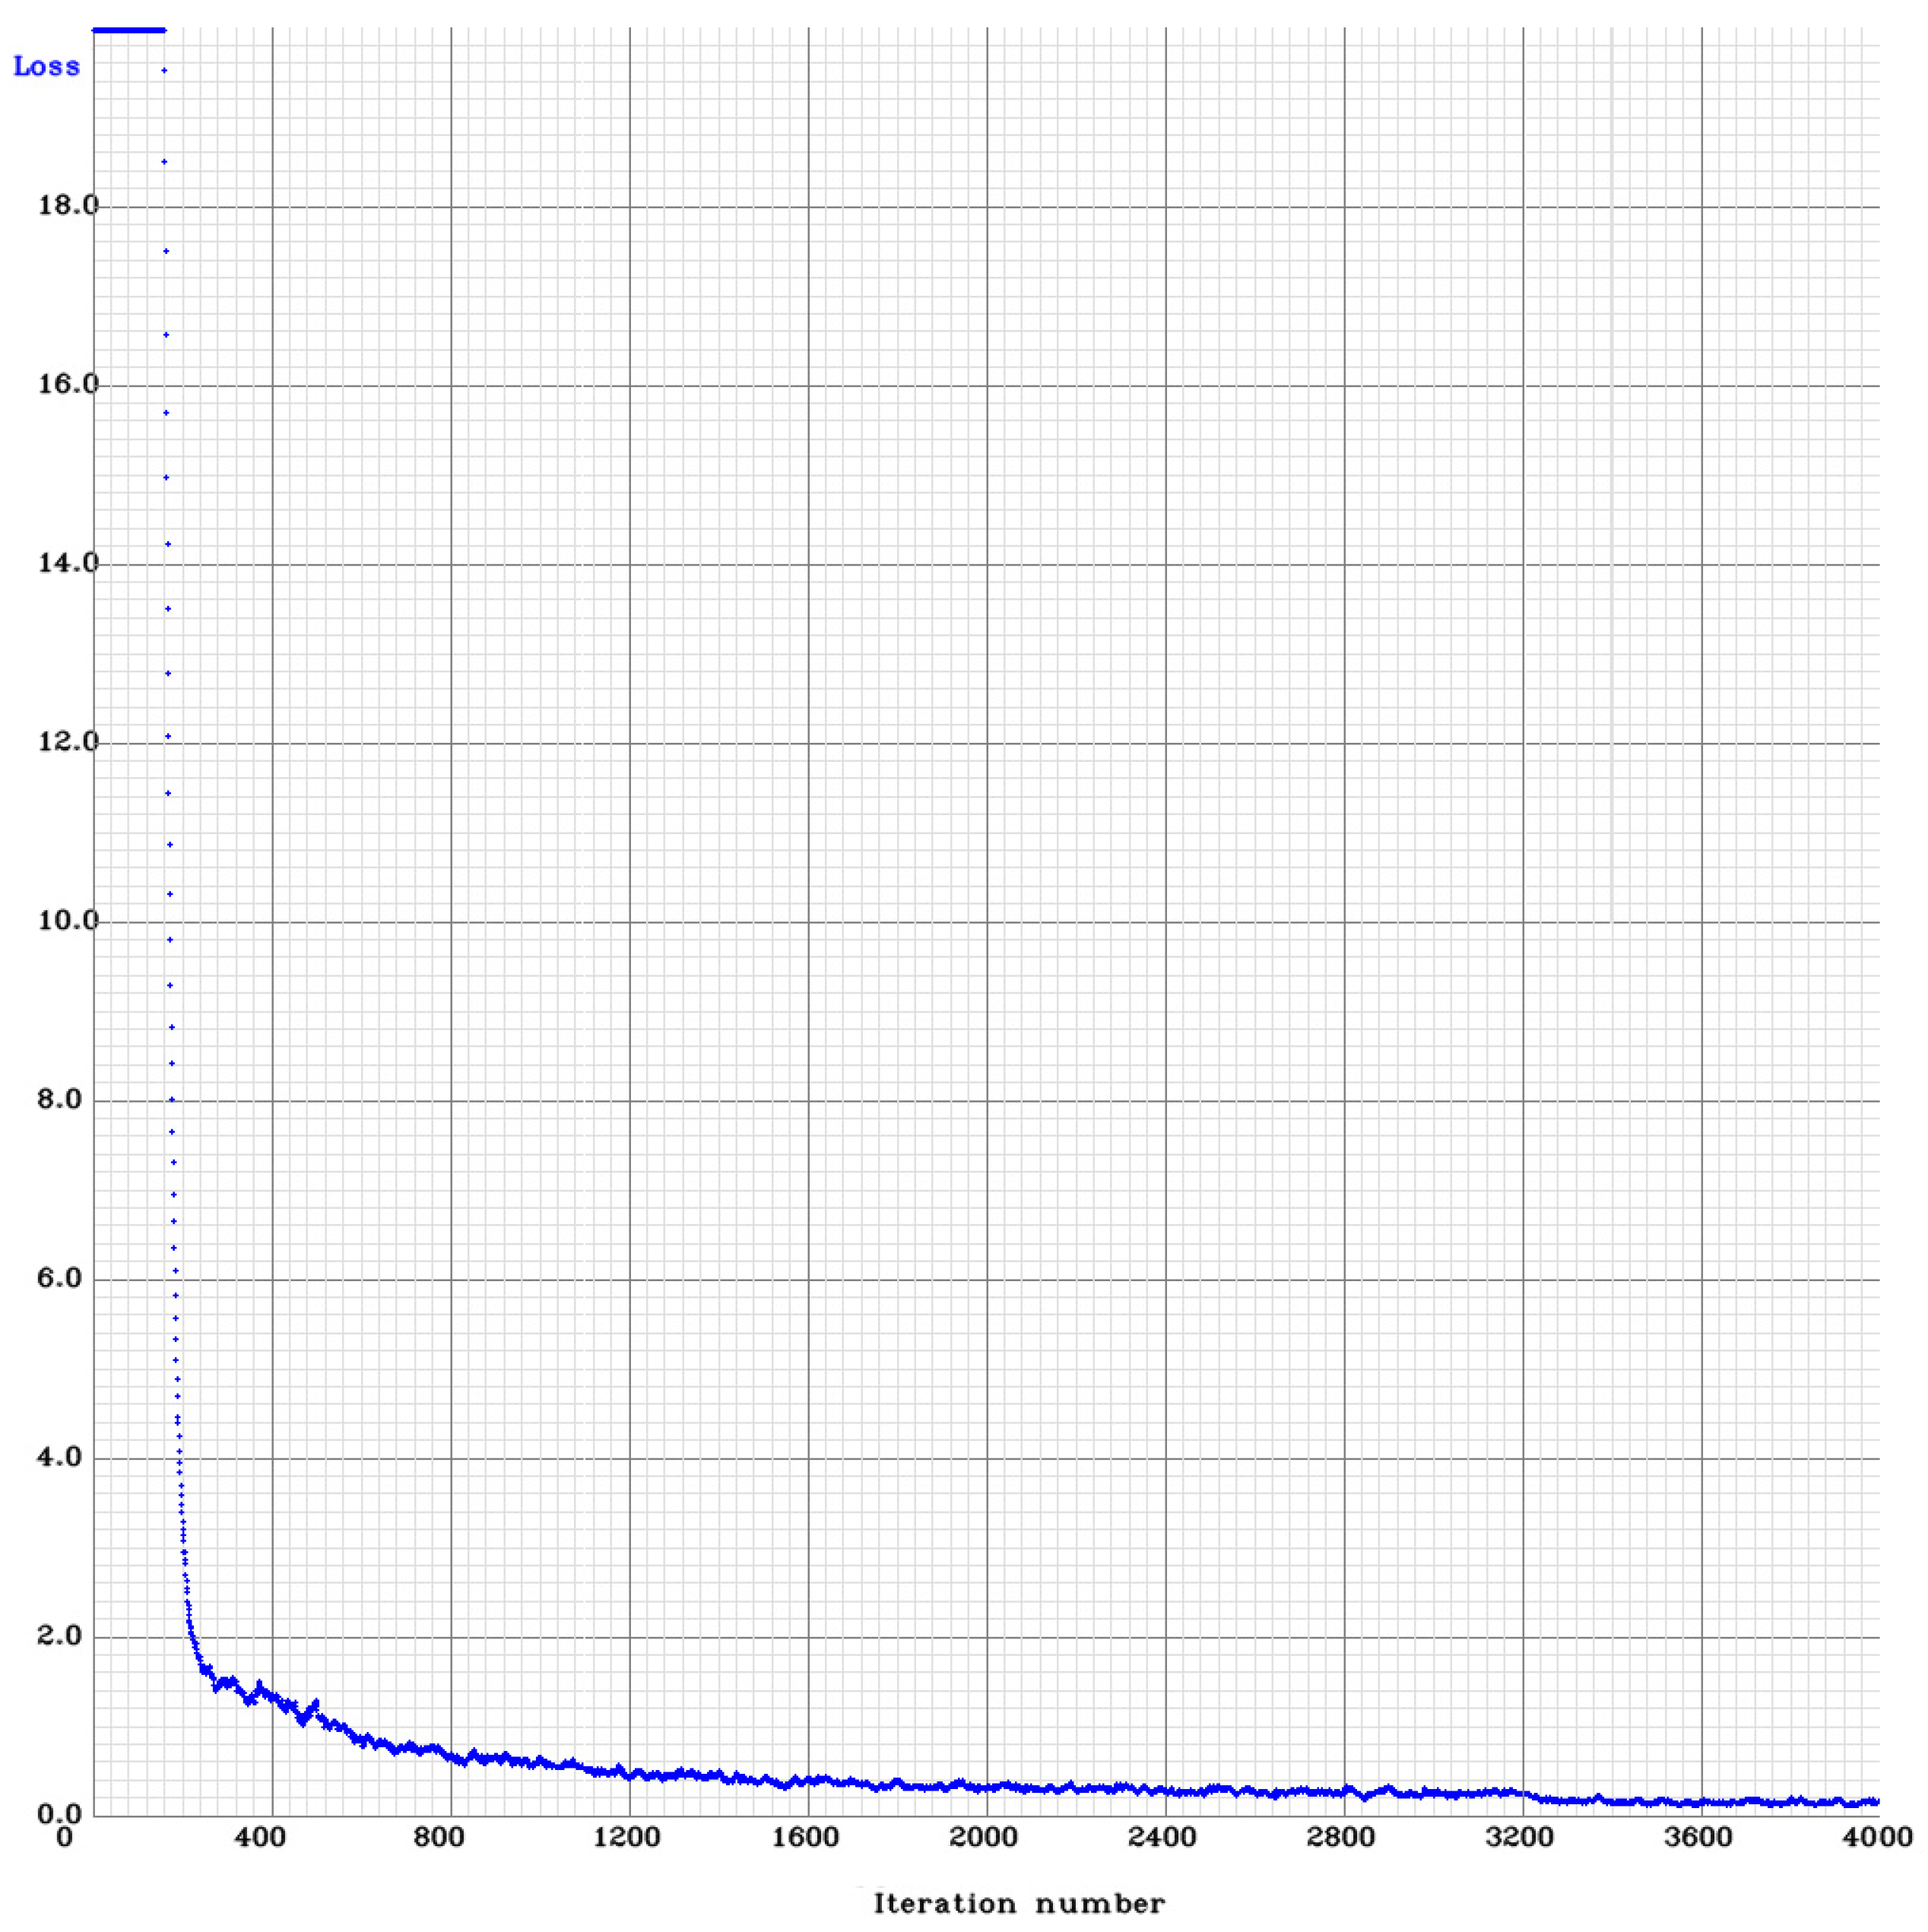
The results of the CNN model training after 4000 iteration steps are shown in Figure 8. when the number of training iterations reaches about 3200, the Loss fluctuated slightly around 0.2. Performance statistics were conducted for the weight of training completion, the results are shown in Table 1, mainly including the detection average precision (AP), recall, intersection over union (IoU), and mean average precision (mAP) under the threshold mAP@IoU = 0.50. The training results meet the detection accuracy requirements.
By transferring the trained CNN model to the Jetson TX2 computing module and collecting the RGB flower images by the ZED 2 camera, the average detection frame rate reached 16 FPS (frames per second). The result was greater than 12 FPS [35], which meets the real-time requirements.

3.2. Spatial Location Results

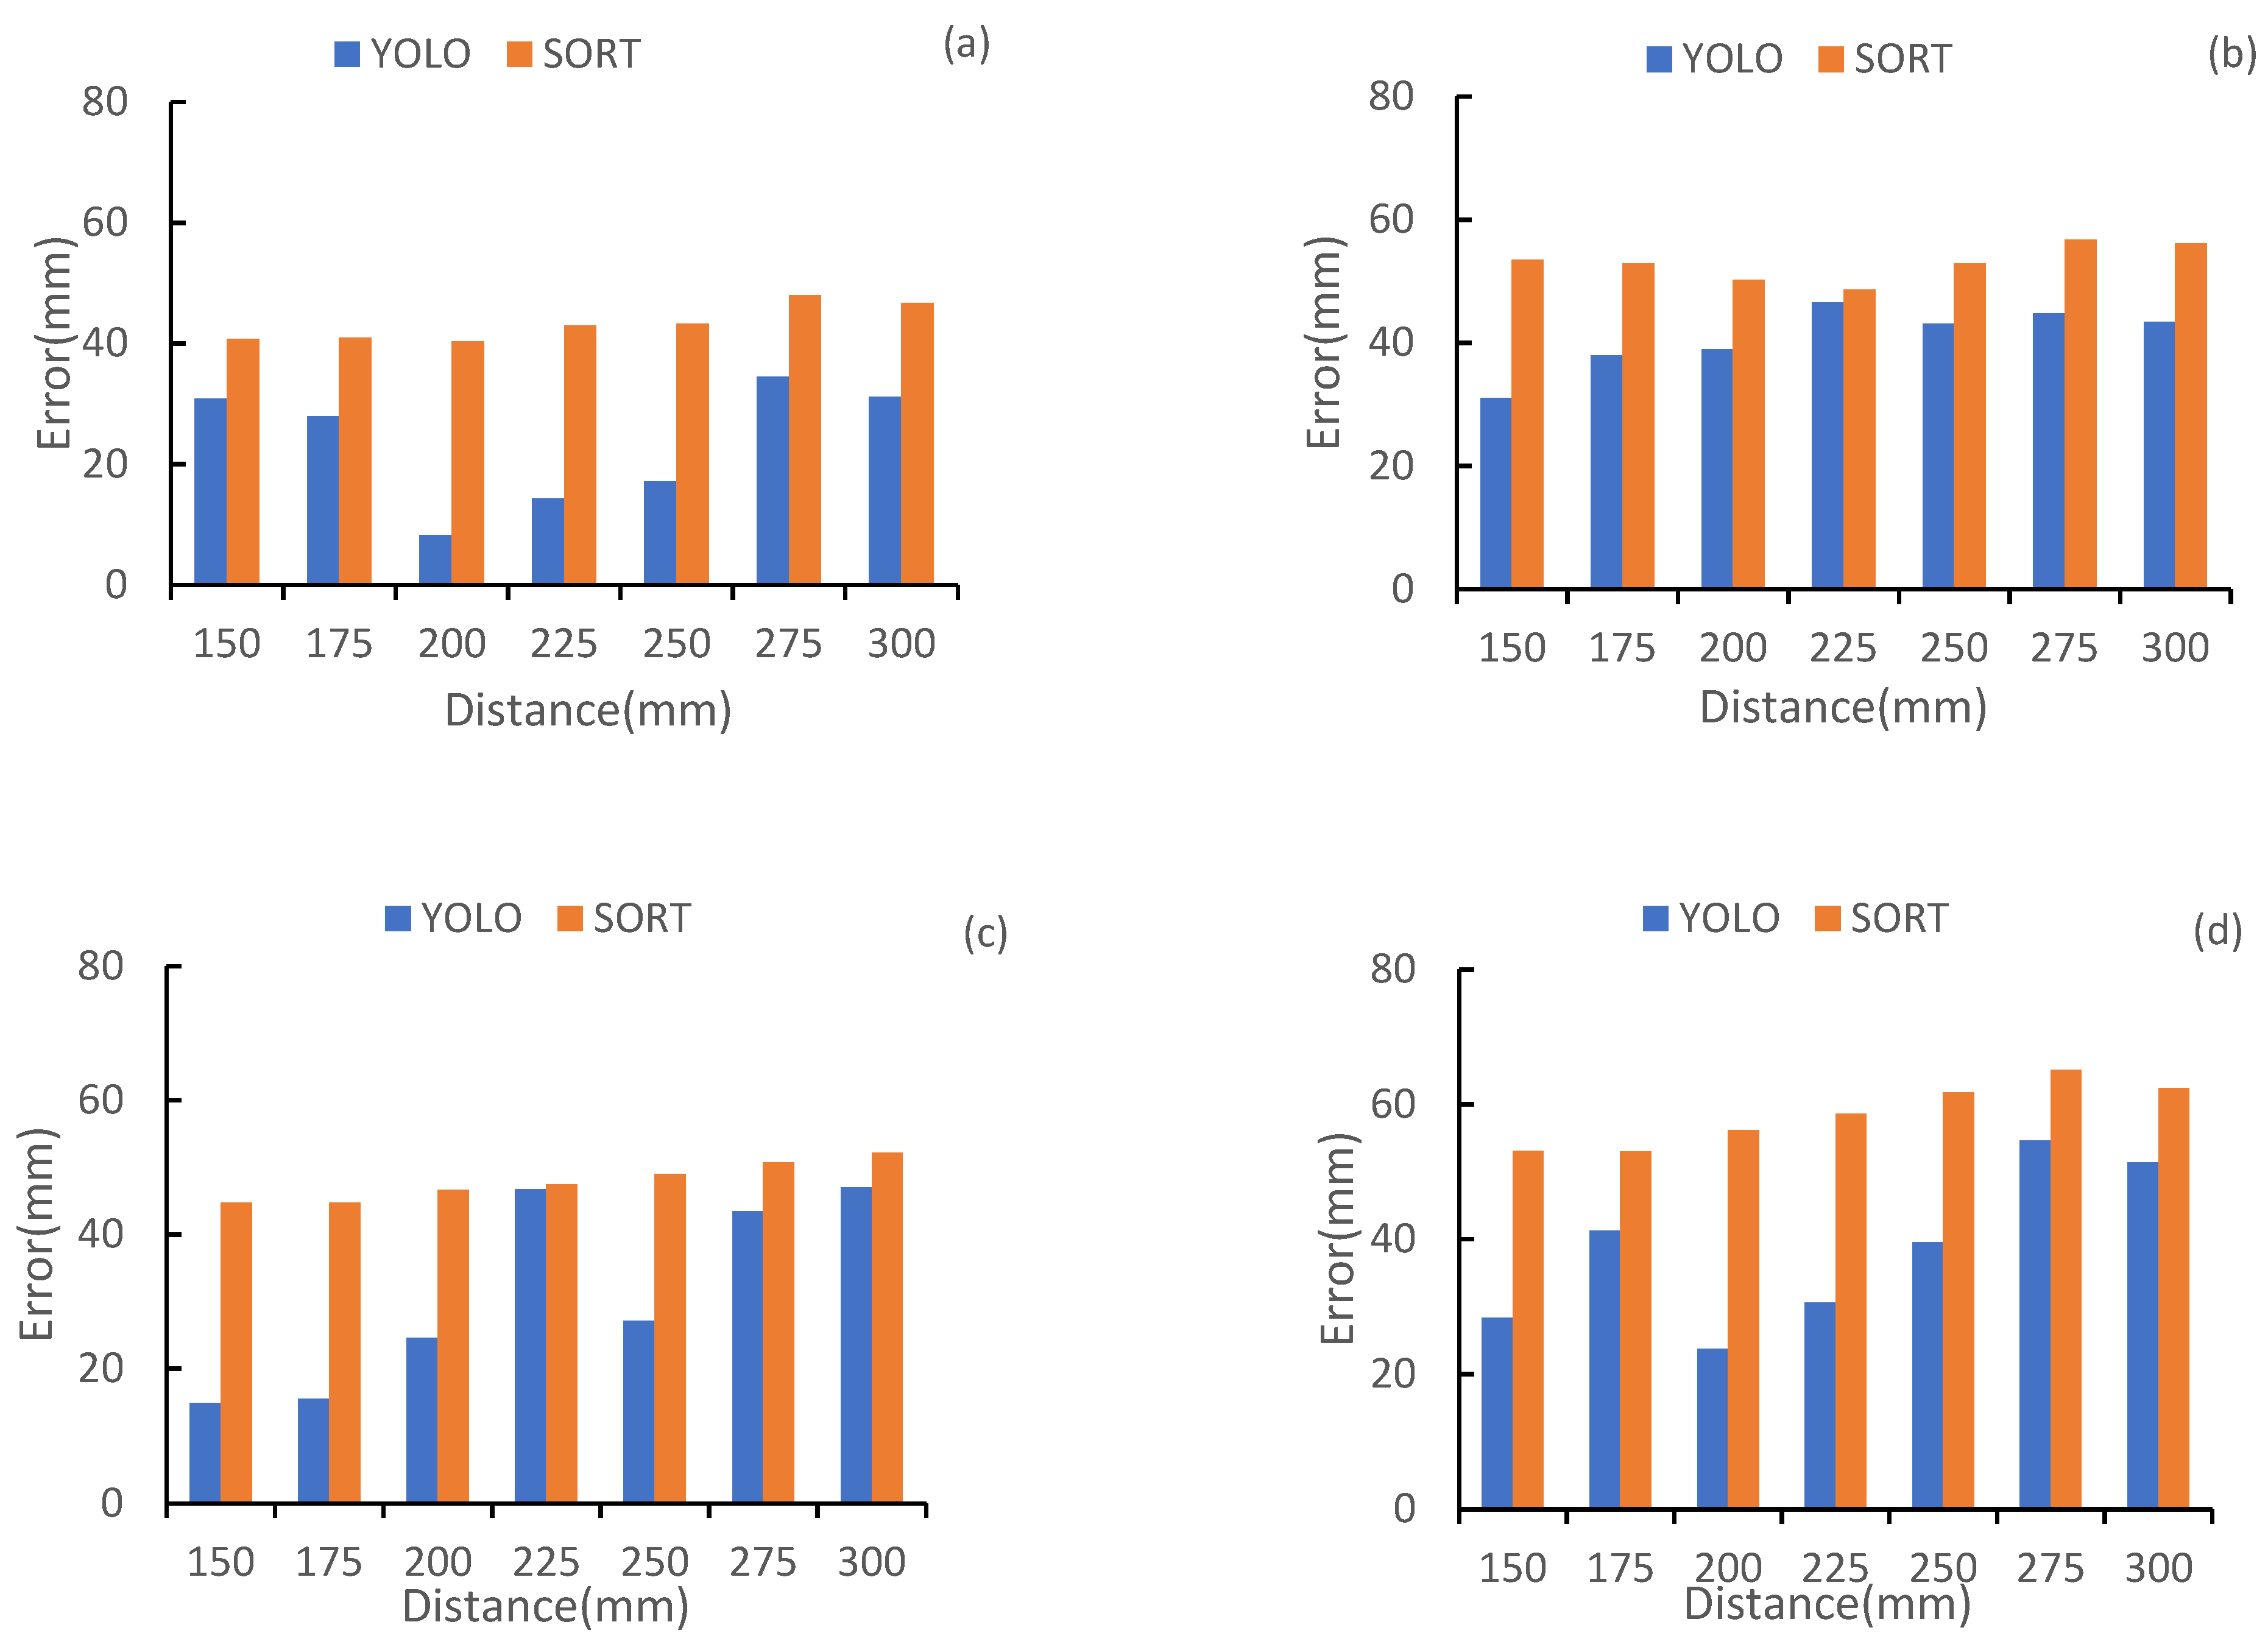
In order to determine the spatial location results of the method based on CNN model, The SORT (Simple online and real-time tracking) model [36] was used to compare the location accuracy. Figure 9 is the y-direction location results of the two models with the y-direction distance from 150mm to 300 mm, and the z-direction distance from 115 to 130 mm. The average location error of YOLO model at different z-direction distances is 23.41 mm, 31.34 mm, 40.8 mm, and 38.47 mm, respectively; and the average location error of SORT model is 43.27 mm,47.91 mm, 53.00 mm, and 58.58 mm, respectively. The results show that the location accuracy of the YOLO model is obviously high than the SORT model. The variations of the YOOL model with different z-direction distances is indicated that the crop height affects the location accuracy.

3.3. Detection Results of Different Overlap Ratio

The minimum distance between flowers and the canopy overlap ratio (s) is shown in Figure 10. The minimum distance between flowers for the detection was 18–27 cm, with an average value of 23 cm. The maximum overlap ratio of the flower canopy ranged from 10.7% to 28.92%, with an average value of 17.42%. Therefore, for the poinsettias and cyclamens, false detection will occur when the canopy overlap ratio is over 10%. For mature cyclamens and poinsettias, the minimum distance between two pots of flowers should be 27 cm to prevent false detection.

3.4. Detection and Location Results with Different Lights

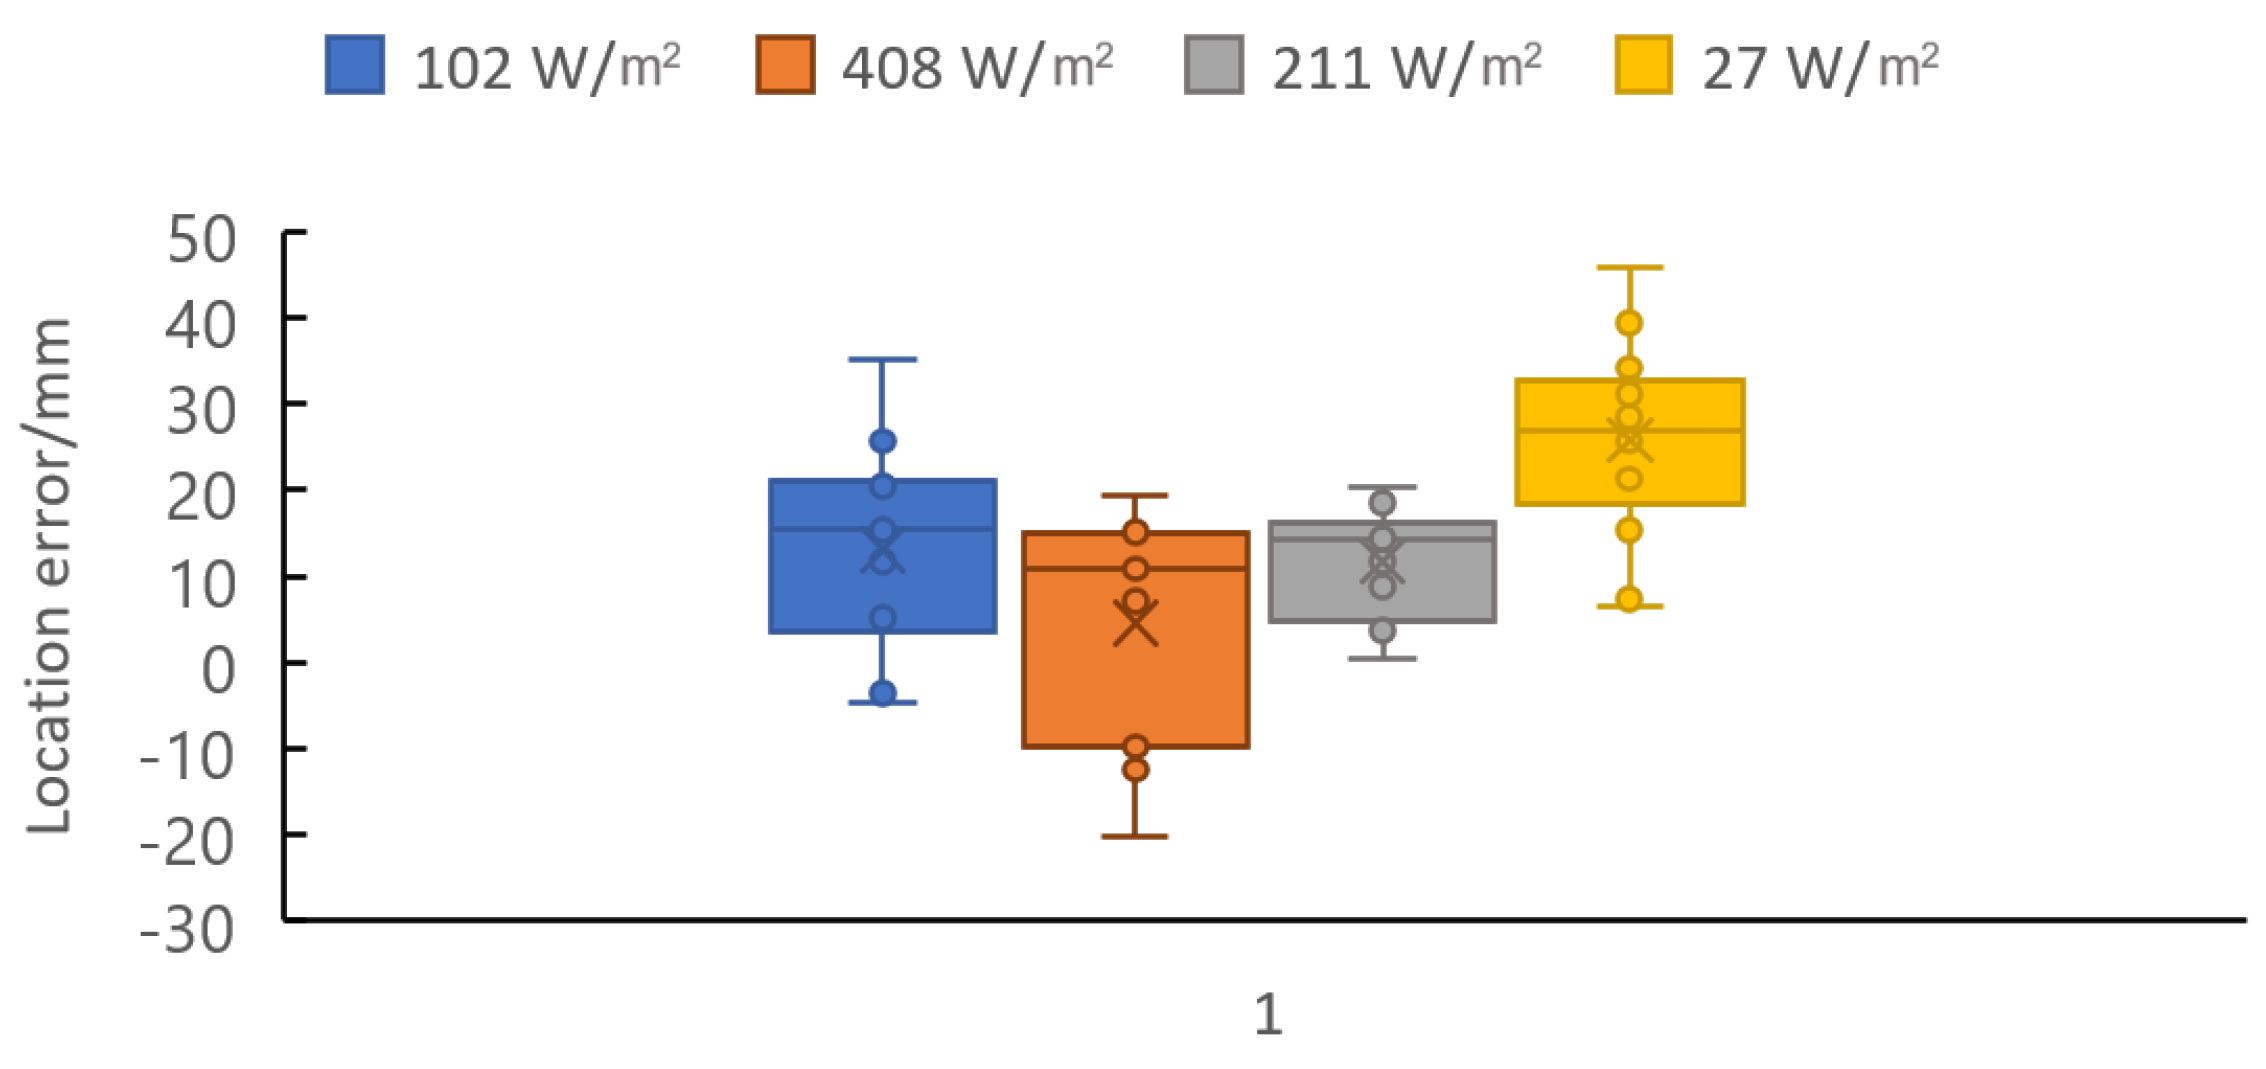
Table 2 shows the detection results with varying levels of radiation. In the greenhouse test, the radiation was 102, 408, 211, and 27 W/m2 at 9:00, 13:00, 15:00, and 17:00 of 31 March 2021, respectively. Table 2 shows the detection results with varying levels of radiation. When the radiation is 27 W/m2, two pots of flowers are not detected; when the radiation is 102 W/m2, one pot of flowers is not detected. When the radiation is higher than 200 W/m2, all flowers can be detected. Figure 11 shows the location results with varying levels of radiation. The average location errors are 25.8, 13.1, 11.7, and 4.6 mm, respectively. The results show that detection and location accuracy gradually increase with radiation, and there will be missed detection at low radiation. Therefore, the working time for flower detection and location is from 9:00 to 16:00 with higher radiation.

4. Discussion

In a floriculture greenhouse, the detection and location of the potted flowers are affected by the natural environment and the density of the flower. Meanwhile, real-time detection and location are important for machinery and automatic management. In this study, we established a method for the real-time detection and location of potted flowers based on the ZED 2 camera and the YOLO V4-Tiny deep learning algorithm.
At present, real-time detection and location methods based on machine vision are mainly focused on the detection of crops [8,12,37], but real-time location [34,38]. In this study, the real-time detection and location of flowers were preliminarily established by using a YOLO V4-TINY algorithm as a detection algorithm. With the training result, the CNN model was transferred to the edge computing module Jetson TX2 to realize the flower detection and location. Compared with other CNN models, YOLO V4-Tiny has a fast detection speed and a high detection accuracy [25]. It also ensures the simplification of the model, making it easy to transfer in real-time computing on a mobile terminal [39]. Secondly, to improve the real-time performance, the Jetson TX2 AI computing module was adopted as the running environment [40]. Finally, to obtain real-time RGB and depth information about the flowers, we used a ZED 2 camera to collect 3D point clouds of the flowers in real-time, and the ZED 2 matched the RGB and 3D point clouds automatically [32]. With these methods and devices, the average detection frame rate could reach 16 FPS, greater than 12 FPS, which is considered the highest frame rate in real-time camera tracking [35]. Therefore, the accuracy and real-time performance of the system can match the requirements for the detection and location for precise management.
In the process of flower detection and location, in addition to a real-time performance, the accuracy of detection and location is also important. Positioning accuracy determines the quality of the detection and location. Lee et al. (2017) proposed a method for identifying and retrieving flower species in a natural environment based on multi-layer technology, identifying different types of flowers through color, texture, and shape characteristics. After testing, the image recognition rate was 91.26% [41]. Tian et al. (2019) detected apple flowers with a Single Shot MultiBox Detector (SSD) algorithm, with an average detection accuracy of 87.40% [42]. Yamamoto et al. (2014) proposed a method that combines RGB digital cameras and machine learning to identify tomato fruits. The identification accuracy rate was 80% after testing [43]. The above research shows that the accuracy of the current algorithm for flower detection is mostly between 80% and 95%. The experimental results of our study show an accuracy of 89.72%, and performance was improved in terms of detection accuracy. With the detection results of the CNN model, by matching between the RGB image and 3D point clouds for the spatial location, the average error of the location was less than 40 mm in different crop heights. and the comparison results with the SORT method show that the YOLO model has obviously higher accuracy. By using the CNN detection model, the flower canopy width, the number of the flower of each plant can be obtained, and with the depth image, the morphosis of the flower can be analyzed [44]. These results can be used to realize the phenotyping analysis of the flower for the detection of the growth status, quality, and grading for the floriculture. And the robot or manipulator could be developed with the detection, location, and grading results to realize the precision and unmanned management [45].
To improve the detection and location accuracy, influencing factors of the natural environment were determined. The results show that the accuracy of detection and location was affected when the light was weak. Thus, the operation can be implemented under sufficient light conditions or using supplement light [46]. Regarding the distance and canopy overlap between the two flowers, when the overlap ratio exceeded 10%, the minimum distance required for the two flowers to avoid false detection was 27 cm. Moreover, for the poinsettia and cyclamen culture, the distance between each flower on the bench was 30 cm [47,48,49], so this method meets the requirements for potted flower detection.

5. Conclusions

In this study, a potted flower detection and location method based on the ZED 2 stereo camera and a CNN deep learning model was proposed. The CNN model based on YOLO V4-Tiny was used to detect the flowers. With the detection results, by using RGB images and 3D point clouds collected by the ZED 2 stereo camera, the spatial location of the flowers was implemented. With the Jason TX 2 computing module, real-time and accurate detection and location were achieved, and the results show that the system has sufficient detection and location accuracy, an acceptable real-time tracking frame rate, and an appropriate distance and canopy overlap ratio for natural environments with potted flower cultures. It provides a detection and location method for machinery and automatic management for floriculture.
Although the CNN model was realized for flower detection and location, we considered only two types of flowers with similar canopy styles. It is necessary to train this model with other flowers, different growth backgrounds, lighting conditions to improve the model performance. However, with the Jenson TX2 AI computing device, by transferring the CNN model trained by the computer to achieve deep learning model construction, the learning ability is limited. In the future, by combining cloud computing with edge computing, a cloud-edge collaborative framework can achieve real-time and automatic learning for flower detection and location [39,50].

Author Contributions

Conceptualization, J.W. (Jizhang Wang); methodology, Y.Z. and Z.G.; software, Y.Z.; writing—original draft preparation, J.W. (Jizhang Wang), Z.G., and Y.Z.; writing—review and editing, J.Z., J.W. (Jianzhi Wu), and P.L. All authors have read and agreed to the published version of the manuscript.

Funding

This work was supported by the Funding for Key R&D Programs in Jiangsu Province (BE2018321) and a project funded by the Priority Academic Program Development of Jiangsu Higher Education Institutions (No. PAPD-2018-87).

Institutional Review Board Statement

Not applicable.

Informed Consent Statement

Not applicable.

Data Availability Statement

The data presented in this study are available on demand from the first author at [email protected].

Conflicts of Interest

The authors declare that there is no conflicts of interest.

References

  1. Adebayo, I.A.; Pam, V.K.; Arsad, H.; Samian, M.R. The Global Floriculture Industry: Status and Future Prospects. In The Global Floriculture Industry: Shifting Directions, New Trends, and Future Prospects, 1st ed.; Hakeem, K.R., Ed.; Apple Academic Press: New York, NY, USA, 2020. [Google Scholar]
  2. Laura, D. Floriculture’s Future Hangs in the Balance between Labor and Technology. Available online: https://www.greenhousegrower.com/management/top-100/floricultures-future-hangs-in-the-balance-between-labor-and-technology/ (accessed on 5 November 2021).
  3. Jin, Y.C.; Liu, J.Z.; Xu, Z.J.; Yuan, S.Q.; Li, P.P.; Wang, J.Z. Development status and trend of agricultural robot technology. Int. J. Agric. Biol. Eng. 2021, 14, 1–19. [Google Scholar] [CrossRef]
  4. Jin, B.K. The Direction of Management Development of American Flower Growers in Response to Globalization: Potted Flowering Plants Growers of Salinas, California. Agric. Mark. J. Jpn. 2009, 18, 889–901. [Google Scholar]
  5. Soleimanipour, A.; Chegini, G.R. A vision-based hybrid approach for identification of Anthurium flower cultivars. Comput. Electron. Agric. 2020, 174, 105460. [Google Scholar] [CrossRef]
  6. Aleya, K.F. Automated Damaged Flower Detection Using Image Processing. J. Glob. Res. Comput. Sci. 2013, 4, 21–24. [Google Scholar]
  7. Islam, S.; Foysal, M.F.A.; Jahan, N. A Computer Vision Approach to Classify Local Flower using Convolutional Neural Network. In Proceedings of the 2020 4th International Conference on Intelligent Computing and Control Systems (ICICCS), Madurai, India, 13–15 May 2020. [Google Scholar]
  8. Sethy, P.K.; Routray, B.; Behera, S.K. Detection and Counting of Marigold Flower Using Image Processing Technique. In Advances in Computer, Communication and Control; Biswas, U.B.A., Pal, S., Biswas, A., Sarkar, D., Haldar, S., Eds.; Springer: Singapore, 2019; Volume 41, pp. 87–93. [Google Scholar]
  9. Guo, H. Research of Lilium Cut Flower Detecting System Based on Machine Vision. Mech. Eng. 2016, 10, 217–220. [Google Scholar]
  10. Shen, G.; Wu, W.; Shi, Y.; Yang, P.; Zhou, Q. The latest progress in the research and application of smart agriculture in China. China Agric. Inform. 2018, 30, 1–14. [Google Scholar]
  11. Zhuang, J.J.; Luo, S.M.; Hou, C.J.; Tang, Y.; He, Y.; Xue, X.Y. Detection of orchard citrus fruits using a monocular machine vision-based method for automatic fruit picking applications. Comput. Electron. Agric. 2018, 152, 64–73. [Google Scholar] [CrossRef]
  12. Horton, R.; Cano, E.; Bulanon, D.; Fallahi, E. Peach Flower Monitoring Using Aerial Multispectral Imaging. J. Imaging 2017, 3, 2. [Google Scholar] [CrossRef]
  13. Aggelopoulou, A.D.; Bochtis, D.; Fountas, S.; Swain, K.C.; Gemtos, T.A.; Nanos, G.D. Yield prediction in apple orchards based on image processing. Precis. Agric. 2011, 12, 448–456. [Google Scholar] [CrossRef]
  14. Sarkate, R.S.; Kalyankar, N.V.; Khanale, P.B. Application of computer vision and color image segmentation for yield prediction precision. In Proceedings of the 2013 International Conference on Information Systems and Computer Networks (ISCON), Mathura, India, 9–10 March 2013. [Google Scholar]
  15. Zhao, C.Y.; Lee, W.S.; He, D.J. Immature green citrus detection based on colour feature and sum of absolute transformed difference (SATD) using colour images in the citrus grove. Comput. Electron. Agric. 2016, 124, 243–253. [Google Scholar] [CrossRef]
  16. Mavridou, E.; Vrochidou, E.; Papakostas, G.A.; Pachidis, T.; Kaburlasos, V.G. Machine Vision Systems in Precision Agriculture for Crop Farming. J. Imaging 2019, 5, 89. [Google Scholar] [CrossRef] [Green Version]
  17. Rehman, T.U.; Mahmud, M.S.; Chang, Y.K.; Jin, J.; Shin, J. Current and future applications of statistical machine learning algorithms for agricultural machine vision systems. Comput. Electron. Agric. 2018, 156, 585–605. [Google Scholar] [CrossRef]
  18. Grimm, J.; Herzog, K.; Rist, F.; Kicherer, A.; Toepfer, R.; Steinhage, V. An adaptable approach to automated visual detection of plant organs with applications in grapevine breeding. Biosyst. Eng. 2019, 183, 170–183. [Google Scholar] [CrossRef]
  19. Rahnemoonfar, M.; Sheppard, C. Deep Count: Fruit Counting Based on Deep Simulated Learning. Sensors 2017, 17, 905. [Google Scholar] [CrossRef] [Green Version]
  20. Tan, W.X.; Zhao, C.J.; Wu, H.R. Intelligent alerting for fruit-melon lesion image based on momentum deep learning. Multimed. Tools Appl. 2016, 75, 16741–16761. [Google Scholar] [CrossRef]
  21. Williams, H.A.M.; Jones, M.H.; Nejati, M.; Seabright, M.J.; Bell, J.; Penhall, N.D.; Barnett, J.J.; Duke, M.D.; Scarfe, A.J.; Ahn, H.S.; et al. Robotic kiwifruit harvesting using machine vision, convolutional neural networks, and robotic arms. Biosyst. Eng. 2019, 181, 140–156. [Google Scholar] [CrossRef]
  22. Redmon, J.; Farhadi, A. YOLOv3: An Incremental Improvement. arXiv 2018, arXiv:1804.02767. [Google Scholar]
  23. Bochkovskiy, A.; Wang, C.Y.; Liao, H. YOLOv4: Optimal Speed and Accuracy of Object Detection. arXiv 2020, arXiv:2004.10934. [Google Scholar]
  24. Redmon, J.; Divvala, S.; Girshick, R.; Farhadi, A. You Only Look Once: Unified, Real-Time Object Detection. In Proceedings of the 2016 IEEE Conference on Computer Vision and Pattern Recognition (Cvpr), Las Vegas, NV, USA, 27–30 June 2016; pp. 779–788. [Google Scholar]
  25. Wu, D.H.; Lv, S.C.; Jiang, M.; Song, H.B. Using channel pruning-based YOLO v4 deep learning algorithm for the real-time and accurate detection of apple flowers in natural environments. Comput. Electron. Agric. 2020, 178, 105742. [Google Scholar] [CrossRef]
  26. Chang, Y.-W.; Hsiao, Y.-K.; Ko, C.-C.; Shen, R.-S.; Lin, W.-Y.; Lin, K.-P. A Grading System of Pot-Phalaenopsis Orchid Using YOLO-V3 Deep Learning Model; Springer International Publishing: Cham, Switzerland, 2021; pp. 498–507. [Google Scholar]
  27. Cheng, Z.B.; Zhang, F.Q. Flower End-to-End Detection Based on YOLOv4 Using a Mobile Device. Wirel. Commun. Mob. Comput. 2020, 2020, 8870649. [Google Scholar] [CrossRef]
  28. Redmon, J.; Farhadi, A. YOLO9000: Better, Faster, Stronger. In Proceedings of the IEEE Conference on Computer Vision & Pattern Recognition 2017, Honolulu, HI, USA, 21–26 July 2017; pp. 6517–6525. [Google Scholar]
  29. Kumar, S.; Gupta, H.; Yadav, D.; Ansari, I.A.; Verma, O.P. YOLOv4 algorithm for the real-time detection of fire and personal protective equipments at construction sites. Multimed. Tools Appl. 2021, 31, 1–21. [Google Scholar] [CrossRef]
  30. Li, X.; Pan, J.; Xie, F.; Zeng, J.; Li, Q.; Huang, X.; Liu, D.; Wang, X. Fast and accurate green pepper detection in complex backgrounds via an improved Yolov4-tiny model. Comput. Electron. Agric. 2021, 191, 106503. [Google Scholar] [CrossRef]
  31. Tran, T.M. A Study on Determination of Simple Objects Volume Using ZED Stereo Camera Based on 3D-Points and Segmentation Images. Int. J. Emerg. Trends Eng. Res. 2020, 8, 1990–1995. [Google Scholar] [CrossRef]
  32. Ortiz, L.E.; Cabrera, E.V.; Goncalves, L. Depth Data Error Modeling of the ZED 3D Vision Sensor from Stereolabs. Electron. Lett. Comput. Vis. Image Anal. 2018, 17, 1–15. [Google Scholar] [CrossRef]
  33. Gupta, T.; Li, H. Indoor mapping for smart cities—An affordable approach: Using Kinect Sensor and ZED stereo camera. In Proceedings of the International Conference on Indoor Positioning & Indoor Navigation 2017, Sapporo, Japan, 18–21 September 2017; pp. 1–8. [Google Scholar]
  34. Varma, V.S.; Adarsh, S.; Ramachandran, K.I.; Nair, B.B. Real Time Detection of Speed Hump/Bump and Distance Estimation with Deep Learning using GPU and ZED Stereo Camera. Procedia Comput. Sci. 2018, 143, 988–997. [Google Scholar] [CrossRef]
  35. Handa, A.; Newcombe, R.A.; Angeli, A.; Davison, A.J. Real-Time Camera Tracking: When is High Frame-Rate Best? Computer Vision—ECCV 2012; Fitzgibbon, A., Lazebnik, S., Perona, P., Sato, Y., Schmid, C., Eds.; Springer: Berlin/Heidelberg, Germany, 2012; pp. 222–235. [Google Scholar]
  36. Wojke, N.; Bewley, A.; Paulus, D. Simple Online and Realtime Tracking with a Deep Association Metric. In Proceedings of the 2017 IEEE International Conference on Image Processing (ICIP), Beijing, China, 17–20 September 2017. [Google Scholar]
  37. Hsu, T.H.; Lee, C.H.; Chen, L.H. An interactive flower image recognition system. Multimed. Tools Appl. 2011, 53, 53–73. [Google Scholar] [CrossRef]
  38. Almendral, K.; Babaran, R.; Carzon, B.; Cu, K.; Lalanto, J.M.; Abad, A.C. Autonomous Fruit Harvester with Machine Vision. J. Telecommun. Electron. Comput. Eng. 2018, 10, 79–86. [Google Scholar]
  39. Ding, S.; Li, L.; Li, Z.; Wang, H.; Zhang, Y.C. Smart electronic gastroscope system using a cloud-edge collaborative framework. Future Gener. Comput. Syst. 2019, 100, 395–407. [Google Scholar] [CrossRef]
  40. Mittal, S. A Survey on optimized implementation of deep learning models on the NVIDIA Jetson platform. J. Syst. Archit. 2019, 97, 428–442. [Google Scholar] [CrossRef]
  41. Lee, H.H.; Hong, K.S. Automatic recognition of flower species in the natural environment. Image Vis. Comput. 2017, 61, 98–114. [Google Scholar] [CrossRef]
  42. Tian, M.; Chen, H.; Wang, Q. Detection and Recognition of Flower Image Based on SSD network in Video Stream. J. Phys. Conf. Ser. 2019, 1237, 032045. [Google Scholar] [CrossRef]
  43. Yamamoto, K.; Guo, W.; Yoshioka, Y.; Ninomiya, S. On plant detection of intact tomato fruits using image analysis and machine learning methods. Sensors 2014, 14, 12191–12206. [Google Scholar] [CrossRef] [PubMed] [Green Version]
  44. Wang, J.; Zhang, Y.; Gu, R. Research Status and Prospects on Plant Canopy Structure Measurement Using Visual Sensors Based on Three-Dimensional Reconstruction. Agriculture 2020, 10, 462. [Google Scholar] [CrossRef]
  45. Maruyama, Y.; Yamaguchi, T.; Nonaka, Y. Planning of Potted Flower Production Conducive to Optimum Greenhouse Utilization. J. Jpn. Ind. Manag. Assoc. 2000, 52, 177–185. [Google Scholar]
  46. Ji, R.; Fu, Z.; Qi, L. Real-time plant image segmentation algorithm under natural outdoor light conditions. N. Z. J. Agric. Res. 2007, 50, 847–854. [Google Scholar] [CrossRef]
  47. Hansheng, H.U.; Zhao, L.; Zengwu, L.I.; Fang, Z. Study of the Quality Standards of Potted Poinsettia (Euphorbia pulcherrima) and Establishment of It’s Ministerial Standards in China. J. Cent. South For. Univ. 2003, 23, 112–114. [Google Scholar]
  48. Park, S.; Yamane, K.; Fujishige, N.; Yamaki, Y. Effects of Growth and Development of Potted Cyclamen as a Home-Use Flower on Consumers’ Emotions. Hortic. Res. 2008, 7, 317–322. [Google Scholar] [CrossRef]
  49. Maruyama, Y.; Yamaguchi, T.; Nonaka, Y. The Planning of Optimum Use of Bench Space for Potted Flower Production in a Newly Constructed Greenhouse. J. Jpn. Ind. Manag. Assoc. 2002, 52, 381–395. [Google Scholar]
  50. Pan, J.; Mcelhannon, J. Future Edge Cloud and Edge Computing for Internet of Things Applications. IEEE Internet Things J. 2017, 5, 439–449. [Google Scholar] [CrossRef]
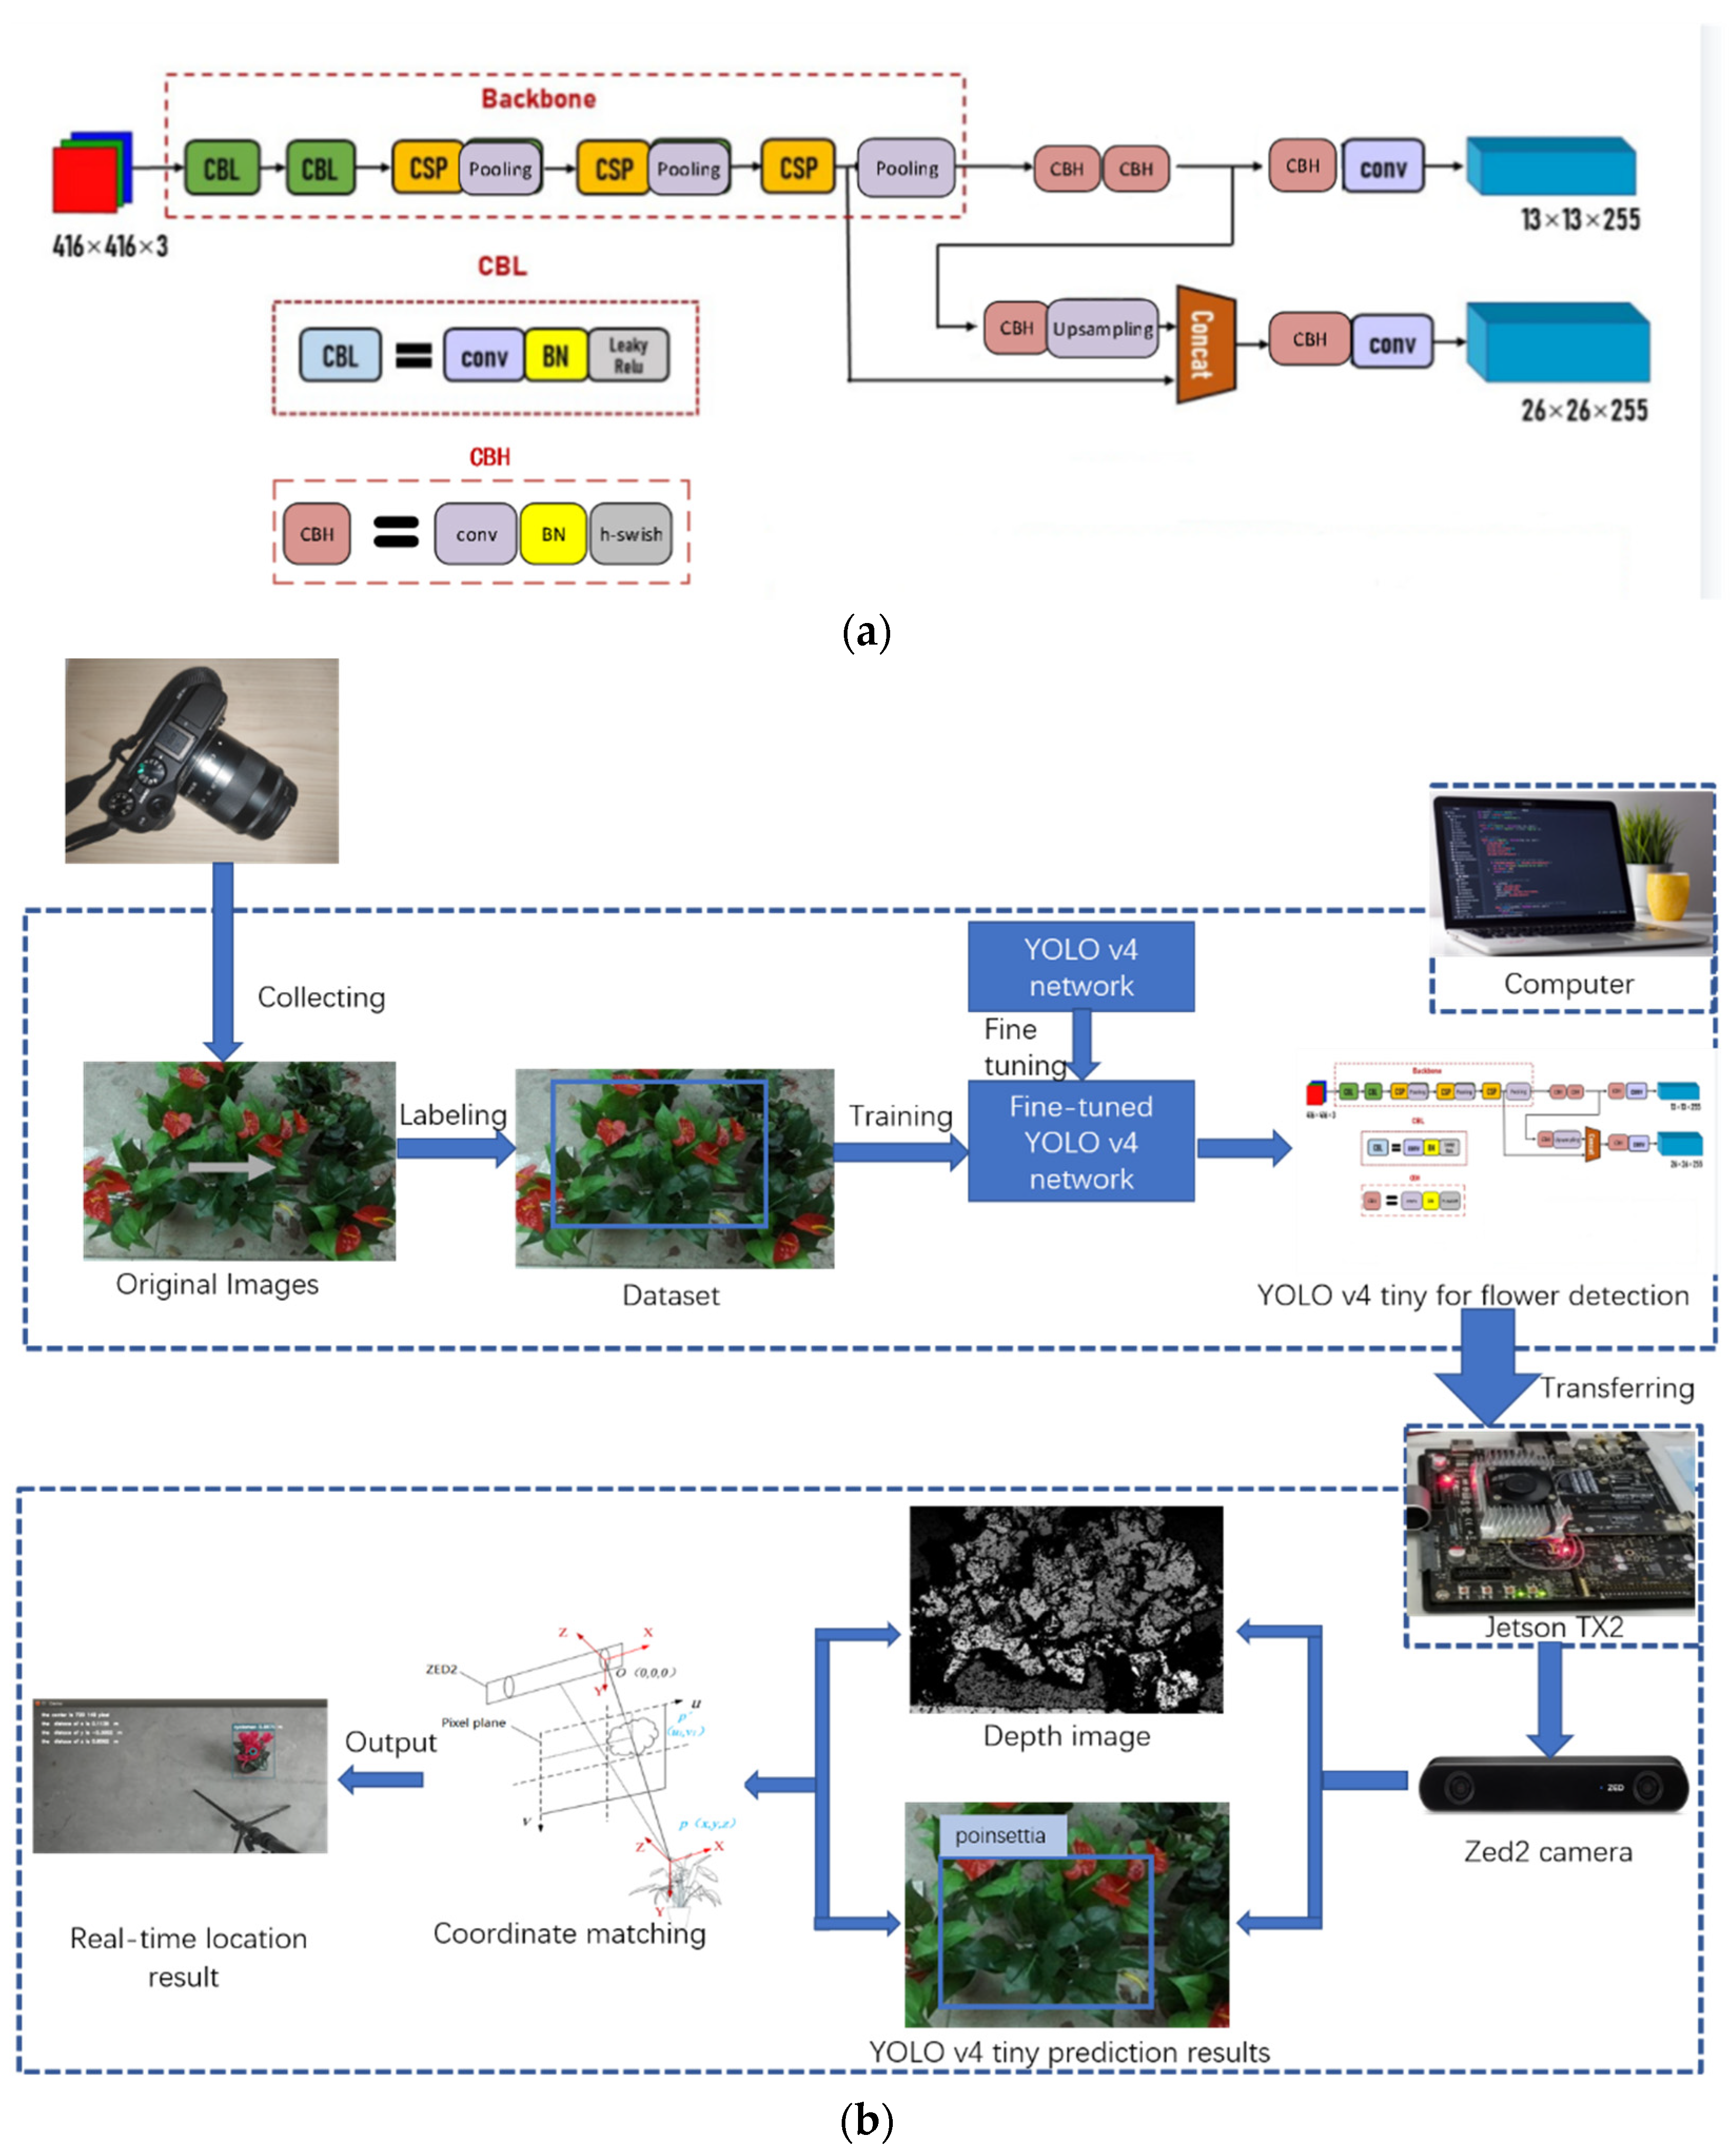
Figure 1. The processes for the potted flower detection and location based on YOLO V4-Tiny. (a) The YOLO V4-Tiny model. (b) The flowchart of the detection and location.
Horticulturae 08 00021 g001
Figure 2. Poinsettia and cyclamen images collected for the YOLO V4-Tiny model training.
Horticulturae 08 00021 g002
Figure 3. Data augmentation after mirroring, shrinking, enlargement, rotation, and affine transformation.
Horticulturae 08 00021 g003
Figure 4. Labeling the training dataset using LabelImag.
Horticulturae 08 00021 g004
Figure 5. Plane location based on the prediction box detected by the YOLO V4-Tiny method. Where, ( μ 0 ,   v 0 ) is the vertex coordinate of the prediction box detected by the YOLO V4-Tiny model, and W and H are the width and height of the prediction box.
Horticulturae 08 00021 g005
Figure 6. Spatial coordinate of the flower’s central point matching with the pixel plane and the ZED 2 stereo camera. Where p ( u 1 ,   v 1 ) are the flower’s center point in the pixel plane,   p ( x , y , z ) are the spatial coordinates of the flower’s central point. O ( 0 , 0 , 0 ) are the spatial coordinates of camera’s left lens.
Horticulturae 08 00021 g006
Figure 7. The overlap of the two flower canopies, where, respectively, w1, w2, h1, and h2 are the widths and heights of the two flowers’ plant canopy, w3 and h3 are the total width and height, and O1 and O2 are the central points the two flowers’ plant canopy. S is the overlap area of the two flower’s plant canopy.
Horticulturae 08 00021 g007
Figure 8. Training loss of the YOLO V4-Tiny model after 4000 iteration steps.
Horticulturae 08 00021 g008
Figure 9. Spatial location error results with YOLO model and SORT model with different z-direction distance. (a) 115 mm, (b) 120 mm, (c) 125 mm, and (d) 130 mm.
Horticulturae 08 00021 g009
Figure 10. Minimum distance and maximum canopy overlap ratio detection results by the YOLO V4-Tiny model.
Horticulturae 08 00021 g010
Figure 11. The location results in varying levels of radiation at a different time on a sunny day in the greenhouse.
Horticulturae 08 00021 g011
Table 1. The target detection performance evaluation results with the index intersection over union (IoU), average precision (AP), mean average precision (mAP), and recall.
Average Precision (AP)RecallIntersection over Union (IoU)Mean Average Precision (mAP)Average Detection Frame Rate
PoinsettiaCyclamenAverage
IoU = 0.590.56%88.89%89.00%87.00%68.18%89.72%16 FPS
Table 2. Detection numbers of the flowers with varying levels of radiation at a different time on a sunny day in the greenhouse.
Time9:0013:0015:0017:00
Radiation (W/m2)10240821127
Detected numbers14151513
Publisher’s Note: MDPI stays neutral with regard to jurisdictional claims in published maps and institutional affiliations.