Review

Machine Vision for Ripeness Estimation in Viticulture Automation

by
Eleni Vrochidou
,
Christos Bazinas
,
Michail Manios
,
George A. Papakostas
*,
Theodore P. Pachidis
and
Vassilis G. Kaburlasos
HUMAIN-Lab, Department of Computer Science, School of Sciences, International Hellenic University (IHU), 65404 Kavala, Greece
*
Author to whom correspondence should be addressed.
Horticulturae 2021, 7(9), 282; https://doi.org/10.3390/horticulturae7090282
Submission received: 30 July 2021 / Revised: 28 August 2021 / Accepted: 31 August 2021 / Published: 3 September 2021
(This article belongs to the Special Issue Advances in Viticulture Production)

Abstract

:
Ripeness estimation of fruits and vegetables is a key factor for the optimization of field management and the harvesting of the desired product quality. Typical ripeness estimation involves multiple manual samplings before harvest followed by chemical analyses. Machine vision has paved the way for agricultural automation by introducing quicker, cost-effective, and non-destructive methods. This work comprehensively surveys the most recent applications of machine vision techniques for ripeness estimation. Due to the broad area of machine vision applications in agriculture, this review is limited only to the most recent techniques related to grapes. The aim of this work is to provide an overview of the state-of-the-art algorithms by covering a wide range of applications. The potential of current machine vision techniques for specific viticulture applications is also analyzed. Problems, limitations of each technique, and future trends are discussed. Moreover, the integration of machine vision algorithms in grape harvesting robots for real-time in-field maturity assessment is additionally examined.

1. Introduction

Precision viticulture aims at maximizing grape yield and quality by minimizing input costs. Grape harvesting is the most important viticulture operation since the choice of the harvest time determines the desired quality of the yield. Identifying the maturity levels in vineyards could enhance the efficiency of harvesting operations [1]; especially in wine production, where the optimal harvest time, associated with specific concentrations of certain compounds, e.g., anthocyanins, is strongly related to the desired wine quality [2]. The precise time for grape harvest depends on the location, the duration of the growing season, the grape variety, the vine tree load, and the intended use of grapes, i.e., eating, or wine production. Environmental conditions also affect the ripening process [3,4]. Therefore, estimation of the exact harvest time is rather challenging; however, grape ripeness estimation is a less complex process and is performed regularly during veraison.
Traditional ripeness estimation for commercial grape growers is performed by experts who assess the maturity grade based on sensory attributes, i.e., color and taste, in combination with exhaustive sampling followed by chemical analyses [5]. The latter is not economically feasible, especially for commercial vineyards. Moreover, the procedure is subjective, depending on the person who performs the sensory evaluation and sampling. Additionally, chemical analyses are destructive, time-consuming, and usually involve sophisticated equipment that is costly and difficult to be operated by non-experts. Furthermore, destructive analyses presuppose extensive and frequent sampling that are made only on a finite number of fruit samples; statistical relevance implies precision loss [6].
In this context, automated solutions for grape ripeness estimation are to be sought. Lately, research is focused on developing non-destructive, cost-effective, and environmentally friendly techniques. Machine vision is currently used excessively for agricultural-related tasks [7]. The technological improvement in hardware provides sensors that combine high performance and reasonable pricing, while innovative software design provides algorithms that can support effective real-time artificial vision systems. Towards this end, machine vision has been introduced to in-field applications for grape ripeness estimation [7,8]. Reported results reveal that image analysis can be used as a quick, efficient, and attractive alternative to chemical analysis, due to its simplicity, flexibility and low cost.
This work aims to comprehensively survey current applications of machine vision techniques for grape ripening estimation. The techniques reported here are recent and cover a wide range of image analysis applications. Each technique’s potential is analyzed; performance results, prediction models, input data, and pre-processing needs are reported. Suggestions of the most effective methods for specific applications and their limitations are also highlighted. The current and potential integration of reported methods in agricultural robots, namely agrobots, is examined, and future trends are discussed. This work critically reviews the most leading-edge methods in machine vision-based grape ripening estimation and, therefore, experts can use it as a complete guide to help them select the appropriate methodology to best fit their application.
The rest of the paper is structured as follows. Section 2 summarizes the peculiarities of grapes compared to other fruits regarding ripeness estimation. The most commonly used indices related to grape maturity are presented in Section 3. Section 4 reviews machine vision methods for grape ripeness estimation. Limitations and perspectives are discussed in Section 5. The integration of the reviewed algorithms in grape harvesting robots is examined in Section 6. Finally, Section 7 concludes the paper.

2. Grape Ripeness Peculiarities

The physiological maturity of fruit occurs before the harvest maturity. When the fruit quality is acceptable to the customer, it reaches commercial maturity [1]. Physiological and commercial maturity need to be distinguished; commercial maturity is achieved when the development of the fruit is over even if the ripening process is not fulfilled, while physiological maturity is achieved when both maximum growth and maturity have occurred. In general, fruit maturity is estimated by using several maturity indices, summarized in the following section.
At this point, it should be noted that fruits are divided into two broader categories: climacteric and non-climacteric. Climacteric is a stage of fruit ripening related to increased production of ethylene, the required hormone for ripening, and a rise in cellular respiration. Climacteric fruits can produce ethylene even when they are detached from the crop and, thus, continue to ripen autonomously and change in taste, color, and texture. Apples, melons, bananas, and tomatoes are climacteric fruits. Non-climacteric fruits do not change in color and taste after being harvested. Citrus, grapes, and strawberries are non-climacteric fruits.
All varieties of grapes are non-climacteric. This means that grapes picked early in one day may taste different than those picked in the next day, and will not ripen any further so that they would all come to the same degree of maturity. Therefore, for grapes, it is important to keep sampling/tasting until the grapes are uniformly ripened and harvest all grapes of the same maturity level at the same time. After being harvested, grapes are sensitive. A general rule is that the more mature the grape is, the shorter is its post-harvest life. For grapes that need to be transported to distant markets/wineries, harvest must occur as soon as possible after reaching the desired maturity level and refrigerator tractors are required. If grapes are not harvested on time, the grape berries may shatter, become rotten, or be damaged by animals, i.e., birds, insects, etc., which severely affects yield quantity and quality.
Towards this end, the time of grape harvest is one of the most important and challenging viticultural decisions for grape producers due to: (1) the difficulty of assessing grape maturity in the vineyard after exhausting sampling, (2) harvesting all grapes at the same maturity level by organizing on standby human resources to harvest, and (3) maintaining and transporting the harvested product in time. Therefore, grape harvesting based on ripeness estimation could increase the sustainable production of grapes by improving the quality of harvested grapes due to homogenous ripened and equally fresh fruit. In this way, the post-harvest waste along the supply chain reduces due to less rotter/damaged grapes, with an additional reduction of the production costs and human labor due to sustainable resources management.

3. Grape Ripeness Estimation Indices

Each grape cultivar displays a different refractometric index that is related to maturity; table grapes are considered ripened at 16o Brix, Sauvignon Blanc at 20–22 °Brix, Merlot and Cabernet at 21–23 °Brix, etc. Thus, it is obvious that the proper harvesting time is not related to a standard value, but to a desired value depending on the harvested variety. Moreover, the post-harvest application of viticulture practices is strongly related to harvest at optimal maturity; in the wine industry, the maturity level of harvested grapes determines the exact procedure, diffusional, enzymatic, or biochemical, to be subsequently applied [9], while for table grapes, the refractometric index is combined with the sugar/acid ratio in order to determine harvest time that reflects the consumer acceptability.
Since there are no standard methods for determining the proper grapes’ harvesting time, researchers focus on the extraction of metrics that could be potential reliable predictors. Objective criteria to determine the ripeness of grapes are those related to chemical attributes, such as titratable acidity (TA), volatile compounds, etc. The accuracy of a chemical analysis depends on strictly following a systematic sampling strategy and maintaining well-calibrated equipment. A list of chemical attributes that are used as maturity indices alone or in combination is summarized in Table 1.
The most valuable quality indicators for grape maturity among those in Table 1, are the SSC, pH, and TA [1], especially when combined. However, these common maturity parameters that constitute the definition of ripeness, may vary between different cultivars. For the latter indicators in the wine industry, regardless of the grape variety, the limits that collectively indicate a ripened grape are those summarized in Table 2. It should be noted that the limits presented here are general and indicative and are intended to specify a wide range of values for each index as resulted from the bibliography [10]. It is well-known that it is not feasible for a single set of numbers to define ripeness for one or more grape varieties; ripeness can only be defined by the individual [11].
Commercial grape growers rely on chemical attributes precise values to determine when to harvest. However, home growers that do not share the same means such as fully equipped chemical laboratories, use subjective criteria to ascertain maturity.
Subjective maturation criteria are just as important and are used in addition to and in conjunction with the objective criteria. The latter include sensory characteristics that can be discriminative among samples and related to both chemical measurements and consumer liking. A list of sensory attributes that are used as maturity indices is included in Table 3. Color, size, and taste are the three main subjective attributes to determine grape maturity.
Grapes change color from green to red, dark blue, yellow, or white, depending on the variety. Color is the most important indicator of maturity. Upon the change of color are based all machine vision algorithms toward harvest automation. However, external grape color is not always a reliable indicator since many cultivars change color prior to ripening. The color of grape seeds is more discriminative; seeds in all cultivars turn from green to brown [12]. However, the latter investigation suggests the destruction/crush of grape berries, which is an invasive approach. Grape size is another pointer of the ripening of grapes. When grapes are ripened, they appear full in size and less firm when being touched. Taste is the most important sensory attribute to ascertain the ripeness level. This is the reason why chemical samplings usually are accompanied by taste samplings. Grapes are tasted regularly while ripening until they are as sweet as needed for their intended use.
The ability to estimate grapes’ maturity state accurately is crucial for deciding on harvest time towards the optimal quality of wine production. The intended use of the harvested fruit established by the winegrowers is the key factor that defines the grape ripeness level. According to the above, in order to assess maturity by using the traditional methods, all of the following prerequisites should exist at the same time: close grapes monitoring while ripening, appropriate sampling, laboratory equipment, and procedures for objective chemical analysis and careful sensory evaluation.

4. Machine Vision Methods for Grape Ripeness Estimation

During ripening many physical and biochemical changes occur that affect grape characteristics such as color and morphology. Machine vision approaches can cope with color, shape, and texture from the analysis of grape images, offering automated, non-destructive, rapid, and cost-effective techniques. The objective for researchers is to move grape composition measurements from the laboratory to the vineyard, absolving a large number of workers from laborious extensive sampling and chemical analysis, towards in-field automated solutions. Figure 1 illustrates the evolution of grape ripeness estimation through the decades, from the laboratory to the vineyard.
Figure 1 illustrates a tendency; over time, grape ripeness estimation techniques once could perform exclusively in the laboratory, then transferred in the vineyard initially due to the advent of portable sensors, and finally due to the rapid development of machine vision algorithms which is the current trend. However, machine vision techniques have also been applied in the laboratory and have been combined with portable sensors [13,14,15].
Machine vision algorithms provide image-based automatic analysis and extraction of the required information. Different types of images can be analyzed depending on their spectral resolution. In this work, the applications using the most common type of images, i.e., digital and multivariable, are reviewed. This is a way to categorize the large volume of related works available in the literature. More specifically, from the broader category of digital images, the three-channel Red-Green-Blue (RGB) color imaging is selected, while from the multivariable category are selected the complete spectrum hyperspectral and Near InfraRed (NIR) imaging.
RGB color imaging is the most cost-effective way to determine color channel values and characteristics such as texture and shape. However, in RGB color imaging, only three visible bands are available resulting in finite identification capability; RGB color channels exhibit high levels of correlation and display a smaller range of colors than human eyes can perceive. No color space can perfectly represent a color; different color spaces are investigated to address issues that others cannot deal with. Therefore, the CIELAB color space is used as an international standard for color measurements. The transformation from RGB to CIELAB requires calibration and it is illumination-dependent. Additionally, the Hue-Saturation-Intensity (HSI) color space is used, especially for segmentation procedures, due to its great relation to the visual perception of colors. The Hue-Saturation-Value (HSV) is an alternative that is invariant to uniform changes of illumination. Alternative color spaces have also been investigated.
Hyperspectral imaging is considered an evolving process analytical tool. It can be used instead of RGB for more demanding applications since it can record numerous bands across a wide spectral bandpass. The latter bands are contiguous and are extended beyond the visible part of spectrum. Hyperspectral imaging associates spectroscopy with conventional imaging and, therefore, both spectral and spatial information of an object can be obtained [16]. A hyperspectral image involves a set of sub-images that represent intensity distribution at specific spectral bands. When fruits are exposed to light, the radiation that is reflected is measured by the reflectance spectrum, which is associated with their chemical compositions [17]. Hyperspectral imaging is considered advantageous over existing spectroscopic and conventional RGB techniques; spectroscopic techniques obtain spectral data from only a single point or a small part on the tested fruit, while RGB imaging cannot properly identify chemical composition and surface features of fruits that are sensitive to frequency bands different than RGB [18].
NIR spectroscopy has also been proven as a powerful analytical tool to define bioactive compounds in grapes, such as soluble solids and pH [19]. In NIR spectroscopy, first, NIR radiation is applied to the object and then the transmitted/reflected radiation is measured. The spectral characteristics of radiation are altered as it enters the object due to scattering and absorption that depend on the wavelength. Modifications depend on the chemical composition of the object and the light scattering properties. The main advantage of NIR spectroscopy over the rest of the reported methods, RGB and hyperspectral imaging, is the chemical-free sample preparation and the ability to determine efficiently the optical properties of the fruit that are strongly related to chemical and physical properties, and thus, to maturity. The latter can be seen in Figure 2, where the main ultraviolet/visible/near-infrared (UV/VIS/NIR) wavelengths are associated with chemical compounds in grapes. It should be noted that the regions reported in Figure 2 are indicative and extracted from the literature [2,20,21].
As it can be seen in Figure 2, in the NIR region (780–2500 nm), an absorption band at around 1200 nm is related to sugars. Water-related absorption bands were found at 950 nm and 1460 nm. At 990 nm were detected sugars and organic acids. The absorption bands at 1450 and 1950 nm were related to a combination of water, glucose, and ethanol. Absorptions at 1690 and 1750 nm were related to glucose and ethanol. Absorption at 2260 nm was related to glucose. Absorption at 2302 nm was related to ethanol, carbohydrates, and organic acids. In the UV region (190–400 nm), 202 and 230 nm were the peaks with the highest absorption responses. These were related to carboxyl groups of organic acids. At 280 nm were detected total phenolics for red wines. In the VIS region (400–780 nm), the absorption in the three main colors is observed at 420 nm for green, at 520 nm for red, and 620 nm for blue. Spectral peaks with higher absorption indicate specific compounds. However, compounds can be detected to a broader waveband covering both sides of each maximum (peak) absorption value.

4.1. Color Imaging

A set of 100 RGB images per sample for 150 samples was used to define the phenolic maturity of grape seeds in [15]. In total, 21 polyphenols were determined and correlated to CIELAB color channel values and morphological variables obtained from the images. Results revealed a high correlation coefficient for predicting the maturity stage of grapes. In [14], RGB images of grape berries and seeds were related to chemical phenolic compositions and classified as ripened or immature based on the browning index and morphological features by applying discriminant analysis models. A classification method that classifies grape bunches on-site in mature or undeveloped was suggested in [22]. First, the grape bunches were segmented and then classified based on texture and color features from HSV and RGB representation of the images.
Color scales to estimate grape phenolic maturity were investigated in [23]. A support Vector Regressor (SVR) was employed to generate color scales that followed the evolution of grape maturity. Color scales derived from image histograms associated with three maturity grades, i.e., mature, immature, and overmature. The performance of the model was obtained from the Mean Squared Error (MSE) by utilizing the K-fold cross-validation. In [24], a vision-based system was proposed to collect grape bunches images and predict the progress of the color change of bunches in the vineyard. The images were acquired at different times and the change of color over time was computed to make future predictions. Thus, the system could classify bunches into four maturity grades and spatial maps of the vineyard could be generated to target the productive zones during harvest. Quantitative models between chemical attributes and RGB images were proposed in [25]. Data mining algorithms were employed to extract color features from the standard and mean deviation of the region of interest of the images. Two regression models were tested to estimate chemical attributes from the extracted features.
In [26], visual inspection of grape seeds took place for grape ripening estimation by the Dirichlet Mixture Model (DMM), without the performance of chemical analyses. DΜM allowed modeling the color histogram of grape seeds to estimate ripening class memberships. A method for quality evaluation of table grapes was presented in [27]. Image analysis and machine learning techniques were employed to analyze color images and classify them in the predefined five quality classes. In [28], Convolutional Neural Networks (CNN) and Support Vector Machine (SVM) were used for the classification of grapes into unripen or ripen. Morphological features along with RGB and HSV values were used as inputs of the classification models. In [29], color histograms derived from RGB images were represented by Intervals’ Numbers (INs). Previous INs were fed to the NN in order to predict future INs, and thus, the grape harvest time. A CNN model for ripeness classification in eight classes was employed in [30]. RGB images were acquired under varying illumination and only texture features were extracted and considered as parameters for the model.
Table 4 includes details regarding referenced applications of RGB imaging for grape ripeness estimation. Performance evaluation in Table 4, and in all subsequent tables, is reported in terms of the R-squared (R2) metric; however, when other evaluation metrics are used instead, are mentioned explicitly.

4.2. Hyperspectral Imaging

A hyperspectral imaging technique was proposed in [31] for the prediction of physico-chemical and sensory indices of table grapes. The reflectance spectra of berries were acquired and afterwards the berries were analyzed to compute pH, TA, and SSA. A Partial Least Square Regressor (PLSR) was employed to search for connections between physico-chemical indices and spectra information. Images of the grape berries were taken by an in-lab hyperspectral imaging system inside a dark room under a halogen light source. In [32], hyperspectral images were used to construct the spectrum of grape berries. The spectrum was then converted to an enological parameter. Simultaneous determination of pH, sugars, and anthocyanins took place by a Neural Network (NN).
The same authors used the aforementioned NN with hyperspectral images of different grape varieties to prove that the NN could derive for new varieties, compatible results with those of the varieties that were used in the NN training process [33]. An Unmanned Aerial Vehicle (UAV) was employed in [34] to capture hyperspectral images at the farm scale. From the same farm, grape berries were collected, and measured reflectance spectra were employed for the estimation of pH and TSS in order to classify the berries as ripen or unripen. Hyperspectral imaging was used in [35] to determine the phenolic content in grape skins and seeds of five grape cultivars. Spectral data were captured and pretreated by six different methods. Three models were trained with the pretreated spectral data to predict phenolic values.
In [36], NIR hyperspectral data of grape seeds were used to estimate the phenolic and flavanolic contents of two grape varieties. Quantitative models were developed and an appropriate discrimination function allowed for high classification rates of the phenolic state of grapes in two classes. A VIS-NIR hyperspectral camera in [37] provided images mounted on an all-terrain vehicle while moving. Spectral models were extracted and used to train a Support Vector Machine (SVM) model to predict TSS and anthocyanin concentration. Two different models were trained in [38] to predict TSS, TA, and TF from hyperspectral images. Optimal wavelengths were investigated and the best predictions were derived from the selected optimal wavelengths, resulting in considerable data reduction.
Table 5 includes details regarding referenced applications of hyperspectral imaging for grape ripeness estimation.

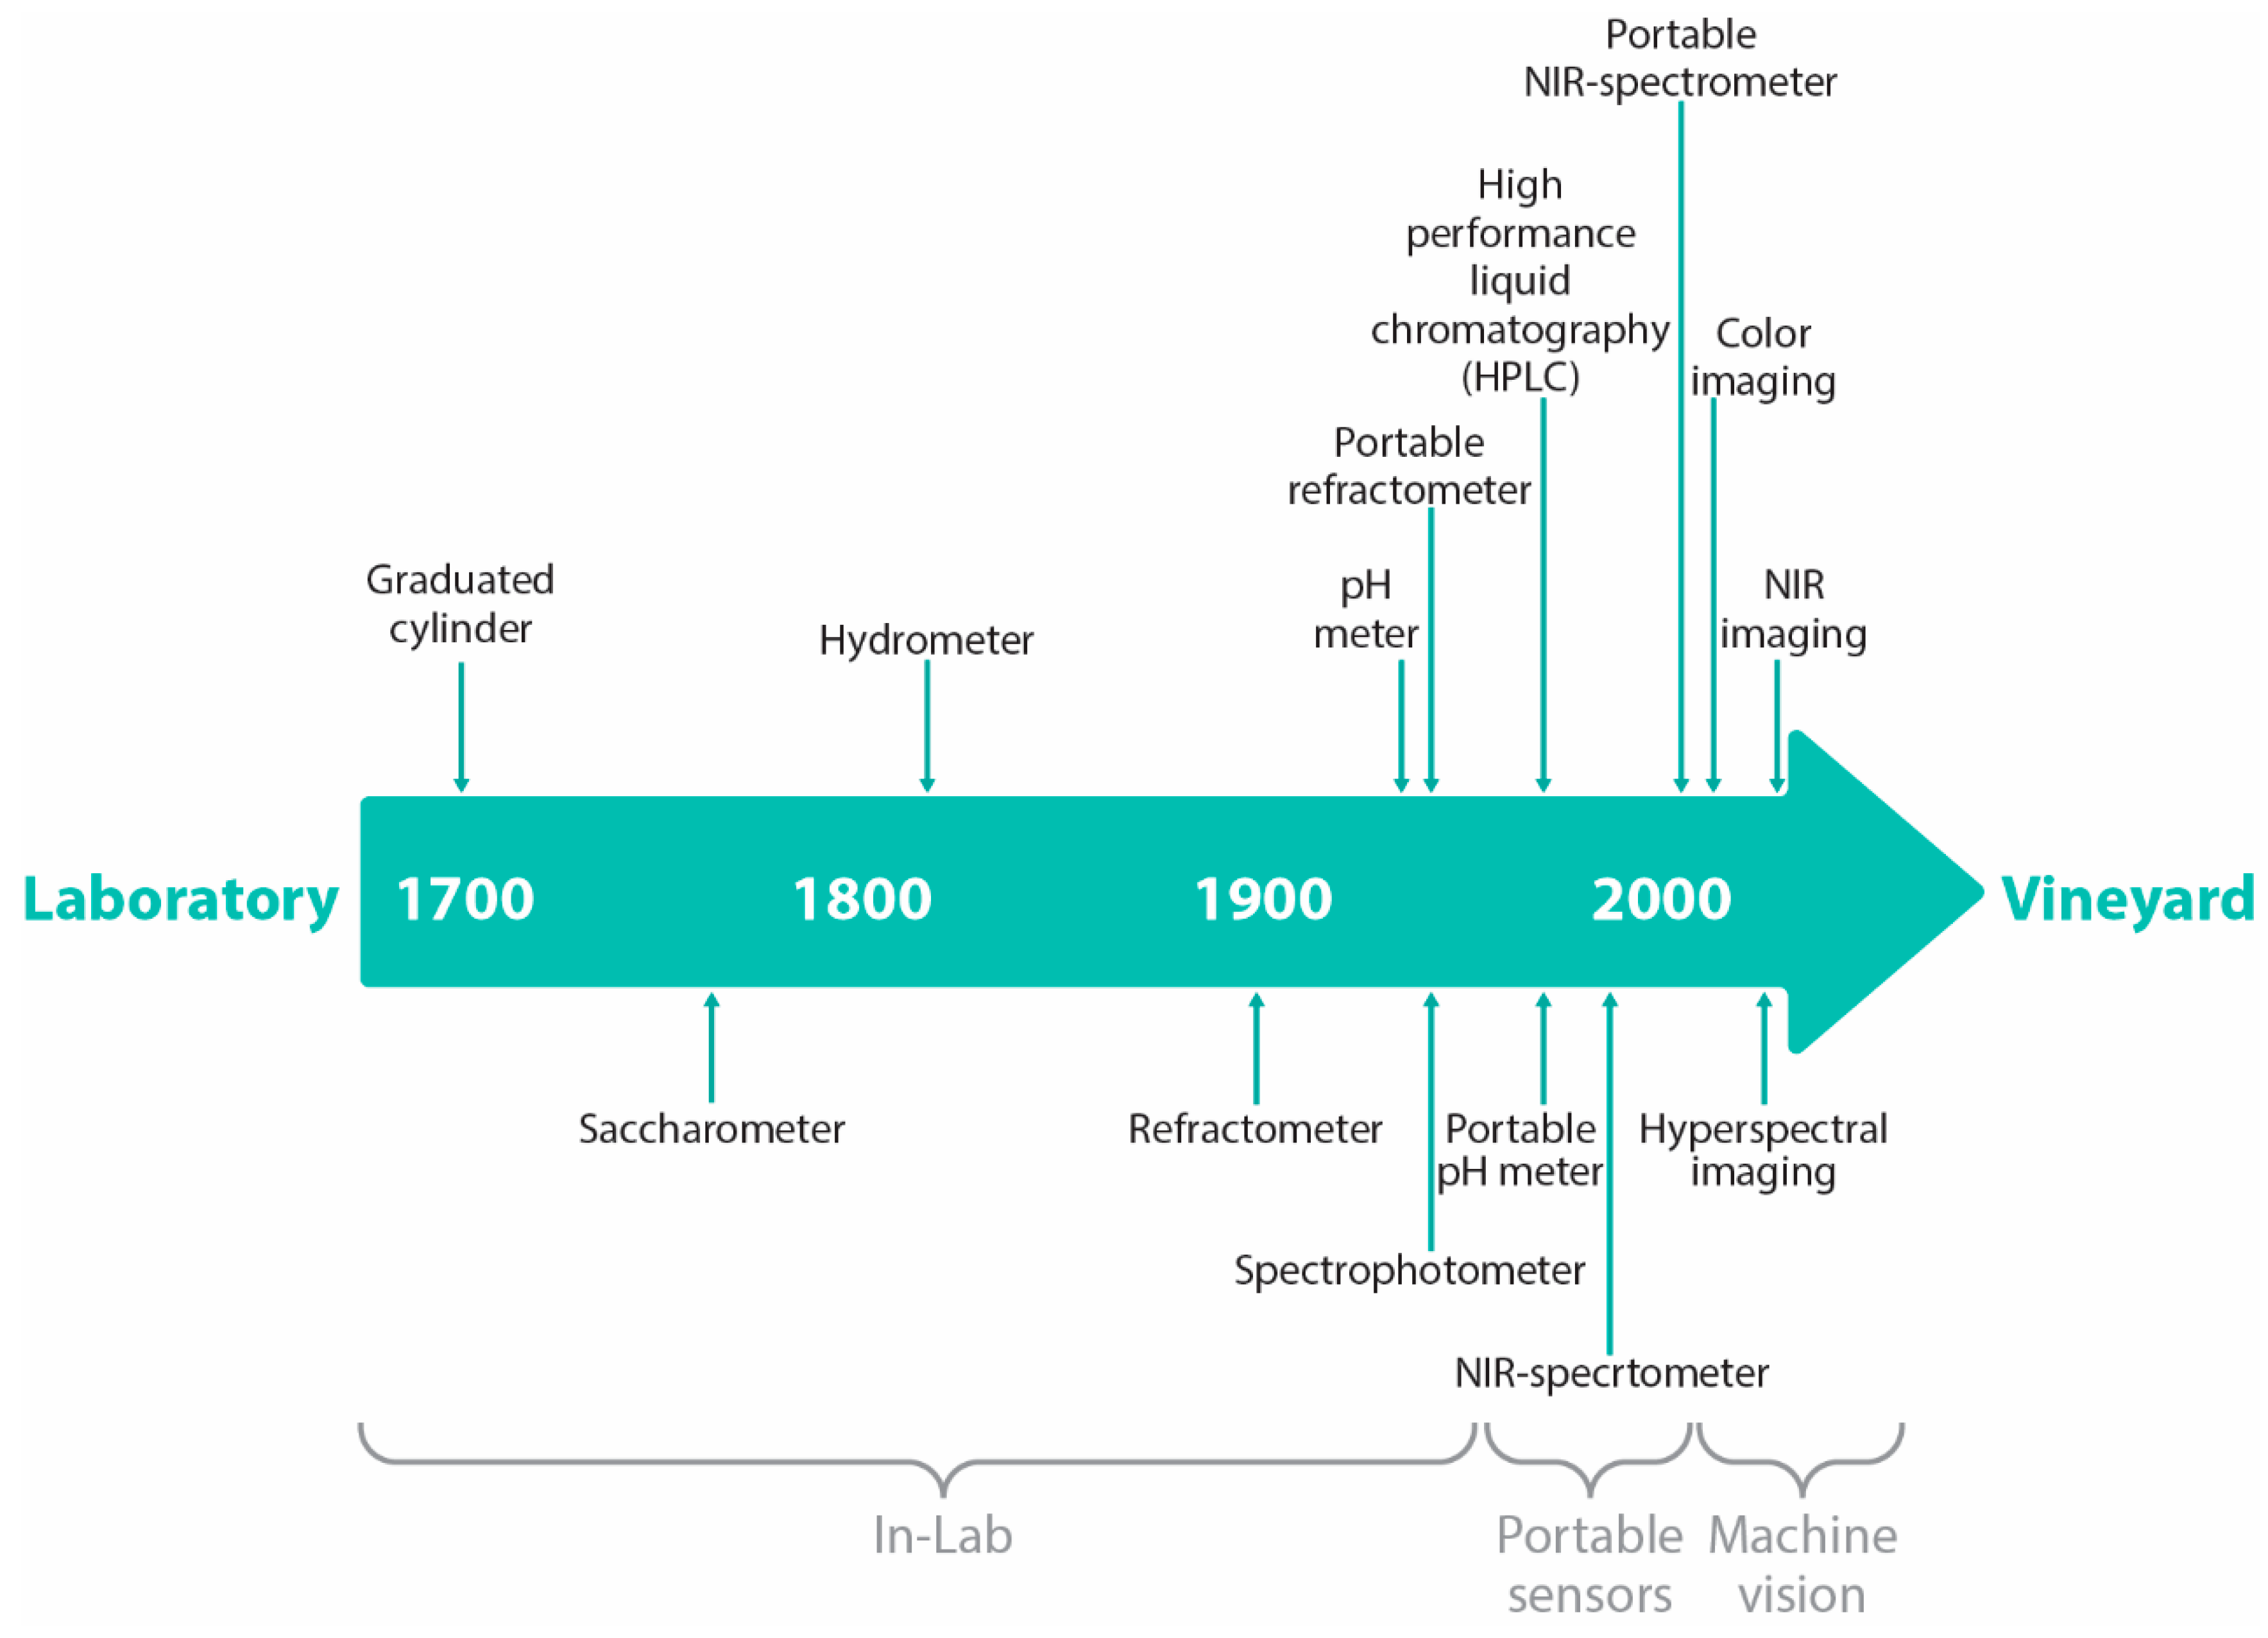
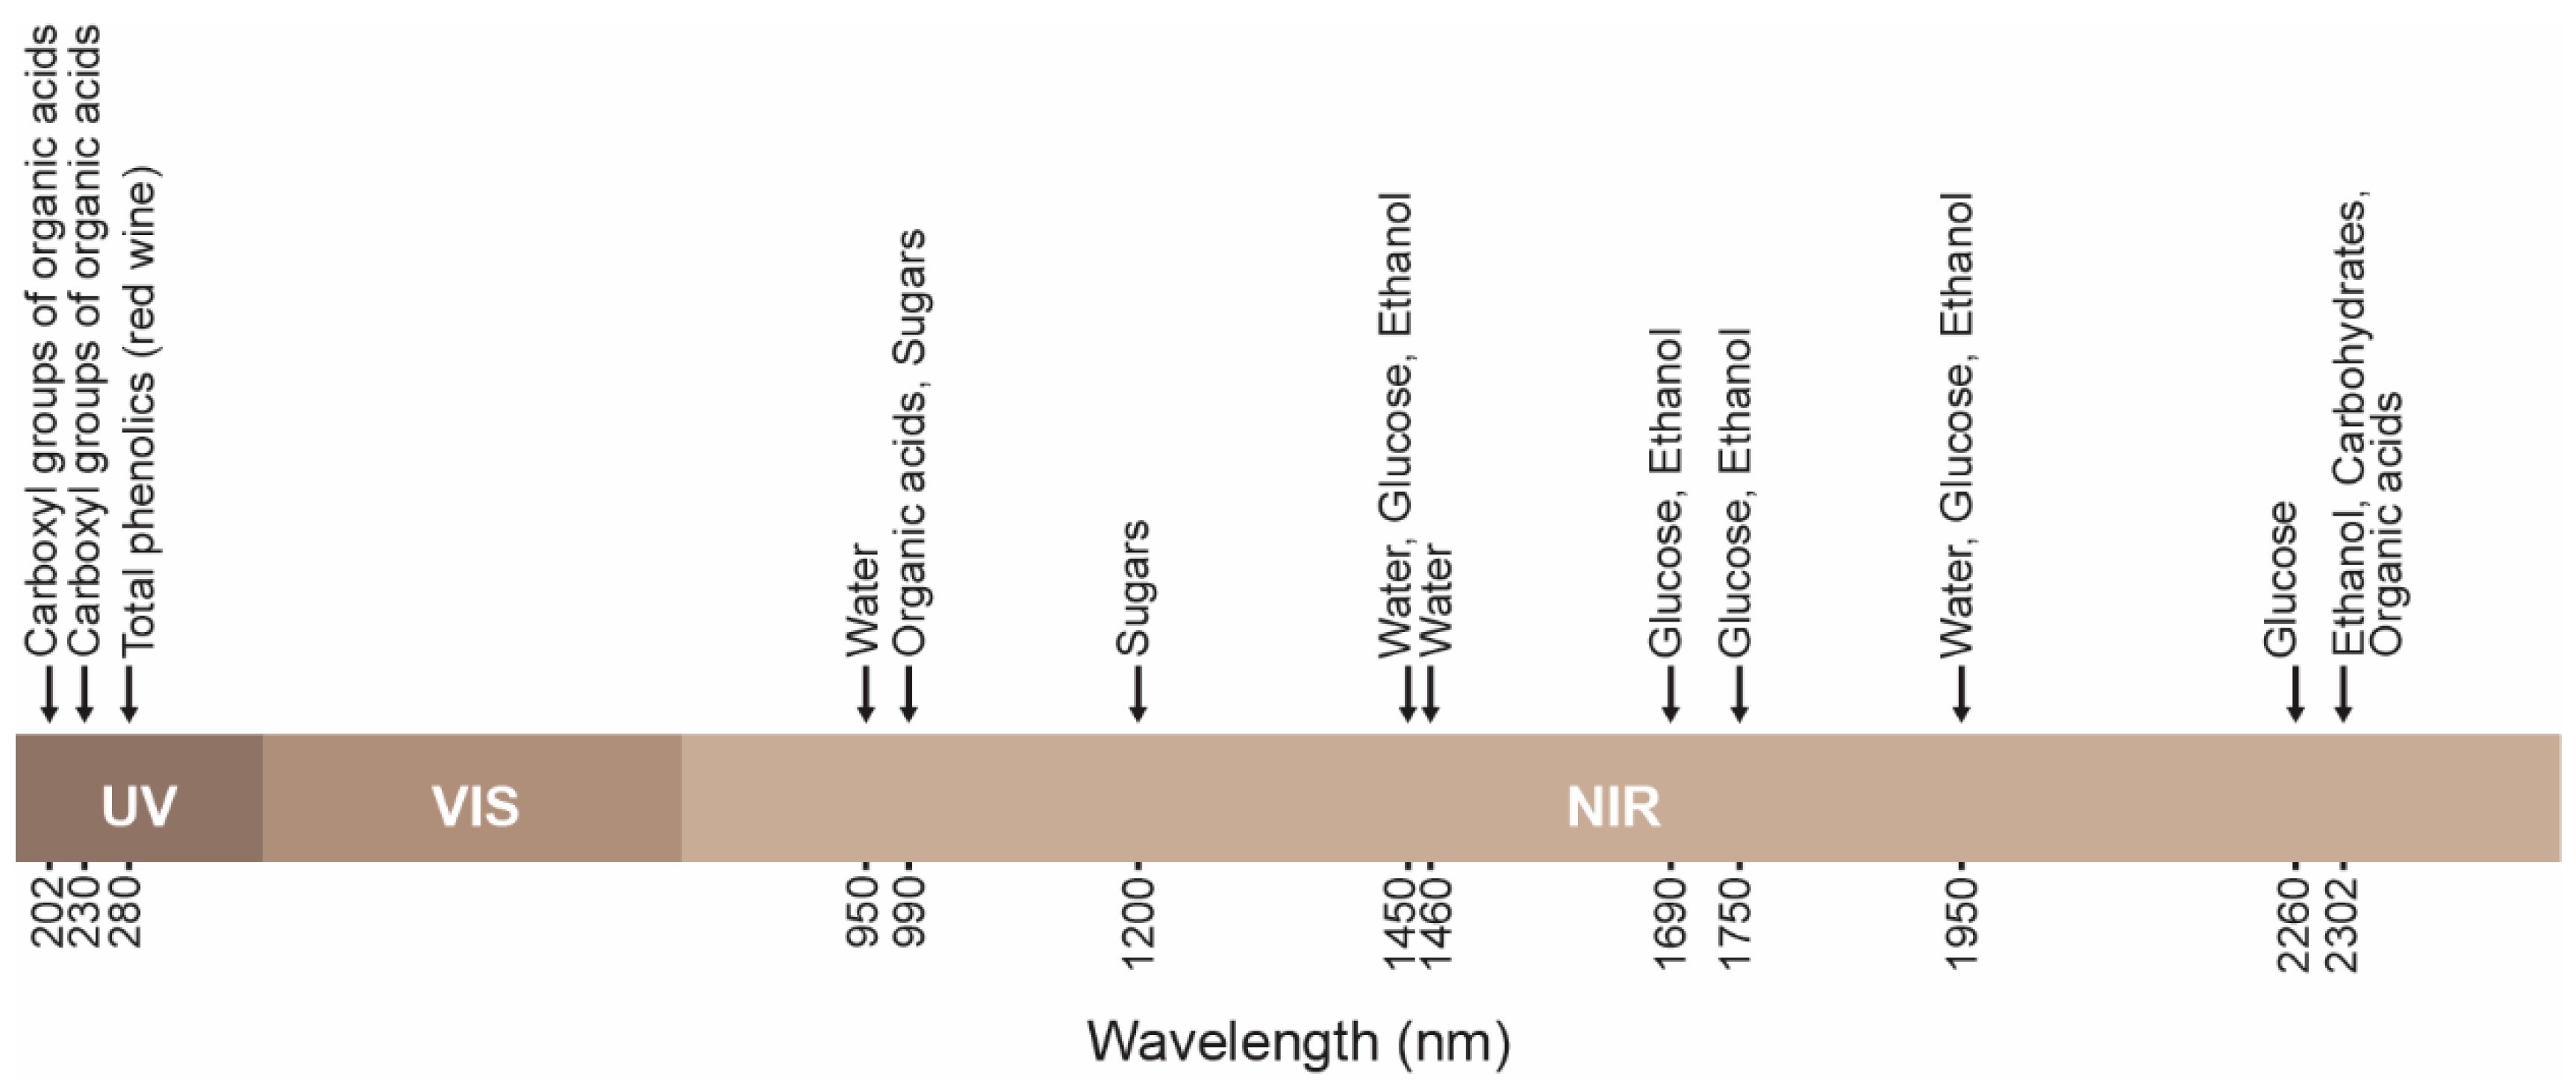
4.3. NIR Spectroscopy

In [13], NIR spectroscopy was used to determine anthocyanins in grape berries. Reference anthocyanins values were calculated by chemical analysis. The spectral matrix was extracted by image analysis and subjected to principal component analysis (PCA) to provide information regarding its latent structure. Different spectral parameters and mask development strategies were examined to derive quantitative models. Obtained results revealed the potential of NIR spectroscopy to monitor anthocyanins in red grapes. Usually, NIR spectroscopy only uses the extracted spectra from in-lab or portable spectrometers [1,2,39,40] and does not include image acquisition and machine vision algorithms. This is the reason why there is a lack of relevant research that combines spectroscopy and image analysis.
Table 6 includes details regarding referenced applications of NIR spectroscopy involving image analysis for grape ripeness estimation.

5. Limitations and Perspectives

As it can be observed in Table 4, Table 5 and Table 6, on the one hand, color imaging relies on features that are mainly colorimetric (color features), extracted from the corresponding color space, e.g., L* and C*ab in CIELAB, etc., morphological, e.g., shape, size, roundness, length, width, perimeter, elongation degree, aspect ratio, heterogeneity, etc., or texture features such as local entropy, standard deviation, range value, etc. On the other hand, hyperspectral imaging and NIR-spectroscopy extract spectroscopic features, i.e., reflectance spectra. Therefore, in what follows, it is worth investigating which features are more correlated to maturity.
In [15], a correlation study was performed to reveal the connection between chemical compositions (hydroxibenzolic acids, monomers, dimers, trimers, and galloylated compounds) and parameters obtained by image analysis in CIELAB color space combined with morphological features. A high correlation was found between color and phenolic compositions; more specifically between monomers and lightness (L*) or galloylated compounds and chroma (C*ab). Medium to high correlation was observed for morphological data such as heterogeneity with trimers. In [25], high correlation coefficients were reported between SSC and the grey mean values of R, G, and B, while the correlation coefficients between the same gray mean values and pH were low. In [22], the best performance was obtained with RGB color features compared to HSV, even when combined with texture features (RGB and texture, HSV and texture). In [27], a good correlation was observed between CIELAB channel features (mean of L*, a*, and b*) and grape quality. However, there is no study to overall compare the features extracted from different color spaces and so no concrete conclusion can be drawn up-to-date as to which feature or combination of color features with morphological/texture characteristics is actually optimal. Spectroscopic features may better correlate with maturity since they are extracted from the absorption bands that are related to objective maturity indices (chemical compounds), as explained below.
Regarding the selected maturity index, in most cases of color imaging in Table 4, subjective attributes are used, such as visual assessment. However, hyperspectral imaging and NIR-spectroscopy rely on chemical attributes. The TSS, pH, and TA provide good guidance in determining maturity grades, while pH is not a reliable indicator in most cases [25]. Until now, it is not completely understood how each maturity index is related to one another, or the importance of their individual or collective values as reliable predictors of maturity [41]. It should be noted that the record spectra of compounds are extracted by scanning wavelength regions to determine the absorbance properties of each compound at each wavelength. Researchers work on finding the most significant wavelengths which contribute to the evaluation of quality parameters and eliminate those which display no discrimination power [38]. As it can be seen in Figure 2, the visible spectrum can be a poor identifier of chemical composition, which appears more sensitive to infrared and ultraviolet wavebands. Therefore, hyperspectral imaging may be considered as a quality tool for the investigation of the chemical composition of fruits and vegetables in general [31]. However, hyperspectral imaging is characterized by high cost and complexity. Faster processing units, more sensitive detectors, and large data storage capacities are needed for analyzing hyperspectral data. This is the reason why the number of images in hyperspectral imaging techniques is limited (Table 5), while in color imaging techniques the number of images to be processed could be significantly larger.
The large volume of data and the excessive processing load and time is partially faced with the development of Graphical Peripheral Units (GPUs) that aim to increase computational power. Moreover, current technology in computational devices allows for powerful real-time pattern recognition techniques, such as deep neural networks, to be used on-site and process a large number of images in real-time applications. The limited number of images, however, results in the inability to use powerful deep learning methods. Deep learning requires a large amount of data in order to perform better than other algorithms. This explains the limited application of CNN models. Only two research works reported here use CNN models; those with the larger number of acquired images. Moreover, one would expect from a state-of-the-art method such as CNNs, comparatively the optimal performance. However, classification results reported in [28,30] reached up to 79% for white grapes and up to 93.41% for red grapes, while other methods report higher performances, e.g., in [14,22,27] (Table 4). This could be attributed to the nature of the used datasets and the lack of comparisons between methods on the same data.
According to the above, an additional limitation is the lack of large-scale public datasets of grape bunch images for testing innovative methodologies and performing comparative evaluation reports. Researchers depend on data that they collect on their own, which are neither universal nor comparable, and usually limited in number. More specifically, there is a lack of enough datasets related to grape maturity. The video frames dataset used in [29] is publicly available in [42]. A well-known public maturity dataset is the GrapeCS-ML database [43], referenced in [30]. Most researchers, however, claim available to distribute their datasets upon request, e.g., in [30]. It is obvious that global agricultural datasets need to be established, not only for grapes’ maturity but also for most crops in the agricultural sector, including pests, diseases, leaves, etc.
Regarding the comparative performance of the reported methodologies, in color imaging, the evaluation metric in most cases is a classification accuracy percentage. This is due to the visual assessment used as maturity index in color imaging, that forces to classify the maturity to predetermined classes, e.g., ripen or unripen. In hyperspectral imaging, the R-squared is the most common evaluation metric, since the maturity estimation depends on specific numerical values of chemical indices, that allow additionally for regression models. The fact that these two broad categories of methodologies use different performance criteria makes them difficult to be compared directly. However, all methods appear to be effective and lead to acceptable performance scores, which need to be further evaluated depending on additional criteria, such as quality of the dataset, processing time, grape variety, etc.
Additionally, the factor of the grape variety is of great importance. Grapes are either white or red. As it can be seen from Table 4, Table 5 and Table 6, most ripeness estimation methodologies deal with red grape cultivars. Red grapes are easier to be assessed to maturity classes based on color features since they gradually change color from green to red. Investigating white cultivars is more challenging due to their slight variation in color while ripening. Evaluation performance of the methodologies in red grapes is higher than in white grapes in all reported cases, as can be seen from Table 4, Table 5 and Table 6. White grapes are additionally difficult to be located from machine vision algorithms in the field, due to their similar color with the environment, e.g., leaves.
In general, the complexity of agricultural environments in terms of diversity and dynamically changing conditions such as illumination and vegetation are the main difficulties that machine vision is trying to overcome [44]. Current machine vision technology fails to overcome all obstacles faced in agricultural settings [8]. This is the main reason why most of the reported methods carry out the ripeness assessment in controlled environments, under artificial lighting. Innovative algorithms need to be introduced, able to adapt in heterogeneous environments. The application of machine vision algorithms in the fields includes the integration of multiple parameters and principles that can only be faced in natural setups, not in laboratory settings. Even when an algorithm performs well in an experimental setting, the on-site application would result in different performances due to natural factors; in-field fine-tuning is then considered necessary, and yet, robust performance is not ensured.
As a relatively new technological tool in agricultural production, machine vision has the potential to better integrate into multiple agricultural operations. In the future, machine vision algorithms are expected to play a vital role in sustainable agricultural automation, towards improving local economies and promoting ecology.

Crop Growth Models

Machine vision methods for ripeness estimation do not consider several factors that drive grape maturity such as environmental conditions, climate, type of soil, pests, and management practices like watering, fertilizing, defoliation, etc. Crop growth models are based on “first principles”, including the aforementioned data, to simulate crop development. A number of crop growth models have been proposed in the literature to simulate grapevine growth: IVINE to evaluate environmental forcing effects [45,46], VICMOTO numerical model to study the influence of meteorology and climate [47,48], the generic time-step crop model STICS [49], LEAF process-based model [50] to predict the vegetative performance of the vineyards, etc. Input data to crop growth models are usually compiled over an extended time period of many years. Alternative input information may lead to better interpretations of the highly complex reality. For example, previous work has demonstrated that intelligent clustering techniques may result in better sugar yield prediction than “first principles” models [51]. Toward this end, crop growth models could benefit from machine ripeness vision estimation algorithms by considering additional input variables, such as colorimetric and morphological features extracted from grape images during each growing stage. The latter, to the best of our knowledge, has not yet been investigated, allowing researchers to explore uncharted areas in future work.

6. Integration to Grape Harvesting Agrobots

The use of robotic technologies in agriculture has become a recent trend [52]. Agricultural robots, namely agrobots, aim at automating practices such as harvest, spraying, watering, etc., promising high-performance and reduced costs. Many studies propose harvesting robots for a variety of crops; sweet peppers [53], tomatoes [54], strawberries [55], etc. Integration of ripeness estimation algorithms in autonomous robots is useful for the automated monitoring of the crop based on image measurements. The latter can non-destructively and quickly enable growers to improve the quality of harvested crops by reducing labor and sources from extensive sampling. A reliable prediction on maturity would help growers to plan and schedule their harvesting operations. However, robotic automation in viticulture is still at its early stages [56,57,58]; the most time-consuming and labor-intensive task in viticulture production, the harvesting task, still depends on manual labor. Asynchronous ripening among grapes due to variation in the vineyard (lighting, watering, soil, etc.) has a negative impact on overall fruit composition, and thus, on fruit and wine quality. Maturity estimation is closely related to harvest automation; optimal automated harvest implies machine vision techniques able to identify the maturity of grapes and autonomous systems able to collect only the grapes of the same maturity degree.
Machine vision techniques claim to be contactless and non-invasive in the sense that the camera provides images related to maturity attributes and estimation is performed without crushing of grapes. However, many machine vision methods imply images of grapes captured in special conditions such as dark rooms, thus, grape bunches or berries need to be removed from the vine trees, or even processed, e.g., to isolate grape seeds/skins. Integration of machine vision methods for ripeness estimation to agriculture robots toward harvest automation requires real-time methodologies capable of performing on-site. Therefore, portable optical sensors combined with algorithms that could analyze grape attributes directly in the vineyard are of special interest. Based on the above, Table 7 summarizes details of the referenced literature regarding the ability to estimate ripeness (1) by leaving grape bunches intact and (2) by performing ripeness estimation on-site. Limitations of each method are also reported.
The literature research (Table 7), revealed that only nine out of 20 referenced machine vision methods would leave grape bunches intact to estimate the ripeness degree, while only six of them could be implemented on-site, and therefore potentially be integrated into an agrobot toward homogeneous harvest automation. Table 8 summarizes the integration ability of the most efficient machine vision methods as resulted in Table 7. The advantages and limitations of each method are also included.
The lack of application of machine vision technology for ripeness estimation toward automatic grape harvesting is due to multiple challenges related to grape crops, as described below. From Table 8, it is notable that only three reported methods can perform on-the-go, and only one of them is already integrated into a harvesting agrobot, e.g., used by an autonomous robot to decide on harvest actions; the other two methods are only applied for monitoring the grape maturity status.
Machine-vision-based monitoring is challenging when it comes to agricultural products such as grapes, that are of variable sizes, shapes, color, and texture. The latter features are not stable but vary over the growing season. Moreover, green grapes are even more difficult to be located due to the same color as the foliage, as already mentioned. Grape datasets need to include variable cases, such as grapes of all colors at all growing stages while ripening, different cultivars, occlusion cases from leaves and branches, and images under varying illuminations. This difficulty is the main reason why many of the algorithms reported here (Table 7) were tested in dark rooms under artificial lighting. The evaluation performance of the methods that are integrated into agrobots is relatively low. For instance, in [24], the R2 is 0.56 for a red grape variety, while other methods tested in the laboratory report R2 greater than 0.9 even for white grape cultivars. On-the-go estimation of maturity level from a moving robot could be rather challenging.
An agrobot is challenged to move in the irregular vineyard terrain. Harvesting robots usually include a robotic arm and a camera mounted on a robotic vehicle. Irregularities of the terrain would cause vehicle vibrations, resulting in unstable vision measurements; blurry images (noise), differences in the distance between grapes and lens (scaling), changes in brightness due to the movement of the vehicle between the variable shade of the foliage (exposure) are some of the main limitations. This is the reason why methods tested in the field display lower accuracies than those tested in the laboratory. Moreover, when it comes to harvesting robots, the accuracy of grape bunch detection is of great importance since vision provides feedback to the ripeness estimation algorithms and then to the control of the robotic arm toward dexterous harvesting. Detailed information regarding the position, orientation, and maturity status of the grapes within the field of view of the robot is required. In order for the grape bunches to be visible from the camera and for the robotic arm to approach them with safety, defoliation is partially needed. Defoliation practices [59] could expose the grape bunches and facilitate grape bunch detection and removal. The robotic vehicle needs to move with a selected speed, depending on the terrain, that would allow detection. Moreover, the robot should ideally harvest under stable lighting conditions, i.e., in the morning sun on the same side of the canopy. The images to train the machine vision algorithms should be optimally taken at the same time and under the same conditions of lighting, distance, height, etc.
Another challenge is the trade-off between speed, accuracy, and robustness. Prediction and actions should be carried out quickly with adequate accuracy by the robot. As observed in Table 8, the processing time of algorithms is not always available, since most of them were tested at a simulation level and not employed in practical real-time applications. In general, effective systems need higher accuracies in lower processing time. The processing time is of great importance when it comes to real-time applications, to the point of sacrificing a bit of accuracy in order to achieve better processing time toward automating time-consuming processes.
Table 8. Integration ability of intact/on-site applied referenced methodologies to agrobots.
Ref.Integrated to Agrobots/Harvest ActionsAdvantagesLimitations/ReviewEquipmentTimePerformance
[22]No/NoRipeness estimation in real-time and construction of georegistered spatial maps during growing season.Segmentation algorithm fails due to the range of cirle radius and the weak gradient across grape boundaries.
A monitoring agrobot.
<Not defined><Not defined>Up to 96.88% classification rate
[24]Yes/NoReal-time ripeness estimation, generation of spatial maps to show distribution of color development, can enable selective harvesting, better imaging results compared to human measurements.Uses a flash illumination system, great variations in color development across vineyards due to not dense measurements.
A monitoring robot.
RGB Point grey Grasshopper cameras (8.8mm lens, baseline 90 mm) and a pair of Xenon flashlamps (5−10 J)0.2 s 0.56 R2
[28]No/NoRobust method that uses color images, method able to detect complex and high non-linear relashionships.Huge image data is required.
It has the potential to be integrated in a harvesting agrobot.
Smartphone one plus 3T<Not defined>Up to 79% classification rate
[29]Yes/Yes Ripeness estimation in real-time and decision making upon harvesting the detected grapes according to the estimated maturity degree. The method takes into account all order statistics extracted from image histograms.Only the green channel of RGB color space is investigated, small image dataset acquired from video frames.
Able for monitoring and harvesting, already integrated in an agrobot [60].
<Sensor on simulation is not defined, based on video frames of public dataset>
ZED Mini 3D IMU Camera (on-site)
0.125 s5.36% average error
[34]No/NoCan provide rapidly spatial information for crop’s status in farm scale, determine maturity zones.Does not perform in real-time. Acquired images first need to be processed to derive vineyard maps.
Depends on UAV images and therefore cannot be integrated.
Multispectral camera
Multispec 4C, Airinov, France (12 cm pixel size on the ground, 13 mm
lens-to-focus
distance
<Not defined>Up to 83.33% classification rate
[37]Yes/NoRipeness estimation is performed in real-time while the agrobot is moving.Ripeness estimation is determined for a block of five trees not for each cluster in the image.
It is a monitoring agrobot and no action is further taken, i.e., harvest.
Push broom Resonon Pika L VNIR hyperspectral imaging
Camera, Resonon, Bozeman, MA, USA (8 mm focal length)
0.84 s Up to 83.30% classification rate
The development of agrobots combines many disciplines and specialists: agronomists, engineers, mechatronics, intelligent modeling, system design, deep learning, machine vision, etc. The requirements of such a robot call for powerful equipment and talented specialists. High precision robotic arms, dexterous end-effectors, powerful computational devices, precise imaging systems, and corresponding robust algorithms. The latter poses an additional challenge, the low development cost of an agrobot. Table 8 includes details regarding the sensor being used in the reported methods. The existing technologies and algorithms may overcome many difficulties in processing time and demonstrate high accuracies with relatively low costs. However, there is still room for improvement. Future agrobots must rely on affordable equipment and be capable of decision-making in more complex situations, responding to sudden environmental changes. It should be noted that an agrobot is fully exposed to hazardous environmental conditions that affect the performance of sensors and algorithms; its parts and mounted equipment are exposed to heat, humidity, dust, especially in the summer when harvest takes place. Provision should be made to cover parts of the robot that are sensitive and should not be exposed to the environment and to cool the equipment that is at risk of overheating.
According to the above, the integration of machine vision algorithms into harvesting robots needs to overcome numerous challenges. It is a long and complex process that is already underway by researchers. The latter is one of the aims of this work; to investigate the state-of-the-art in this specific field of machine vision algorithms for ripeness estimation in viticulture automation.

7. Conclusions

Nowadays, fruits are still harvested manually by fruit pickers who must decide on fruit maturity before picking or harvest everything under the guidance of experts based on subjective criteria and extensive sampling followed by chemical analyses. Maturity is critical for the storage life of harvested fruits and the quality of table grapes and produced wines. The maturity level designates the way grapes are further processed, taken care of, marketed, and transported. Machine vision algorithms are employed for grape ripeness estimation as a non-destructive, labor-saving, cost-effective, and eco-friendly alternative. Machine vision-based ripeness estimation considers mainly color, textural and morphological features with different machine learning algorithms. In some cases, the correlation of the extracted features to chemical or other grape ripeness attributes leads to enhanced estimations.
This work provides an overview of the work conducted in the field of agricultural machine vision toward grape ripening estimation, highlights challenges and limitations of different methods, and points out the most effective ones that could be integrated into agricultural robots for automating the grape harvesting process. This work is meant to be a complete guide for up-to-date machine vision algorithms for grape ripeness estimation so that researchers can select and adapt the algorithms that best fit their application.

Author Contributions

Conceptualization, G.A.P., V.G.K. and T.P.P.; investigation, E.V., C.B. and M.M.; writing—original draft preparation, E.V., C.B. and M.M.; writing—review and editing, E.V., G.A.P., V.G.K. and T.P.P.; visualization, G.A.P., V.G.K. and T.P.P.; supervision, G.A.P.; project administration, G.A.P. All authors have read and agreed to the published version of the manuscript.

Funding

This research has been co-financed by the European Regional Development Fund of the European Union and Greek national funds through the Operational Program Competitiveness, Entrepreneurship and Innovation, under the call RESEARCH—CREATE—INNOVATE (project code: T1EDK-00300).

Institutional Review Board Statement

Not applicable.

Informed Consent Statement

Not applicable.

Conflicts of Interest

The authors declare no conflict of interest. The funders had no role in the design of the study; in the collection, analyses, or interpretation of data; in the writing of the manuscript, or in the decision to publish the results.

References

  1. Sohaib Ali Shah, S.; Zeb, A.; Qureshi, W.S.; Arslan, M.; Ullah Malik, A.; Alasmary, W.; Alanazi, E. Towards fruit maturity estimation using NIR spectroscopy. Infrared Phys. Technol. 2020, 111, 103479. [Google Scholar] [CrossRef]
  2. Power, A.; Truong, V.K.; Chapman, J.; Cozzolino, D. From the Laboratory to The Vineyard—Evolution of The Measurement of Grape Composition using NIR Spectroscopy towards High-Throughput Analysis. High-Throughput 2019, 8, 21. [Google Scholar] [CrossRef] [PubMed] [Green Version]
  3. Drappier, J.; Thibon, C.; Rabot, A.; Geny-Denis, L. Relationship between wine composition and temperature: Impact on Bordeaux wine typicity in the context of global warming—Review. Crit. Rev. Food Sci. Nutr. 2019, 59, 14–30. [Google Scholar] [CrossRef] [PubMed]
  4. Cramer, G.R.; Cochetel, N.; Ghan, R.; Destrac-Irvine, A.; Delrot, S. A sense of place: Transcriptomics identifies environmental signatures in Cabernet Sauvignon berry skins in the late stages of ripening. BMC Plant Biol. 2020, 20, 41. [Google Scholar] [CrossRef] [Green Version]
  5. González-Lázaro, M.; Martínez-Lapuente, L.; Guadalupe, Z.; Ayestaran, B.; Bueno-Herrera, M.; López de la Cuesta, P.; Pérez-Magariño, S. Evaluation of grape ripeness, carbonic maceration and pectolytic enzymes to improve the chemical and sensory quality of red sparkling wines. J. Sci. Food Agric. 2020, 100, 2618–2629. [Google Scholar] [CrossRef]
  6. Jackson, R.S. Innovations in Winemaking. In Science and Technology of Fruit Wine Production; Elsevier: Amsterdam, The Netherlands, 2017; pp. 617–662. ISBN 9780128010341. [Google Scholar]
  7. Mavridou, E.; Vrochidou, E.; Papakostas, G.A.; Pachidis, T.; Kaburlasos, V.G. Machine Vision Systems in Precision Agriculture for Crop Farming. J. Imaging 2019, 5, 89. [Google Scholar] [CrossRef] [PubMed] [Green Version]
  8. Tian, H.; Wang, T.; Liu, Y.; Qiao, X.; Li, Y. Computer vision technology in agricultural automation—A review. Inf. Process. Agric. 2020, 7, 1–19. [Google Scholar] [CrossRef]
  9. Rothen, F. International Organisation of Vine and Wine (OIV). In International Code of Oenological Practices; International Organisation of Vine and Wine (OIV): Paris, France, 2021; ISBN 978-2-85038-030-3. [Google Scholar]
  10. Wolf, T. Wine Production Guide for Eastern North America (NRAES 145); Natural Resource, Agriculture, and Engineering Service (NRAES): Ithaca, NY, USA, 2008. [Google Scholar]
  11. Bisson, L. In search of optimal grape maturity. Pract. Winer. Vineyard J. 2001, 23, 32–34. [Google Scholar]
  12. Rabot, A. Using of a combined approach by biochemical and image analysis to develop a new method to estimate seed maturity stage for Bordeaux area grapevine. OENO One 2017, 51, 29–35. [Google Scholar] [CrossRef] [Green Version]
  13. Hernández-Hierro, J.M.; Nogales-Bueno, J.; Rodríguez-Pulido, F.J.; Heredia, F.J. Feasibility Study on the Use of Near-Infrared Hyperspectral Imaging for the Screening of Anthocyanins in Intact Grapes during Ripening. J. Agric. Food Chem. 2013, 61, 9804–9809. [Google Scholar] [CrossRef]
  14. Rodríguez-Pulido, F.J.; Gómez-Robledo, L.; Melgosa, M.; Gordillo, B.; González-Miret, M.L.; Heredia, F.J. Ripeness estimation of grape berries and seeds by image analysis. Comput. Electron. Agric. 2012, 82, 128–133. [Google Scholar] [CrossRef]
  15. Rodríguez-Pulido, F.J.; Ferrer-Gallego, R.; Lourdes González-Miret, M.; Rivas-Gonzalo, J.C.; Escribano-Bailón, M.T.; Heredia, F.J. Preliminary study to determine the phenolic maturity stage of grape seeds by computer vision. Anal. Chim. Acta 2012, 732, 78–82. [Google Scholar] [CrossRef] [PubMed]
  16. Gowen, A.; Odonell, C.; Cullen, P.; DowneyY, G.; Frias, J. Hyperspectral imaging—An emerging process analytical tool for food quality and safety control. Trends Food Sci. Technol. 2007, 18, 590–598. [Google Scholar] [CrossRef]
  17. ElMasry, G.; Wang, N.; ElSayed, A.; Ngadi, M. Hyperspectral imaging for nondestructive determination of some quality attributes for strawberry. J. Food Eng. 2007, 81, 98–107. [Google Scholar] [CrossRef]
  18. Taghizadeh, M.; Gowen, A.A.; O’Donnell, C.P. Comparison of hyperspectral imaging with conventional RGB imaging for quality evaluation of Agaricus bisporus mushrooms. Biosyst. Eng. 2011, 108, 191–194. [Google Scholar] [CrossRef]
  19. Versari, A.; Parpinello, G.P.; Mattioli, A.U.; Galassi, S. Determination of grape quality at harvest using Fourier-transform mid-infrared spectroscopy and multivariate analysis. Am. J. Enol. Vitic. 2008, 59, 317–322. [Google Scholar]
  20. Martelo-Vidal, M.J.; Vázquez, M. Evaluation of ultraviolet, visible, and near infrared spectroscopy for the analysis of wine compounds. Czech J. Food Sci. 2014, 32, 37–47. [Google Scholar] [CrossRef] [Green Version]
  21. Cozzolino, D.; Dambergs, R.G.; Janik, L.; Cynkar, W.U.; Gishen, M. Analysis of Grapes and Wine by near Infrared Spectroscopy. J. Near Infrared Spectrosc. 2006, 14, 279–289. [Google Scholar] [CrossRef]
  22. Rahman, A.; Hellicar, A. Identification of mature grape bunches using image processing and computational intelligence methods. In Proceedings of the 2014 IEEE Symposium on Computational Intelligence for Multimedia, Signal and Vision Processing (CIMSIVP), Orlando, FL, USA, 9–12 December 2014; pp. 1–6. [Google Scholar]
  23. Avila, F.; Mora, M.; Oyarce, M.; Zuñiga, A.; Fredes, C. A method to construct fruit maturity color scales based on support machines for regression: Application to olives and grape seeds. J. Food Eng. 2015, 162, 9–17. [Google Scholar] [CrossRef]
  24. Pothen, Z.; Nuske, S. Automated Assessment and Mapping of Grape Quality through Image-based Color Analysis. IFAC-PapersOnLine 2016, 49, 72–78. [Google Scholar] [CrossRef]
  25. Xia, Z.; Wu, D.; Nie, P.; He, Y. Non-invasive measurement of soluble solid content and pH in Kyoho grapes using a computer vision technique. Anal. Methods 2016, 8, 3242–3248. [Google Scholar] [CrossRef]
  26. Hernández, S.; Morales, L.; Urrutia, A. Unsupervised learning for ripeness estimation from grape seeds images. Int. J. Smart Sens. Intell. Syst. 2017, 10, 594–612. [Google Scholar] [CrossRef] [Green Version]
  27. Cavallo, D.P.; Cefola, M.; Pace, B.; Logrieco, A.F.; Attolico, G. Non-destructive and contactless quality evaluation of table grapes by a computer vision system. Comput. Electron. Agric. 2019, 156, 558–564. [Google Scholar] [CrossRef]
  28. Kangune, K.; Kulkarni, V.; Kosamkar, P. Grapes Ripeness Estimation using Convolutional Neural network and Support Vector Machine. In Proceedings of the 2019 Global Conference for Advancement in Technology (GCAT 2019), Bangalore, India, 18–20 October 2019. [Google Scholar]
  29. Kaburlasos, V.G.; Vrochidou, E.; Lytridis, C.; Papakostas, G.A.; Pachidis, T.; Manios, M.; Mamalis, S.; Merou, T.; Koundouras, S.; Theocharis, S.; et al. Toward Big Data Manipulation for Grape Harvest Time Prediction by Intervals’ Numbers Techniques. In Proceedings of the 2020 International Joint Conference on Neural Networks (IJCNN), Glasgow, UK, 28 September 2020; pp. 1–6. [Google Scholar]
  30. Ramos, R.P.; Gomes, J.S.; Prates, R.M.; Simas Filho, E.F.; Teruel, B.J.; Dos Santos Costa, D. Non-invasive setup for grape maturation classification using deep learning. J. Sci. Food Agric. 2021, 101, 2042–2051. [Google Scholar] [CrossRef]
  31. Baiano, A.; Terracone, C.; Peri, G.; Romaniello, R. Application of hyperspectral imaging for prediction of physico-chemical and sensory characteristics of table grapes. Comput. Electron. Agric. 2012, 87, 142–151. [Google Scholar] [CrossRef]
  32. Fernandes, A.M.; Franco, C.; Mendes-Ferreira, A.; Mendes-Faia, A.; da Costa, P.L.; Melo-Pinto, P. Brix, pH and anthocyanin content determination in whole Port wine grape berries by hyperspectral imaging and neural networks. Comput. Electron. Agric. 2015, 115, 88–96. [Google Scholar] [CrossRef]
  33. Gomes, V.; Fernandes, A.; Martins-Lopes, P.; Pereira, L.; Mendes Faia, A.; Melo-Pinto, P. Characterization of neural network generalization in the determination of pH and anthocyanin content of wine grape in new vintages and varieties. Food Chem. 2017, 218, 40–46. [Google Scholar] [CrossRef] [PubMed]
  34. Iatrou, G.; Mourelatos, S.; Gewehr, S.; Kalaitzopoulou, S.; Iatrou, M.; Zartaloudis, Z. Using multispectral imaging to improve berry harvest for wine making grapes. Ciênc. e Téc. Vitiviníc. 2017, 32, 33–41. [Google Scholar] [CrossRef] [Green Version]
  35. Zhang, N.; Liu, X.; Jin, X.; Li, C.; Wu, X.; Yang, S.; Ning, J.; Yanne, P. Determination of total iron-reactive phenolics, anthocyanins and tannins in wine grapes of skins and seeds based on near-infrared hyperspectral imaging. Food Chem. 2017, 237, 811–817. [Google Scholar] [CrossRef] [PubMed]
  36. Baca-Bocanegra, B.; Nogales-Bueno, J.; Heredia, F.; Hernández-Hierro, J. Estimation of Total Phenols, Flavanols and Extractability of Phenolic Compounds in Grape Seeds Using Vibrational Spectroscopy and Chemometric Tools. Sensors 2018, 18, 2426. [Google Scholar] [CrossRef] [Green Version]
  37. Gutiérrez, S.; Tardaguila, J.; Fernández-Novales, J.; Diago, M.P. On-the-go hyperspectral imaging for the in-field estimation of grape berry soluble solids and anthocyanin concentration. Aust. J. Grape Wine Res. 2019, 25, 127–133. [Google Scholar] [CrossRef] [Green Version]
  38. Gabrielli, M.; Lançon-Verdier, V.; Picouet, P.; Maury, C. Hyperspectral Imaging to Characterize Table Grapes. Chemosensors 2021, 9, 71. [Google Scholar] [CrossRef]
  39. Das, A.J.; Wahi, A.; Kothari, I.; Raskar, R. Ultra-portable, wireless smartphone spectrometer for rapid, non-destructive testing of fruit ripeness. Sci. Rep. 2016, 6, 32504. [Google Scholar] [CrossRef] [PubMed] [Green Version]
  40. Daniels, A.J.; Poblete-Echeverría, C.; Opara, U.L.; Nieuwoudt, H.H. Measuring Internal Maturity Parameters Contactless on Intact Table Grape Bunches Using NIR Spectroscopy. Front. Plant Sci. 2019, 10, 1517. [Google Scholar] [CrossRef] [Green Version]
  41. Zoecklein, B.W. Grape Maturity, Section 4; Virginia Polytechnic Institute and State University: Blacksburg, VA, USA, 2017; pp. 1–18. [Google Scholar]
  42. HuMaIN-Lab Ripeness Estimation Video Frames Dataset. Available online: https://github.com/humain-lab/ripeness-estimation-videoframes-dataset (accessed on 28 July 2021).
  43. Seng, J.; Ang, K.; Schmidtke, L.; Rogiers, S. Grape Image Database. Available online: https://researchoutput.csu.edu.au/en/datasets/grape-image-database (accessed on 28 July 2021).
  44. Davies, E.R. Machine Vision; Elsevier: Amsterdam, The Netherlands, 2005; ISBN 9780122060939. [Google Scholar]
  45. Andreoli, V.; Cassardo, C.; Iacona, T.; Spanna, F. Description and Preliminary Simulations with the Italian Vineyard Integrated Numerical Model for Estimating Physiological Values (IVINE). Agronomy 2019, 9, 94. [Google Scholar] [CrossRef] [Green Version]
  46. Cassardo, C.; Andreoli, V.; Spanna, F. Validation of IVINE crop growth model using MACSUR2 project measurements in a few European vineyards. In Proceedings of the EGU General Assembly Conference Abstracts, Online, 4–8 May 2020; p. 18259. [Google Scholar]
  47. Mania, E.; Andreoli, V.; Cavalletto, S.; Cassardo, C.; Guidoni, S. VICMOTO: Physical modeling and numerical simulation applied to vineyard. In Proceedings of the BIO Web of Conferences, Piacenza, Italy, 9–11 July 2019; Volume 13, p. 02006. [Google Scholar]
  48. Andreoli, V.; Cassardo, C.; Cavalletto, S.; Ferrarese, S.; Guidoni, S.; Mania, E. Measurements and simulations with the crop growth model VICMOTO in Nebbiolo vineyards. In Proceedings of the EGU General Assembly Conference Abstracts, Vienna, Austria, 7–12 April 2019; Volume 21. [Google Scholar]
  49. Brisson, N.; Gary, C.; Justes, E.; Roche, R.; Mary, B.; Ripoche, D.; Zimmer, D.; Sierra, J.; Bertuzzi, P.; Burger, P.; et al. An overview of the crop model stics. Eur. J. Agron. 2003, 18, 309–332. [Google Scholar] [CrossRef]
  50. Carteni, F.; Rossi, C.; Marcos, R.; Porras, I.; Basile, B.; Scognamiglio, P.; Teobaldelli, M.; Mataffo, A.; Mazzoleni, S.; Garcia-Tejera, O.; et al. LEAF: A process-based model of berry ripening in vineyards. In Proceedings of the 2019 IEEE International Workshop on Metrology for Agriculture and Forestry (MetroAgriFor), Portici, Italy, 24–26 October 2019; pp. 152–157. [Google Scholar]
  51. Kaburlasos, V.; Spais, V.; Petridis, V.; Petrou, L.; Kazarlis, S.; Maslaris, N.; Kallinakis, A. Intelligent clustering techniques for prediction of sugar production. Math. Comput. Simul. 2002, 60, 159–168. [Google Scholar] [CrossRef]
  52. Matese, A.; Di Gennaro, S.F. Technology in precision viticulture: A state of the art review. Int. J. Wine Res. 2015, 7, 69–81. [Google Scholar] [CrossRef] [Green Version]
  53. Arad, B.; Balendonck, J.; Barth, R.; Ben-Shahar, O.; Edan, Y.; Hellström, T.; Hemming, J.; Kurtser, P.; Ringdahl, O.; Tielen, T.; et al. Development of a sweet pepper harvesting robot. J. Field Robot. 2020, 37, 1027–1039. [Google Scholar] [CrossRef]
  54. Li, B.; Ling, Y.; Zhang, H.; Zheng, S. The Design and Realization of Cherry Tomato Harvesting Robot Based on IOT. Int. J. Online Eng. 2016, 12, 23–26. [Google Scholar] [CrossRef]
  55. Xiong, Y.; Ge, Y.; Grimstad, L.; From, P.J. An autonomous strawberry-harvesting robot: Design, development, integration, and field evaluation. J. Field Robot. 2020, 37, 202–224. [Google Scholar] [CrossRef] [Green Version]
  56. Tardaguila, J.; Rovira-Más, F.; Blasco, J.; Saiz-Rubio, V.; Faenzi, E.; Évain, S.; Labails, S.; Stoll, M.; Scheidweiler, M.; Millot, C.; et al. VineRobot: A new robot for vineyard monitoring using non-invasive sensing technologies. In Proceedings of the International Cool Climate Wine Symposium, Brighton, UK, 26–28 May 2016. [Google Scholar]
  57. VINBOT. Available online: http://vinbot.eu/ (accessed on 15 July 2021).
  58. Roure, F.; Moreno, G.; Soler, M.; Faconti, D.; Serrano, D.; Astolfi, P.; Bardaro, G.; Gabrielli, A.; Bascetta, L.; Matteucci, M. GRAPE: Ground Robot for vineyArd Monitoring and ProtEction. In Advances in Intelligent Systems and Computing; Springer: Cham, Switzerland, 2018; pp. 249–260. [Google Scholar]
  59. Sivilotti, P.; Falchi, R.; Herrera, J.C.; Škvarč, B.; Butinar, L.; Sternad Lemut, M.; Bubola, M.; Sabbatini, P.; Lisjak, K.; Vanzo, A. Combined Effects of Early Season Leaf Removal and Climatic Conditions on Aroma Precursors in Sauvignon Blanc Grapes. J. Agric. Food Chem. 2017, 65, 8426–8434. [Google Scholar] [CrossRef] [PubMed]
  60. Vrochidou, E.; Tziridis, K.; Nikolaou, A.; Kalampokas, T.; Papakostas, G.A.; Pachidis, T.P.; Mamalis, S.; Koundouras, S.; Kaburlasos, V.G. An Autonomous Grape-Harvester Robot: Integrated System Architecture. Electronics 2021, 10, 1056. [Google Scholar] [CrossRef]
Figure 1. Evolution of grape ripeness estimation techniques.
Horticulturae 07 00282 g001
Figure 2. The main UV/VIS/NIR wavelengths associated with chemical compounds in grapes.
Horticulturae 07 00282 g002
Table 1. List of chemical attributes used as maturity indices.
Chemical AttributesUnit
Soluble solid content (SSC) or total soluble solids (TSS)°Brix
Titratable acidity (TA)g L−1
SSC/TA°Brix/g L−1
pH<Logarithmic scale>
Volatile compoundsμg L−1
Phenolic compounds (Polyphenols)mg g−1
Anthocyanins, tannins, terpenesmg g−1
Chlorophyllμg L−1
Antioxidantsmmol g−1
Flavanols/Total Flavonoid Content (TF)mg g−1
Table 2. SSC, pH, and TA indicative limits in ripened grapes.
Basic Chemical Attributes’ Limits in Ripened Wine Grapes
3.2 < pH < 3.5
20 < SSC < 23
4 < TA < 7
Table 3. List of sensory attributes used as maturity indices.
Sensory Attributes
Visual attributesBrowning of stalks and pedicels
Turgidity of stalks and pedicels
Berry color uniformity
Presence of spots and rots on berries
Grape seed morphological parameters (roundness, length, width, area, aspect, heterogeneity, perimeter, aspect ratio)
Color scale
Grape seed browning index
Olfactory attributesGrape fruity flavor
Fruity flavor different from grape
Fermented flavor
Recognizable varietal aroma
Taste/tactile attributesHardness, crispness, juiciness, sweetness
Acidity
Astringency
Grape fruity taste intensity
Intensity of fruity taste different from grape
Intensity of fermented taste
Abscission of berries
Overall Liking Score (OLS)
Table 4. Applications of color imaging for grape ripeness estimation.
CultivarMaturity IndexColor SpaceFeaturesNumber of ImagesPre-ProcessingPrediction ModelEvaluation
R-Squared (R2)
YearRef.
Red grapes:
Vitis vinifera L. cv. Graciano
21 phenolic compoundsCIELABColorimetric, chromatic heterogeneity, morphological15,000Thresholding, CIELAB color channel value and morphological variables extractionForward stepwise multiple regressorUp to 0.972012[15]
Red grapes:
Syrah, Tempranillo
White grapes:
Zalema cultivated in
Sand and Clay soil
Visual assessmentCIELAB
HSI
Colorimetric, morphological 100Histogram thresholding segmentation, morphological restrictions, CIELAB and HSI color channel values, browning index, color ellipsesDiscriminant analysisClassification rates
100% (Red-Syrah)
87.50% (Red-Tempranillo)
71.43% (White-Zalema-Sand)
57.14% (White-Zalema-Clay)
2012[14]
White grapes in Cambridge, TasmaniaVisual assessmentRGB
HSV
Colorimetric, texture31Circle detection and classification by k-means, color and texture feature extraction, filteringSupport Vector Machine (SVM)Classification rates of up to 96.88%2014[22]
<Not defined>Visual assessment (color scale)CIELAB
Invariant illumination color model c1c2c3
Colorimetric450Segmentation, representative color estimationSupport Vector Regressor (SVR)Mean Squared Error
22.64
2015[23]
Red grapes:
Flame Seedless
Visual assessment (color scale)HSVColorimetric<Not defined>Berries detection algorithm, berries counting, color measurement extraction Grading scheme for categorizing clusters based on color development0.562016[24]
Red grapes:
Kyoto grapes
SSC
pH
RGB
HIS
NTSC
YCbCr
HSV
CMY
Colorimetric180Color feature extraction in different color spaces from arithmetically calculated images, calibration algorithmMultiple Linear Regressor (MLR), Partial Least-Squares Regressor (PLSR)Mean Squared Error
pH: 0.0987 (MLR), 0.1257 (PLSR)
SSC: 0.7982 (MLR), 0.9252 (PLSR)
2016[25]
<Not defined>Visual assessment RGB
HSV
Colorimetric289Image color distribution, segmentation algorithm, color discretizationDirichlet Mixture Model (DMM)125.04 Perplexity
0.29 Average perplexity per color
2017[26]
White grapes:
Italia, Victoria
Visual assessmentHSV
CIELAB
Colorimetric800Estimation of color variations, white-balance, denoising, segmentation, thresholdingRandom Forest (RF)Cross-Validation classification accuracy
Up to 100% (Italia)
Up to 0.92 (Victoria)
2019[27]
White grapes:
Sonaka
Visual assessmentRGB
HSV
Colorimetric, morphological4000Denoising, color features extractionConvolutional Neural Network (CNN), Support Vector Machine (SVM)Classification rates
79% (CNN)
69% (SVM)
2019[28]
Red grapes:
Cabernet Sauvignon
Visual assessmentRGBColorimetric13Segmentation algorithm, color histogram extractionNeural Network (NN)Average Error
5.36%
2020[29]
Red grapes:
Syrah, Cabernet Sauvignon
TSS Anthocyanins
Flavonoids
RGBTexture2880Image adjustment, pixel normalizationConvolutional Neural Networks (CNN)Classification rates
93.41% (Syrah)
72.66% (Cabernet)
2021[30]
Table 5. Applications of hyperspectral imaging for grape ripeness estimation.
CultivarMaturity IndexSpectral Range (nm)Number of ImagesPre-ProcessingPrediction ModelEvaluation R-Squared (R2)YearRef.
Red grapes:
Michele Palieri, Red Globe, Crimson Seedless
White grapes:
Pizzutello, Thompson, Italia, Baresana Seedless
Sensory evaluation
SSC
TA
pH
400–1000140Binary segmentation mask, morphological structured element erosion, mean-centering correction, Predicted REsidual Sums of Squares (P.RE.S.S.) statisticPartial Least Square Regressor (PLSR)TA: 0.95 (white), 0.82 (red)
SSC: 0.94 (white), 0.93 (red)
pH: 0.80 (white), 0.90 (red)
2012[31]
Red grapes:
Touriga Franca (TF)
pH
SSC
Anthocyanin
380–1028240Reflectance determination, Principal component analysis (PCA) to reduce input data dimensionalityNeural Network (NN)pH: 0.73
SSC: 0.92
Anthocyanin: 0.95
2015[32]
Red grapes:
Touriga Franca (TF), Touriga Nacional (TN), Tinta
Barroca (TB)
pH
Anthocyanin
380–1028225Reflectance determination, spectrum normalizationNeural Network (NN)pH: 0.723 (TF), 0.661 (TN), 0.710 (TB)
Anthocyanin: 0.906 (TF), 0.751 (TN), 0.697 (TB)
2017[33]
White grapes:
cv. Malagousia
TSS
pH
510–79012Calculation of Carotenoid Reflectance Index 1 and 2, Structure Intensive Pigment Index, Pigment Specific Simple Ratio Carotenoids, Normalized Difference Vegetation IndexMultiple Linear Regressor (MLR),
Support Vector Machine (SVM)
Classification rates
TSS: 83.33% (MLR), 83.33% (SVM)
pH: 75% (MLR), 75% (SVM)
2017[34]
Red grapes:
Cabernet Sauvignon, Shiraz, Pinot Noir, Marselan, Meili
Phenolic contents865–1711120Outliers’ detection, image correction, pretreatment methods for spectral data, threshold segmentation methodPrincipal component regression (PCR), PLSR and Support Vector
Regression (SVR)
Between 0.8789–0.92432017[35]
Red grapes:
Syrah, Tempranillo
Flavanols
Total phenols
900–1700200Correction, segmentation, average reflectance spectra and relative absorbances calculation Principal Component Analysis (PCA), Modified Partial Least Squares (MPLS), K-means cluster analysis, Linear Discriminant Analysis (LDA)Classification rates
Up to 83.30% (leave-one-out cross-validation)
Up to 76.90% (external validation)
2018[36]
Red grapes:
Vitis vinifera, (L.) cultivar Tempranillo
TSS
Anthocyanins
400–1000144Standard normal variate and Saitzky–Golay filterEpsilon-Support Vector Machines
(ε-SVMs)
TSS: 0.92
Anthocyanins: 0.83
2018[37]
White grapes:
Sugarone Superior Seedless, Thompson Seedless,
Victoria
Red grapes:
Sable Seedless, Alphonse Lavallée, Lival, Black Magic
TSS
TA
TF
411–1000150Image correction with dark reference, spectral response extraction, selection of effective wavelengths and physicochemical parameters predictionMultiple
Linear Regression (MLR) models, PLS regression model
TF: 0.93 (MLR), 0.95 (PLS)
TA: 0.98 (MLR), 0.99 (PLS)
TSS: 0.86 (MLR), 0.94 (PLS)
2021[38]
Table 6. Applications of NIR spectroscopy for grape ripeness estimation.
CultivarMaturity IndexSpectrometerSpectral RangeModeNumber of ImagesPre-ProcessingPrediction ModelEvaluation
R-Squared (R2)
YearRef.
Red grapes:
Vitis vinifera L. cv. Tempranillo, Syrah
AnthocyaninsNIR900–1700Reflectance99Calibration, discriminant method, outlier detection Principal Component Analysis0.862013[13]
Table 7. Peculiarities and characteristics of the referenced methodologies.
Ref.Intact/On-Site EstimationLimitations/Review
[15]No/NoApplied to grape seeds in an in-lab closed illumination box with a digital camera, illumination-dependent
[14]No/NoApplied to grape seeds and grape berries in an in-lab illumination box with a digital camera, illumination-dependent
[22]Yes/YesApplied to grape bunches on-site, fails occasionally due to segmentation algorithm setup of berries circle radius and circle detection algorithm
[23]No/NoApplied to grape seeds and berries in an in-lab set
[24]Yes/YesApplied to grape bunches, camera system mounted on a vehicle
[25]No/NoApplied to grape berries, cost-effective in-lab setup
[26]No/NoApplied to grape seeds, in-lab, depends only on color histograms
[27]Yes/NoApplied to grape bunches, in-lab set, on a black background, under eight halogen lamps
[28]Yes/YesApplied to grape bunches on site by using a smartphone camera
[29]Yes/YesApplied to grape bunches on site, pilot study where only the green color channel histograms were selected and post-processed
[30]No/NoApplied to grape berries, in-lab inside a dark chamber, with 15 3W LED red, green, blue, warm white, and cool white illuminants
[31]No/NoApplied to removed grape berries in an in-lab dark room, use of costly hyperspectral imaging system
[32]Yes/NoApplied to grape bunch in-lab inside a dark room under blue reflector lamps, only six berries as samples from each bunch
[33]Yes/NoApplied to grape bunch in-lab dark room under blue reflector lamps, only six berries as samples from each bunch, low generalization ability
[34]Yes/YesFarm scale, based on a hypothesis on carotenoid content
[35]No/NoApplied to grape skins and seeds, under an illumination unit of four tungsten halogen lamps
[36]No/NoApplied to grape seeds, in-lab under iodine halogen lamps
[37]Yes/YesApplied to grape bunches on-site, using images acquired by a motorized platform
[38]No/NoApplied to grape berries in a box under a quartz tungsten halogen lighting unit
[13]No/NoApplied to grape berries in-lab under illumination source
Publisher’s Note: MDPI stays neutral with regard to jurisdictional claims in published maps and institutional affiliations.

