Article

The Effects of Different Fertilization Practices in Combination with the Use of PGPR on the Sugar and Amino Acid Content of Asparagus officinalis

by
Nikolaos Xekarfotakis
1,
Theocharis Chatzistathis
2,
Magkdi Mola
1,
Triantafyllia Demirtzoglou
3 and
Nikolaos Monokrousos
1,*
1
University Center of International Programmes of Studies, International Hellenic University, 57001 Thessaloniki, Greece
2
Institute of Soil and Water Resources, Hellenic Agricultural Organization-Demeter, 57001 Thessaloniki, Greece
3
Department of Research & Development of HUMOFERT Co., 14452 Athens, Greece
*
Author to whom correspondence should be addressed.
Horticulturae 2021, 7(11), 507; https://doi.org/10.3390/horticulturae7110507
Submission received: 20 October 2021 / Revised: 14 November 2021 / Accepted: 16 November 2021 / Published: 18 November 2021

Abstract

:
The present study examined the effects of different nitrogen (NH4NO3) and potassium (KNO3) fertilization levels in combination with a nitrogen-fixing, plant growth-promoting rhizobacteria (PGPR) inoculation on the carbohydrate (CHO), amino acid content, and nutrient concentrations (N, P, K) in the spears and the root system of asparagus plants. No significant differences were indicated between the different fertilization treatments regarding N, P, and K in the leaves and roots of asparagus. The inoculation of the asparagus fields with PGPR, no matter the type of the inorganic fertilizer, resulted in increased CHO and amino acid content of the foliage and roots of asparagus. The highest CHO content and amino acid content were recorded in the treatment that combined PGPR inoculation along with KNO3 fertilizer, indicating that higher K applications acted synergistically with the added PGPR.

1. Introduction

Asparagus (Asparagus officinalis) is a seasonal, nearly ubiquitous crop of high economic importance, belonging to the top 20 vegetable crops cultivated worldwide [1]. Asparagus yield maximization is always a vital element that can determine the long-term profitability of its cultivation. Nevertheless, the yield determination of asparagus has been proven to be extremely complex since it is a perennial crop [2]. The productivity of asparagus is determined from a series of physiological processes that are strongly influenced by a wide range of environmental and management factors [3]. One critical, indisputable factor determining the potential yield of asparagus plantations is the stored soluble carbohydrates (CHO) in the root system [4], which is characterized by a gain and loss pattern during the crop’s annual cycle [2]. Sufficient availability of CHO is detrimental for spear growth during the harvesting period and the development of a vigorous fern canopy after the harvest [2].
The role of amino acids in plants’ growth and development has also received significant attention over recent decades. Several studies have highlighted the role of amino acids on protein synthesis, stress resistance, photosynthetic activity, the action of stomata, chelating effects, and phytohormone production [5,6,7]. Moreover, amino acids have been shown to enhance cells’ ability to uptake water and nutrients, which, in turn, increases vegetative growth [8].
The use of inorganic fertilizers is probably the most common practice that is used around the world to increase the productivity of most crops. As in most crops, the most important nutrients for asparagus growth are nitrogen (N), phosphorus (P), and potassium (K). Potassium is of great importance regarding asparagus cultivation. According to Vijay et al. [9], K has a vital role in the transfer and storage of CHO in the root system. Furthermore, it strengthens the stem and increases the tolerance of the crop in drought conditions. Vijay et al. [9] reported that, at a concentration of 160 mg K per kg of soil, the carbohydrate content of the asparagus plant was significantly higher in comparison to 40 and 80 mg K per kg of soil. Chlorophyll concentration has also been observed to be significantly higher. Generally, 30–40 kg K per acre is essential to achieve a good product performance. Increasing the applied K and reducing the applied N could be one alternative practice to achieve higher yields. However, only a limited number of studies [10,11] have recorded positive results in asparagus crop productivity when the applied N:K ratio is altered.
Over the past few decades, the use of plant growth-promoting rhizobacteria (PGPR) to enhance crop productivity has risen. These microorganisms can benefit plants either directly by increasing nutrient uptake or indirectly by preventing the harmful effects of various pathogen invasions [12]. The beneficial effects of PGPR inoculation have been studied in many agronomically important plants (e.g., legumes). The addition and the presence of PGPR in the rhizosphere of legumes have been shown to significantly improve the functions and growth of the crops by enhancing nutrient acquisition and nodulation [13,14,15], as well as regulating synergistic and symbiotic interactions [16,17] and the production of advantageous phytohormones [18,19]. On the contrary, the effects of PGPR in asparagus cultivation have not been studied extensively. Ge et al. [20] observed positive effects of PGPR when combined with vermicompost and cow manure on asparagus growth characteristics (root and leaf weight, leaf area index, and yield). Conversely, Liddycoat et al. [21] inoculated asparagus plants with Pseudomonas spp. UW3 and Pseudomonas putida UW4 to investigate their effects, but the specific PGPR strains did not improve any of the examined growth characteristics (shoot height, count and diameter, germination percentage, and seedling dry weight). Therefore, we are assuming that the use of certain PGPR species could act synergistically along with the altered N:K ratio of the inorganic fertilizers, as was recorded in studies related to other crop species [22,23], and thus, have better results in terms of increasing asparagus productivity and nutritional value. We chose to focus on these two macronutrients and not on P, as it has been demonstrated that increasing soil P levels had little effect on A. officinalis yield [24]. The use of nitrogen-fixing PGPR is arguably a great tool of the highest potential to improve agricultural productivity in the short term. These bacteria are well-known not only for nitrogen fixation but also for phytohormone production, which are considered the most important factors for plant growth promotion [25].
This study aimed to examine the effects of nitrogen-fixing PGPR and different inorganic fertilizers that alter the applied N:K ratio on the sugar, amino acid content, and nutrient concentrations (N, P, K) in the root systems of asparagus, as well as on the nutritional values of asparagus spears. More specifically, we examined the effect of different N:K fertilization ratios (with the use of different fertilizers KNO3 and NH4NO3) along with the application of PGPR in three samplings that were related to the A. officinalis growth stage (different stages of the assimilation period).

2. Materials and Methods

2.1. Study Area

The study area is located in Chrysoupoli, close to the city of Kavala, Eastern Macedonia, Northern Greece (with reference 40°55′29.21″ N and 24°43′15.35″ E). The climate of the area over the last decade, according to the Hellenic National Meteorological Service, can be described as an intermediate type between the Mediterranean and Continental climates. It is characterized by hot, dry summers and mild, moist winters. The coldest period is during January with an average temperature of 3.0 °C, while the hottest period is during July with an average temperature of 29.7 °C. The average annual temperature is 16.2 °C. Furthermore, the average monthly rainfall is 33.6 mm, with the highest rainfall being during November (67.4 mm) and the lowest during August (17.5 mm).
All cultivated areas were planted with 5-year-old A. officinalis plants (Herkolim variety) at a depth of 18–22 cm. The size of the cultivation field was 1 ha, and the soil texture can be classified as sandy loam (SL). The physicochemical properties of the cultivation area, as recorded at the beginning of the experiment, are presented in Table 1. The soil pH was acidic (6.18). In addition, the soil is rich in organic matter content (5.34%), indicating fertile soil.

2.2. Experimental Design and Cultivation Practices

The field experiment was conducted during the 2018–2019 growing season from June 2018 until February 2019. Fertilization was done in two phases. The first fertilization phase (middle of May) was the same for all treatments, representing the common agricultural practice of this region. More specifically, every treatment group received 100 kg/acre of 11-10-16 (N-P-K) and 40 kg/acre of 0-0-30-10 (N-P-K-Mg). In the second phase (middle of June), each treatment received a different type of fertilization. Our experimental design consisted of four treatments: (a) application of NH4NO3 fertilizer, which is the common agricultural practice and was considered as our control (C); (b) application of NH4NO3 in combination with PGPR (CM); (c) application of KNO3 fertilizer for higher K input; and (d) application of KNO3 in combination with PGPR (NKM). PGPR was applied with the use of the commercial product “Azoriz”. “Azoriz” contains bacteria of the genera Rhizobium and Azotobacter in a concentration of 2 × 10¹² cfu/L. “Azoriz” was applied through soil by spraying at a rate of 500 mL/acre, as was suggested by the production company (HUMOFERT ABETE, Athens, Greece). The application of the other fertilizers on each treatment, with the use of a centrifugal fertilizer spreader, was specifically diversified to achieve linear spread as close to the plant root area as possible.
During summer and early autumn (from June to late September), plants were provided with water every 9–12 days with the flood irrigation method. Furthermore, plants received frequent fungicide sprayings (every 10 days) with a mixture of suitable fungicides. Fungicide sprayings mainly aim to control rust, which is the main disease related to asparagus in the area. Tillage was performed every 20–30 days to allow soil aeration. Weeds between rows were controlled with the use of a rotary hoe.
Each treatment was repeated 4 times, and the plots (25 × 25 m each) were randomly arranged in the cultivation field. The application rates of the fertilizers and inoculants are presented in Table 2. Our overall factorial design consisted of two fertilization treatments × two PGPR management practices (application or not) × four plot replicates per treatment × three sampling periods.
Sampling of plant tissue took place three times during the experimental period. On the first sampling (16 July 2018), which was within the “leaf growth” period, leaves and roots were randomly collected from each plot. In the second sampling (24 October 2018), which was within the phase that necrosis of the leaves started, leaves and roots were randomly collected from each plot. Finally, in the third sampling (20 February 2019), which was within the “pre-harvest” period, only root samples were collected from each plot, since the above-ground part of the plant had been destroyed. Samples were stored at −20 °C until further analysis.

2.3. Soil Analyses

At first, soil samples were dried, sieved (mesh size 2 mm) and grinded. Soil organic N was measured with the Kjeldahl method [26]. Exchangeable K was measured in a soil sample extract with shaking after exposure to ammonium acetate with the use of a coupled induction plasma (ICP) system in comparison to standard solutions of known concentration of the respective elements [27]. Extractable P was measured spectrophotometrically in the soil sample extract after treatment with sodium bicarbonate in comparison with standard solutions of a known concentration of P dihydrogen phosphate [27].

2.4. Plant Tissue Analyses

Firstly, plant tissue samples were dried, grinded, and incinerated at 550 °C. Then, the ash was dissolved with HCl (6 N). Total N content was measured with the use of the Kjeldahl method [26]. Phosphorus was measured chromatometrically by using an HCI extract which was treated with molybdate and ammonium vanadate in comparison with standard potassium dihydrogen phosphate solutions [28]. Potassium was measured by using a coupled induction plasma (ICP) system in comparison with standard solutions of known concentration of the respective elements [29].

2.5. GC-MS Metabolite Profile Analysis

Analysis of metabolites was conducted according to the procedure that has been followed by Ainalidou et al. [30]. Peak area and chromatogram examinations were performed with the use of Xcalibur software. The evaluation of peak identification and mass spectra ticks was performed with the use of the NIST11 database. The quantification process of the detected metabolites was performed based on the relative response compared to the internal standard adonitol and expressed as relative abundance. Furthermore, detected sugars were classified into monosaccharides (tagatose, sorbose, fructose, glucose, galactose, xylose and arabinose) and disaccharides (maltose, sucrose, lactulose and turanose), while detected amino acids were classified into hydrophobic (alanine, valine, leucine, isoleucine, proline and glycine) and hydrophilic (threonine, glutamine, asparagine, lysine and tyrosine).

2.6. Statistical Analyses

Two-way ANOVA was used to determine the effect of sampling time, treatment and their interaction on root and leaf nutrient variables, CHO and amino acid content. In all analyses, means were compared using Fischer’s test at p < 0.05. Before analyses, data were transformed appropriately to meet the assumptions of ANOVA. All statistical analyses were performed with the use of the statistical software STATISTICA 9, Tulsa, OK, USA. Heatmaps were created with the use of Excel software with the use of the conditional formatting function.

3. Results

Foliar N, P and K concentrations differed significantly between the sampling occasions (Figure 1a,c,e), as the values decreased from the first to the second sampling period. On the contrary, only K differed significantly among the treatments, since the NKM treatment had increased K content in comparison with NK during the first sampling period (Figure 1c).
The root N concentrations were higher in the first sampling period compared to the other two periods (Figure 1b), while the K values increased significantly in the third sampling period (Figure 1d). The P root content was the only one to differ among treatments, as the highest P values were recorded in the CM treatment in the second sampling period (Figure 1f).
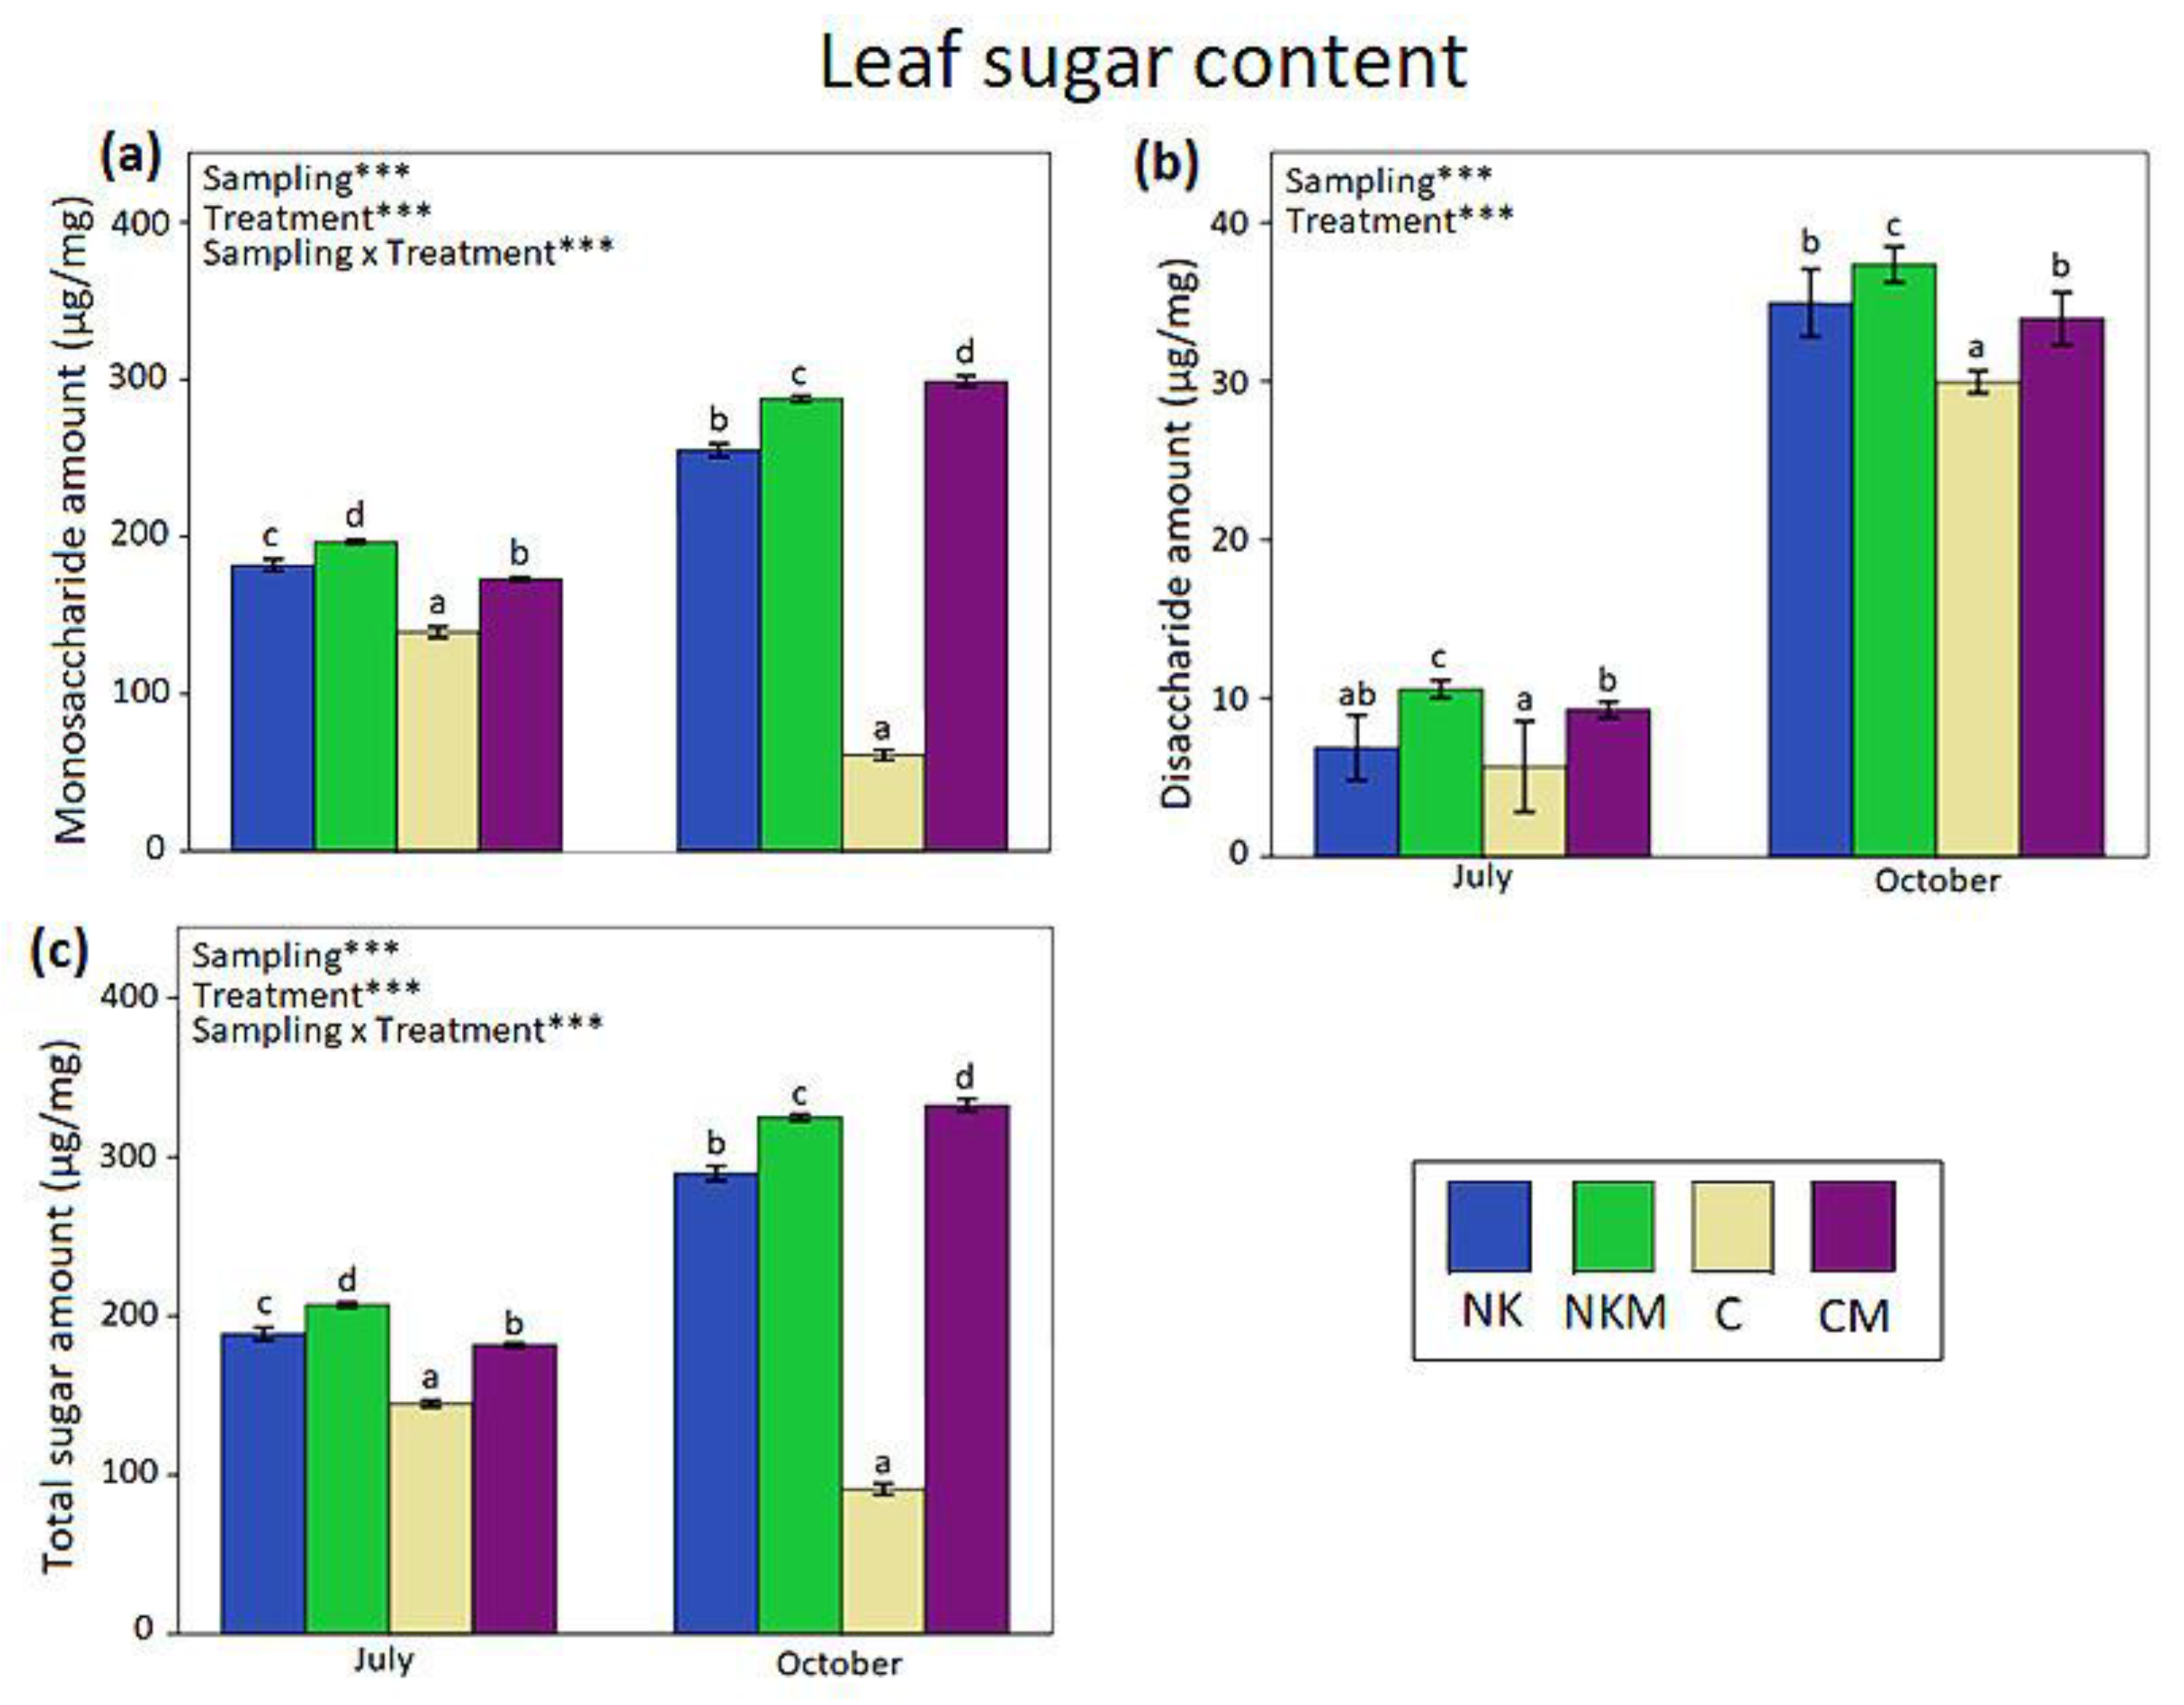
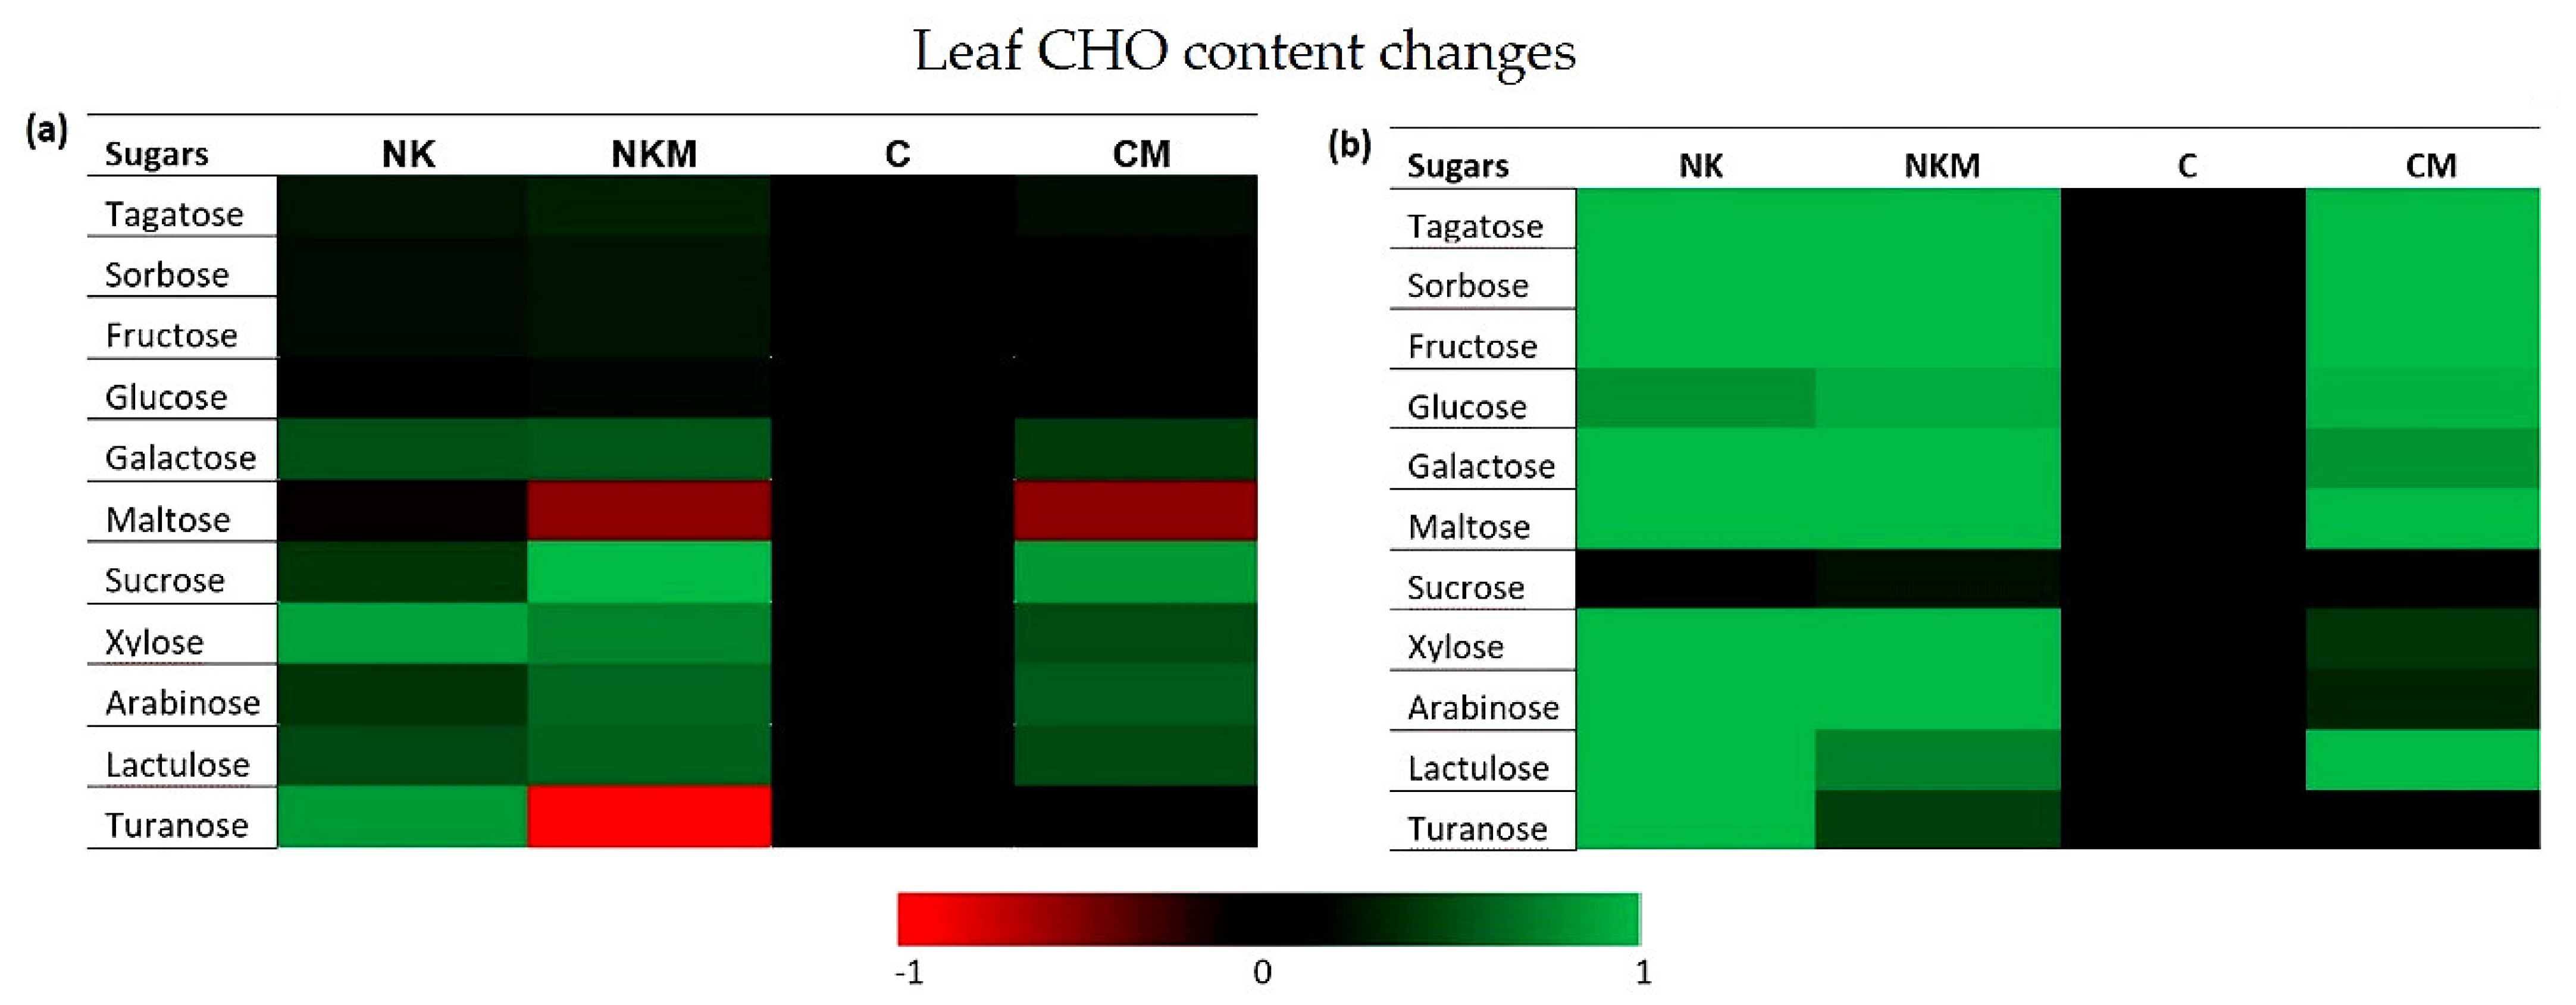
Our results revealed that the monosaccharide, disaccharide and total sugar leaf content differed significantly among samplings, as well as among treatments (Figure 2a–c). Higher values of monosaccharides and total sugar content were recorded in the treatments where PGPR had been previously applied (NKM and CM) (Figure 2a,c). On the other hand, higher disaccharide content was observed in the NKM treatment, followed by the CM treatment, while the control had the lowest values (Figure 2b). In the first sampling, NK, NKM and CM presented higher values of most of the estimated leaf sugars (tagatose, sorbose, fructose, glucose, galactose, sucrose, xylose, arabinose and lactulose) in comparison to the control (C) (Figure 3a). In the second sampling (Figure 3b), the pattern was similar, and the recorded differences were amplified.
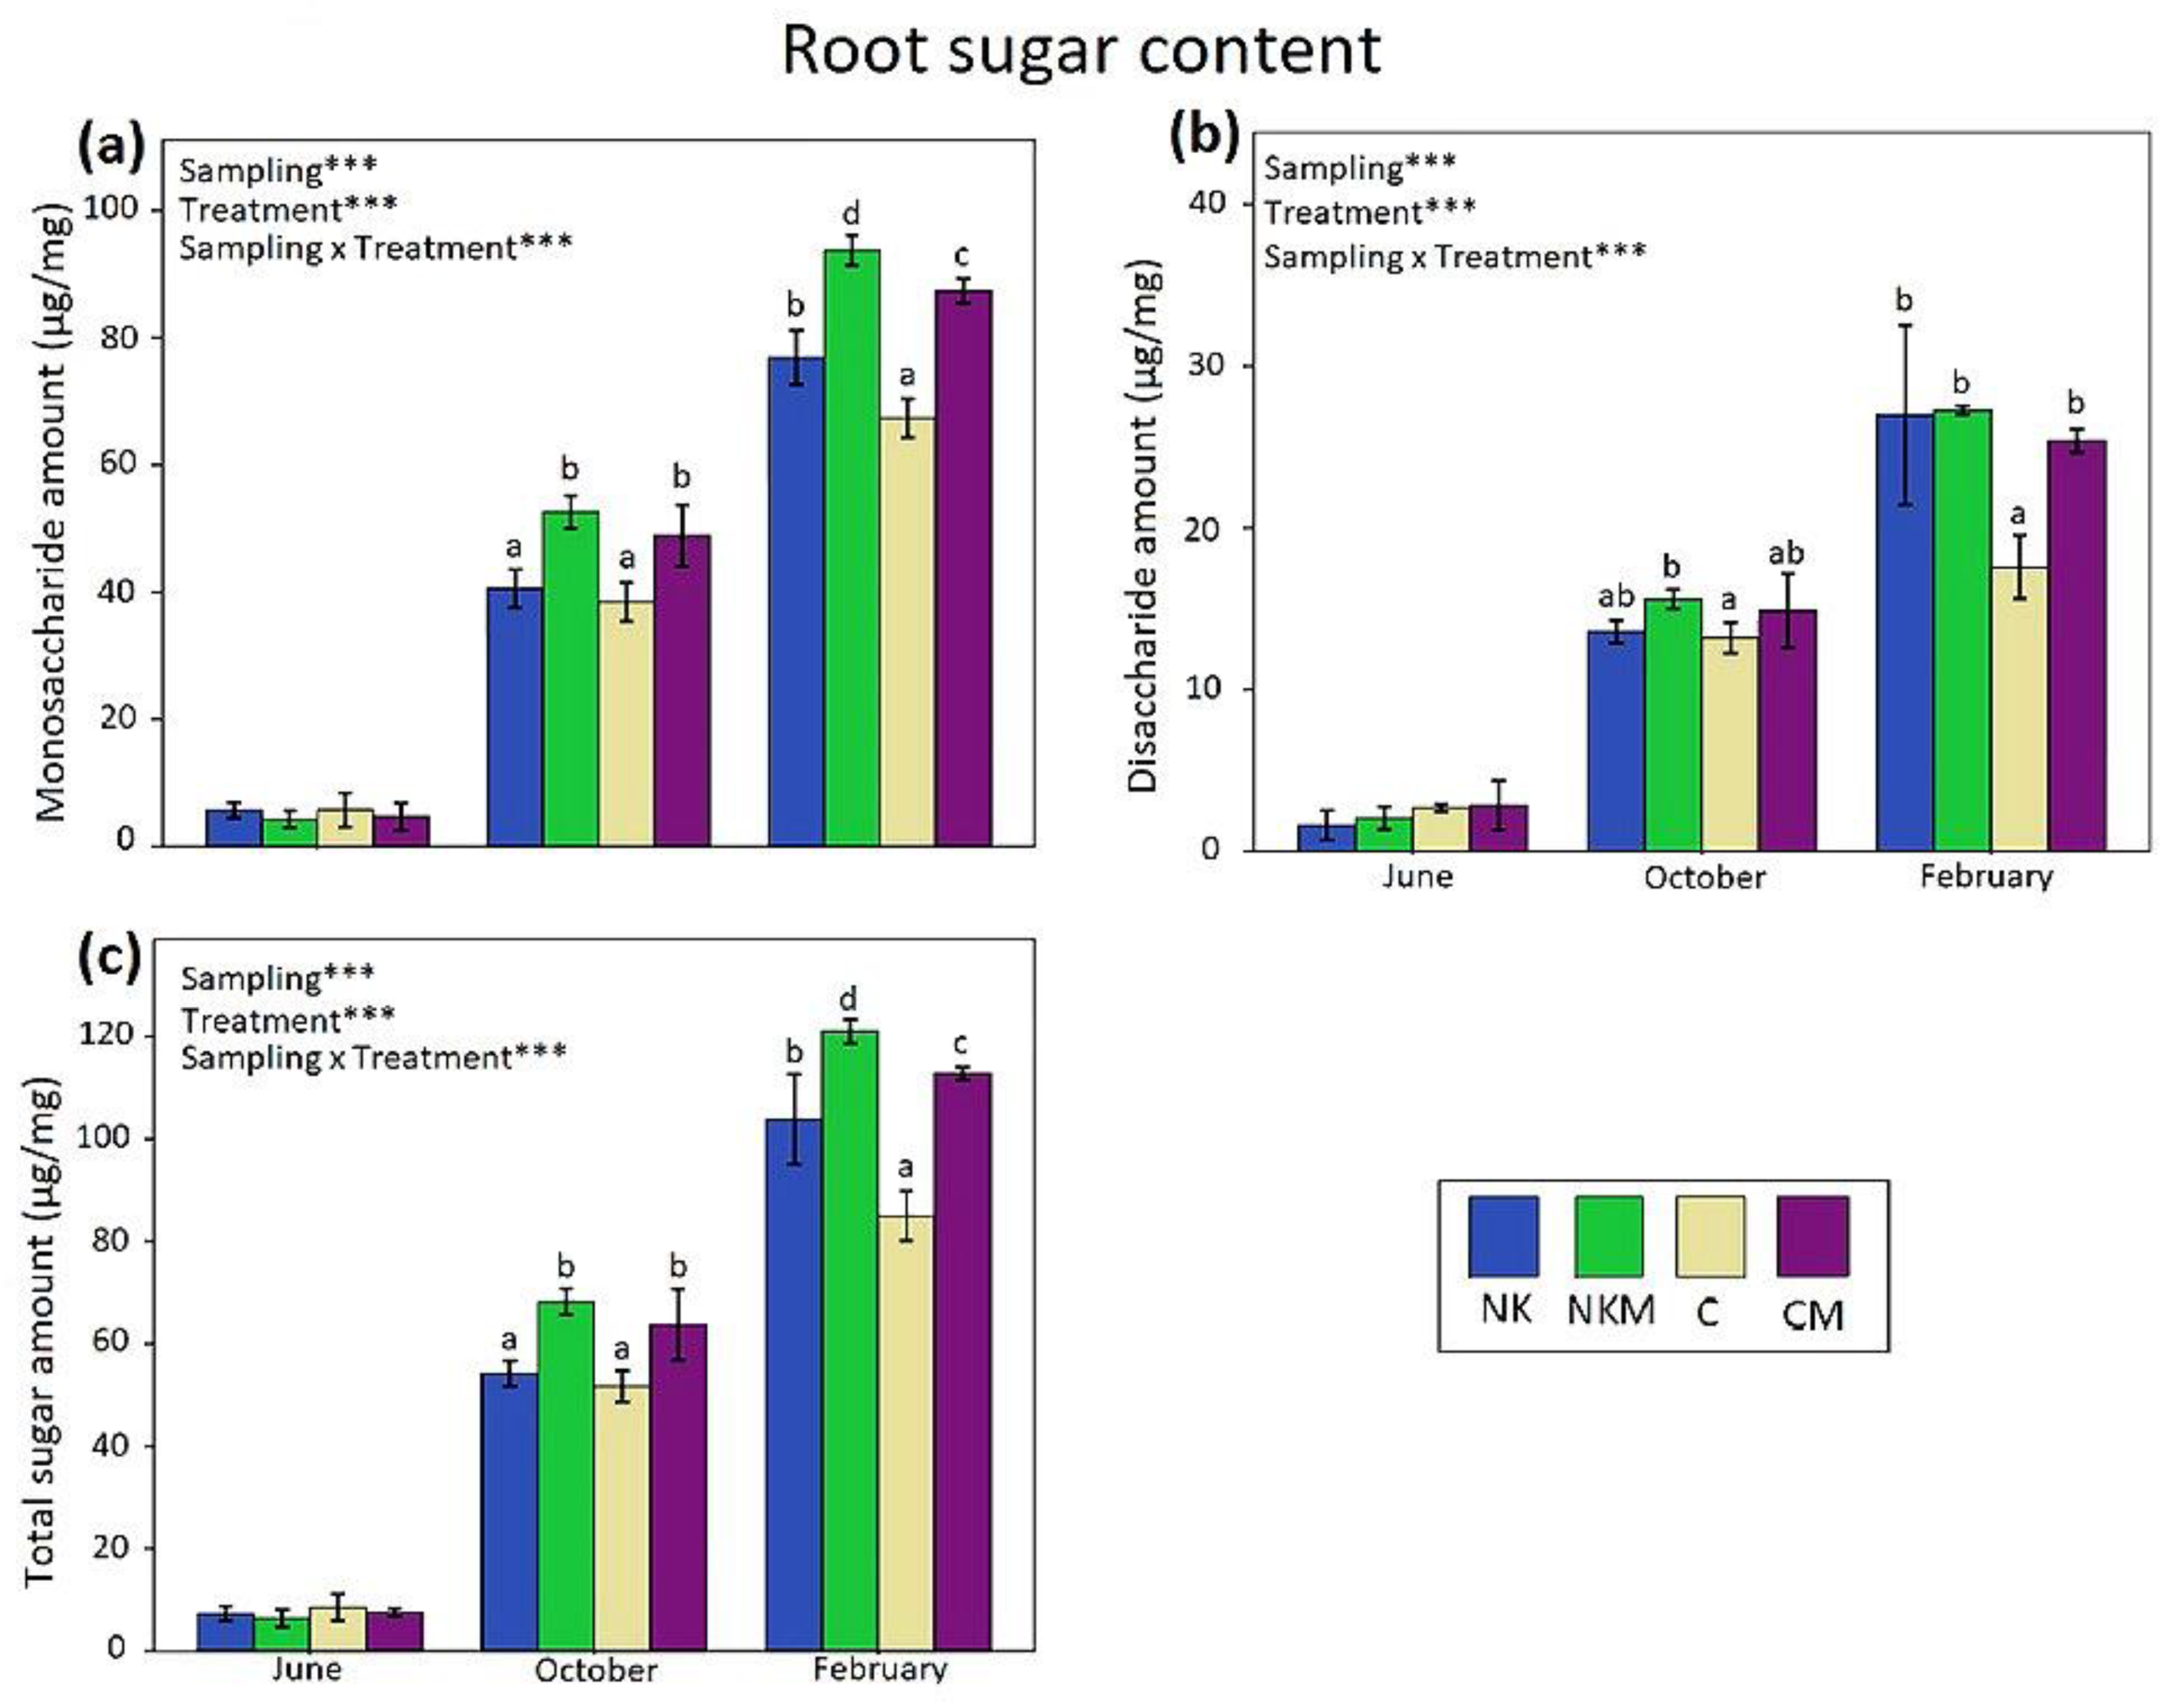
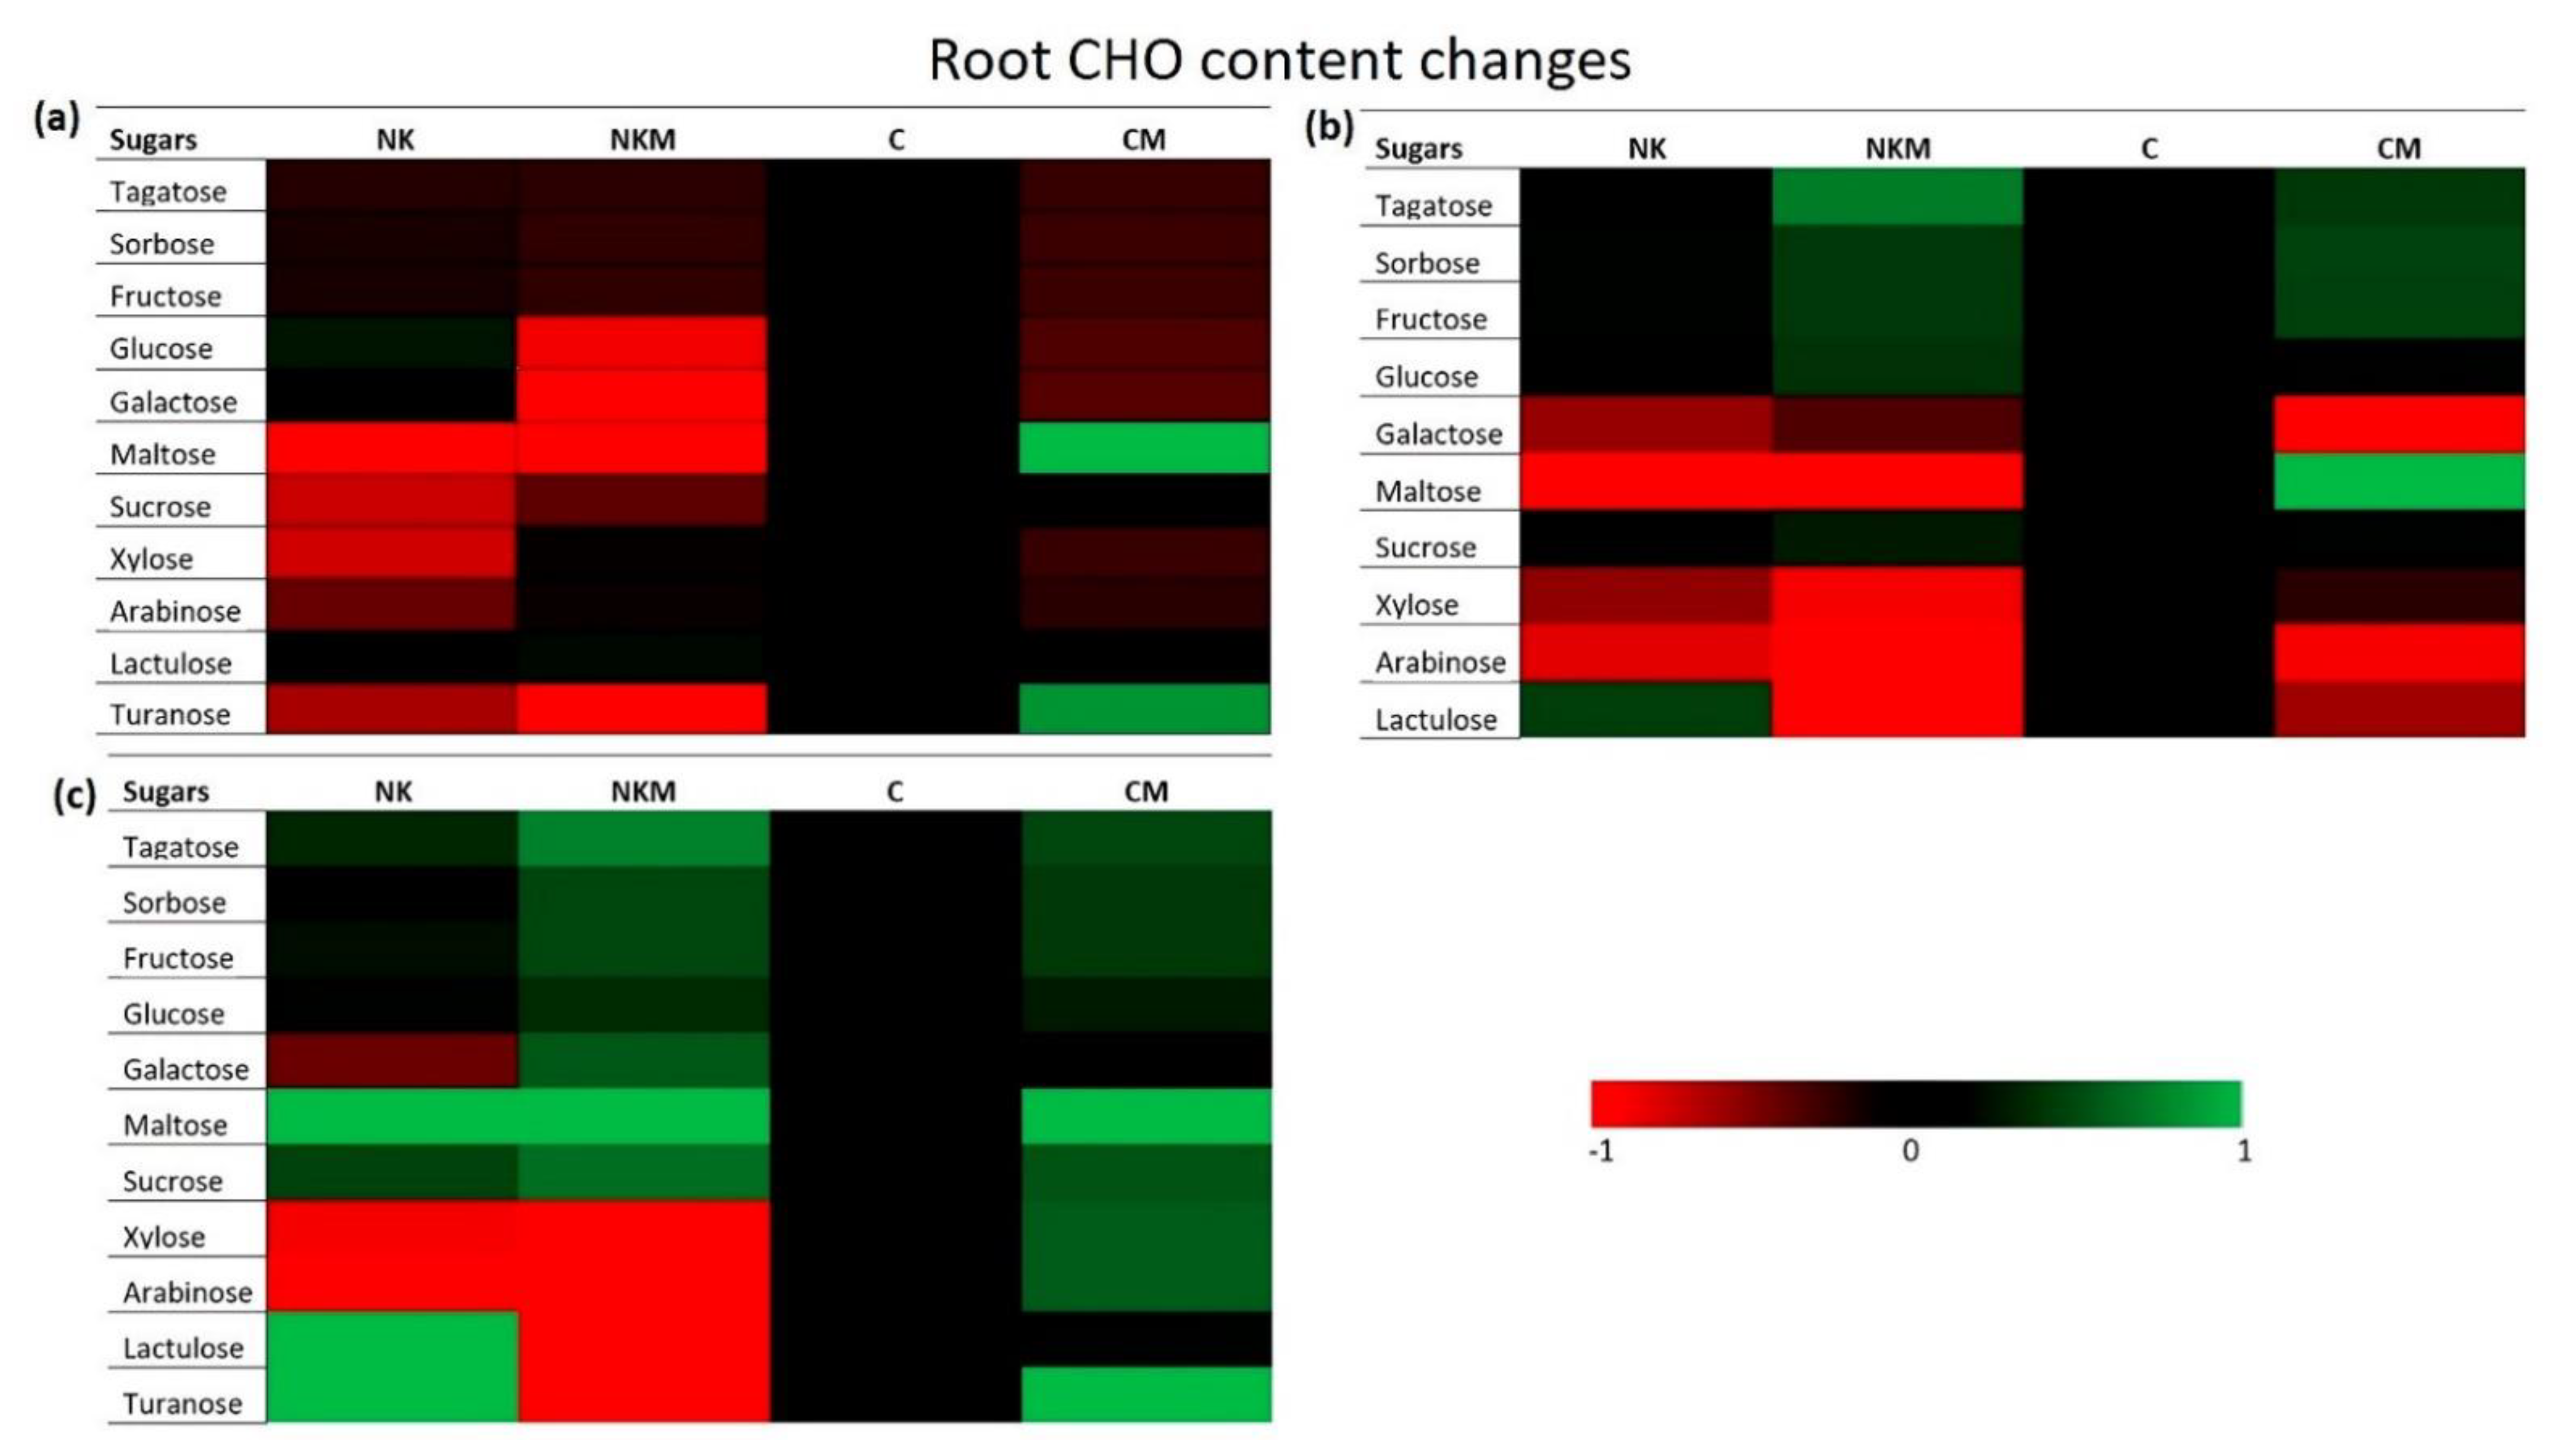
Regarding root CHO content, higher values of monosaccharide, disaccharide and total sugar content were found in the third sampling period (February), while the lowest values were found in the first sampling period (Figure 4a–c). Similarly to the leaves, the NKM and CM treatments had the highest monosaccharide and total sugar root content (Figure 4a,c), while the control presented the lowest disaccharide values (Figure 4b). In the first sampling, almost all sugars were higher in the control compared to CM, NK and NKM (Figure 5a); only maltose and turanose in the CM treatment presented higher values in comparison with the control (Figure 5a). This pattern changed with time; in the third sampling, most of the estimated sugars (tagatose, sorbose, fructose, glucose, galactose, maltose, sucrose, lactulose and turanose) were found to be higher in the CM, NK and NKM treatments in comparison with the control (Figure 5c).
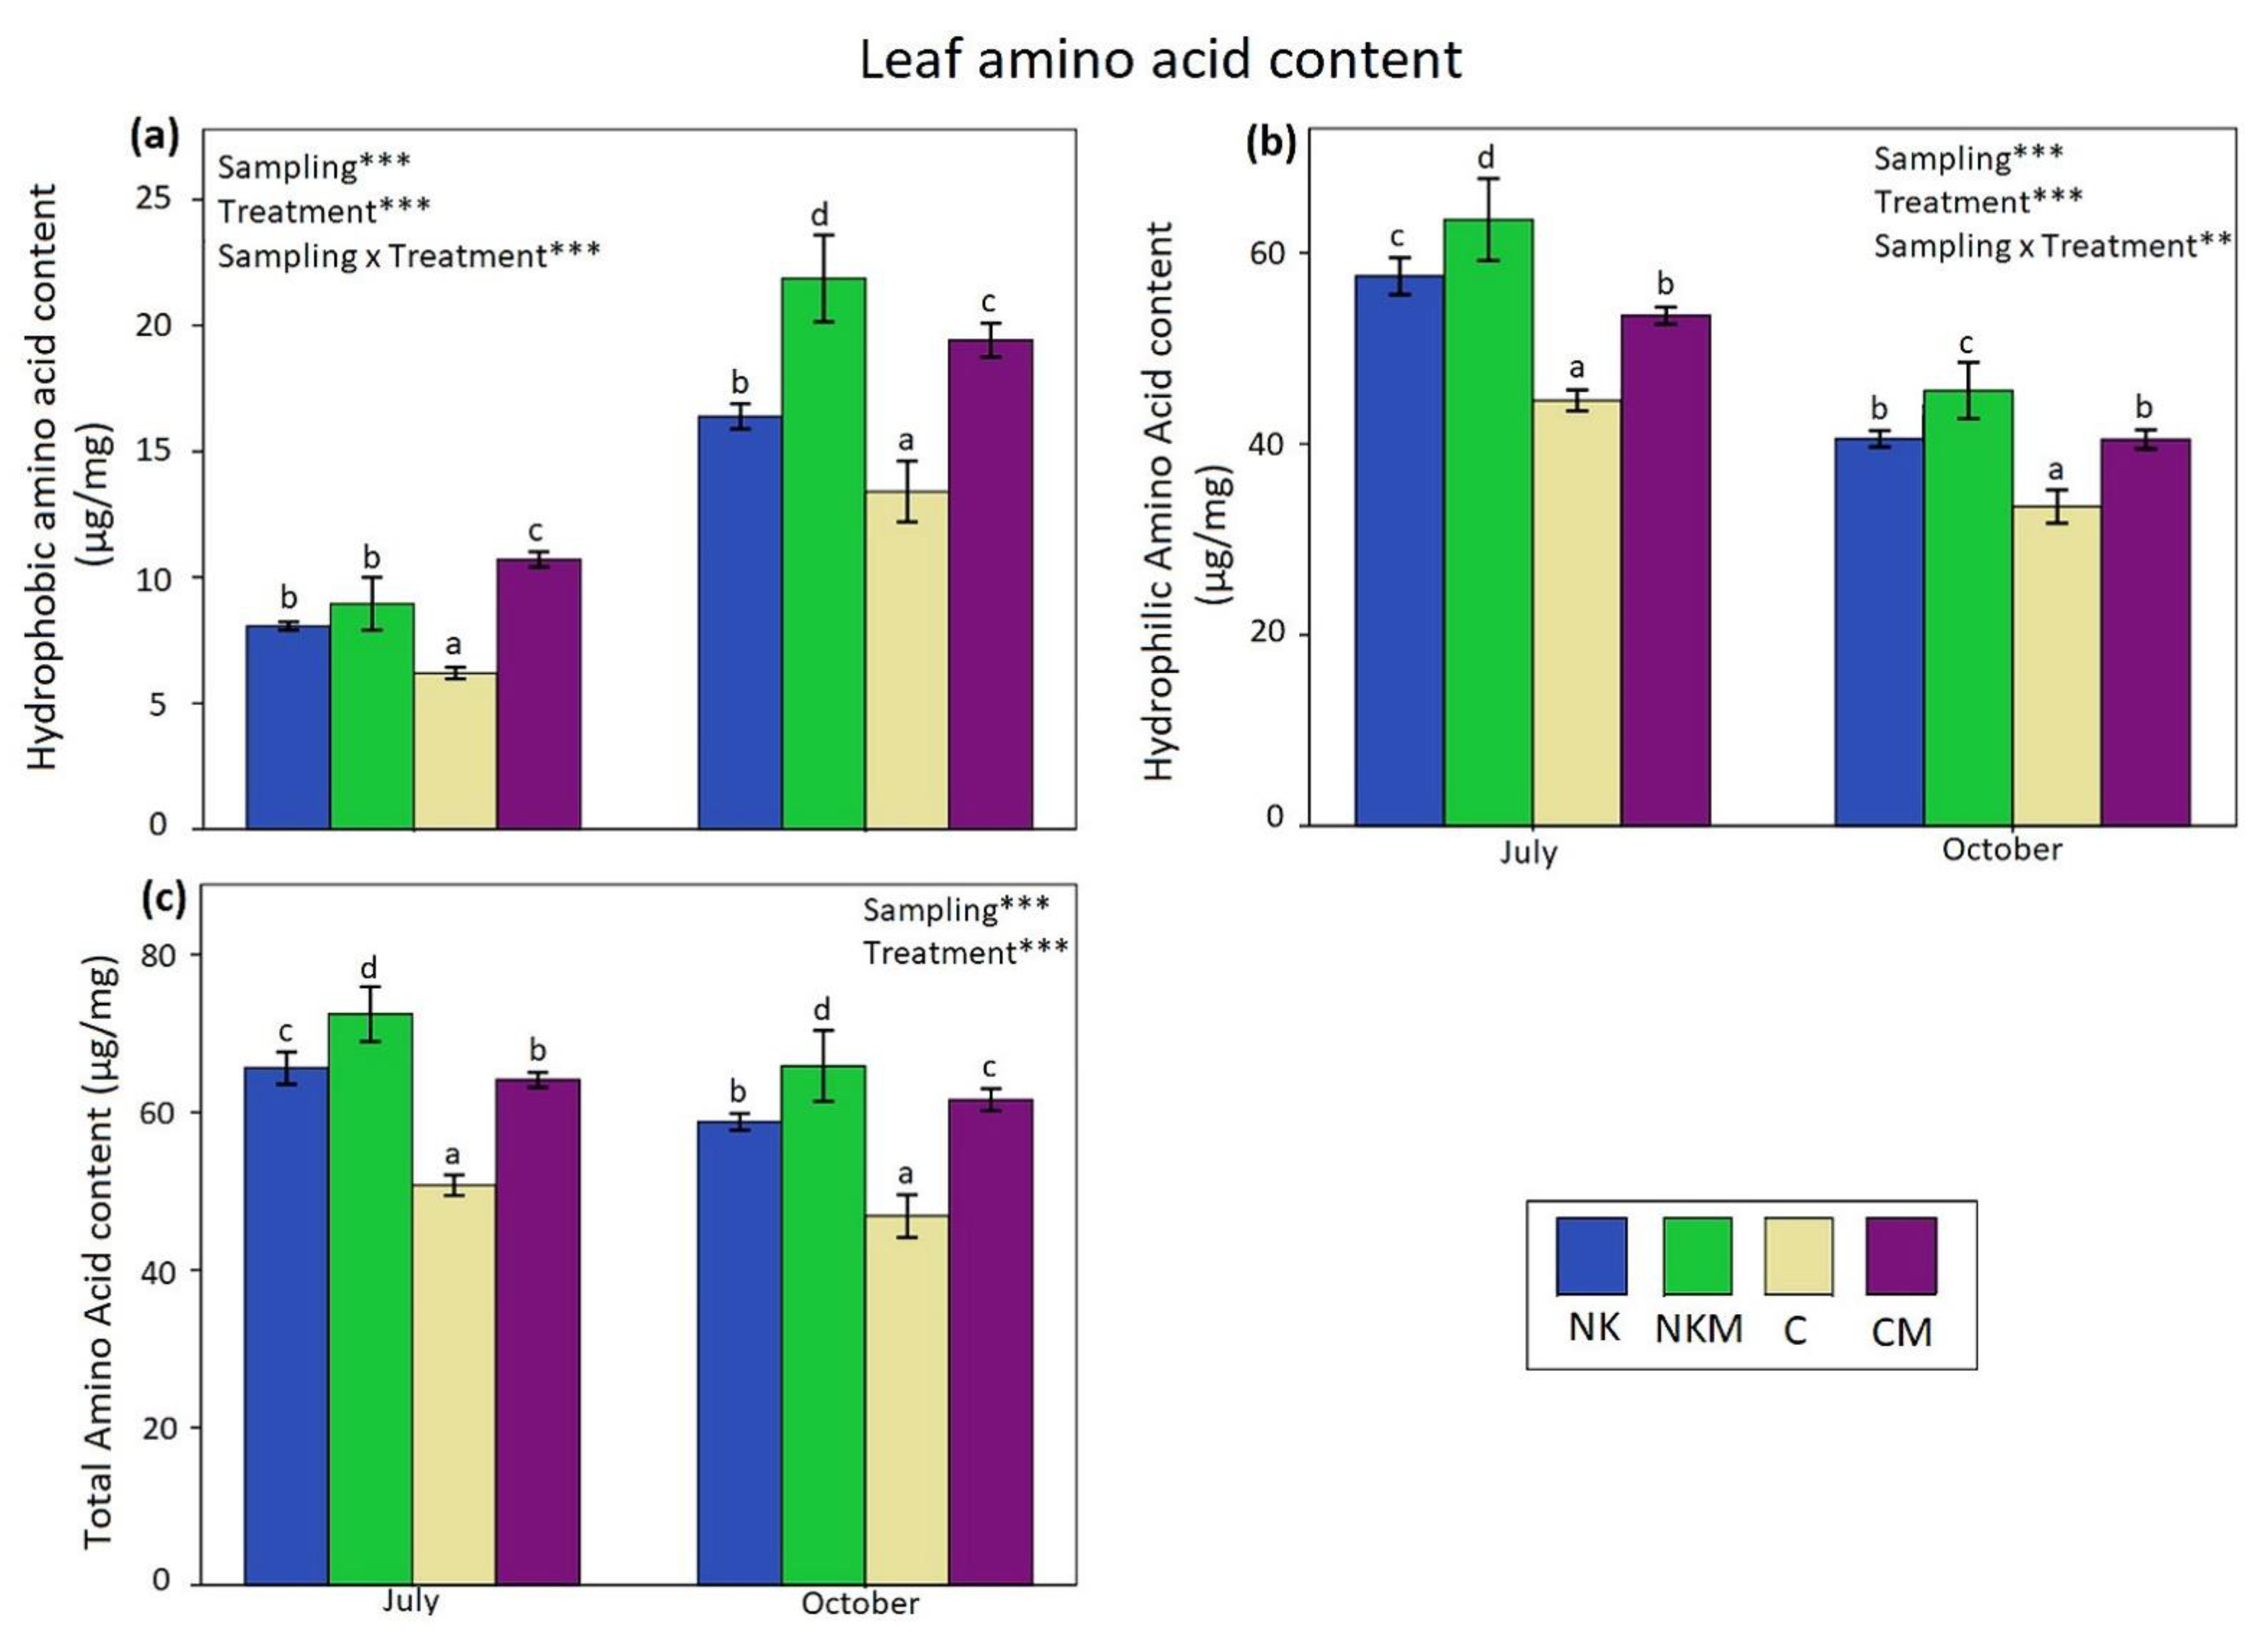
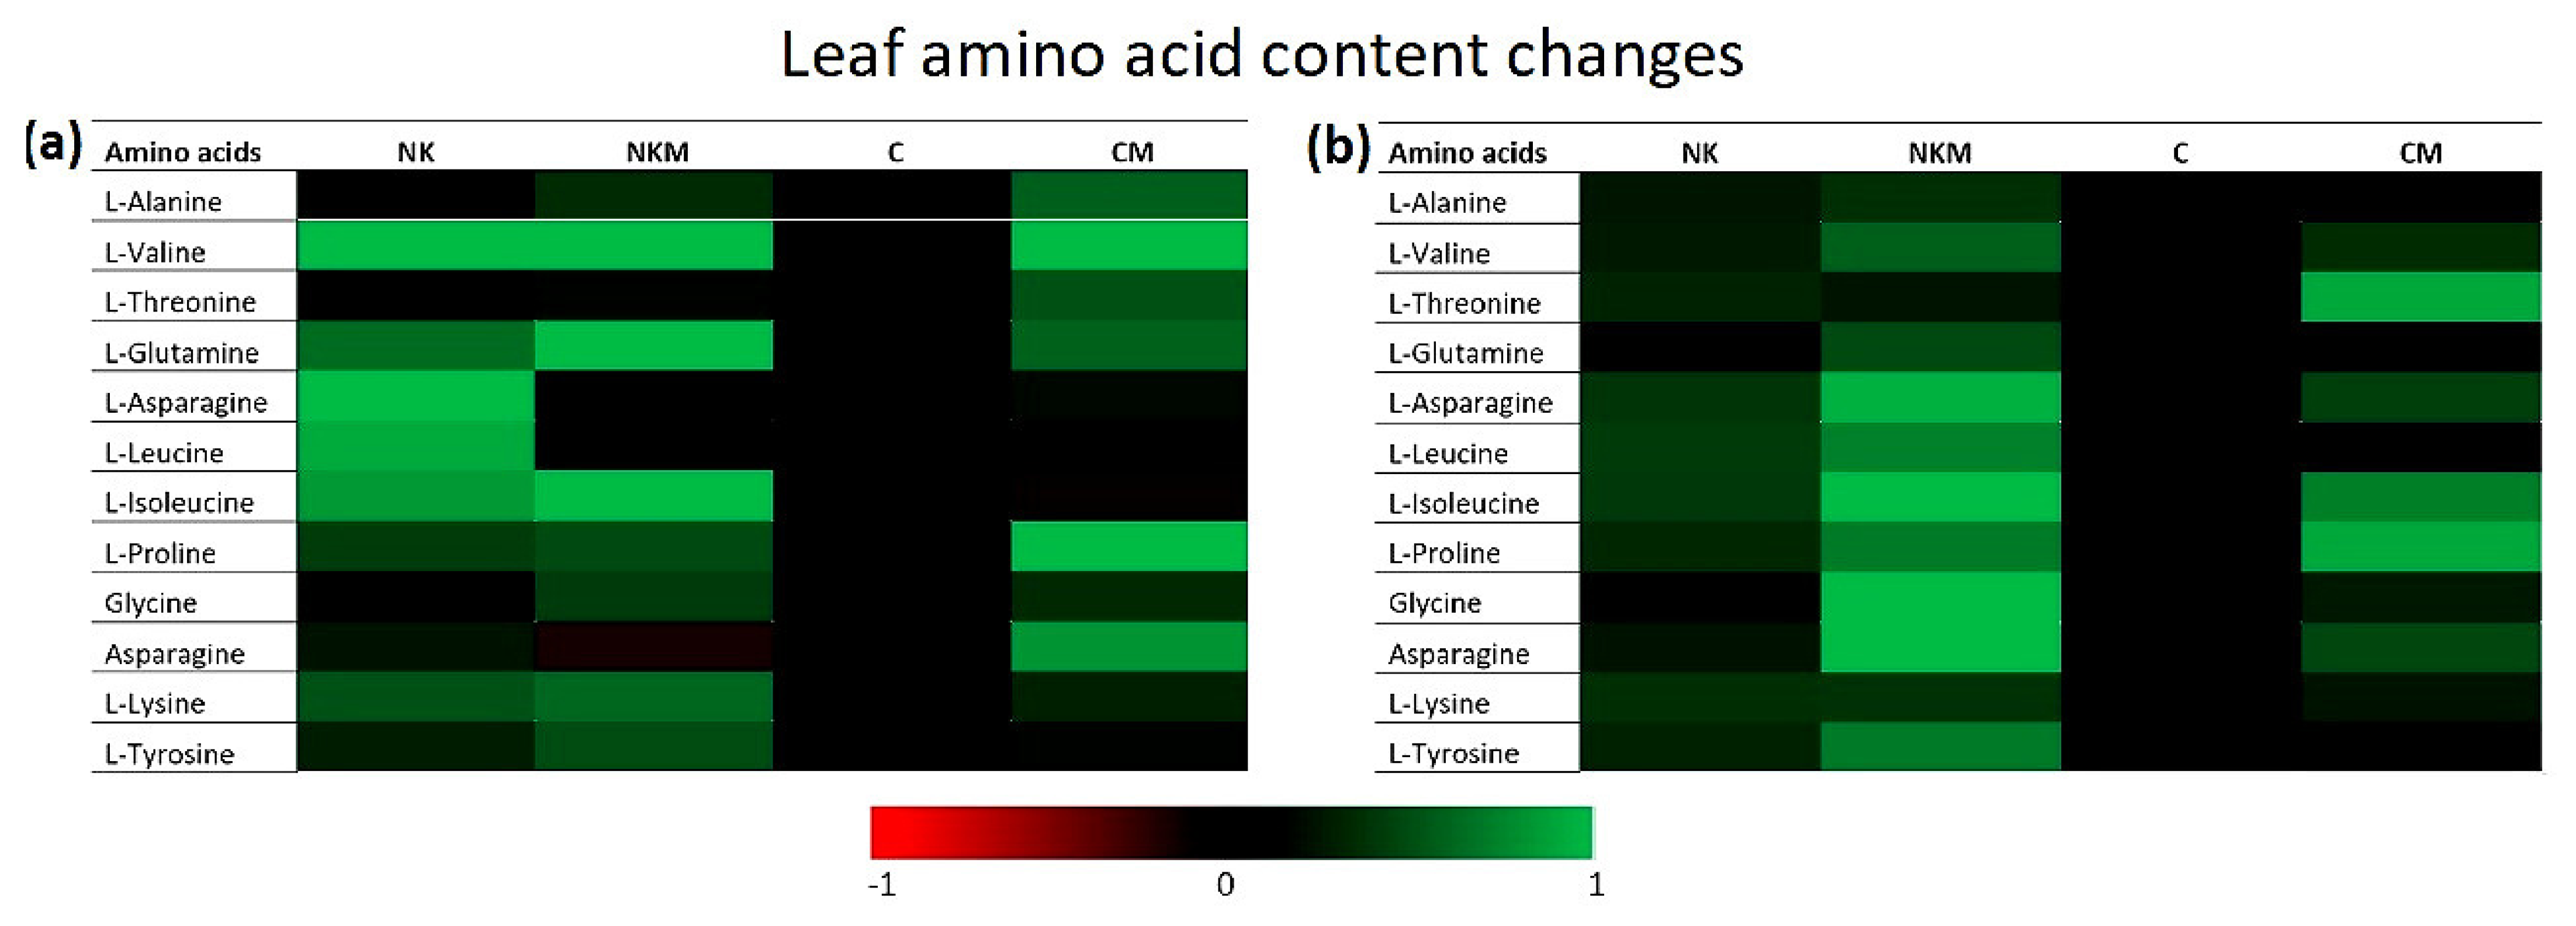
Regarding leaf amino acid content, our results showed that hydrophobic, hydrophilic and total amino acid concentrations differed significantly between the sampling periods and the treatments, and the highest values were recorded in July (Figure 6a–c). The NKM, CM and NK treatments had higher contents of hydrophobic, hydrophilic and total leaf amino acids compared to the control (Figure 6b,c). In July, most of the amino acids in NKM, NK and CM treatments presented higher values in comparison with the control, except for asparagine in NKM treatment and isoleucine in CM, which presented the lowest values (Figure 7a). In October, all the amino acid metabolites, in all treatments, presented higher values in comparison with the control (Figure 7b).
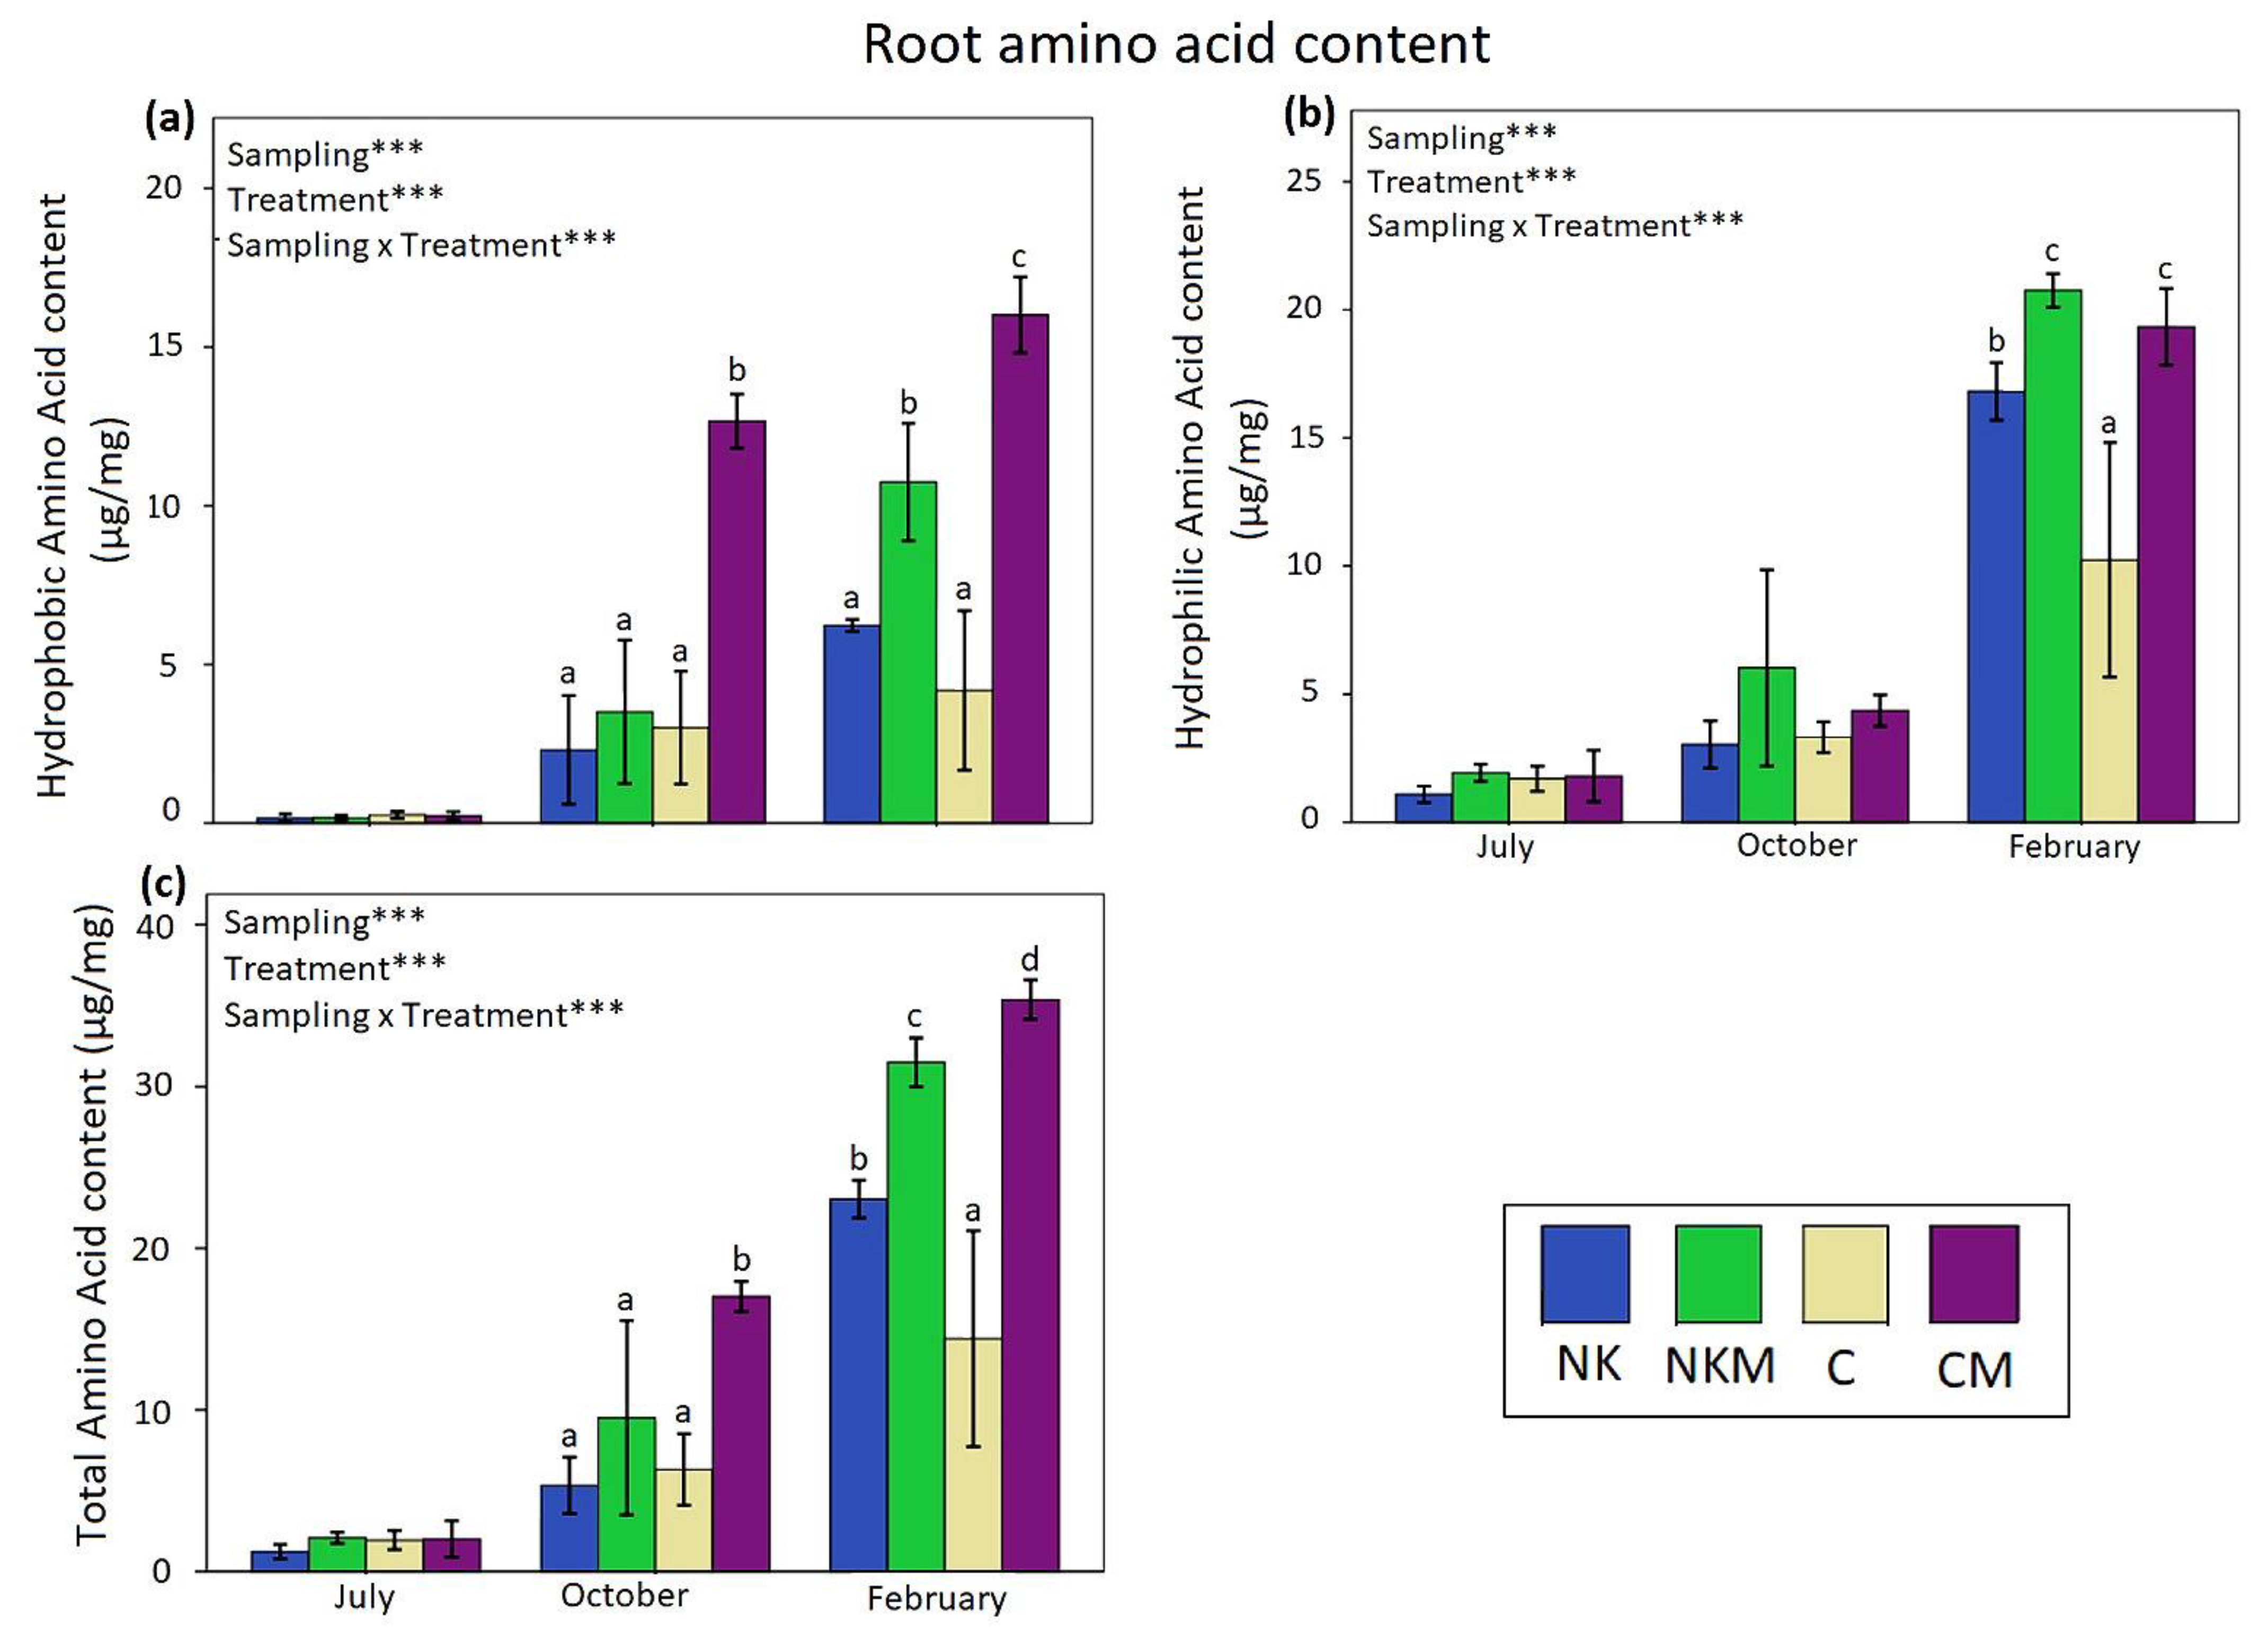
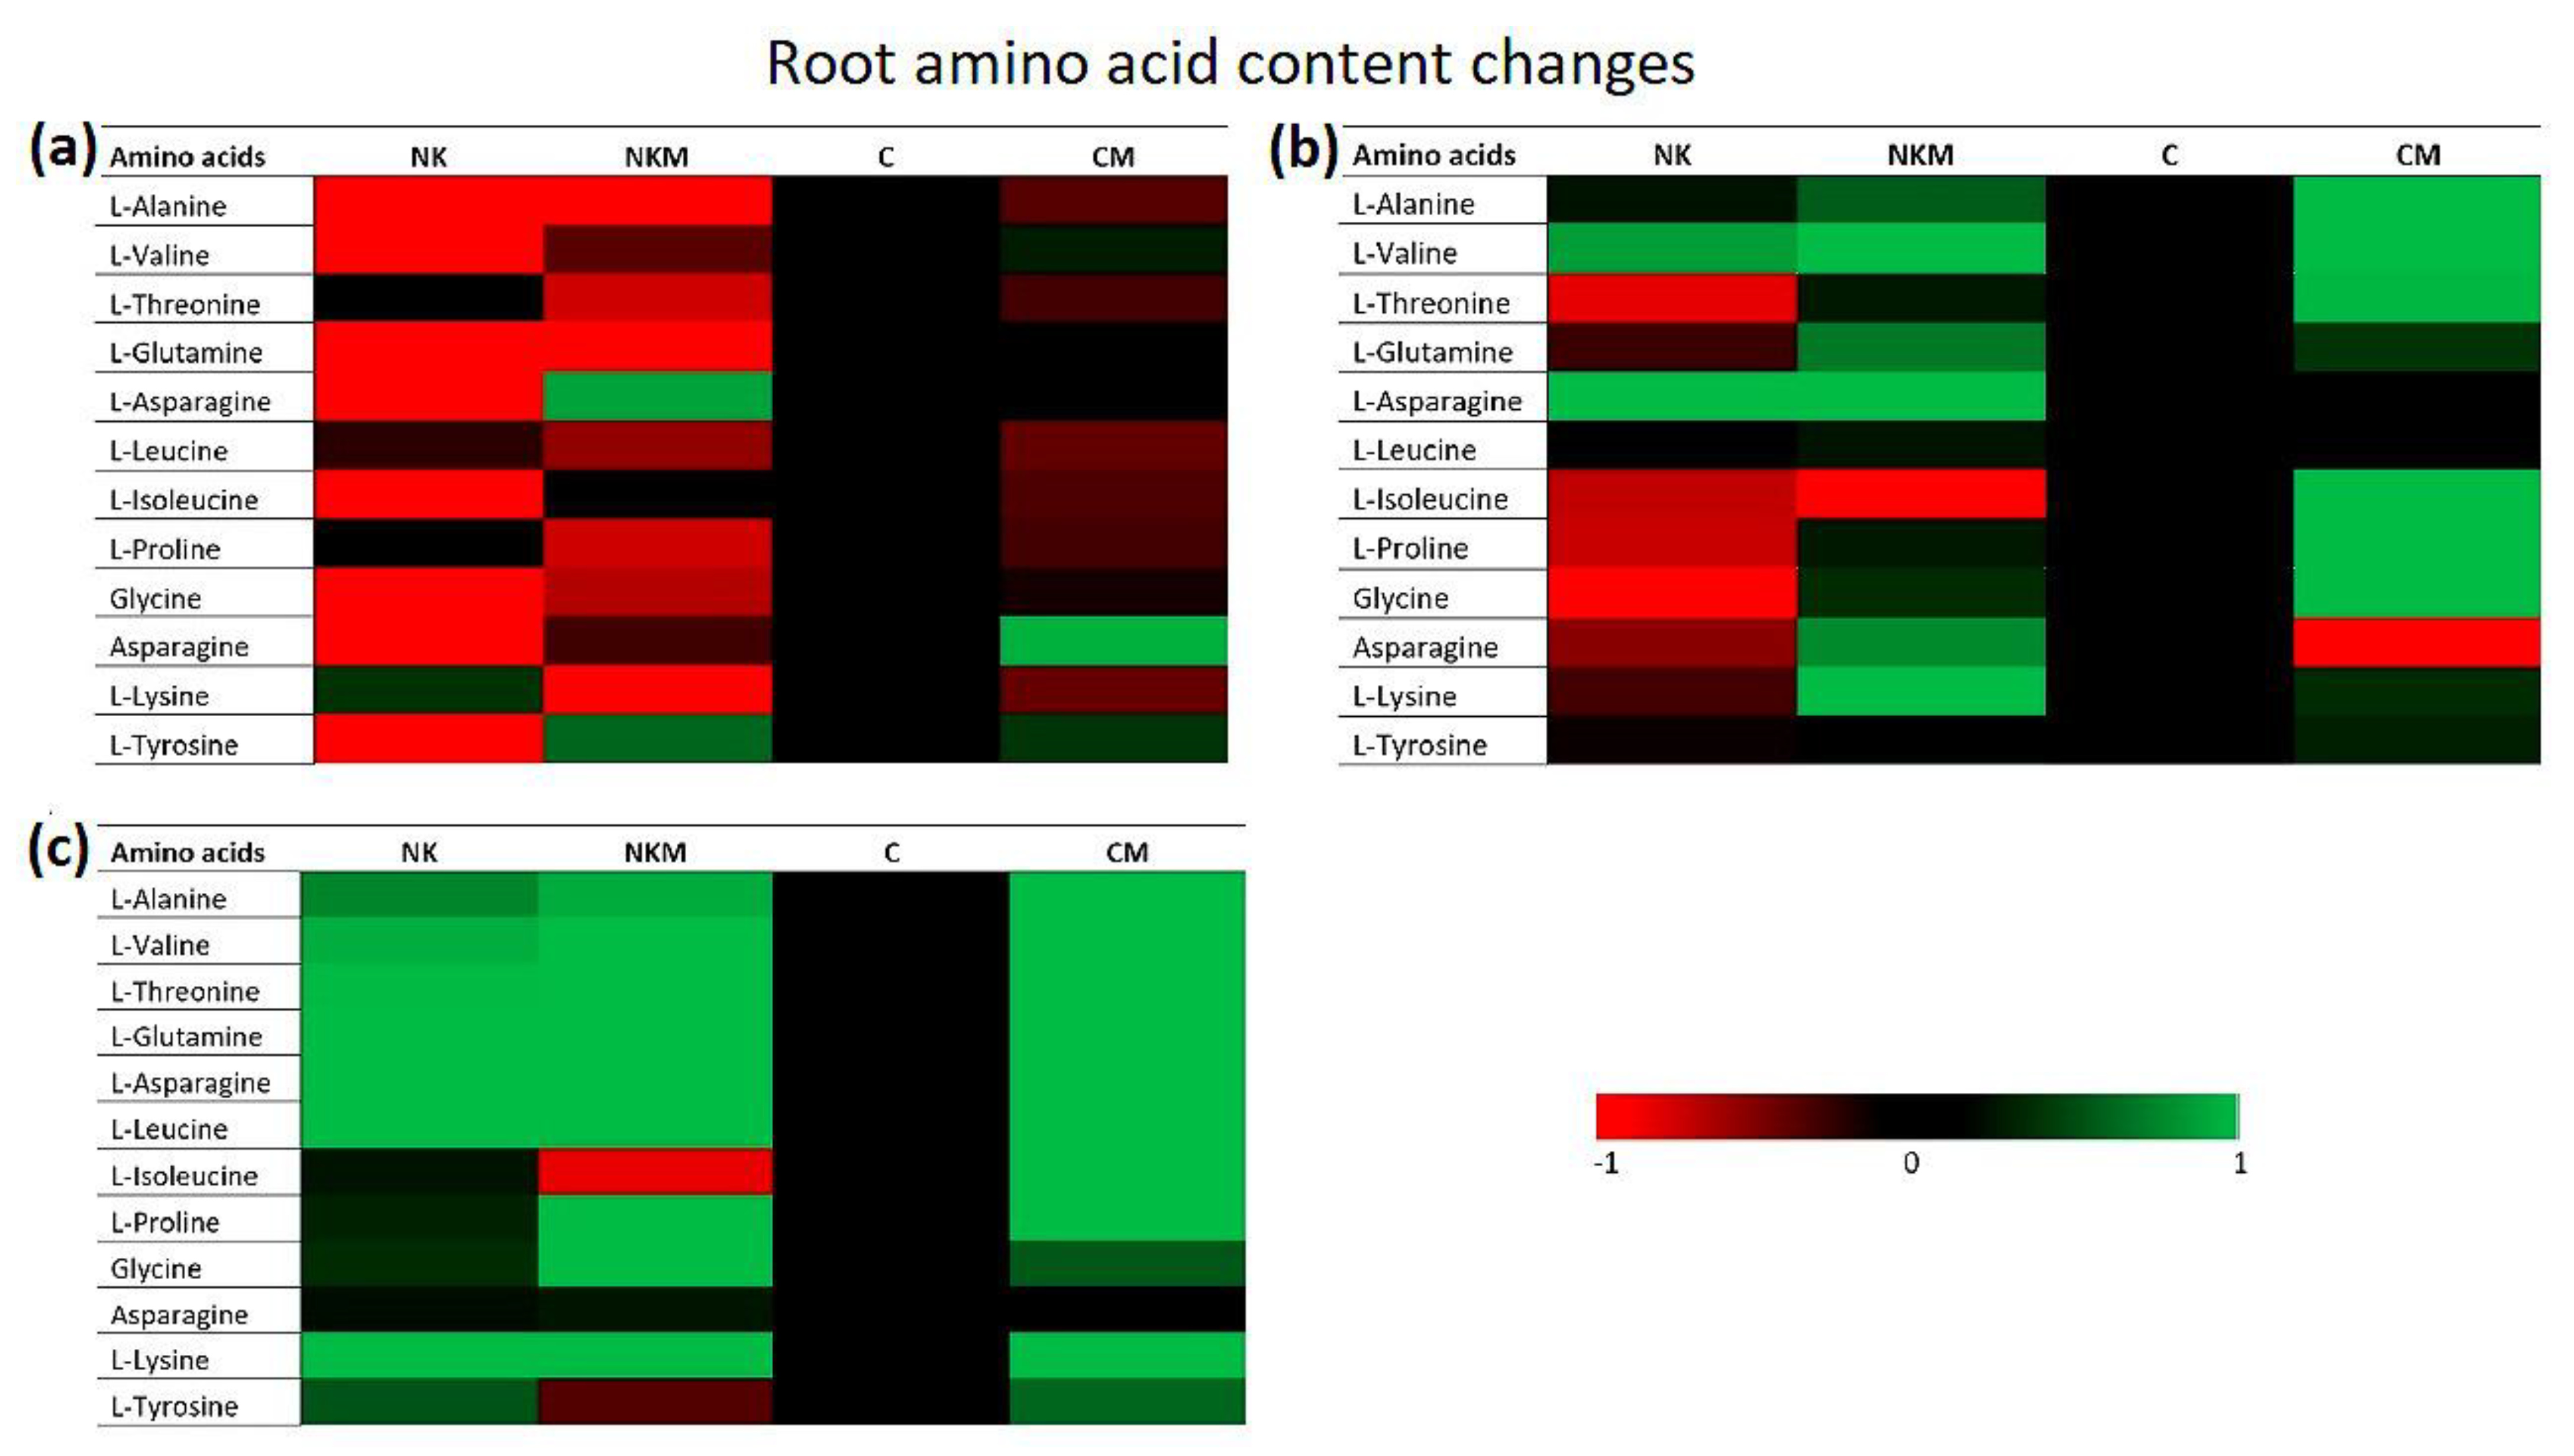
Regarding the root amino acid content, the results showed that the hydrophobic, hydrophilic and total amino acid concentrations differed significantly between the sampling periods and the treatments (Figure 8a–c). Amino acid value concentrations were higher in the third sampling period, while the lowest concentrations were recorded in the first sampling period. The results indicated that the highest values of hydrophobic, hydrophilic and total amino acid content were recorded in the CM and NKM treatments in October and February, followed by NK, while the control had the lower values (Figure 8a–c). In terms of specific amino acid content, in the first sampling, almost all amino acids in the NK, NKM and CM treatments presented with lower values in comparison with the control (Figure 9a). Starting with the second sampling, the pattern changed, as all the amino acids in the NKM and CM treatments presented higher values in comparison with the control (Figure 9b); on the contrary, the NK root samples presented with lower values in comparison with the control in several amino acids (threonine, glutamine, isoleucine, proline, glycine, asparagine, lysine and tyrosine). In the third sampling, all three treatments (NK, NKM and CM) had higher amino acids compared to the control (Figure 9c).

4. Discussion

The leaf K, N and P concentrations decreased significantly from the first to the second sampling period. Our results are complemented by Fernandez-Escobar et al. [31], who stated that fluctuations in the nutrient content of the leaves during the plant growth cycle are attributed to the necessities of the crop depending on the developmental phase. Fernandez-Escobar et al. [31] reported that the nutrients which are the most important for the plant growth will be transferred faster to the roots than other nutrients, and they would be expected to increase in the second and the third sampling periods, when root development is at a vital point. Our results indicated that K was the only macronutrient that presented a constantly increasing trait with time, as the highest K values were recorded in the third sampling. The root P content did not present statistically significant differences between samplings, which is an indication that P could be of lower importance for asparagus growth compared to other macronutrients.
The leaf N and P contents did not present statistically significant differences between treatments. As aforementioned, since P was not found to be of high significance for asparagus growth [32], this lack of difference between treatments can be considered normal. On the other hand, even though the NK and NKM treatment received lower N in comparison to the control and the CM treatment, no significant differences were observed between them. Our results agree with those from Krug and Kailuweit [33], who also found no significant differences in the N content of plants under different N application rates. Krug and Kailuweit [33] attributed this recording to the fact that the plants do not absorb higher amounts of N, even though the farmers provide excessive amounts of N, as it is not necessary for further growth. Thus, the application of NH4NO3, which is the common agricultural practice for the Asparagus crop, was found to be high and exceeding the needs of the plants. Moreover, our results indicated that the use of the PGPR inoculants (CM and NKM treatments) did not increase the N uptake by the plants (root and leaf N) in any of the sampling periods. It has been recorded that the application of inorganic fertilizers containing high levels of N inhibits the nitrogenase activity of free-living diazotrophs [34]. In our study, even the KNO3 treated plots, where significantly less inorganic N was incorporated, proved to be a stressful environment for the PGPR, affecting their ability to fixate nitrogen and consequently have a positive effect on N uptake. Thus, the application of inorganic N fertilizers in Asparagus crops should be decreased to levels even lower than those of our study to allow the PGPR to act beneficially for the crop system.
The highest leaf K concentration was recorded in the NKM treatment compared to the other treatments; on the contrary, in the NK treatment, where the plants also received high K input, the lowest foliar K was found. This difference could be attributed to the incorporation of PGPR inoculum in the NKM treatment. The addition of PGPR has been observed in several studies to increase the production of growth regulators, which consequently increase the metabolic rate of the plant, thus increasing K uptake [35,36]. In that case, the increased foliar K in the NKM could afterwards positively influence total sugar content, since increased K fertilization and leaf K concentration increases soluble sugars, raises tricarboxylic acid intermediates, and improves fruit quality, as also found in other studies for other plant species [37,38]. The leaf CHO content (monosaccharides, disaccharides and total sugars) presented an increasing trend from the first sampling to the second. Wilson et al. [2] reported that the CHO content of the plants can vary depending on the growth stage of the crop. The disaccharide contents presented a much greater level of increase between the two samplings than monosaccharides. During the first sampling (July), when the leaves of the plant are photosynthetically active, the synthesis of sugars mainly involves the synthesis of monosaccharides as a basic photosynthesis product [39]. Moving to the second sampling (autumn), the photosynthetic activity of the leaves decreases [40]. A large proportion of the stored monosaccharides in the leaves are transformed into disaccharides, which will be transferred into other storage organs of the plant before the leaves will be destroyed before the upcoming winter [41]. The sampling effect on the root CHO content also presented an increasing trend from the first to the third sampling period. Pressman et al. [42] and Wilson et al. [43] stated that during summer, the CHO content of the roots is expected to decrease, since carbohydrates have been used to support production during spring. At the end of the harvesting period, the CHO content of the roots is also used to support the plant’s above-ground development. Contrary to the leaves, the root monosaccharide contents increased more between the sampling periods in comparison to disaccharides. This was probably because the roots are also able to absorb monosaccharides from the rhizosphere [44]. Additionally, according to Yamada et al. [45], monosaccharides are stored in the roots, but are transferred into other plant organs to be transformed into other sugar forms.
The NK and NKM treatments presented higher leaf CHO content, indicating that the application of the KNO3 fertilizer had a greater impact than the NH4NO3. Even though the K content was not significantly higher in the leaves of the NK and NKM treatments, the addition of KNO3 altered the N:K ratio and had a positive indirect effect on the sugar content. The role of K in a wide range of physiological processes, such as photosynthesis, enzyme activation, transportation and water relations, has been stated in several studies [46]. Vijay et al. [9] reported significant differences in leaf chlorophyll, root proteins, carbohydrates, sapogenins and plant height of asparagus plants that received increased K content through fertilization. To our knowledge, the results of our study are the first to present a positive effect of increased K via fertilization on the CHO content of asparagus plants, as all the previous studies focused mostly on studying the effect of increased K fertilization on the physiological characteristics of the plants.
Similar to the leaves, the application of KNO3 fertilizer, as well as the incorporation of PGPR, resulted in the highest CHO content in the roots compared to the control. PGPR enhanced plant growth and productivity either by increasing tolerance under abiotic stress or solubilizing nutrients for easier plant uptake [47,48]. As explained earlier, the application of the PGPR product did not have a significant impact on the estimated physicochemical variables (e.g., nitrogen); thus, the increased CHO content that was recorded in the NK, NKM and CM treatments could be attributed to the other beneficial indirect beneficial attributes of the PGPR on the asparagus plants, such as the production of plant growth regulators, siderophores, enzymes or volatile organic compounds [38,39]. Nevertheless, further research is required to justify this assumption. Our results indicated that the application of PGPR is a stronger factor affecting CHO content than the increased K fertilization. The application of increased K amounts to the fields proved to act synergistically with the effect of the PGPR.
Hydrophobic amino acids in the leaves presented with a significant increase from the first sampling period to the second. On the other hand, hydrophilic amino acids presented with a statistically significant decrease from the first sampling to the second. The total amino acid content was also significantly decreased from the first sampling to the second. The decrease in the amino acid content can be correlated with the transfer process of the plants, which occurs as the winter period approaches and the leaves of the plants will eventually fall [49]. The NKM and CM treatments presented with higher amino acid contents in their leaves as well as in their roots compared with the other two treatments (NK and C). The enhancement of nutrient uptake that derives from PGPR surely plays a crucial role in the production of amino acids. Furthermore, the increased stress tolerance that has been reported to be enhanced with the use of PGPR may also have an important role in the increased amino acid content of the PGPR treatments [5,7,50]. However, the relationship between PGPR and amino acid synthesis requires further research.
To summarize, our results indicated that even though the application of PGPR in an A. officinalis crop system did not alter the root and leaf total N content, it had a positive effect on the root and leaf sugar and amino acid content. This is an indication that the PGPR altered metabolite biosynthesis in the plant, and thus improved the nutrient use efficiency of the root system by enhancing the plant system’s functioning at physiological levels. Similar results were recorded by Chea et al. [51]. Applying inorganic fertilizers containing less N and more K could promote the positive effect of PGPR on A. officinalis plants in terms of nutritional value.

5. Conclusions

The highest foliar K concentration (significantly higher than that of the NK treatment) was found in the NKM treatment, which probably means that metabolic processes (including K uptake) were boosted after PGPR application. The increased foliar K in the NKM was probably responsible for the higher total sugar, monosaccharide and disaccharide concentrations determined in this treatment. Our results indicate that higher K input together with PGPR applications may contribute to ameliorate the qualitative nutritional characteristics of A. officinalis, which is one of the most important aspects of modern vegetable crop production.

Author Contributions

Conceptualization, N.M. and T.C.; investigation, N.X., M.M., T.D. and N.M.; data analysis, N.M. and N.X.; writing—original draft preparation, N.X.; writing—review and editing, N.M. All authors have read and agreed to the published version of the manuscript.

Funding

This research received no external funding.

Institutional Review Board Statement

Not applicable.

Informed Consent Statement

Not applicable.

Data Availability Statement

The data presented in this study are available upon request from the corresponding author.

Conflicts of Interest

The authors declare no conflict of interest.

References

  1. Pegiou, E.; Mumm, R.; Acharya, P.; de Vos, R.C.H.; Hall, R.D. Green and white Asparagus (Asparagus officinalis): A source of developmental, chemical and urinary intrigue. Metabolites 2020, 10, 17. [Google Scholar] [CrossRef]
  2. Wilson, D.R.; Sinton, S.M.; Butler, R.C.; Drost, D.T.; Paschold, P.J.; van Kruistum, G.; Poll, J.T.K.; Garcin, C.; Pertierra, R.; Vidal, I.; et al. Carbohydrates and yield physiology of asparagus—A global overview. Acta Hortic. 2008, 776, 413–428. [Google Scholar] [CrossRef]
  3. Gifford, R.M.; Evans, L.T. Photosynthesis, carbon partitioning, and yield. Annu. Rev. Plant Physiol. 1981, 32, 485–509. [Google Scholar] [CrossRef]
  4. Drost, D.T. Asparagus. In The Physiology of Vegetable Crops; CAB International: Wantage, UK, 1997; pp. 621–649. [Google Scholar]
  5. Fagard, M.; Launay, A.; Clement, G.; Courtial, J.; Dellagi, A.; Farjad, M.; Krapp, A.; Soulie, M.C.; Masclaux-Daubresse, C. Nitrogen metabolism meets phytopathology. J. Exp. Bot. 2014, 65, 5643–5656. [Google Scholar] [CrossRef]
  6. Galili, G.; Avin-Wittenberg, T.; Angelovici, R.; Fernie, A.R. The role of photosynthesis and amino acid metabolism in the energy status during seed development. Front. Plant Sci. 2014, 5, 447. [Google Scholar] [CrossRef] [PubMed]
  7. Pratelli, R.; Pilot, G. Regulation of amino acid metabolic enzymes and transporters in plants. J. Exp. Bot. 2014, 65, 5535–5556. [Google Scholar] [CrossRef] [PubMed]
  8. Baqir, H.A.; Zeboon, N.H.; Al-behadili, A.A.J. The role and importance of aminoacids within plants: A review. Plant Arch. 2019, 19, 1402–1410. [Google Scholar]
  9. Vijay, N.; Kumar, A.; Bhoite, A. Influence of nitrogen, phosphorus and potassium fertilizer on biochemical contents of Asparagus racemosus (Willd.) root tubers. Res. J. Environ. Sci. 2009, 3, 285–291. [Google Scholar] [CrossRef]
  10. Hossain, K.L.; Rahman, M.; Banu, M.A.; Khan, T.R.; Ali, M.S. Nitrogen fertilizer effects on the agronomic aspects of Asparagus racemosus. Asian J. Plant Sci. 2006, 5, 1012–1016. [Google Scholar]
  11. Sanders, D.C. Nitrogen-potassium interactions in asparagus. In IX International Asparagus Symposium; Acta Horticulturae: Washinghton, DC, USA, 1997; pp. 421–426. [Google Scholar]
  12. Prasad, M.; Srinivasan, R.; Chaudhary, M.; Choudhary, M.; Jat, L.K. Plant growth promoting rhizobacteria (PGPR) for sustainable agriculture: Perspectives and challenges. In PGPR Amelioration in Sustainable Agriculture; Woodhead Publishing: Cambridge, UK, 2019; pp. 129–157. [Google Scholar]
  13. Swarnalakshmi, K.; Yadav, V.; Tyagi, D.; Dhar, D.W.; Kannepalli, A.; Kumar, S. Significance of Plant Growth Promoting Rhizobacteria in grain legumes: Growth, promotion and crop production. Plants 2020, 9, 1596. [Google Scholar] [CrossRef]
  14. Verma, J.P.; Yadav, J.; Tiwari, K.N. Enhancement of nodulation and yield of chickpea by co-inoculation of indigenous Mesorhizobium spp. and plant growth–promoting rhizobacteria in eastern Uttar Pradesh. Commun. Soil Sci. Plant Anal. 2012, 43, 605–621. [Google Scholar] [CrossRef]
  15. Mishraa, P.K.; Bishta, S.C.; Jeevanandana, K.; Kumara, S.; Bisht, J.K.; Bhatt, J.C. Synergistic effect of inoculating plant growth-promoting Pseudomonas spp. and Rhizobium leguminosarum-FB1 on growth and nutrient uptake of rajmash (Phaseolus vulgaris L.). Agron. Soil Sci. 2014, 60, 799–815. [Google Scholar] [CrossRef]
  16. Dey, R.; Pal, K.K.; Bhatt, D.M.; Chauhan, S.M. Growth promotion and yield enhancement of peanut (Arachis hypogaea L.) by application of plant growth-promoting rhizobacteria. Microbiol. Res. 2004, 159, 371–394. [Google Scholar] [CrossRef] [PubMed]
  17. Mishra, P.K.; Bisht, S.C.; Ruwari, P.; Joshi, G.K.; Singh, G.; Bisht, J.K.; Bhatt, J.C. Bioassociative effect of cold tolerant Pseudomonas spp. and Rhizobium leguminosarum-PR1 on iron acquisition, nutrient uptake and growth of lentil (Lens culinaris L.). Eur. J. Soil Biol. 2011, 47, 35–43. [Google Scholar] [CrossRef]
  18. Arshad, M.; Frankenberger, W.T., Jr. Plant growth-regulating substances in the rhizosphere: Microbial production and functions. Adv. Agron. 1997, 62, 45–151. [Google Scholar]
  19. Teale, W.D.; Paponov, I.A.; Palme, K. Auxin in action: Signalling, transport and the control of plant growth and development. Nat. Rev. Mol. Cell Biol. 2006, 7, 847–859. [Google Scholar] [CrossRef]
  20. Ge, C.; Radnezhad, H.; Abari, M.F.; Sadeghi, M.; Kashi, G. Effect of biofertilizers and plant growth promoting bacteria on the growth characteristics of the herb Asparagus officinalis. Appl. Ecol. Environ. Res. 2016, 14, 547–558. [Google Scholar] [CrossRef]
  21. Liddycoat, S.M.; Greenberg, B.M.; Wolyn, D.J. The effect of plant growth-promoting rhizobacteria on asparagus seedlings and germinating seeds subjected to water stress under greenhouse conditions. Can. J. Microbiol. 2009, 55, 388–394. [Google Scholar] [CrossRef]
  22. Adesemoye, A.O.; Torbert, H.A.; Kloepper, J.W. Enhanced plant nutrient use efficiency with PGPR and AMF in an integrated nutrient management system. Can. J. Microbiol. 2008, 54, 876–886. [Google Scholar] [CrossRef] [Green Version]
  23. Kaymak, H.C. Potential of PGPR in agricultural innovations. In Plant Growth and Health Promoting Bacteria. Microbiology Monographs; Maheshwari, D., Ed.; Springer: Berlin/Heidelberg, Germany, 2010; Volume 18. [Google Scholar]
  24. Drost, D. High phosphorus applications at planting improve asparagus root growth and yield. In XI International Asparagus Symposium; Acta Horticulturae: Washinghton, DC, USA, 2005; pp. 63–68. [Google Scholar]
  25. Mehboob, I.; Naveed, M.; Zahir, Z.A.; Ashraf, M. Potential of rhizobia for sustainable production of non-legumes. In Crop Production for Agricultural Improvement; Ashraf, M., Öztürk, M., Ahmad, M., Aksoy, A., Eds.; Springer: Dordrecht, The Netherlands, 2012. [Google Scholar]
  26. Bradstreet, R.B. Kjeldahl method for organic nitrogen. Anal. Chem. 1954, 26, 185–187. [Google Scholar] [CrossRef]
  27. Allen, E. Chemical Analysis of Ecological Materials; Blackwell Scientific Publishing: Oxford, UK, 1976. [Google Scholar]
  28. Arvanitoyannis, I.S.; Mavromatis, A. Banana cultivars, cultivation practices, and physicochemical properties. Crit. Rev. Food Sci. Nutr. 2009, 49, 113–135. [Google Scholar] [CrossRef]
  29. Milne, A.; Landing, W.; Bizimis, M.; Morton, P. Determination of Mn, Fe, Co, Ni, Cu, Zn, Cd and Pb in seawater using high resolution magnetic sector inductively coupled mass spectrometry (HR-ICP-MS). Anal. Chim. Acta 2010, 665, 200–207. [Google Scholar] [CrossRef] [PubMed]
  30. Ainalidou, A.; Tanou, G.; Belghazi, M.; Samiotaki, M.; Diamantidis, G.; Molassiotis, A.; Karamanoli, K. Integrated analysis of metabolites and proteins reveal aspects of the tissue-specific function of synthetic cytokinin in kiwifruit development and ripening. J. Proteom. 2016, 143, 318–333. [Google Scholar] [CrossRef] [PubMed]
  31. Fernandez-Escobar, R.; Moreno, R.; Garcıa-Creus, M. Seasonal changes of mineral nutrients in olive leaves during the alternate-bearing cycle. Sci. Hortic. 1999, 82, 25–45. [Google Scholar] [CrossRef]
  32. Moreno-Rojas, R.; Amaro-Lopez, M.A.; Zurera-Cosano, G. Mineral elements distribution in fresh asparagus. J. Food Compos. Anal. 1992, 5, 168–171. [Google Scholar] [CrossRef]
  33. Krug, H.; Kailuweit, D. Is asparagus cultivation dangerous to the environment? Nitrogen balance of asparagus. CAB Abstr. 1999, 35, 433–436. [Google Scholar]
  34. Yin, T.T.; Pin, U.L.; Ghazali, A.H.A. Influence of external nitrogen on nitrogenase enzyme activity and auxin production in Herbaspirillum seropedicae (Z78). Trop. Life Sci. Res. 2015, 26, 101. [Google Scholar]
  35. Bashan, Y.; de Bashan, L. How the plant growth-promoting bacterium Azospirillum promotes plant growth: A critical assessment. Adv. Agron. 2010, 108, 77–136. [Google Scholar]
  36. Cohen, A.; Travaglia, C.; Bottini, R.; Piccoli, P. Participation of abscisic acid and gibberellins produced by endophytic Azospirillum in the alleviation of drought effects in maize. Botany 2009, 87, 455–462. [Google Scholar] [CrossRef]
  37. Liu, J.; Hu, T.; Feng, P.; Yao, D.; Gao, F.; Hong, X. Effect of K fertilization during fruit development on tomato quality, K uptake, water and K use efficiency under deficit irrigation regime. Agric. Water Manag. 2021, 250, 106831. [Google Scholar] [CrossRef]
  38. Weinert, C.H.; Sonntag, F.; Egert, B.; Pawelzik, E.; Kulling, S.E.; Smit, I. The effect of K fertilization on the metabolite profile of tomato fruit (Solanum lycopersicum L.). Plant Physiol. Biochem. 2021, 159, 89–99. [Google Scholar] [CrossRef]
  39. Lemoine, R. Sucrose transporters in plants: Update on function and structure. Biochim. Et Biophys. Acta (BBA)-Biomembr. 2000, 465, 246–262. [Google Scholar] [CrossRef] [Green Version]
  40. Bick, J.A.; Neelam, A.; Smith, E.; Nelson, S.J.; Hall, J.L.; Williams, L.E. Expression analysis of a sucrose carrier in the germinating seedling of Ricinus communis. Plant Mol. Biol. 1998, 38, 425–435. [Google Scholar] [CrossRef]
  41. Stadler, R.; Brandner, J.; Schulz, A.; Gahrtz, M.; Sauer, N. Phloem loading by the PmSuc2 sucrose carrier from Plantago major occurs into companion cells. Plant Cell 1995, 7, 1545–1554. [Google Scholar] [CrossRef] [PubMed]
  42. Pressman, E.; Schaffer, A.A.; Compton, D.; Zamski, E. Seasonal changes in the carbohydrate content of two cultivars of asparagus. Sci. Hortic. 1993, 53, 149–155. [Google Scholar] [CrossRef]
  43. Wilson, D.R.; Cloughley, C.G.; Jamieson, P.D.; Sinton, S.M. A model of asparagus growth physiology. Acta Hortic. 2002, 589, 297–301. [Google Scholar] [CrossRef]
  44. Wieczorke, R.; Dlugai, S.; Krampe, S.; Boles, E. Characterisation of mammalian GLUT glucose transporters in a heterologous yeast expression system. Cell Physiol. Biochem. 2003, 13, 123–134. [Google Scholar] [CrossRef]
  45. Yamada, K.; Kanai, M.; Osakabe, Y.; Ohiraki, H.; Shinozaki, K.; Yamaguchi-Shinozaki, K. Monosaccharide absorption activity of Arabidopsis roots depends on expression profiles of transporter genes under high salinity conditions. J. Biol. Chem. 2011, 286, 43577–43586. [Google Scholar] [CrossRef] [Green Version]
  46. Lidon, Z.Z.; Cebola, F. An overview on drought induced changes in plant growth, water relations and photosynthesis. Emir. J. Food Agric. 2012, 24, 57–72. [Google Scholar] [CrossRef] [Green Version]
  47. Thamer, S.; Schädler, M.; Bonte, D. Dual benefit from a belowground symbiosis: Nitrogen fixing rhizobia promote growth and defense against a specialist herbivore in a cyanogenic plant. Plant Soil 2011, 341, 209–219. [Google Scholar] [CrossRef]
  48. Verma, V.C.; Singh, S.K.; Prakash, S. Bio-control and plant growth promotion potential of siderophore producing endophytic Streptomyces from Azadirachta indica A. Juss. J. Basic Microb. 2011, 51, 550–556. [Google Scholar] [CrossRef] [PubMed]
  49. Dong, S.; Scagel, C.F.; Cheng, L.; Fuchigami, L.H.; Rygiewicz, P.T. Soil temperature and plant growth stage influence nitrogen uptake and amino acid concentration of apple during early spring growth. Tree Physiol. 2001, 21, 541–547. [Google Scholar] [CrossRef] [PubMed] [Green Version]
  50. Moe, L.A. Amino acids in the rhizosphere: From plants to microbes. Am. J. Bot. 2013, 100, 1692–1705. [Google Scholar] [CrossRef] [PubMed]
  51. Chea, L.; Pfeiffer, B.; Schneider, D.; Daniel, R.; Pawelzik, E.; Naumann, M. Morphological and metabolite responses of potatoes under various phosphorus levels and their amelioration by plant growth-promoting rhizobacteria. Int. J. Mol. Sci. 2021, 22, 5162. [Google Scholar] [CrossRef] [PubMed]
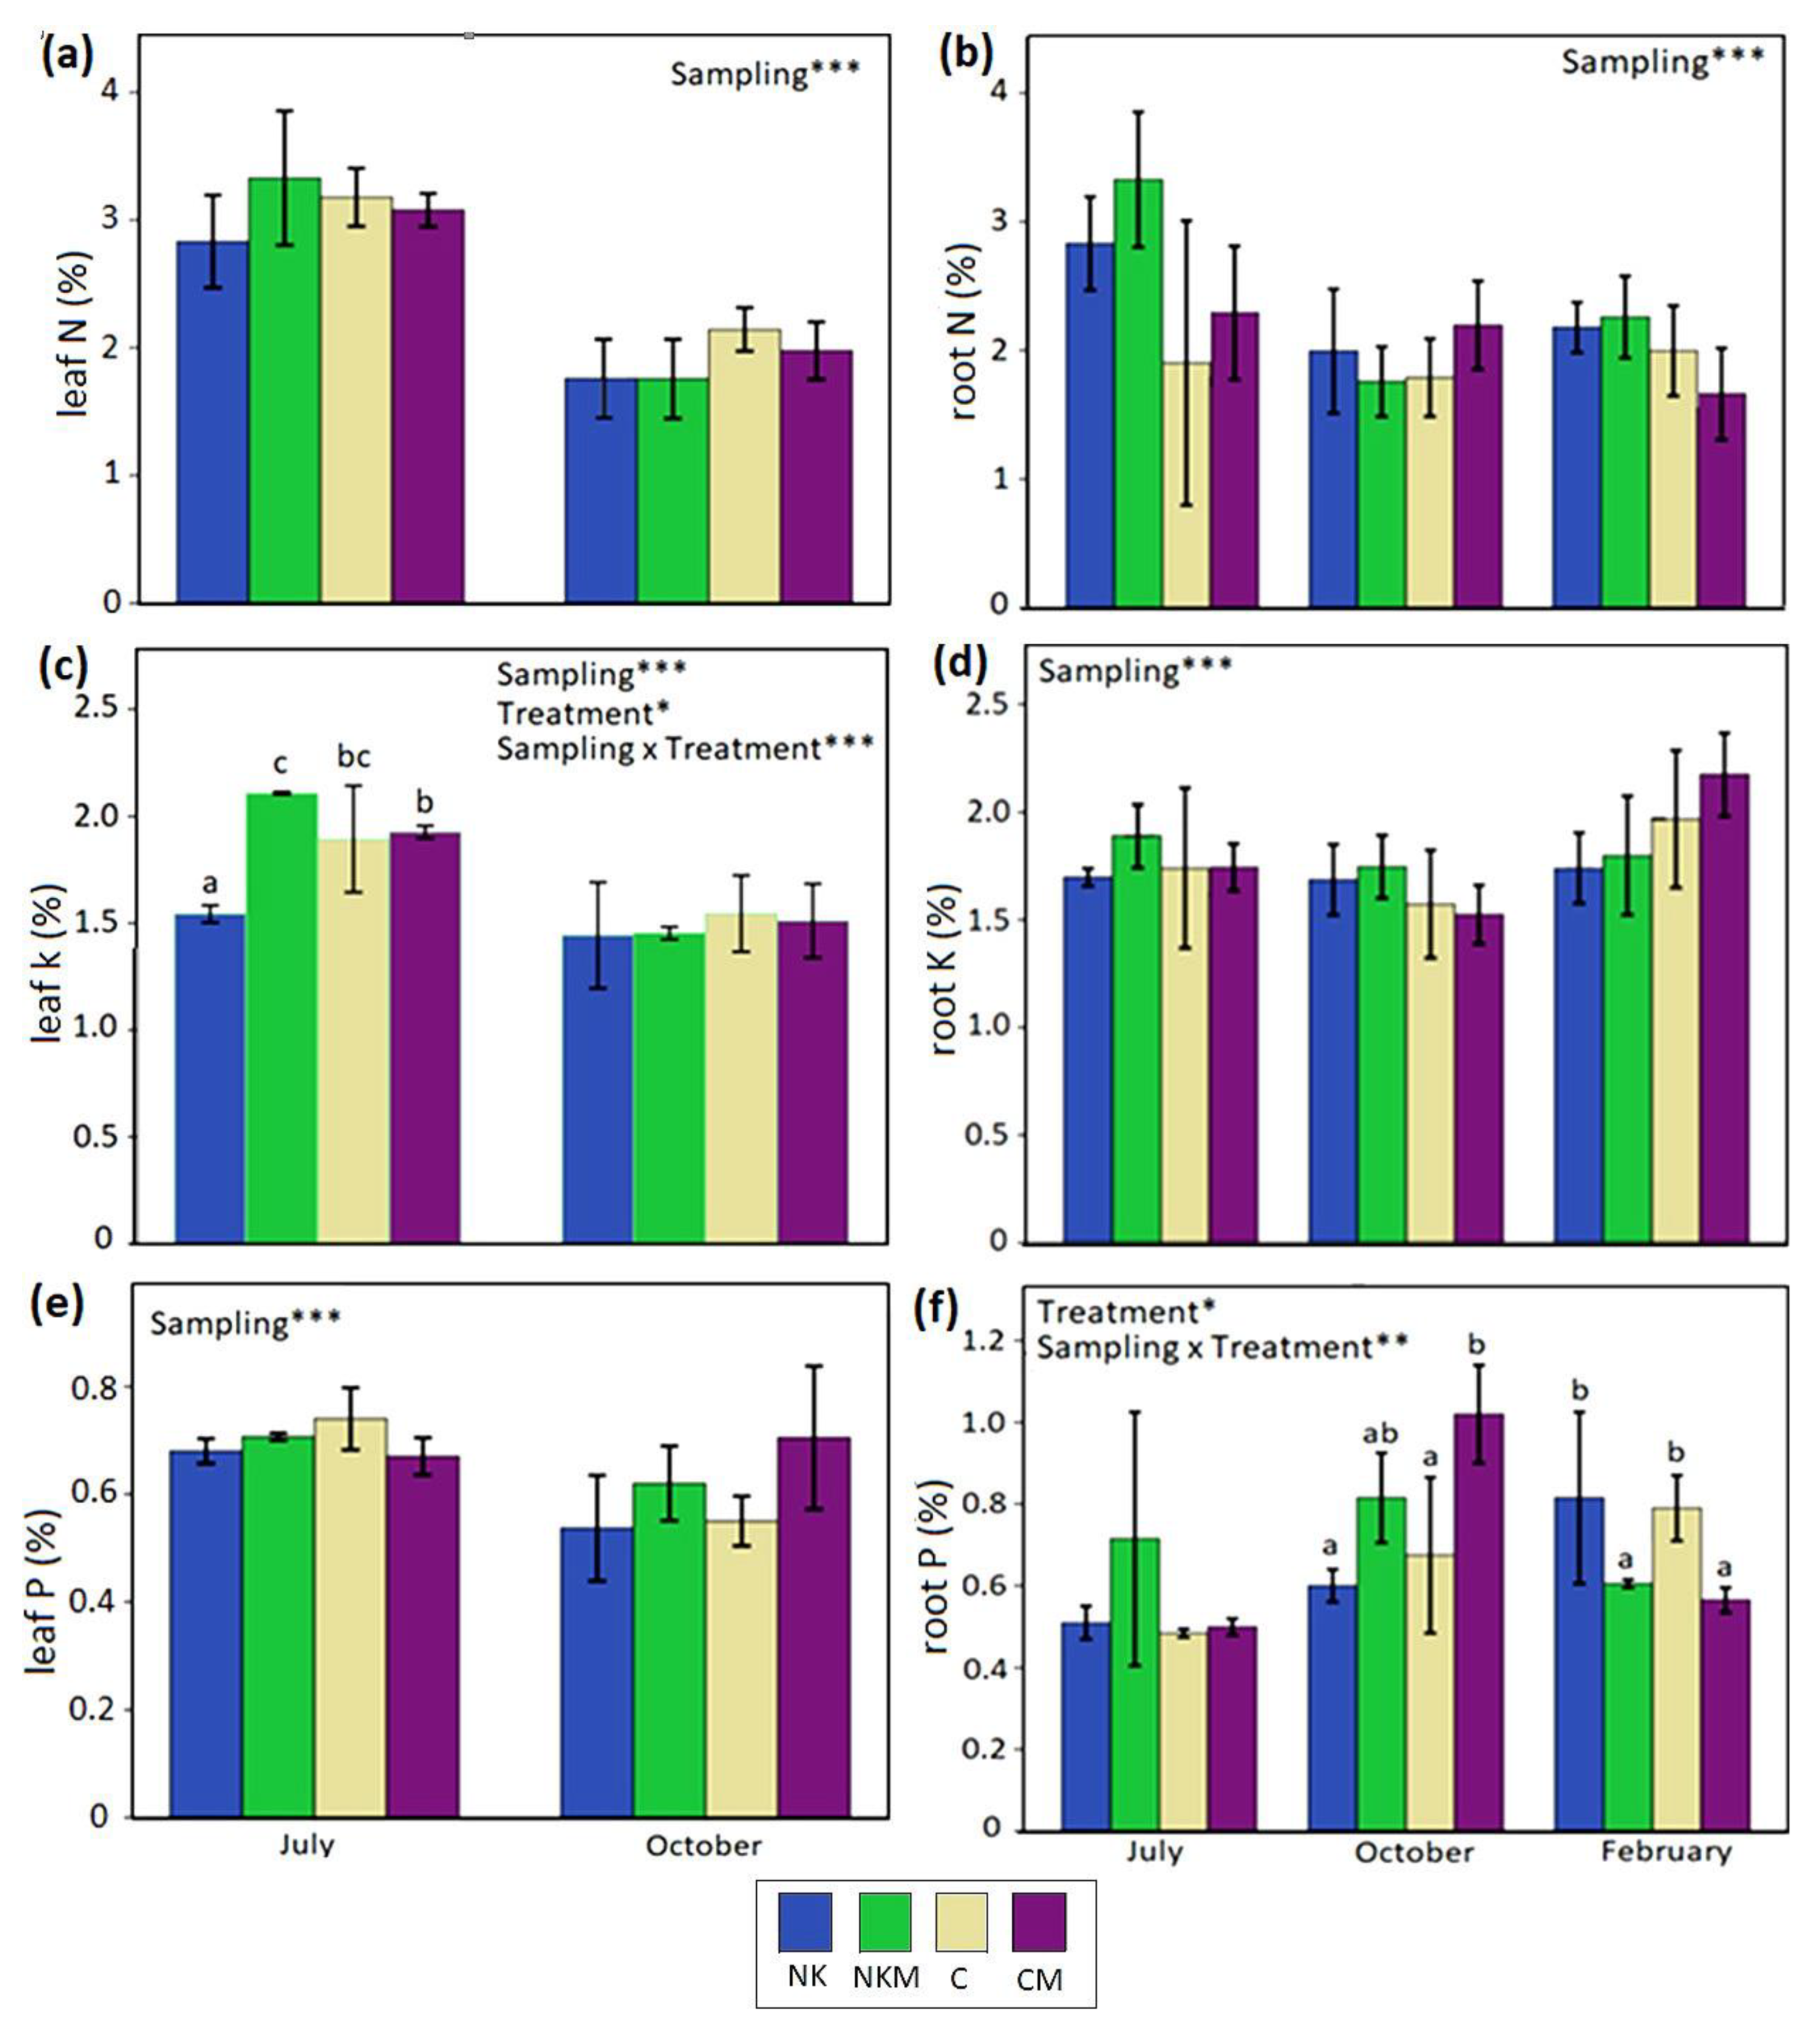
Figure 1. (af) Mean values (±SE) of leaf N (a), leaf K (c), leaf P (e) and root N (b), root K (d) and root P (f) content, as recorded in July, October and February samplings of all treatment groups (NK: KNO3 fertilizer; NKM: KNO3 in combination with PGPR; C (Control): NH4NO3 fertilizer and CM: NH4NO3 fertilizer in combination with PGPR). “Sampling”, “Treatment” and “Sampling × Treatment” on the top of the graphs indicate a significant effect of the sampling period, the treatment or their interactive effect, respectively, as revealed by ANOVA (* p < 0.05, ** p< 0.01, *** p < 0.001). Different superscript letters denote significant differences between treatments (a: corresponds to the lowest value).
Horticulturae 07 00507 g001
Figure 2. (ac) Mean values (±SE) of leaf monosaccharide (a), disaccharide (b) and total sugar (c) content, as recorded in July, October and February samplings of all treatment groups (NK: KNO3 fertilizer; NKM: KNO3 in combination with PGPR; C (Control): NH4NO3 fertilizer and CM: NH4NO3 fertilizer in combination with PGPR). “Sampling”, “Treatment” and “Sampling × Treatment” on the top of the graphs indicate a significant effect of the sampling period, the treatment or their interactive effect, respectively, as revealed by ANOVA (*** p < 0.001). Different superscript letters denote significant differences between treatments (a: corresponds to the lowest value).
Horticulturae 07 00507 g002
Figure 3. Heatmap of leaf CHO content changes in all treatments (NK: KNO3 fertilizer; NKM: KNO3 in combination with PGPR; CM: NH4NO3 fertilizer in combination with PGPR) in comparison with the control (C: NH4NO3 fertilizer) in the first (a) and second (b) sampling periods. The green color indicates increased levels of metabolites, while the red color indicates decreased levels of metabolites. Amounts have been expressed as relative abundance based on the relative response compared to the internal standard (adonitol).
Horticulturae 07 00507 g003
Figure 4. (ac) Mean values (±SE) of root monosaccharide (a), disaccharide (b) and total sugar (c) content, as recorded in July, October and February samplings of all treatment groups (NK: KNO3 fertilizer; NKM: KNO3 in combination with PGPR; C (Control): NH4NO3 fertilizer and CM: NH4NO3 fertilizer in combination with PGPR). “Sampling”, “Treatment” and “Sampling × Treatment” on the top of the graphs indicate a significant effect of the sampling period, the treatment or their interactive effect, respectively, as revealed by ANOVA (*** p < 0.001). Different superscript letters denote significant differences between treatments (a: corresponds to the lowest value).
Horticulturae 07 00507 g004
Figure 5. (ac) Heatmap of root CHO content changes in all treatments (NK: KNO3 fertilizer; NKM: KNO3 in combination with PGPR; CM: NH4NO3 fertilizer in combination with PGPR) in comparison with the control (C: NH4NO3 fertilizer) in the first (a), second (b) and third (c) sampling periods. The green color indicates increased levels of metabolites, while the red color indicates decreased levels of metabolites. Amounts have been expressed as relative abundance based on the relative response compared to the internal standard (adonitol).
Horticulturae 07 00507 g005
Figure 6. (ac) Mean values (±SE) of leaf hydrophobic (a), hydrophilic (b) and total (c) amino acid content, as recorded in July, October and February samplings of all treatment groups (NK: KNO3 fertilizer; NKM: KNO3 in combination with PGPR; C (Control): NH4NO3 fertilizer and CM: NH4NO3 fertilizer in combination with PGPR). “Sampling”, “Treatment” and “Sampling × Treatment” on the top of the graphs indicate a significant effect of the sampling period, the treatment or their interactive effect, respectively, as revealed by ANOVA (** p< 0.01, *** p < 0.001). Different superscript letters denote significant differences between treatments (a: corresponds to the lowest value).
Horticulturae 07 00507 g006
Figure 7. (a,b) Heatmap of leaf amino acid content changes in all treatments (NK: KNO3 fertilizer; NKM: KNO3 in combination with PGPR; CM: NH4NO3 fertilizer in combination with PGPR) in comparison with the control (C) in the first (a) and second (b) sampling periods. The green color indicates increased levels of metabolites, while the red color indicates decreased levels of metabolites. Amounts have been expressed as relative abundance based on the relative response compared to the internal standard (adonitol).
Horticulturae 07 00507 g007
Figure 8. (ac) Mean values (±SE) of root hydrophobic (a), hydrophilic (b) and total (c) amino acid content, as recorded in July, October and February samplings of all treatment groups (NK: KNO3 fertilizer; NKM: KNO3 in combination with PGPR; C (Control): NH4NO3 fertilizer and CM: NH4NO3 fertilizer in combination with PGPR). “Sampling”, “Treatment” and “Sampling × Treatment” on the top of the graphs indicate a significant effect of the sampling period, the treatment or their interactive effect, respectively, as revealed by ANOVA (*** p < 0.001). Different superscript letters denote significant differences between treatments (a: corresponds to the lowest value).
Horticulturae 07 00507 g008
Figure 9. Heatmap of root amino acid content changes in all treatments (NK: KNO3 fertilizer; NKM: KNO3 in combination with PGPR; CM: NH4NO3 fertilizer in combination with PGPR) in comparison with the control (C: NH4NO3 fertilizer) in the first (a), second (b) and third (c) sampling periods. The green color indicates increased levels of metabolites, while the red color indicates decreased levels of metabolites. Amounts have been expressed as relative abundance based on the relative response compared to the internal standard (adonitol).
Horticulturae 07 00507 g009
Table 1. The physicochemical properties of the cultivation area.
Soil VariablesValue
pH6.18
EC (mS/cm)1.74
Organic matter (%)5.34
NO3-N (mg kg−1 dw)27.37
Phosphorus (mg kg−1 dw)18.75
Potassium (mg kg−1 dw)158.75
Magnesium (mg kg−1 dw)159.17
Calcium (mg kg−1 dw)1938.83
Iron (mg kg−1 dw)78.64
Copper (mg kg−1 dw)1.49
Boron (mg kg−1 dw)0.61
Manganese (mg kg−1 dw)3.38
Zinc (mg kg−1 dw)3.16
Table 2. Details regarding the applications that were performed on each treatment group.
TreatmentsApplications
KNO3 fertilizer (NK)25 kg/acre of 13-0-46 (N-P-K)
KNO3 fertilizer with PGPR (NKM)25 kg/acre of 13-0-46 of (N-P-K) and 500 mL/acre Azoriz
NH4NO3 fertilizer (C)30 kg/acre of 34-0-0 (N-P-K)
NH4NO3 fertilizer with PGPR (CM)30 kg/acre of 34-0-0 (N-P-K) and 500 mL/acre Azoriz
Publisher’s Note: MDPI stays neutral with regard to jurisdictional claims in published maps and institutional affiliations.