Article

Impact of Elevated CO2 and Temperature on Growth, Development and Nutrient Uptake of Tomato

by
Tejaswini C. Rangaswamy
1,
Shankarappa Sridhara
1,*,
Konapura Nagaraja Manoj
1,
Pradeep Gopakkali
1,
Nandini Ramesh
1,
Shadi Shokralla
2,3,
Tarek K. Zin El-Abedin
4,
Khalid F. Almutairi
5 and
Hosam O. Elansary
5,*
1
Center for Climate Resilient Agriculture, University of Agricultural and Horticultural Sciences, Shivamogga 577204, Karnataka, India
2
Centre for Biodiversity Genomics, University of Guelph, Guelph, ON N1G 2W1, Canada
3
Department of Integrative Biology, University of Guelph, Guelph, ON N1G 2W1, Canada
4
Department of Agriculture and Biosystems Engineering, Faculty of Agriculture (El-Shatby), Alexandria University, Alexandria 21545, Egypt
5
Plant Production Department, College of Food and Agriculture Sciences, King Saud University, Riyadh 11451, Saudi Arabia
*
Authors to whom correspondence should be addressed.
Horticulturae 2021, 7(11), 509; https://doi.org/10.3390/horticulturae7110509
Submission received: 16 October 2021 / Revised: 9 November 2021 / Accepted: 15 November 2021 / Published: 19 November 2021

Abstract

:
Elevated carbon dioxide (EC) can increase the growth and development of different C3 fruit crops, which may further increase the nutrient demand by the accumulated biomass. In this context, the current investigation was conceptualized to evaluate the growth performance and nutrient uptake by tomato plants under elevated CO2 (EC700 and EC550 ppm) and temperature (+2 °C) in comparison to ambient conditions. Significant improvement in the growth indicating parameters like leaf area, leaf area index, leaf area duration and crop growth rate were measured at EC700 and EC550 at different stages of crop growth. Further, broader and thicker leaves of plants under EC700 and EC550 have intercepted higher radiation by almost 11% more than open field plants. Conversely, elevated temperature (+2 °C) had negative influence on crop growth and intercepted almost 7% lower radiation over plants under ambient conditions. Interestingly, earliness of phenophases viz., branch initiation (3.0 days), flower initiation (4.14 days), fruit initiation (4.07 days) and fruit maturation (7.60 days) were observed at EC700 + 2 °C, but it was statistically on par with EC700 and EC550 + 2 °C. Irrespective of the plant parts and growth stages, plants under EC700 and EC550 have showed significantly higher nutrient uptake due to higher root biomass. At EC700, the tune of increase in total nitrogen, phosphorus and potassium uptake was almost 134%, 126% and 135%, respectively compared to open field crop. This indicates higher nutrient demand by the crop under elevated CO2 levels because of higher dry matter accumulation and radiation interception. Thus, nutrient application is needed to be monitored at different growth stages as per the crop needs.

1. Introduction

Climate change has become a main focus of social and scientific attention. It is one of the most critical threats faced by the world today. The rise in atmospheric carbon dioxide (CO2) concentration is one of the most prominent and undesirable indicators of global climate change. Greenhouse gases are the primary source of cause for rising temperature levels in the atmosphere. According to the Intergovernmental Panel on Climate Change (IPCC), the CO2 level has risen at a pace of 1.9 ppm per year over the last twelve years and is expected to exceed 570 ppm by the middle of this century [1]. As a result, global surface temperature is expected to rise by 3–4.5 °C [1]. In addition, crop development is highly influenced by predicted climate changes globally, such as CO2 levels, surface temperatures, and rainfall patterns [2].
Crop growth and production are influenced by climate change, mainly through the changes in photosynthetic carbon assimilation [3]. Under elevated conditions, as a carbon fertilizer, CO2 enhances the growth and development of crops [4]. A higher rate of photosynthetic carbon fixation by leaves is the primary effect of increased atmospheric CO2 on plants [5]. Crop growth and development at higher CO2 levels (475–600 ppm) enhanced photosynthetic rate by almost 40% in different plant species under several Free-air carbon dioxide enrichment (FACE) experiments [6]. Increased photosynthetic rate enables more photosynthates and thereby more dry matter buildup at elevated CO2 conditions. Elevated CO2 levels increased the leaf area, leaf area index (LAI), leaf thickness, leaf area duration (LAD) and amount of dry biomass production in tomatoes [7,8]. On the other hand, higher dry matter accumulation under elevated CO2 conditions also increases radiation interception by the plants. A linear association between solar radiation interception and total dry matter buildup was earlier noticed in rice and chickpea [9,10]. LAI and LAD will primarily influence the radiation interception by the crop. However, these parameters were higher under elevated CO2 conditions and intercepted more radiation in different crop species [11,12]. Higher CO2 levels are generally characterized by an increase in ambient temperature, and as a result, temperature influences the various phenological phases and crop duration [13,14]. Previous studies also documented a shorter crop cycle and early initiation of different phenophases in rice, wheat, maize and mungbean at higher temperature conditions [15,16,17]. Elevated temperature negatively influences the net photosynthesis in the leaves by affecting photorespiration and ribulose-1,5-bisphosphate carboxylase activity in addition to heat injury and physiological disorders and thereby reduces crop yield [18,19].
The impact of increased CO2 on plants will differ based on other climatic factors. Under elevated conditions, the prevailing air temperature and moisture stress will influence plant growth and development. However, it directly impacts plant metabolism by photosynthesis, where carbon enters the biosphere [20]. Thus, higher CO2 levels are expected to promote photosynthetic rate, while the magnitude of increase was unclear as it relies on leaf air temperature, moisture availability, and soil nutrient status [21,22]. Although increased CO2 allows carbon to be more accessible to plants, they also need other resources from the soil, such as mineral nutrients. The nutrient requirement by the crops also will vary under elevated CO2 levels to put forth higher dry matter. Previous studies have also shown that nitrogen, phosphorus and potassium play a prominent role in regulating the magnitude of the crop’s response to increased CO2 and that their higher uptake will negatively impact soil nutrient dynamics [23,24]. Under lower nutrient availability, plants’ ability to react to increased CO2 with higher photosynthetic rate and biomass accumulation can be reduced [25]. Lower nutrient conditions decreased the enhancement in dry matter accumulation under elevated CO2 in many crop species [26]. Wheat and rice also showed significant improvement in nutrient uptake under elevated CO2 [13,27,28].
Tomato is one of the commonly grown vegetable crops on the planet, and it is known to be a heavy fertilizer feeder. Like other C3 species, tomato growth, development, and nutrient demand will vary according to the CO2 concentration and temperature variations. The enhanced photosynthetic rate was earlier reported in vegetable crops under higher CO2 levels [7,29]. The elevated temperature also influences vegetative growth like biomass production, its partitioning to different plant parts and development regarding the branch, flower, and fruit initiation. Besides, it also affects the fruit maturation of tomatoes at the cost of crop growth rate and development [30,31]. However, proper documentation on the combined influence of elevated CO2 and temperature levels on growth indicating parameters, nutrient uptake and requirement by tomato crop is very meager. At this juncture the current investigation was aimed to determine the effect of elevated CO2 and temperature at their individual level and particularly in their combination on different growth indicating parameters such as leaf area, leaf area index, leaf area duration, crop growth rate etc. and different developmental stages of tomato crop such as branch initiation, flower initiation, fruit initiation, fruit maturation. Since biomass accumulation has a strong influence on nutrient uptake patterns, we also aimed to study the effect of elevated CO2 and temperature on nutrient uptake patterns in the tomato crop under sub-tropical climatic situations of the Indian context.

2. Materials and Methods

2.1. Experimental Details

The field investigation was carried out during rainy season of 2019 (June–October) in the Open Top Chambers (OTC) at Centre for Climate Resilient Agriculture, University of Agricultural and Horticultural Sciences, Navile, Shivamogga, Karnataka, India. The experimental site is located between 13°58′ North latitude and 75°34′ East longitude at an elevation of 615 m above the mean sea level. The climate of the site is tropical and semi-arid. The soil was Sandy loam in texture with neutral in reaction (6.60 pH), normal in electrical conductivity (103 dS/m) and medium in organic carbon (0.63%). Further, the soil was low in available nitrogen (248 kg/ha), high in available phosphorus (30.82 kg/ha) and medium in potassium (261.58 kg/ha). During the cropping period (August to December), the actual precipitation received was 940.5 mm, which was above the usual rainfall (435.8 mm). The mean maximum and minimum temperature of 30.7 °C and 17.6 °C were recorded during November and December months. The relative humidity was varied from 75% in November to 88% in August.
The experiment was formulated in two factors randomized complete block design with three replications. The treatment details are furnished in Table 1. OTCs of size 5 m × 5 m × 3 m were constructed of an aluminum frame covered by panels of polyvinyl chloride with an open top without chimney and were utilized for the experiment. As per the treatments, pure CO2 gas was provided to the OTCs and maintained at desired levels utilizing sensor based Non-dispersive infrared (NDIR) CO2 gas analyzer. The supply of CO2 was controlled by Supervisory Control and Data Acquisition (SCADA) system coupled to a computer. A week after transplanting of seedlings to a week prior to crop maturity, CO2 gas was injected from the CO2 cylinders every day from 7.30 a.m. to 5.30 p.m. to maintain the desired level inside the OTCs. Similarly, infrared heaters were installed all over the periphery of the OTCs to maintain the desired temperature of +2 °C above the normal air temperature every day from 7.30 a.m. to 5.30 p.m. The automated temperature controller could detect both inside and outside temperatures, and if the temperature rose by more than +2 °C, the heaters would automatically turn off. Prevailed CO2 and temperature values under different treatments were presented in Table 2 along with actual weather conditions.
Prior to transplanting, land in normal condition and within the OTCs was manually dug up to a depth of about 30 cm and the soil was brought to the fine tilth. Following land preparation, farmyard manure was incorporated at the rate of 25 tones ha-1 and mixed into the soil 15 days prior to transplanting. About 30 days old, vigorous and uniform height seedlings of Arka Rakshak hybrid were transplanted at 90 cm × 90 cm spacing in each OTCs. The selected hybrid was not a self-pruned cultivar, so it was grown in vertical tied up to wooden poles. In each OTC, 25 plants were accommodated with five plants each in five raised beds. In which, three beds were considered as three replications in each OTC and remaining plants in two beds were utilized for destructive sampling purpose (3 plants at each observation). Fertilizers (urea, single super phosphate and muriate of potash) were applied at the rate of 250 kg N, 250 kg P2O5 and 250 kg K2O per ha in three split doses with basal dose of 50% N, 25% P and K applied four days after transplanting (DAT). Remaining was given at 30 DAT (25% N, 50% P and K) and 50 DAT (25% N, P and K), respectively. Foliar spray of Arka vegetable special at 4 g/L (Zinc: 225 ppm, Iron: 105 ppm, Boron: 50 ppm, Manganese: 42.5 ppm and Copper: 5 ppm) was given at 25 DAT, flower initiation and fruit initiation to supplement the micronutrients. To raise the seedlings, all the management practices were uniformly followed under both OTCs and open field conditions.

2.2. Growth Indicating Parameters

2.2.1. Leaf Area (cm2)

By using standard LI-COR leaf area meter (Model LI-3100, LICOR Inc., Lincoln City, NE, USA) total leaf area per plant was measured at three growth stages (50% flowering, peak fruiting, and harvest) in five randomly picked plants in each treatment and expressed in cm2.

2.2.2. Leaf Area Index

Leaf area index (LAI) is the green leaf area per unit ground area covered by the plant. It was determined using the following formula [32].
LAI = Leaf   area   ( cm 2 ) Land   area ( cm 2 )

2.2.3. Leaf Area Duration (Days)

Leaf area duration (LAD) denotes the capability of crop plant to produce green leaf area on unit ground area during crop cycle. It was worked out as per the Power et al. [33].
LAD = LAI i + LAI i + 1 2 × ( t 2 t 1 )
where,
LAIi = Leaf area index at ith stage
LAIi+1 = Leaf area index at (i + 1)th stage
t2 − t1 = Time interval (days)

2.2.4. Crop Growth Rate (g/m2/day)

Crop growth rate (CGR) signifies amount of drymatter accumulation per unit ground area and time, it was determined at different growth stages by the formula outlined by Watson [32].
CGR = W 2 W 1 t 2 t 1 × 1 P
where,
W1 = Dry matter of the plant (g) at time t1
W2 = Dry matter of the plant (g) at time t2
P = Unit land area occupied by the plant (m2)

2.2.5. Radiation Interception (MJ/m2)

To determine the amount of radiation intercepted by crop canopy, the incoming Photosynthetically Active Radiation (PAR) at both above and below the crop canopy was measured by using line quantum sensor (LI-COR, Lincoln City, NE, USA). The measurements were made at mid-day in order to avoid the effect of solar radiation on PAR interception [34]. Light transmission and proportion of PAR interception were calculated by using the following formulae given by Charles-Edwards and Lawn [35].
Light   transmission   ( T n ) = I L I o
where,
IL = PAR values below the crop canopy (i.e., LAI)
IO = PAR values above the crop canopy
The proportion of intercepted PAR by the crop at noon was calculated as
Qn = (1 − Tn)
The total incident solar radiation (MJ/cm2/day) as measured from Agro meteorological observatory was converted to PAR (MJ/m2/day) using a constant of 0.042 by assuming 45 per cent of incident solar radiation as PAR [36,37]. The cumulative intercepted radiation was computed for three growth stages of tomato (50% flowering, peak fruiting and at harvest).

2.3. Phenological Observations

The different phenophases—days to first branch initiation, days taken for flower initiation, days taken for fruit initiation and days taken for fruit maturation—were determined from five initially identified and labeled plants during entire crop cycle through visual observations by counting the number of days taken from the time of seedlings transplanting to the particular above mentioned phenophases [13,16].

2.4. Nutrient Uptake (kg/ha)

The crop samples (leaf and stem) were collected, oven dried, fine grinded and analyzed for total nitrogen, phosphorous and potassium content (%) at three different stages of the crop (50% flowering, peak fruiting and at harvest) as per the procedure described by Jackson [38]. Later, nutrient uptake by leaf and stem portion of the plant was worked out separately for each sample using the following formula.
Nutrient   uptake   by   leaf   ( kg / ha ) = Nutrient   concentration   in   leaf   ( % ) 100 × Leaf   dry   matter   ( kg / ha )
Nutrient   uptake   by   stem   ( kg / ha ) = Nutrient   concentration   in   stem   ( % ) 100 × Stem   dry   matter   ( kg / ha )

2.5. Root Dry Weight

Three plants from each treatment were uprooted at the time of observation and separated into leaves, stems and root, then dried in hot air oven at 65 °C until constant weight is attained. Later oven dry weight of roots was taken and dry weight per plant was worked out.

2.6. Data Analysis

The data obtained on various parameters was statistically analyzed by using SPSS software version 20. Two-way analysis followed by Duncan’s Multiple Range Test (DMRT) is used for mean comparison apart from Least Significant Difference (LSD). The significance at p = 0.05 level was used for the comparison. Correlation was studied to know the association between growth indicating parameters, radiation interception and nutrient uptake by tomato plants. Pearson correlation coefficients were computed and correlograph was plotted using corrplot package version 0.87 in R studio version 3.6.2.

3. Results

3.1. Effect on Growth Indicating Parameters

The elevated levels of temperature and CO2 significantly influenced the different growth indicating parameters as shown by variation in leaf area, LAI, LAD and CGR at 50% flowering, peak fruiting and at harvest stages of tomato. The plants showed significant (p = 0.05) increase in leaf area and LAI up to peak fruiting stage and then declined at harvest stage due to senescence of the crop. Compared to ambient levels in reference OTC and open field condition, improvement in leaf area and LAI was recorded at both elevated levels of CO2. Significantly higher total leaf area at 50% flowering (4829.93 cm2/plant), peak fruiting (9110.68 cm2/plant) and at harvest of tomato (4201.54 cm2/plant) was recorded in EC700 and the magnitude of increase was 21%, 42% and 241%, respectively over the open field plants. Subsequent maximum leaf area was noticed in EC550 (4431.26, 8660.76 and 4193.75 cm2/plant, respectively). LAI followed the same trend as that of the leaf area and recorded significantly improved LAI at EC700 (0.60, 1.12 and 0.52), which was closely followed by EC550 (0.55, 1.07 and 0.52) at 50% flowering, peak fruiting, and at harvest, respectively (Table 3). Meanwhile, crops grown under elevated temperature of +2 °C have shown reduced leaf area by 11–54% and LAI by 7–55% than crop grown under ambient conditions at open field situation across the different stages. Contrastingly, when crop was exposed to both elevated CO2 (EC550 and EC700) and temperature, the crop performed well than temperature alone in terms of leaf area and LAI at all stages of the crop growth and development.
The LAD and CGR were significantly influenced by the elevated CO2 levels and temperature rather than ambient conditions at all growth stages of the crop and are presented in Table 4. Increasing trend of LAD and CGR was noticed up to 50% flowering to peak fruiting stage, however it was reduced at peak fruiting to harvest stage due to reduced leaf area. But, the tune of variation was significantly higher than ambient conditions. The LAD of tomato plants at EC700 was improved by about 21%, 34% and 75% at 0 to 50% flowering, 50% flowering to peak fruiting and peak fruiting to harvest period, respectively over open field crop. Similarly, the tune of increase was 23%, 49% and 103%, respectively compared to ambient CO2 and temperature at reference OTC. Similarly, enhanced CGR of 59–83% and 29–70% have witnessed at EC700 and EC550, respectively than open field crop. On the other hand, elevated temperature of +2 °C has shown negative influence on LAD and CGR across the crop growth stages. However elevated temperature coupled with elevated CO2 levels masked the adverse effects of temperature and reflected in the improvement of LAD and CGR than open field condition with maximum at EC550 + 2 °C combination. Subsequent total LAD and average CGR of all the growth stages was also observed under EC700 (37% and 67%) and EC550 (29% and 46%) over open field crop (Table 4).

3.2. Effect on Cumulative Radiation Interception (MJ/m2)

The radiation interception of tomato plants improved significantly under higher CO2 levels and their combination with elevated temperature (Table 5). Plants grown at EC700 intercepted maximum cumulative radiation at different growth stages (50% flowering (143.61 MJ/m2), peak fruiting (365.77 MJ/m2) and at harvest (479.41 MJ/m2)) of tomato and the magnitude of increase was about 7%, 7% and 15%, respectively over open field crop. We also observed a similar kind of higher radiation interception even with the combination of elevated CO2 levels and temperature in our study. Conversely, a decrease in the cumulative radiation interception was observed when crop grown at elevated temperature of +2 °C alone (10%, 8% and 5%, respectively) and combination of ambient CO2 and temperature in OTC (9%, 3% and 1%, respectively) over open field crop.

3.3. Effect on Phenological Phases

At elevated CO2 levels, a remarkable change in the different phenological phase’s initiation during crop development was noticed in the tomato (Table 5). Crops took 21.63 days for first branch initiation, 35.06 days for flower initiation, 45.20 days for fruit formation and 69.40 days for fruit maturation under EC700 + 2 °C condition, but it was found statistically at par with EC700, EC550 + 2 °C. Conversely, tomato plants grown under open field conditions have taken 3.0, 4.14, 4.07 and 7.60 days longer for branch initiation, flower initiation, fruit formation and fruit maturation, respectively than plants grown at EC700 + 2 °C. However, plants grown at ambient conditions (CO2 and temperature) and elevated temperature (+2 °C) under OTCs have not shown earliness in the different phenophases initiation and were found on par with open field condition.

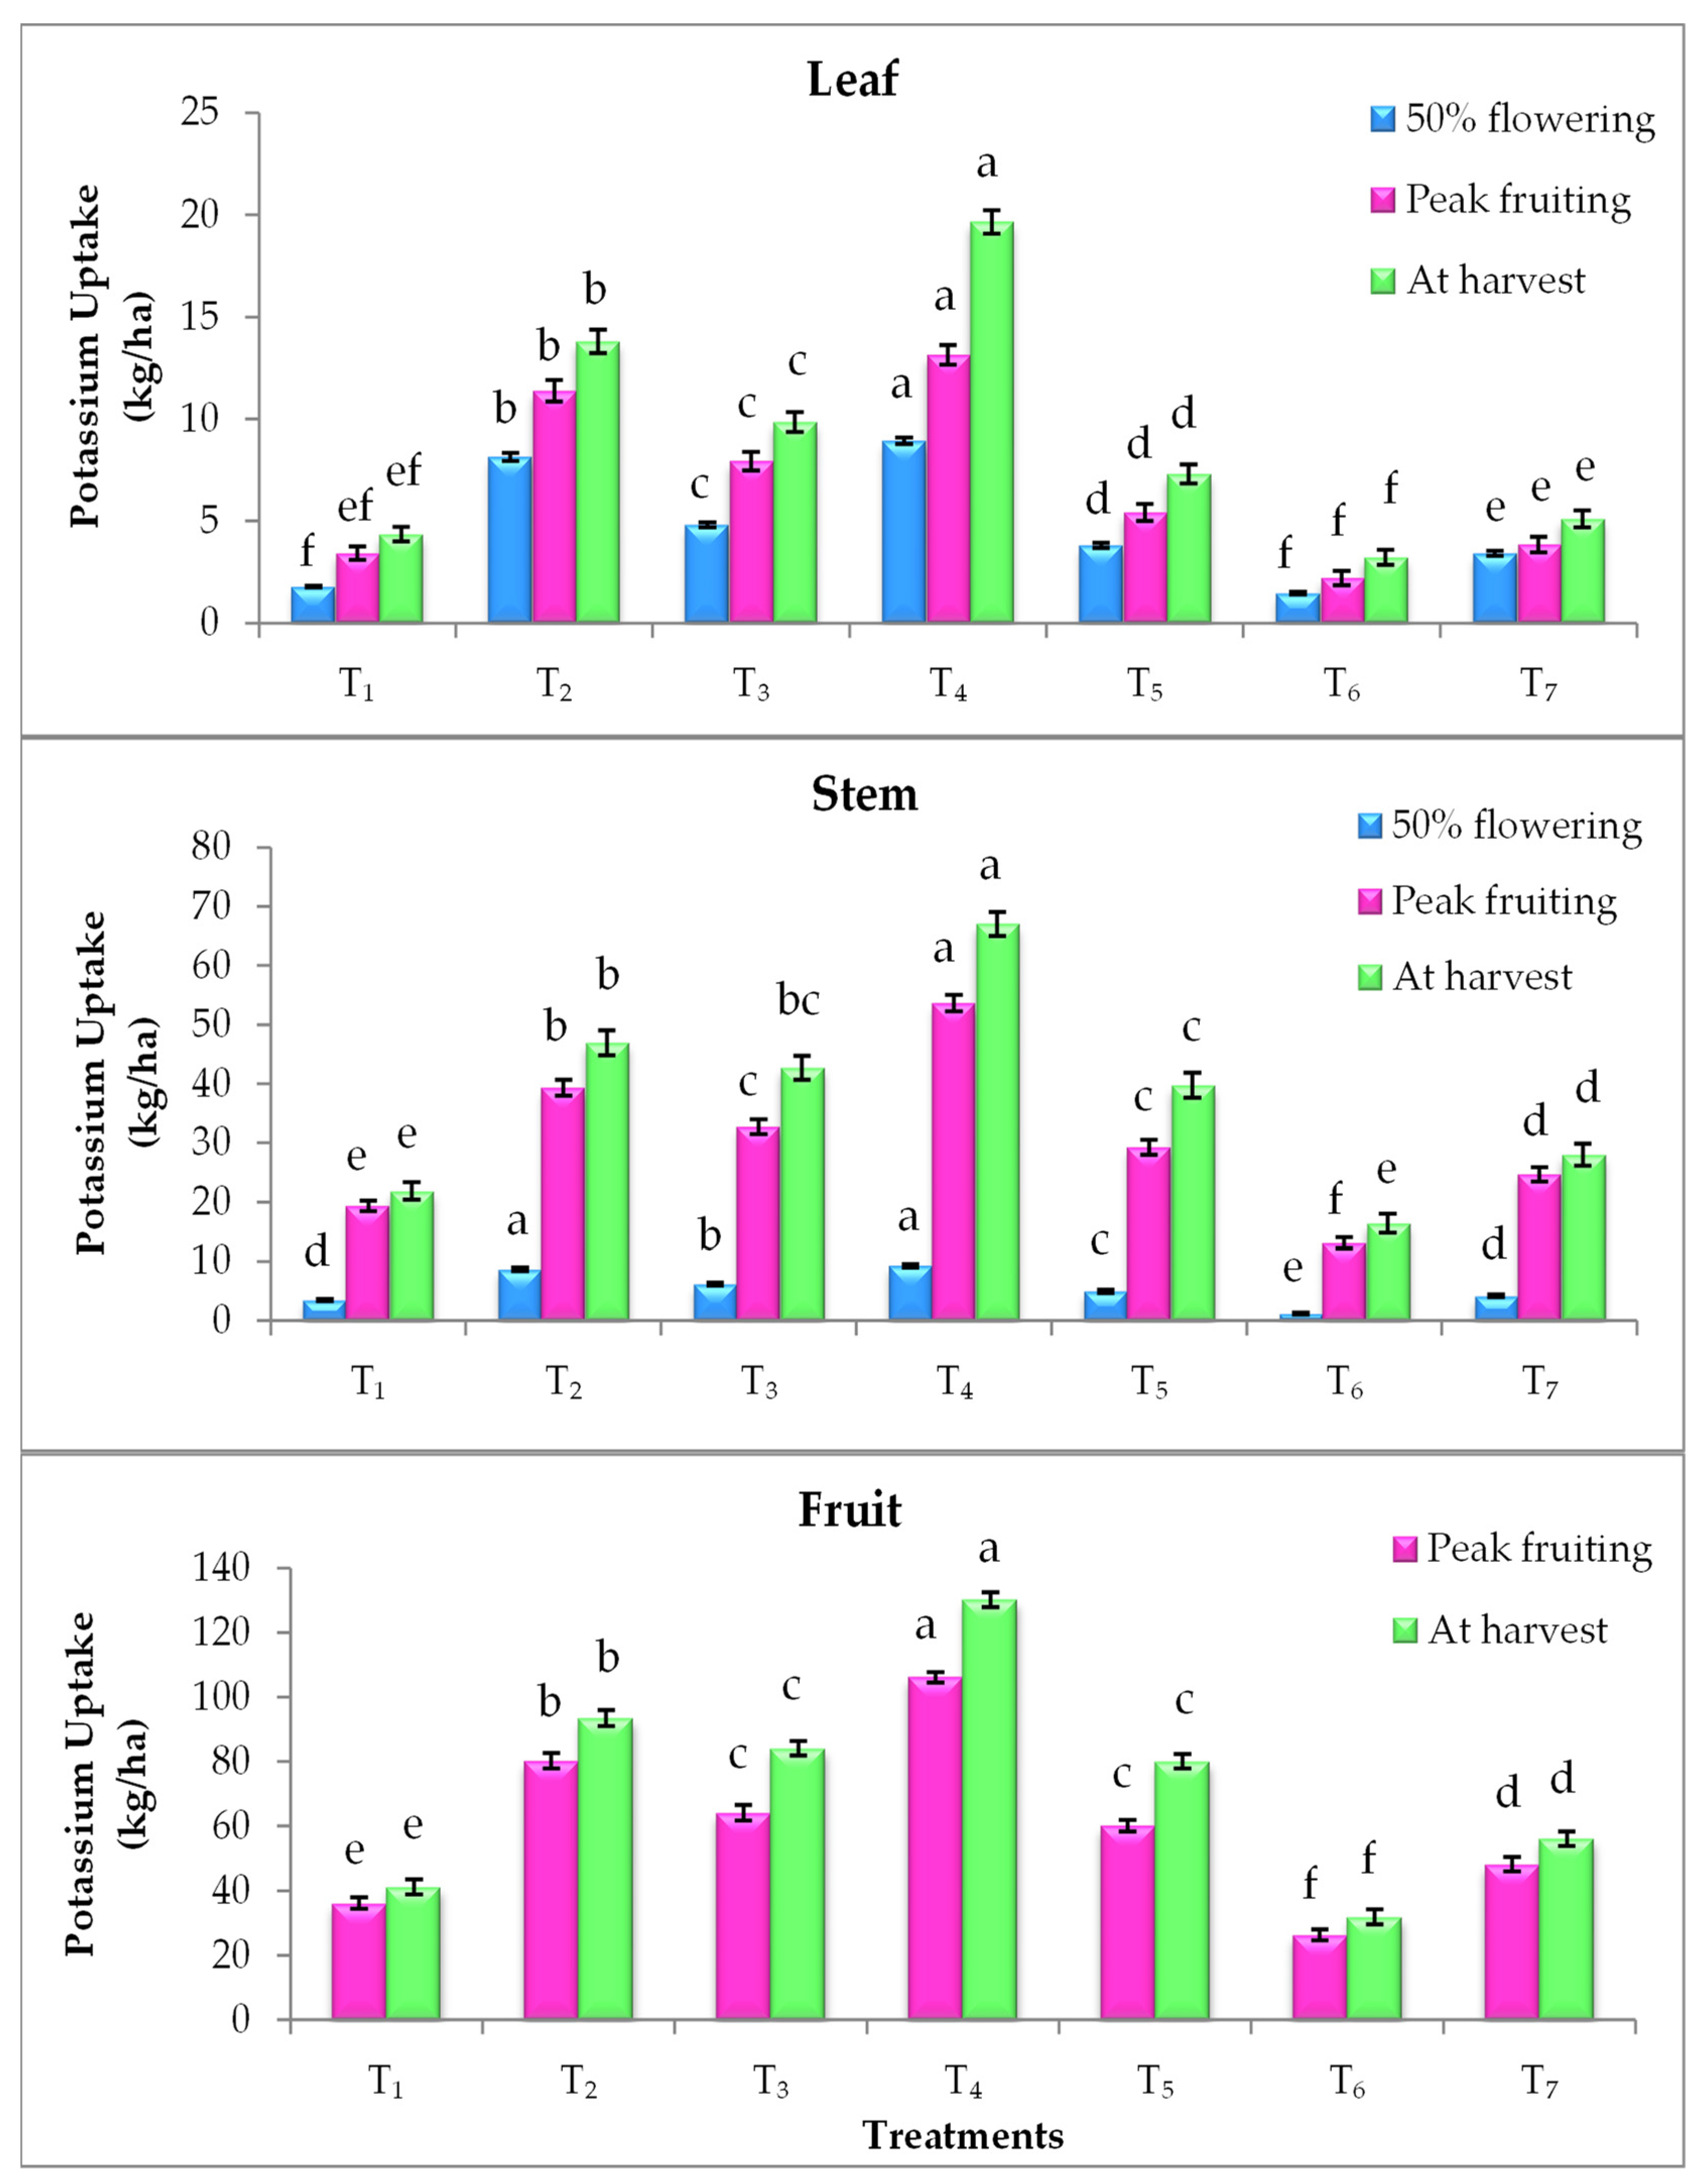
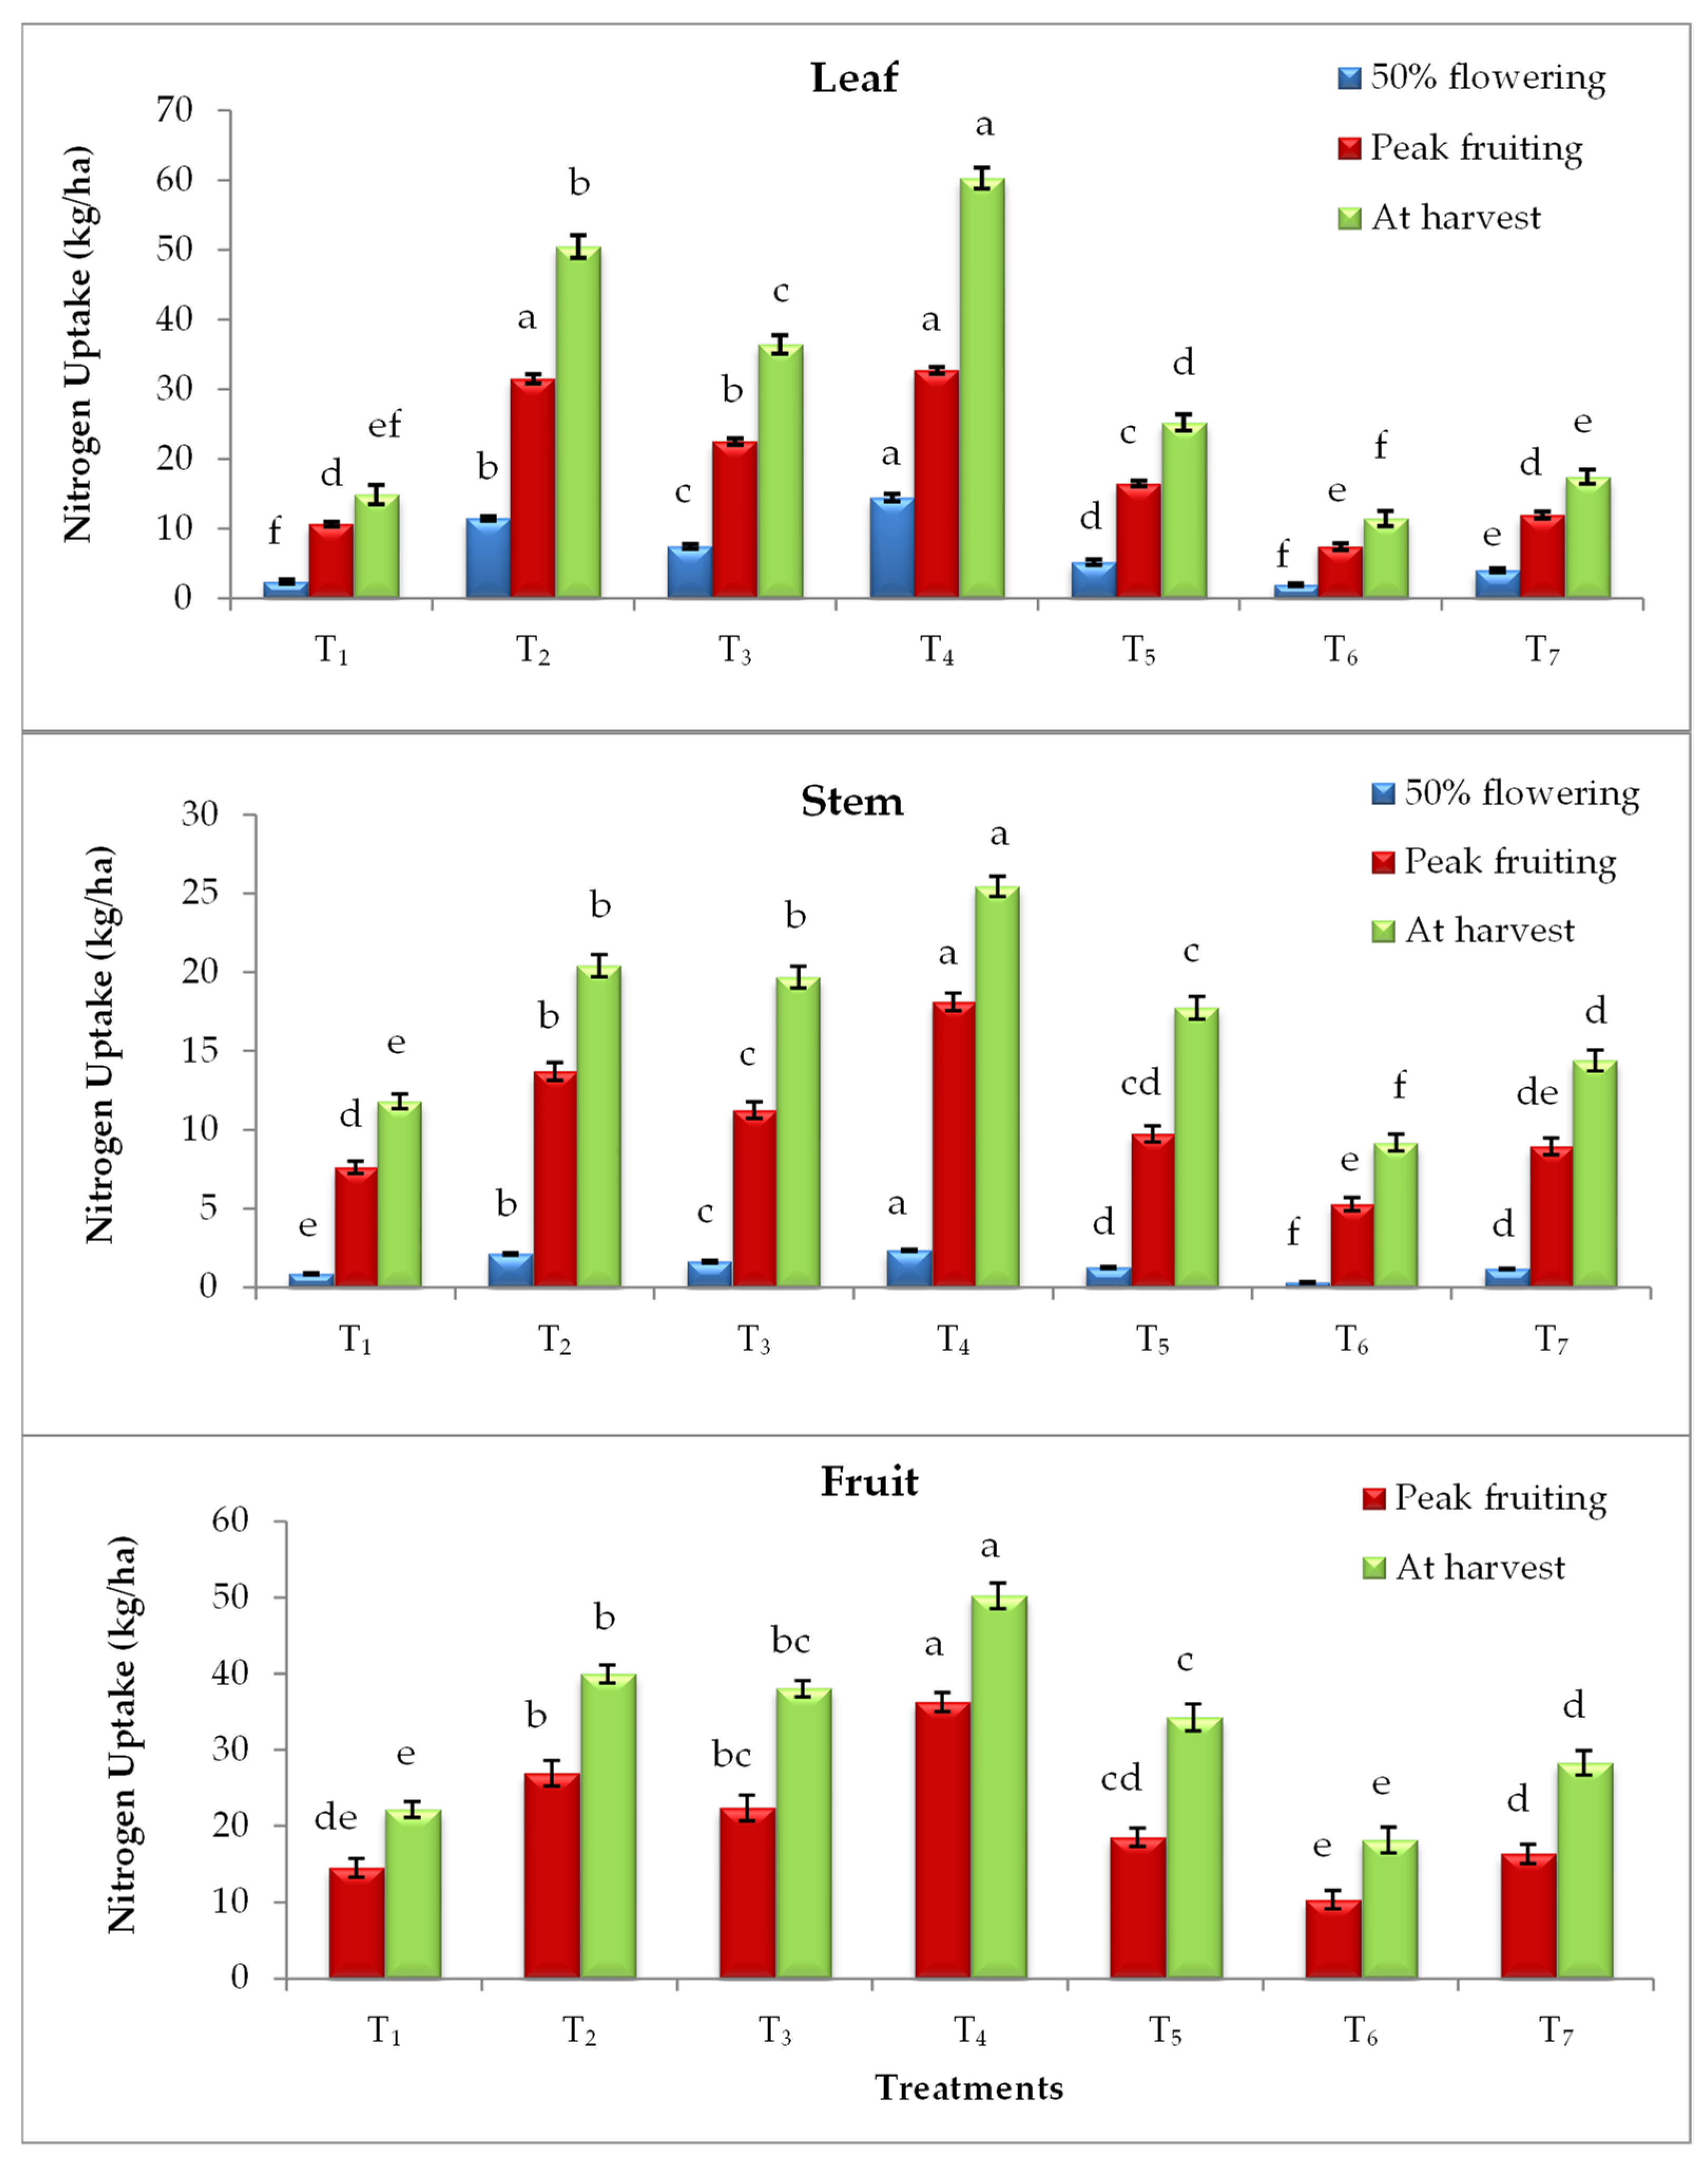
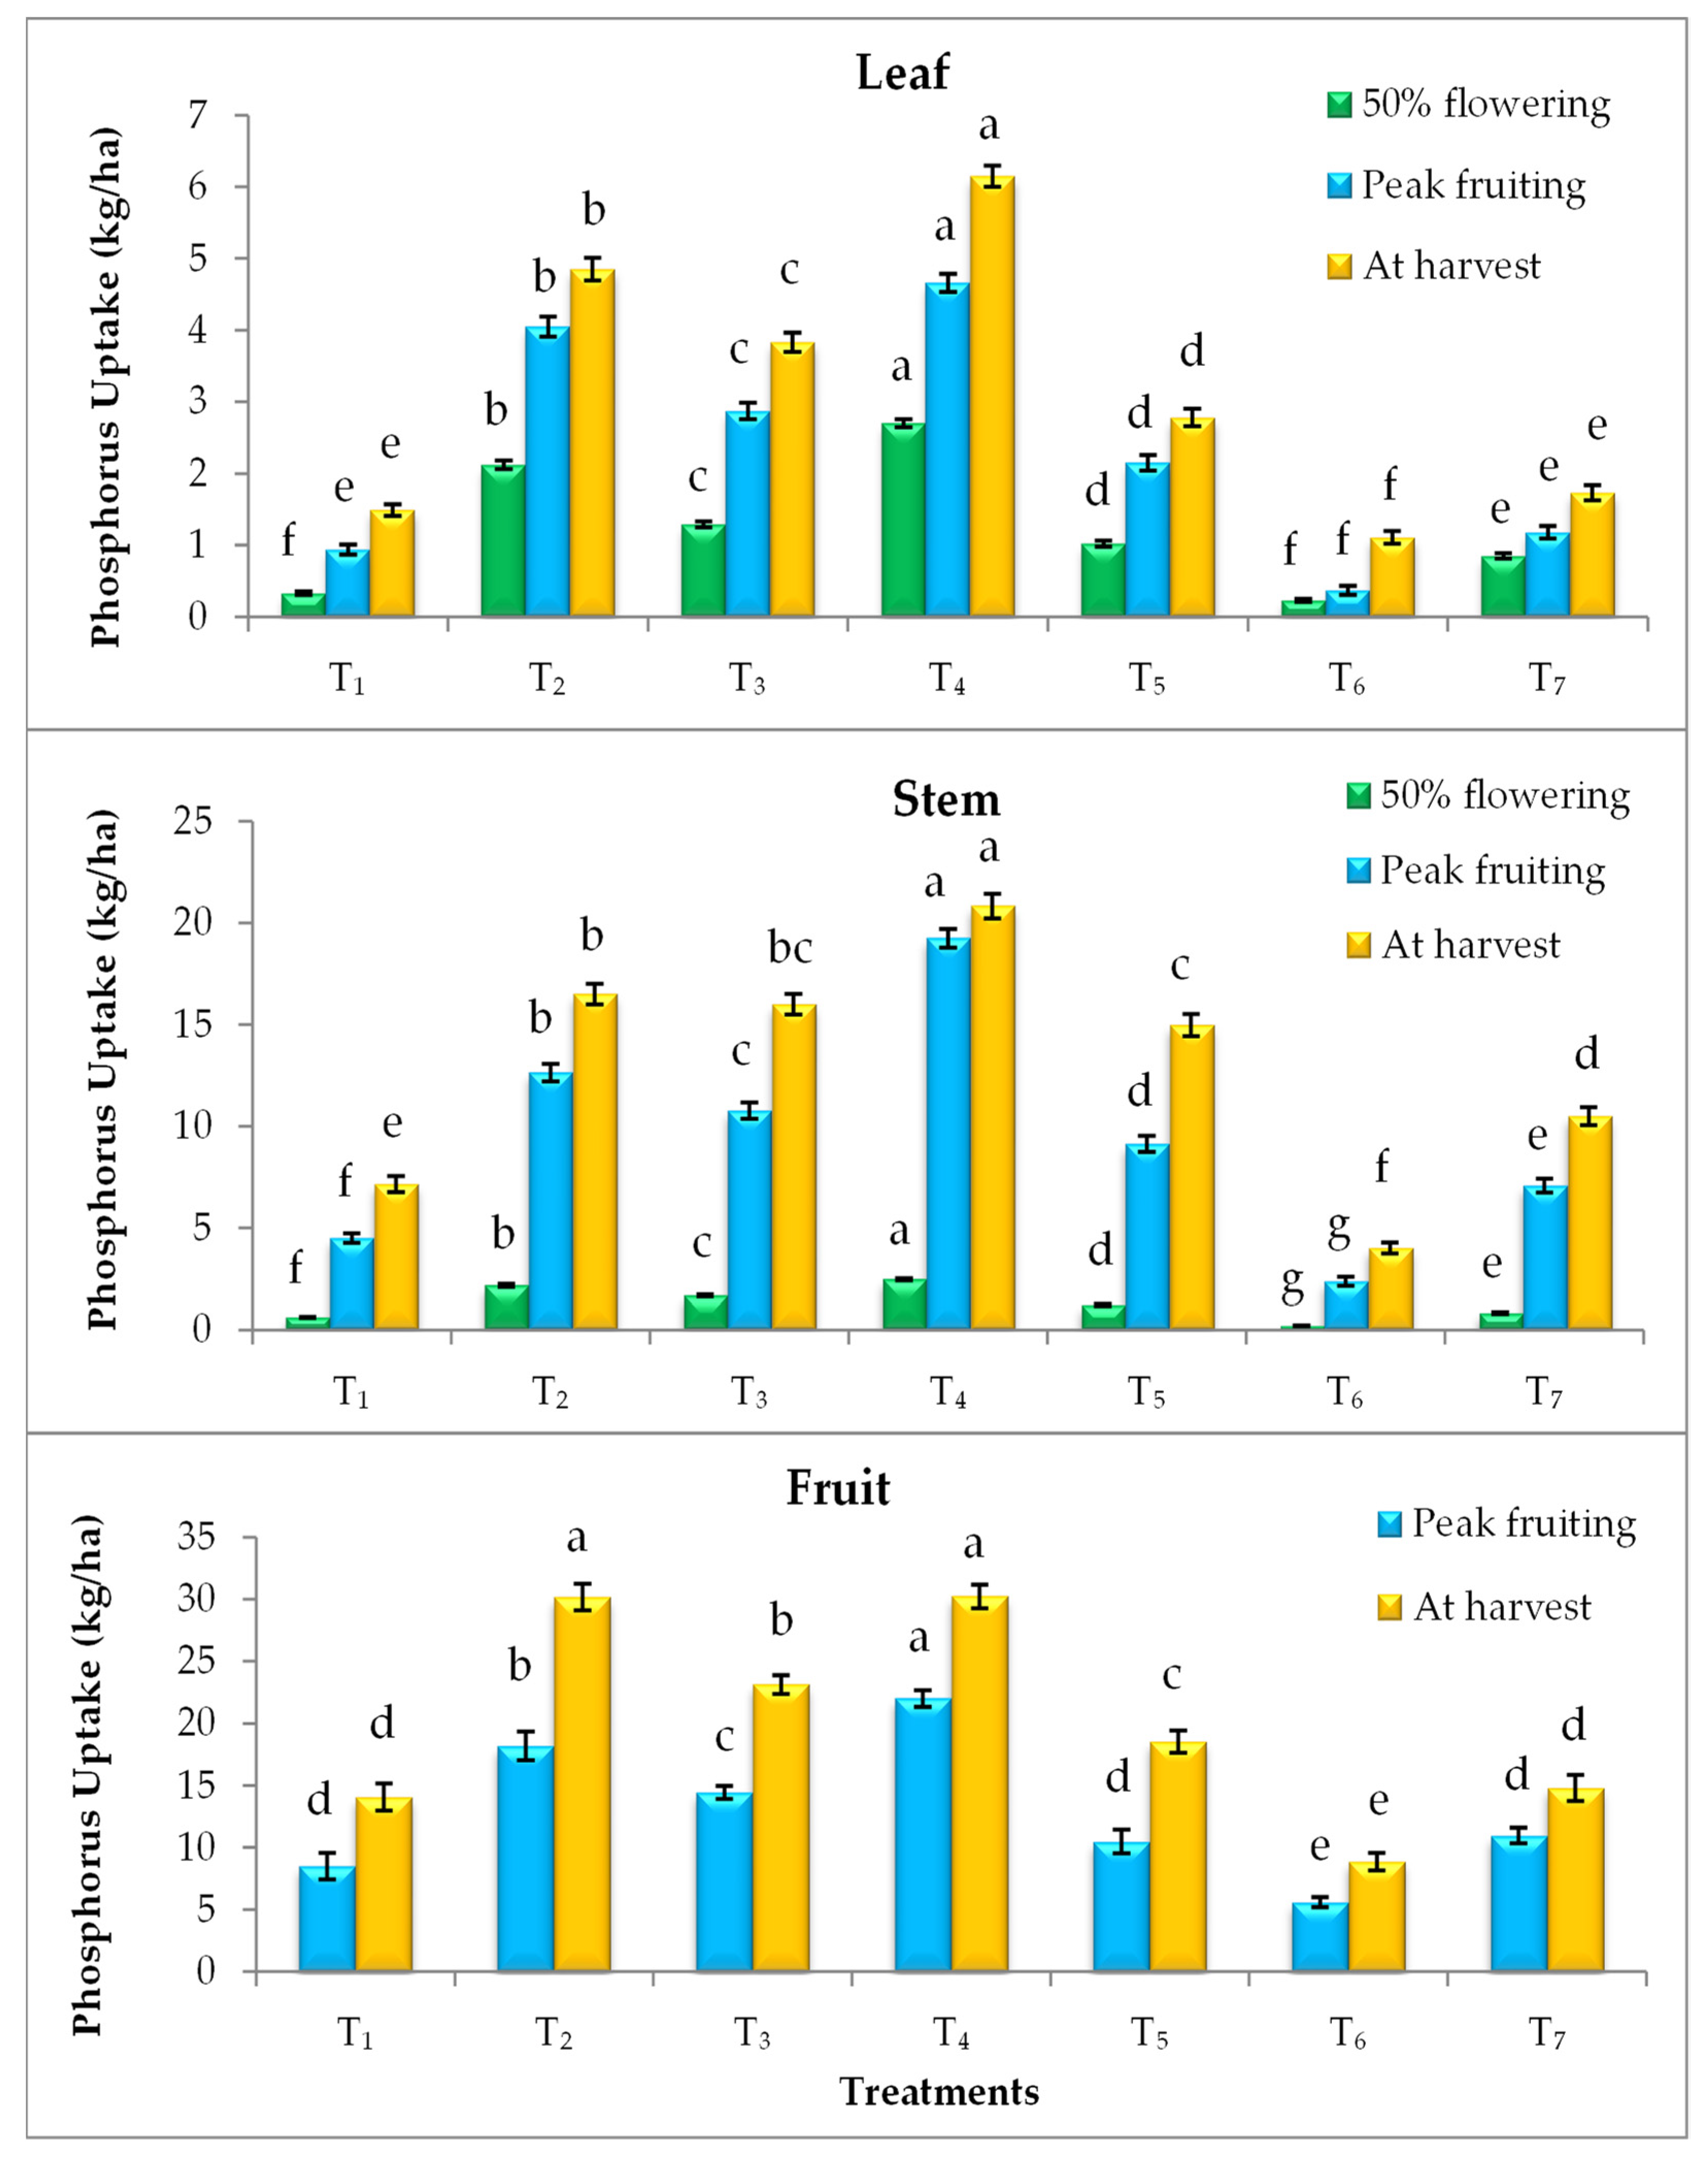
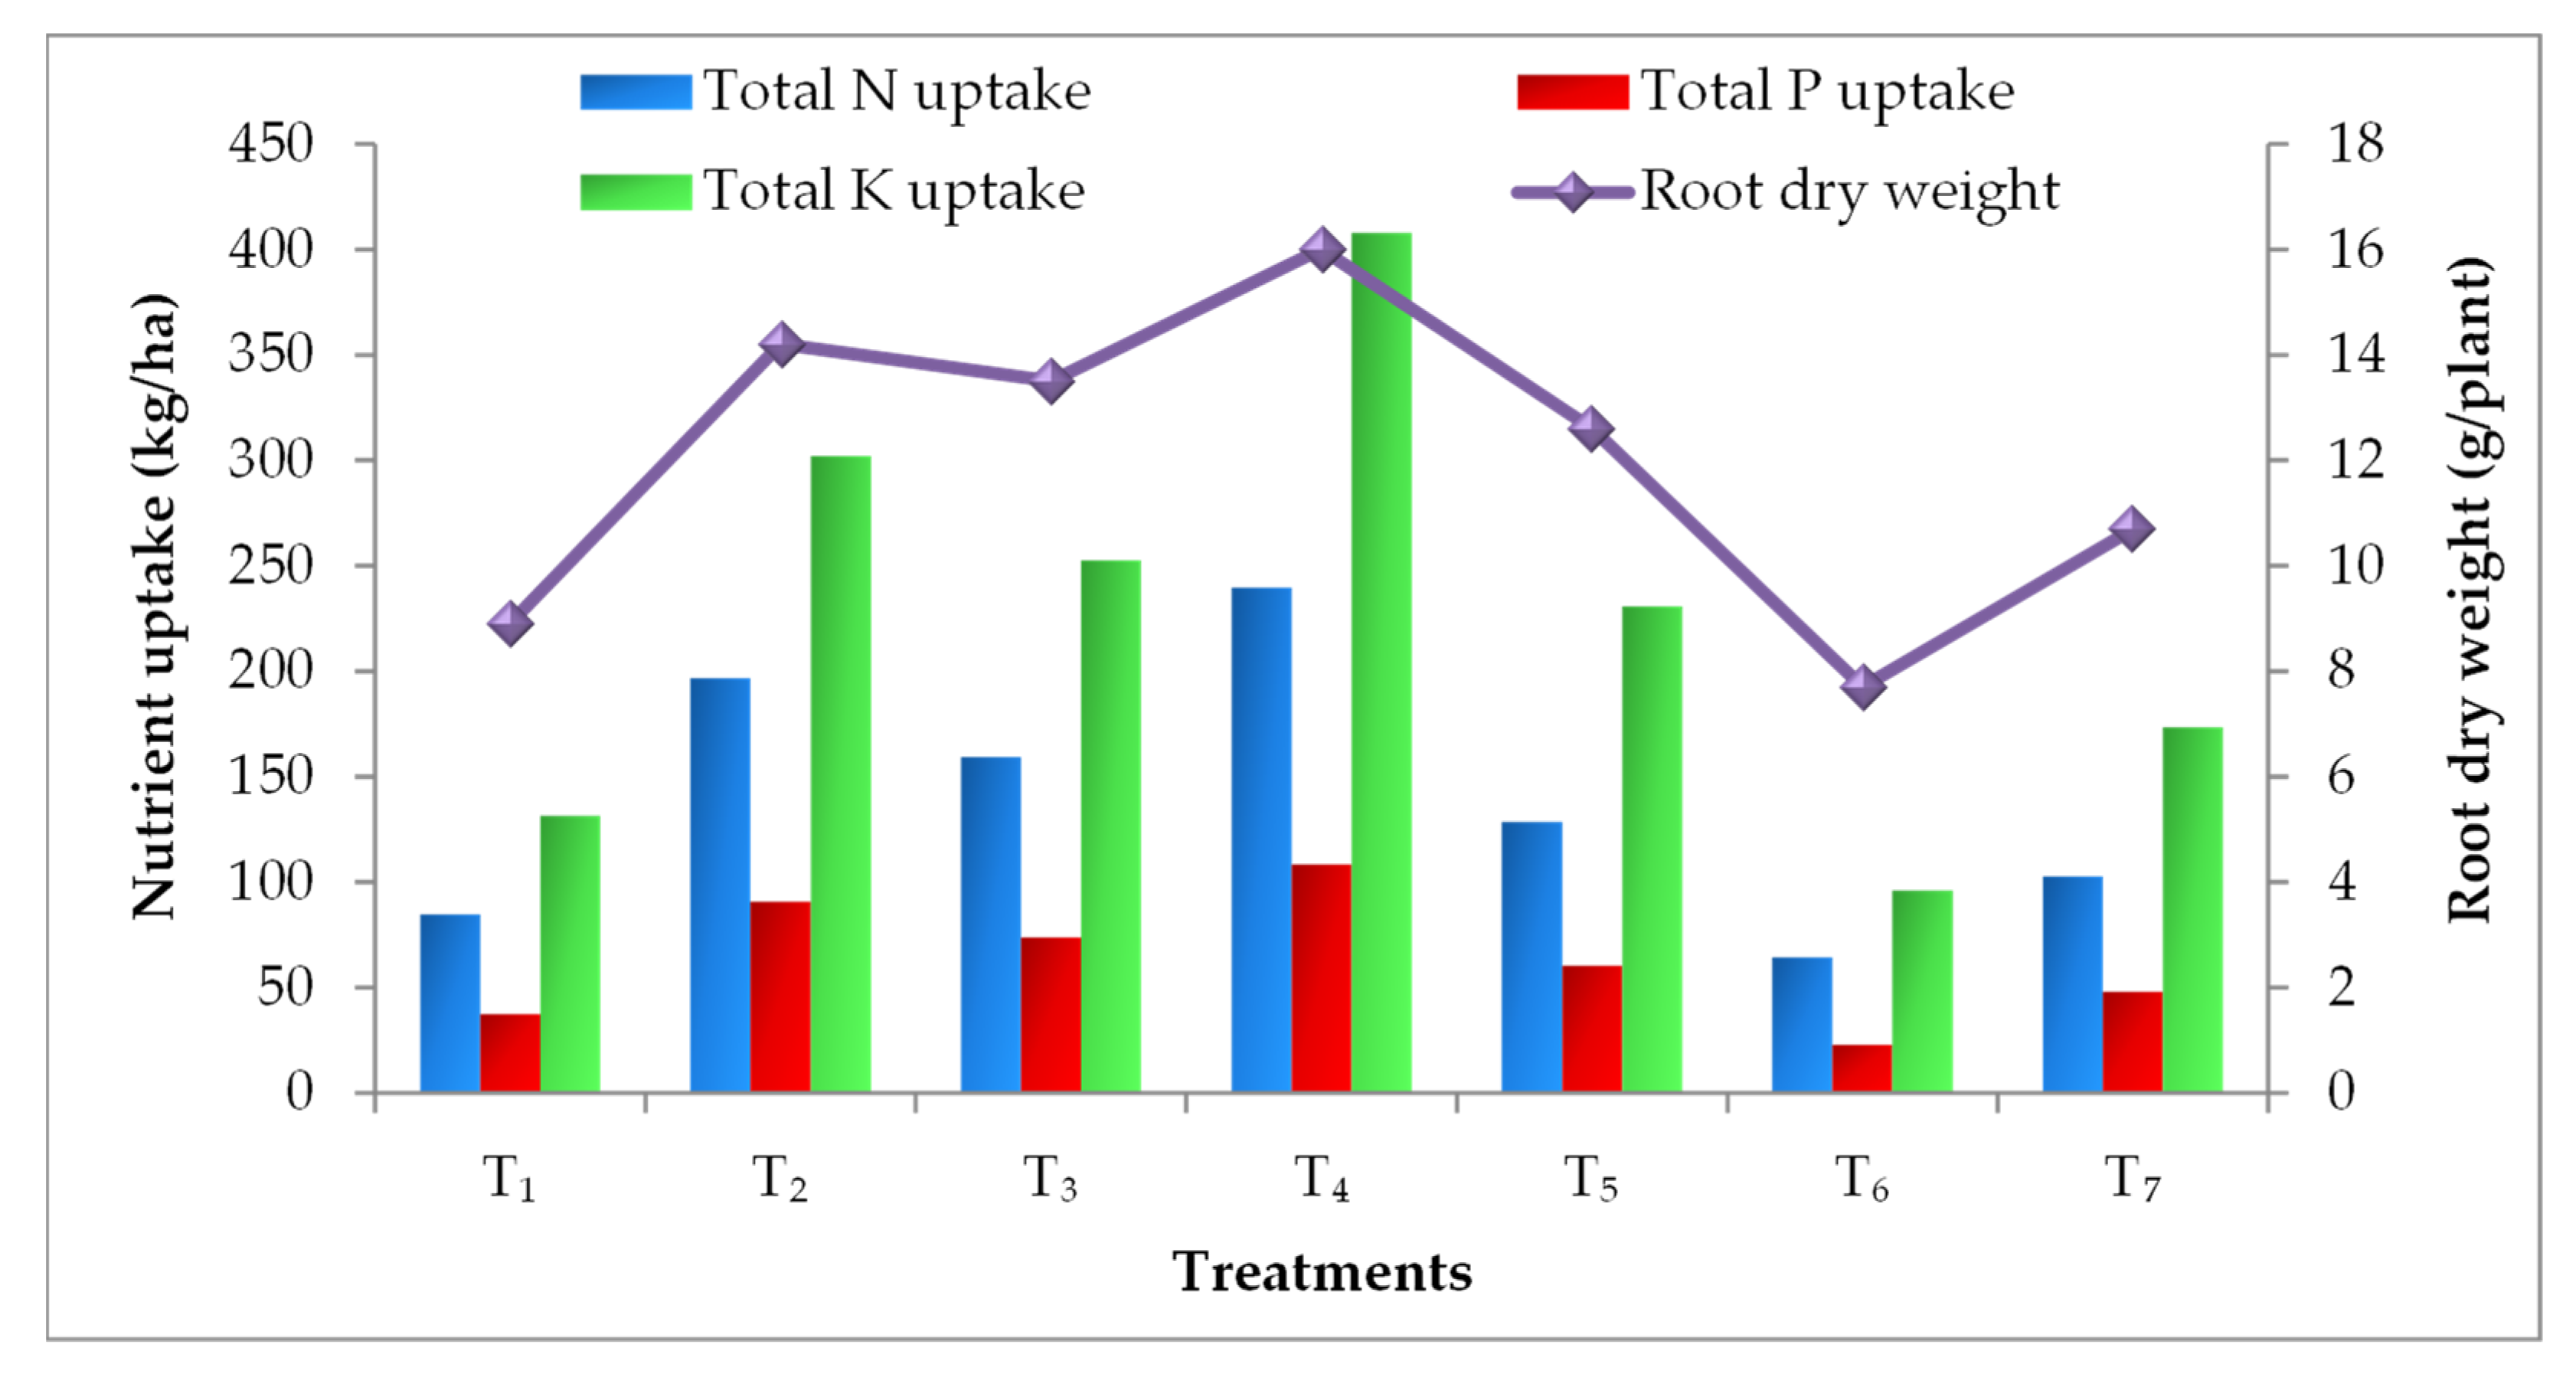
3.4. Effect on Nutrient Uptake

Elevated CO2 and temperature alone and their combinations have statistically influenced the nutrient uptake by the tomato plant parts (leaf, stem and fruit) at different growth stages. Irrespective of plant parts and growth stages, EC700 have shown statistically higher nitrogen (N), phosphorus (P) and potassium (K) uptake followed by EC550 (Figure 1, Figure 2 and Figure 3). The magnitude of increase in nutrient uptake under EC700 was 261%, 173%, 246% in leaf and 99%, 102%, 77% in stem, respectively at 50% flowering, peak fruiting and at harvest stages of the crop than open field crop. Similarly, the increase was 122% and 78% in fruit at peak fruiting and harvest stages, respectively. Similar to the N, higher P and K uptake was noticed in plants grown under EC700 followed by EC550 than open field conditions. Irrespective of the growth stages, higher P uptake by 2.60, 1.32, 1.03 folds and K uptake by 2.37, 1.29, 1.26 folds was observed under EC700 in leaf, stem and fruit of tomato plants, respectively. However, plants grown under elevated temperature of +2 °C and at ambient conditions of CO2 and temperature have shown lower NPK uptake over the open field grown plants. On the other hand, combined effect of elevated temperature and CO2 levels resulted in improved nutrient uptake with maximum uptake at EC550 + 2 °C by 1.82, 2.81 and 1.51 folds followed by EC700 + 2 °C (1.40, 2.05 and 1.02 folds) than temperature alone. Among the stages, at harvest higher uptake of nutrients was observed in all the treatments. Total nutrient uptake was also noticed higher under EC700 and which was 134%, 126% and 135% higher than NPK uptake by the plants grown under ambient conditions (Figure 4).

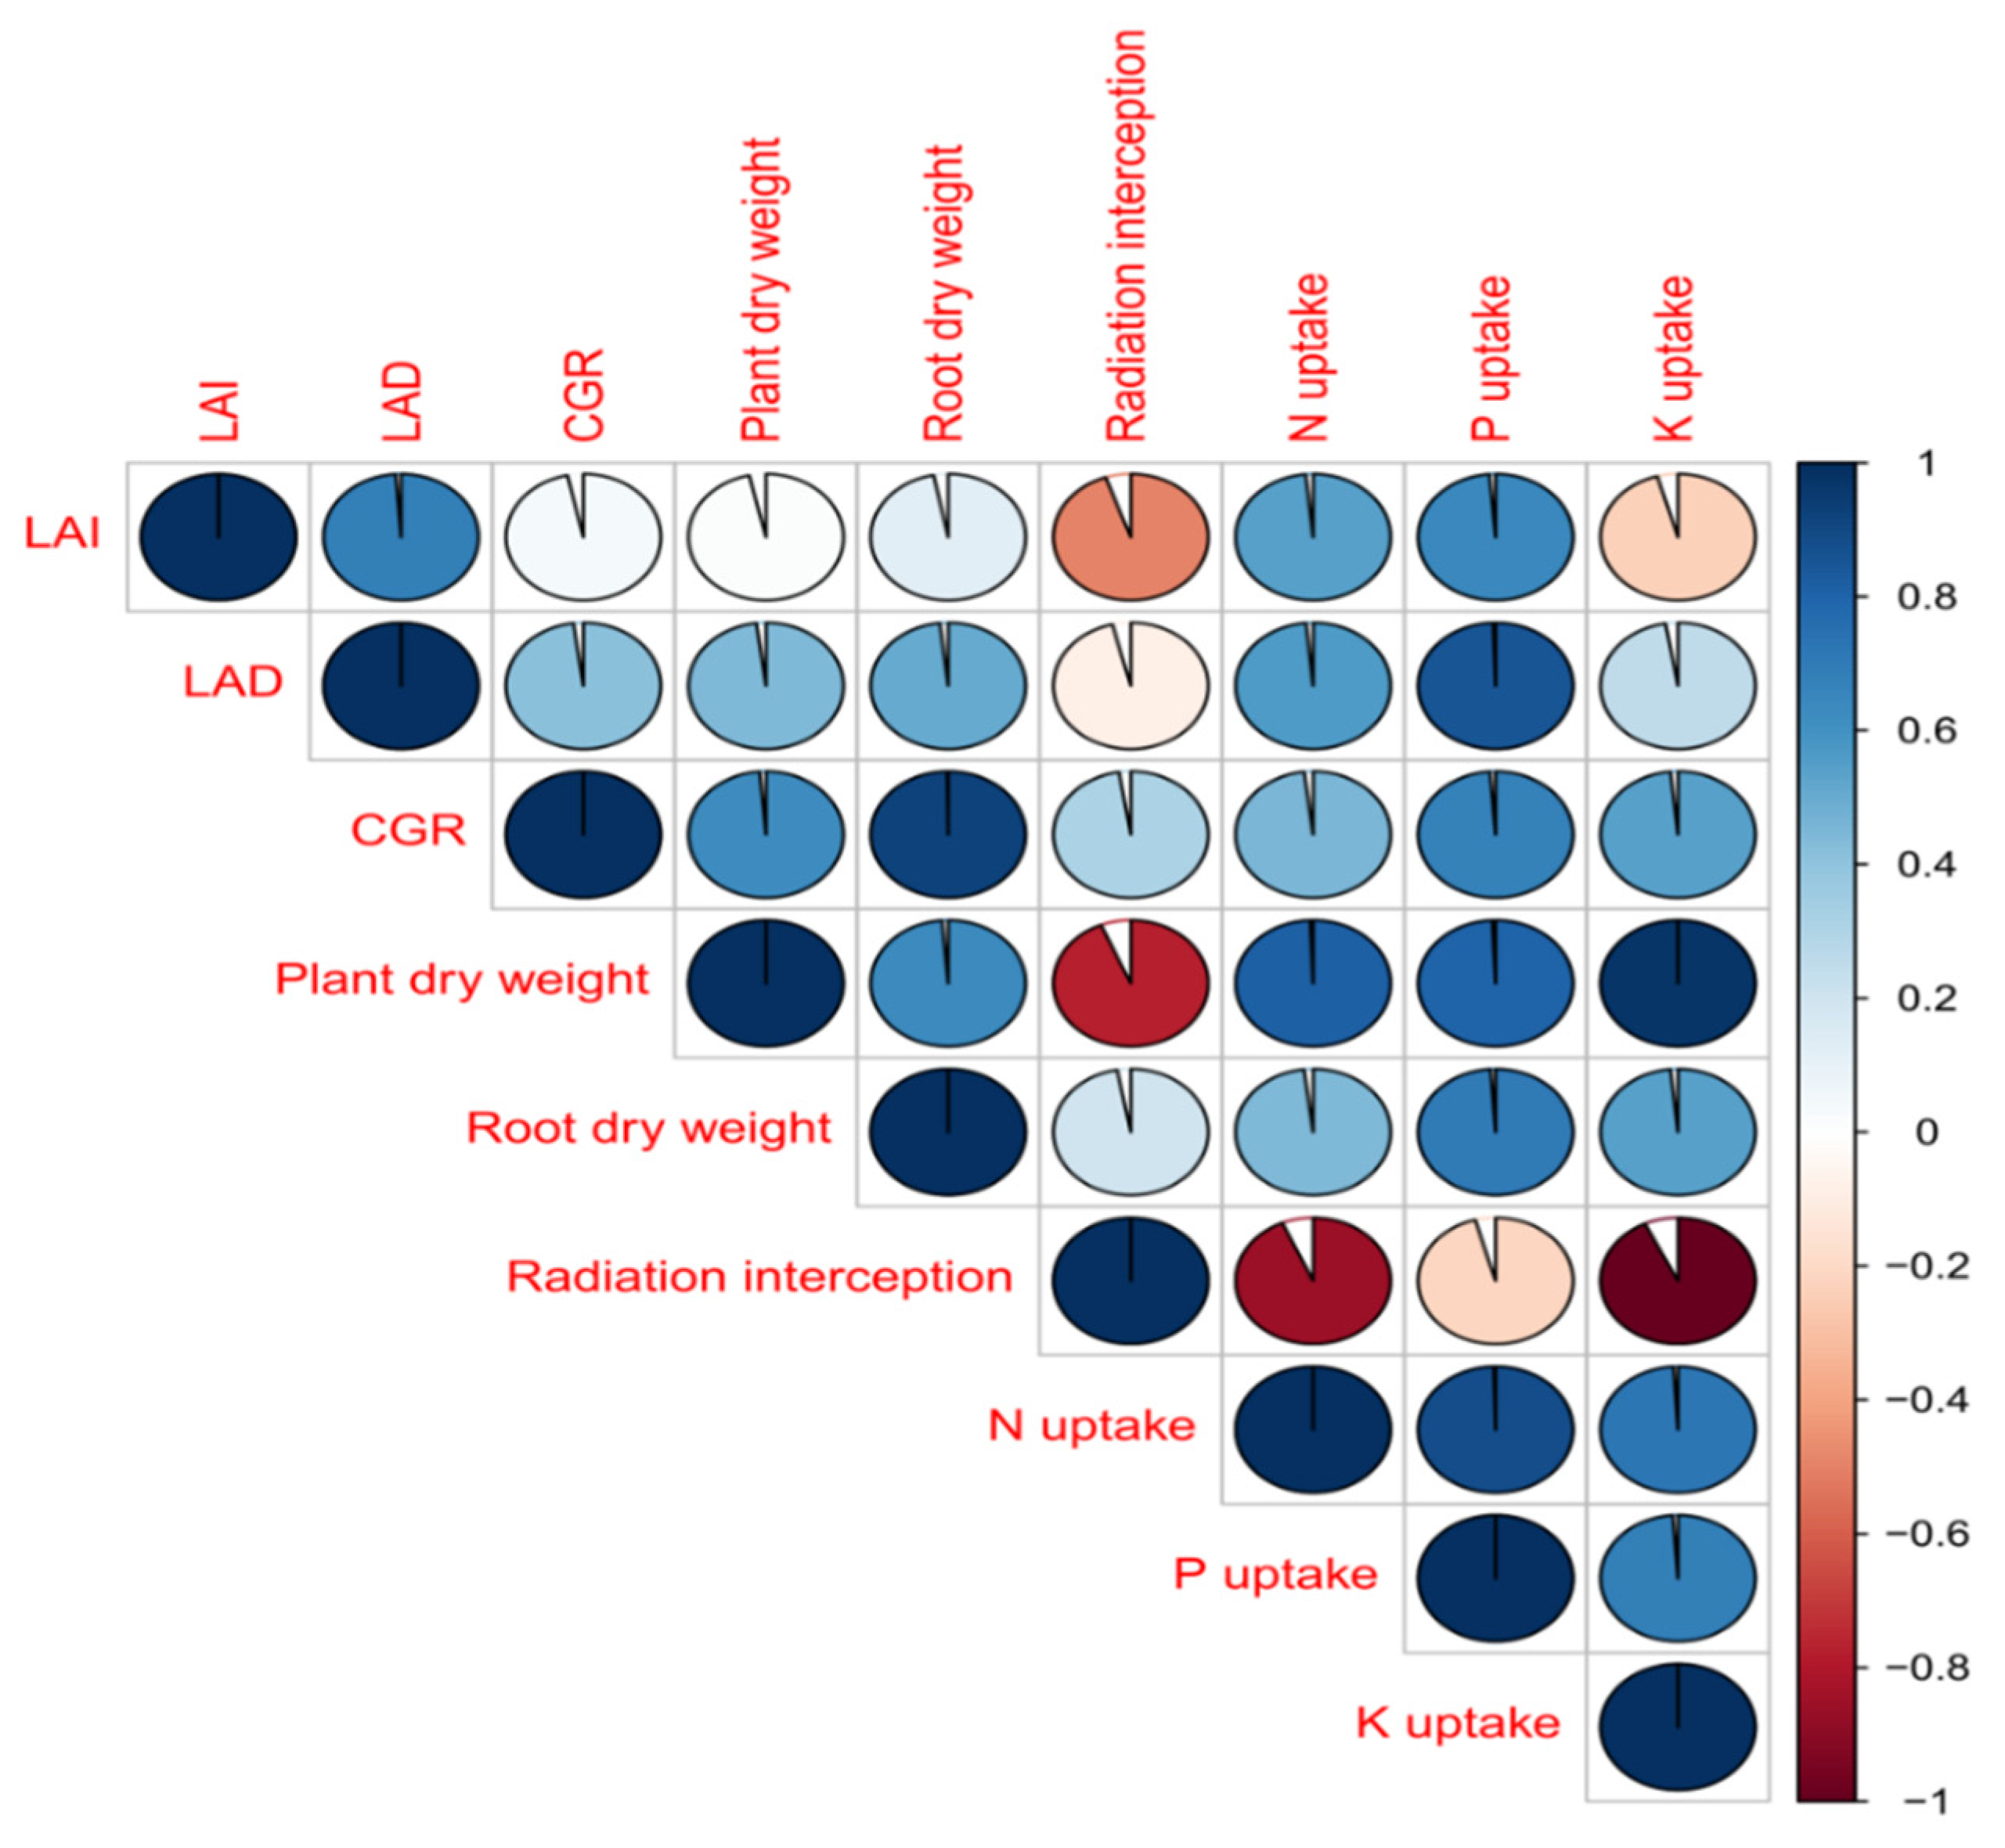
3.5. Correlation Studies

The relationship between growth indicating parameters, radiation interception and nutrient uptake by tomato plants under elevated CO2 and temperature levels alone and in combination was interpreted through correlation studies (Figure 5). Correlation values revealed strong positive relationship between all the parameters. The higher root biomass favored higher nutrient availability and thereby nutrient uptake under elevated CO2 conditions. Further, higher uptake has resulted in increased dry matter accumulation and growth indicating parameters. These above-mentioned statements were strongly evident by the higher correlation values (>0.93) in our current study.

4. Discussion

The insights of elevated CO2 and temperature impact on crop growth, development and nutrient uptake at individual level and in their combination is presented in this study in tomato. The EC700 and EC550 have enhanced all growth indicating parameters (leaf area, LAI, LAD, CGR) than ambient conditions under both open field and OTCs. Broader leaves resulted from increased photosynthetic rate, cell division, cell differentiation and leaf number lead to increased leaf area under elevated CO2 condition. Elevated CO2 levels increase net photosynthesis by boosting substrate availability for Rubisco’s activity while reducing photorespiration [39] and habitually display improved leaf traits (leaf area, leaf number and leaf thickness) [40]. Supplementary light (200 ± 20 µmol/m2/s) and enriched CO2 (800 µmol/mol) increased the leaf area of tomato by 21.2% at 110 DAT [8]. Elevated CO2 (900 ± 5 ppm) favored to achieve higher biomass production through higher leaf area in tomato than ambient CO2 of 450 ppm [41]. A significant association between intercepted photosynthetically active radiation and biomass accumulation in wheat was also earlier noticed [42]. Contrastingly, higher leaf area of about 44.4% was observed [7] at EC550 than at EC700 in tomato but, it was 64.4% higher than ambient CO2 of 380 ppm. Similar to our results, elevated CO2 levels of 550 µmol/mol, 720 µmol/mol and 900 µmol/mol have resulted in increased leaf area by 50% in maize [43], 30% in sugarcane [44] and 25% in sorghum [45], respectively. The higher LAI at both CO2 concentrations compared to ambient CO2 is because of the positive relationship between LAI and leaf area. Improved LAI at tasseling (17.5%) and silking stage (14.8%) at elevated CO2 (550 ± 20 ppm) and decreased LAI by 5.4 to 13.2% at elevated temperature (+1.5 to 3.0 °C) was noticed in maize [15]. Irrespective of the cultivars, increased LAI of about 23% at both vegetative and flowering stages of wheat at elevated CO2 (550 ppm) was revealed by Yadav et al. [46]. In safflower, elevated CO2 of 1000 μmol/mol maximized the LAI by 28% at anthesis stage over ambient CO2 of 400 μmol/mol [47]. The current results also corroborate the findings of Bray and Reid [48]; Nasser et al. [49].
Higher LAD at higher levels of CO2 has been noticed at all growth stages of the study. Irrespective of growth stages 21–75% higher LAD was observed under EC700. The higher leaf area of the plants resulted in higher LAD when they grow under elevated CO2 [50]. At initial pod filling to full seed stage in soybean, increased LAD by 4.3 fold at the upper nodes and 2.4 fold on branches under elevated CO2 (580 ppm) was revealed by Jin et al. [51]. Similarly, higher LAD of castor at EC700 and EC550 was earlier noticed by Vanaja et al. [52]. The improved leaf area and LAD have accelerated the photosynthesis under elevated CO2 levels and showed a significant increase in CGR of tomato crop. Increased dry matter accumulation of about > 27% due to higher photosynthetic rate of 20–28% was reported under elevated CO2 (~750 μmol/mol) condition by Usuda [53]. Aein et al. [54] and Sujatha [55] also reported a significant increase in CGR under elevated CO2 in potato and rice, respectively. A linear association has been reported between biomass, LAI, LAD, and intercepted photosynthetically active radiation (IPAR) in different cereal, oilseed and pulse crops [56,57,58]. In contrast to elevated CO2 levels, lower growth parameters (leaf area, LAI) have lowered the LAD and CGR under elevated temperature alone (+2 °C). At higher temperatures, because of reduced solubility of CO2 and reduced specificity of Rubisco enzyme, the photorespiratory loss of CO2 will be more, and have lower affinity for photosynthetic carbon fixation. In addition, reduced electron transport rate at elevated temperature further restricts photosynthesis and reduces crop growth [59,60]. However, elevated CO2 levels reduce photorespiratory loss because of carbon fixation through photosynthetic carbon reduction cycle and thereby results in increased photosynthetic rate [61]. However, elevated carbon masked the higher temperature effects and showed increased growth parameters under their combination in our study. Even though we have not studied the photosystem-II (PS-II) efficiency, improved PS-II thermostability leading to higher crop growth at both elevated CO2 and temperature was evident from the other studies [62]. CO2 enrichment increased leaf photosynthetic rate by 66%, 43% and 39% at temperature regimes of 28/18, 34/24 and 40/30°C, respectively [63]. Similarly, enhanced photosynthetic rate due to elevated CO2 levels at higher temperatures was also earlier reported in groundnut [64,65].
The combined effect of elevated CO2 levels and temperature have altered the different phenophases of the tomato and showed earliness in branch initiation, flower initiation, fruit formation and fruit maturation than ambient levels under open field conditions and under OTCs. Enhanced crop growth and development determining parameters like plant height, leaf area, dry matter, LAI, LAD, CGR, and net photosynthetic rate indirectly influence the earliness of different phenophases at elevated CO2 through canopy temperature modification [66]. Temperature and CO2 levels are important determines of plant growth and duration of various developmental stages [67,68]. Higher canopy temperature at elevated CO2 conditions may indirectly lead to early phenological stages in the crops [14]. Furthermore, altered source to sink relationship due to imbalance translocation of photosynthates was the key factor for earliness in the crop maturity at elevated CO2 and temperature [69,70]. Elevated CO2 of 500 μmol/mol and temperature of 1.5–2.0 °C shortened pre-heading stage by 12 days in wheat [13]. Advanced maturity of wheat by 10–13 days was reported [17,71] by increasing daily mean canopy temperature (1.5–2.0 °C). In rice, increasing daily mean temperature by 1.1–2.0 °C has reduced pre-heading stage by 3.3 days [72]. Irrespective of mungbean genotypes, earliness in first flowering by 3.8 days and first pod maturity by 5.19 days was noticed at elevated CO2 (570 ± 20 ppm) under OTCs [16]. Maize grown under ambient CO2 and elevated temperature (+3.0 °C) have shortened the 50% tasseling by 5.3 days followed by elevated temperature (+3 °C) and CO2 (550 ± 20 ppm) by 4.2 days compared to the ambient situation [15].
Higher growth and biomass accumulation under elevated CO2 levels led to higher nutrient uptake than ambient conditions. Irrespective of the plant parts (leaf, stem and fruit) and growth stages (50% flowering, peak fruiting and at harvest) enhanced NPK uptake was observed at EC700 followed by EC550. About 134%, 126% and 135% higher total NPK uptake was observed under EC700 over ambient conditions. Increased root biomass and nutrient demand by accumulated biomass are critical factors for increased nutrient uptake under elevated CO2 conditions [73]. Higher root biomass due to higher allocation of photosynthates and carbon to the roots under higher atmospheric CO2 was earlier reported by Pendall et al. [74]. We also observed increased root dry weight by 50% under EC700 and 33% under EC550 compared to plants grown under open field conditions. However, decreased root weight by 28% and 17% was also noticed under elevated temperature (+2 °C) and ambient conditions of CO2 and temperature at OTC over the open condition. Increased root weight by 36–48% and nitrogen uptake by 17% in dry seasons under elevated CO2 (≈490 μmol/L) in rice was reported by Satapathy et al. [75]. The strong positive relationship between root biomass and N uptake (0.97) and between N uptake and total dry matter accumulation (0.96) was also reported earlier by Kim et al. [76] and Carvalho et al. [77]. Increased N uptake in both straw and grain of rice due to increased grain and straw yield under elevated CO2 (550 ± 20 ppm) was noticed by Raj et al. [23]. Increased N uptake by wheat and rice up to the milking stage and maturity stage, respectively was also reported by Cai et al. [13] at elevated CO2 of 500 μmol/mol. They also observed reduced N uptake at elevated temperature (1.5–2.0 °C) alone. However, in our study we have observed increased NPK uptake up to the harvesting stage of the crop. The rate of N supply will play a prime role in N uptake by the crop in the form of higher dry-matter accumulation. The evident association between N application rate and CO2 treatment towards N uptake by the crop was earlier revealed and reported that increase in N uptake by 2% with low N (4 g N/m2) and 20% with high N (12 g N/m2) under free-air CO2 enrichment in rice [76].
With respect to P, the external supply of P through fertilizers and the native soil P pool are the key determinants of P-use efficiency, but this varies by species [24]. With enhanced plant growth under elevated CO2, the external P demand is likely to rise. Increased CO2 levels are likely to influence the crop’s ability to obtain P from soil profiles by altering root architecture and morphology. Altering the composition and quantity of root exudates can also affect rhizosphere properties and helps in P acquisition [78]. According to a meta-analysis, elevated CO2 increased the total rhizodeposits by 38% and total root biomass by 29% in various crops [79]. Similarly, higher efflux rates of total soluble sugars (47%), citrate compounds (16%) and carboxylates (111%) under elevated CO2 were also reported by Dong et al. [80]. All these compounds will play a prime role in enhancing the microbial population in the rhizosphere soil, which are responsible for better nutrient availability in the soil. Under elevated CO2, an increase in active Pseudomonas bacteria population in the rhizosphere capable of solubilizing sparingly soluble inorganic P compounds was observed [81,82]. Positive correlation between improved P uptake by shoot and root biomass was observed by Yang et al. [83]. In rice, higher P uptake under elevated CO2 (550 μmol/mol) in shoot (29%), root (28%) and grain (22%) due to higher root and shoot biomass than control chamber was reported by Bhattacharyya et al. [27] and revealed that enhanced soil P solubilization in the rhizosphere soil due to improved phosphatase enzyme activity have favored the more uptake of P under elevated CO2. Similar to N and P, a significant increase in the K uptake at elevated CO2 of 700 μmol/mol in rice was evident by Seneweera [28]. At elevated CO2, altered stomatal conductance and transpiration rates might have had a significant influence on mass flow of water to the root surface, as well as ion transport and thereby nutrient uptake. In relation to our results, a high correlation between shoot biomass, root biomass, LAI, nitrogen uptake and radiation interception was evident by Roy et al. [84] and Weerakoon et al. [10].

5. Conclusions

The elevated CO2 levels and temperature have influenced the growth and nutrient uptake by the tomato plants similar to the other C3 crops at different growth stages in the current study. The growth indicators were found statistically higher under EC700 followed by EC550 than plants under ambient conditions in the open field. However, crop under elevated temperature (+2 °C) alone and ambient conditions under OTC have showed lower growth than open field plants at all stages. Interestingly, elevated temperature in combination with elevated CO2 have showed higher growth parameters than elevated temperature alone. Among the different stages, maximum growth was noticed during peak fruiting stage. The combination of elevated CO2 (700 ppm) and temperature (+2 °C) have showed earliness in different phenophases such as branch initiation, flower initiation, fruit initiation and fruit maturation, and thereby reduced the crop cycle. Broader and thicker leaves under EC700 and EC550 showed higher cumulative radiation interception and favored for rapid growth of the plants. The increased drymatter accumulation and root foraging area under elevated CO2 levels (700 and 550 ppm) have resulted in higher NPK uptake by the leaf, stem and fruit of the tomato plants. Thus, to maximize fruit yield under elevated CO2, adequate NPK must be supplied during the crop growing season to sustain the increase in dry matter production. Moreover, adequate quantities of NPK availability must be coordinated with the crop’s growth stages to optimize yield. However, detailed studies on physiological changes under elevated CO2 and temperature is further needed for better understanding of their interactive effect.

Author Contributions

Conceptualization, supervision, methodology, formal analysis writing—original draft preparation, writing—review and editing, T.C.R., S.S. (Shankarappa Sridhara), K.F.A., H.O.E., T.K.Z.E.-A. and S.S. (Shadi Shokralla); data curation, project administration, investigation, K.N.M., P.G. and N.R. All authors have read and agreed to the published version of the manuscript.

Funding

King Saud University, RSP-2021/118.

Data Availability Statement

The data presented in this study are available on request from the corresponding author.

Acknowledgments

The authors extend their appreciation to Researchers Supporting Project number (RSP-2021/118), King Saud University, Riyadh, Saudi Arabia. We are thankful to the University of Agricultural and Horticultural Sciences, Shivamogga, Karnataka for providing required financial assistance and technical support for conducting field experiments and lab analysis.

Conflicts of Interest

The authors declare no conflict of interest.

References

  1. IPCC Climate Change. Synthesis Report: Contribution of working groups I. II and III to the Fifth Assessment Report. In Proceedings of the Intergovernmental Panel on Climate Change, Copenhagen, Denmark, 1 November 2014; pp. 1–167. [Google Scholar]
  2. IPCC Climate Change. The Physical Science Basis. In Contribution of Working Group I to the Fourth Assessment Report of the Intergovernmental Panel on Climate Change; Cambridge University Press: Cambridge, UK, 2007. [Google Scholar]
  3. Reddy, A.R.; Rasineni, G.K.; Raghavendra, A.S. The impact of global elevated CO2 concentration on photosynthesis and plant productivity. Curr. Sci. 2010, 99, 46–57. [Google Scholar]
  4. Van der Kooi, C.J.; Reich, M.; Low, M.; De Kok, L.J.; Tausz, M. Growth and yield stimulation under elevated CO2 and drought: A meta-analysis on crops. Environ. Exp. Biol. 2016, 122, 150–157. [Google Scholar] [CrossRef]
  5. Taub, D. Effects of rising atmospheric concentrations of carbon dioxide on plants. Nat. Educ. Knowl. 2010, 3, 21. [Google Scholar]
  6. Ainsworth, E.A.; Rogers, A. The response of photosynthesis and stomatal conductance to rising (CO2): Mechanisms and environmental interactions. Plant. Cell Environ. 2007, 30, 258–270. [Google Scholar] [CrossRef]
  7. Mamatha, H.; Srinivasa Rao, N.K.; Laxman, R.H.; Shivashankara, K.S.; Bhatt, R.M.; Pavithra, K.C. Impact of elevated CO2 on growth, physiology, yield, and quality of tomato (Lycopersicon esculentum Mill) cv. Arka Ashish. Photosynthetica 2014, 52, 519–528. [Google Scholar] [CrossRef]
  8. Pan, T.; Ding, J.; Qin, G.; Wang, Y.; Xi, L.; Yang, J.; Li, J.; Zhang, J.; Zou, Z. Interaction of supplementary light and CO2 enrichment improves growth, photosynthesis, yield, and quality of tomato in autumn through spring greenhouse production. HortScience 2019, 54, 246–252. [Google Scholar] [CrossRef] [Green Version]
  9. Soltani, A.; Gholipoor, M.; Ghassemi-Golezani, K. Analysis of temperature and atmospheric CO2 effects on radiation use efficiency in chickpea (Cicer arietinum L.). J. Plant. Sci. 2007, 2, 89–95. [Google Scholar] [CrossRef]
  10. Weerakoon, W.M.W.; Ingram, K.T.; Moss, D.N. Atmospheric carbon dioxide and fertilizer nitrogen effects on radiation interception by rice. Plant. Soil 2020, 2000, 99–106. Available online: https://www.jstor.org/stable/42950704 (accessed on 9 October 2021).
  11. Hangs, R.D.; Van Rees, K.C.J.; Schoenau, J.J.; Guo, X. A simple technique for estimating above-ground biomass in short-rotation willow plantations. Biomass Bioenergy 2011, 35, 2156–2162. [Google Scholar] [CrossRef]
  12. Hikosaka, K. Leaf canopy as a dynamic system: Ecophysiology and optimality in leaf turnover. Ann. Bot. 2005, 95, 521–533. [Google Scholar] [CrossRef] [PubMed] [Green Version]
  13. Cai, C.; Yin, X.; He, S.; Jiang, W.; Si, C.; Struik, P.C.; Luo, W.I.; Li, G.; Xie, Y.; Xiong, Y.; et al. Responses of wheat and rice to factorial combinations of ambient and elevated CO2 and temperature in FACE experiments. Glob. Chang. Biol. 2016, 22, 856–874. [Google Scholar] [CrossRef]
  14. Craufurd, P.Q.; Wheeler, T.R. Climate change and the flowering time of annual crops. J. Exp. Bot. 2009, 60, 2529–2539. [Google Scholar] [CrossRef] [Green Version]
  15. Abebe, A.; Pathak, H.; Singh, S.D.; Bhatia, A.; Harit, R.C.; Kumar, V. Growth, yield and quality of maize with elevated atmospheric carbon dioxide and temperature in north–west India. Agric. Ecosyst. Environ. 2016, 218, 66–72. [Google Scholar] [CrossRef]
  16. Haque, M.S.; Karimi, M.A.; Haque, M.M.; Hamid, A.; Nawata, E. Effect of elevated CO2 concentration on growth, chlorophyll content and yield of mungbean (Vigna radiata L. Wilczek) genotypes. Jpn. J. Trop. Agr. 2005, 49, 189–196. [Google Scholar]
  17. Tian, Y.; Zheng, C.; Chen, J. Climate warming increases winter wheat yield but reduces grain nitrogen concentration in east China. PLoS ONE 2014, 9, e95108. [Google Scholar] [CrossRef] [Green Version]
  18. Cai, C.; Li, G.; Yang, H.; Yang, J.; Liu, H.; Struik, P.C.; Luo, W.; Yin, X.; Di, L.; Guo, X.; et al. Do all leaf photosynthesis parameters of rice acclimate to elevated CO2, elevated temperature, and their combination, in FACE environments? Glob. Chang. Biol. 2018, 24, 1685–1707. [Google Scholar] [CrossRef] [PubMed] [Green Version]
  19. Johkan, M.; Oda, M.; Maruo, T.; Shinohara, Y. Crop Production and Global Warming Impacts, Case Studies on the Economy, Human Health, and on Urban and Natural Environments. 2011. Available online: http://www.intechopen.com (accessed on 9 October 2021).
  20. Dusenge, M.E.; Duarte, A.G.; Danielle, A. Way Plant carbon metabolism and climate change: Elevated CO2 and temperature impacts on photosynthesis, photorespiration and respiration. New Phytol. 2019, 221, 32–49. [Google Scholar] [CrossRef] [PubMed] [Green Version]
  21. Leakey, A.D.B.; Ainsworth, E.A.; Bernacchi, C.J.; Rogers, A.; Long, S.P.; Ort, D.R. Elevated CO2 effects on plant carbon, nitrogen, and water relations: Six important lessons from FACE. J. Exp. Bot. 2009, 60, 2859–2876. [Google Scholar] [CrossRef] [PubMed]
  22. Zhu, P.; Zhuang, Q.; Ciais, P.; Welp, L.; Li, W.; Xin, Q. Elevated atmospheric CO2 negatively impacts photosynthesis through radiative forcing and physiology-mediated climate feedback. Geophysic. Res. Lett. 2017, 44, 1956–1963. [Google Scholar] [CrossRef] [Green Version]
  23. Raj, M.; Chakrabarti, B.; Pathak, H.; Singh, S.D.; Mina, M.; Purakayastha, T.J. Growth, yield and nutrient uptake in crop grown under elevated carbon dioxide and different doses of nitrogen fertilizer. Indian J. Experiment. Biol. 2019, 57, 181–187. [Google Scholar]
  24. Veneklaas, E.J.; Lambers, H.; Bragg, J.; Finnegan, P.M.; Lovelock, C.E.; Plaxton, W.C.; Price, C.A.; Scheible, W.; Shane, M.W.; White, P.J.; et al. Opportunities for improving phosphorus-use efficiency in crop plants. New Phytol. 2012, 195, 306–320. [Google Scholar] [CrossRef]
  25. Taub, D.R.; Wang, X.Z. Why are nitrogen concentrations in plant tissues lower under elevated CO2? A critical examination of the hypotheses. J. Integr. Plant. Biol. 2008, 50, 1365–1374. [Google Scholar] [CrossRef] [PubMed]
  26. Poorter, H.; Navas, M.L. Plant growth and competition at elevated CO2: On winners, losers and functional groups. New Phytol. 2003, 157, 175–198. [Google Scholar] [CrossRef] [PubMed] [Green Version]
  27. Bhattacharyya, P.; Roy, K.S.; Dash, P.K.; Neogi, S.; Shahid, M.D.; Nayak, A.K.; Raja, R.; Karthikeyan, S.; Balachandar, D.; Rao, K.S. Effect of elevated carbon dioxide and temperature on phosphorus uptake in tropical flooded rice (Oryza sativa L.). Eur. J. Agron. 2014, 53, 28–37. [Google Scholar] [CrossRef]
  28. Seneweera, S. Effects of elevated CO2 on plant growth and nutrient partitioning of rice (Oryza sativa L.) at rapid tillering and physiological maturity. J. Plant. Interac. 2011, 6, 35–42. [Google Scholar] [CrossRef] [Green Version]
  29. Moretti, C.L.; Mattos, L.M.; Calbo, A.G.; Sargent, S.A. Climate changes and potential impacts on postharvest quality of fruit and vegetable crops—A review. Food Res. Int. 2010, 43, 1824–1832. [Google Scholar] [CrossRef]
  30. Bertin, N. Analysis of the Tomato Fruit Growth Response to Temperature and Plant Fruit Load in Relation to Cell Division, Cell Expansion and DNA Endoreduplication. Ann. Bot. 2005, 95, 439–447. [Google Scholar] [CrossRef] [Green Version]
  31. Ploeg, A.V.D.; Heuvelink, E. Influence of sub-optimal temperature on tomato growth and yield: A review. J. Horticul. Sci. Biotechnol. 2005, 80, 652–659. [Google Scholar] [CrossRef]
  32. Watson, S.J. The physiological basis for variation in yield. Adv. Agron. 1952, 4, 101–145. [Google Scholar]
  33. Power, J.E.; Willis, W.C.; Igrones, D.L.; Richmon, B.A. Effect of soil temperature, phosphorus and plant age on growth analysis in barley. Agron. J. 1967, 59, 231–234. [Google Scholar] [CrossRef]
  34. Singh, P. Influence of water deficits on phenology growth and dry matter allocation in chickpea. Field Crops Res. 1991, 28, 1–15. [Google Scholar] [CrossRef] [Green Version]
  35. Charles-Edwards, D.A.; Lawn, R.J. Light interception by grain legume row crops. Plant. Cell Environ. 1984, 7, 247–251. [Google Scholar] [CrossRef]
  36. Meek, D.W.; Hatfield, J.L.; Howell, T.A.; Idso, S.B.; Reginto, R.J. A generalized relationship between photosynthetically active radiation and solar radiation. Agron. J. 1984, 76, 939–945. [Google Scholar] [CrossRef]
  37. Monteith, J.L. Light distribution and photosynthesis in field crops. Ann. Bot. 1965, 29, 18. Available online: https://www.jstor.org/stable/42908627 (accessed on 9 October 2021). [CrossRef]
  38. Jackson, M.L. Soil Chemical Analysis; Prentice Hall of India Pvt. Ltd.: New Delhi, India, 1973; p. 498. [Google Scholar]
  39. Drake, B.G.; Gonzàlez-Meler, M.A.; Long, S.P. More efficient plants: A consequence of rising atmospheric CO2? Ann. Rev. Plant. Physiol. Mol. Biol. 1997, 48, 609–639. [Google Scholar] [CrossRef] [PubMed] [Green Version]
  40. Pritchard, S.G.; Rogers, H.H.; Prior, S.A.; Peterson, C.M. Elevated CO2 and plant structure: A review. Glob. Chang. Biol. 1999, 5, 807–837. [Google Scholar] [CrossRef] [Green Version]
  41. Teawkul, P.; Chen, W.; Sripontan, Y.; Hwang, S. Elevated CO2 concentration promotes tomato plant growth but impairs Spodoptera litura performance. Res. Rev. J. Zool. Sci. 2015, 3, 35–42. [Google Scholar]
  42. Manderscheid, R.; Burkart, S.; Bramm, A.; Weigel, H. Effect of CO2 enrichment on growth and daily radiation use efficiency of wheat in relation to temperature and growth stage. Eur. J. Agron. 2003, 19, 411–425. [Google Scholar] [CrossRef]
  43. Mina, U.; Kumar, R.; Gogoi, R.; Bhatia, A.; Harit, R.C.; Singh, D.; Kumar, A.; Kumar, A. Effect of elevated temperature and carbon dioxide on maize genotypes health index. Ecol. Indic. 2019, 105, 292–302. [Google Scholar] [CrossRef]
  44. Vu, J.C.V.; Allen, L.H.; Gesch, R.W. Up-regulation of photosynthesis and sucrose metabolism enzymes in young expanding leaves of sugarcane under elevated growth CO2. Plant. Sci. 2006, 171, 123–131. [Google Scholar] [CrossRef]
  45. Khanboluki, G.; Hosseini, H.M.; Holford, P.; Zadeh, B.M.; Milham, P.J. Effect of elevated atmospheric CO2 concentration on growth and physiology of wheat and sorghum under cadmium stress. Commun. Soil Sci. Plant. Anal. 2018, 49, 2867–2882. [Google Scholar] [CrossRef]
  46. Yadav, A.; Bhatia, A.; Yadav, S.; Kumar, V.; Singh, B. The effects of elevated CO2 and elevated O3 exposure on plant growth, yield and quality of grains of two wheat cultivars grown in north India. Heliyon 2019, 5, e02317. [Google Scholar] [CrossRef] [Green Version]
  47. Mohamed, S.; Jellings, A.; Fuller, M. Positive effects of elevated CO2 and its interaction with nitrogen on safflower physiology and growth. Agron. Sustain. Develop. 2013, 33, 497–505. [Google Scholar] [CrossRef] [Green Version]
  48. Bray, S.; Reid, D.M. The effect of salinity and CO2 enrichment on the growth and anatomy of the second trifoliate leaf of Phaseolus vulgaris. Can. J. Bot. 2002, 80, 349–359. [Google Scholar] [CrossRef]
  49. Nasser, R.R.; Fuller, M.P.; Jellings, A.J. Effect of elevated CO2 and nitrogen levels on lentil growth and nodulation. Agron. Sustain. Dev. 2007, 28, 175–180. [Google Scholar] [CrossRef] [Green Version]
  50. Dubey, S.K.; Tripathi, S.K.; Pranuthi, G. Effect of elevated CO2 on wheat crop: Mechanism and impact. Crit. Rev. Environ. Sci. Technol. 2015, 45, 2283–2304. [Google Scholar] [CrossRef]
  51. Jin, J.; Li, Y.; Liu, X.; Wang, G.; Tang, C.; Yu, Z.; Wang, X.; Herbert, S.J. Elevated CO2 alters distribution of nodal leaf area and enhances nitrogen uptake contributing to yield increase of soybean cultivars grown in Mollisols. PLoS ONE 2017, 12, e0176688. [Google Scholar] [CrossRef] [Green Version]
  52. Vanaja, M.; Jyothi, M.; Ratnakumar, P.; Vagheera, P.; Raghuram Reddy, P.; Jyothi Lakshmi, N.; Yadav, S.K.; Maheshwari, M.; Venkateswarlu, B. Growth and yield responses of castor bean (Ricinus communis L.) to two enhanced CO2 levels. Plant. Soil Environ. 2008, 54, 38–46. [Google Scholar] [CrossRef] [Green Version]
  53. Usuda, H. Effects of elevated CO2 on the capacity for photosynthesis of a single leaf and a whole plant, and on growth in a Radish. Plant. Cell Physiol. 2006, 47, 262–269. [Google Scholar] [CrossRef]
  54. Aien, A.; Pal, M.; Khetarpal, S.; Pandey, S.K. Impact of elevated atmospheric CO2 concentration on the growth, and yield in two potato cultivars. J. Agri. Sci. Tech. 2014, 16, 1661–1670. Available online: http://jast.modares.ac.ir/article-23-4377-en.html (accessed on 9 October 2021).
  55. Sujatha, K.B. Characterization of the Response of Rice Cultivars (Oryza sativa L.) to the Interaction of Elevated CO2 and Temperature; Dissertation, Indian Agricultural Research Institute: New Delhi, India, 2005. [Google Scholar]
  56. Kemanian, A.R.; Stöckle, C.O.; Huggins, D.R. Variability of barley radiation-use efficiency. Crop Sci. 2004, 44, 1662–1672. [Google Scholar] [CrossRef]
  57. Liu, W.; Yan, J.; Li, J.; Sang, T. Yield potential of Miscanthus energy crops in the Loess Plateau of China. GCB Bioenergy 2012, 4, 545–554. [Google Scholar] [CrossRef]
  58. Manoj, K.N.; Umesh, M.R.; Ramesh, Y.M.; Anand, S.R.; Angadi, S. Dry matter production and radiation use efficiency of pulses grown under different light conditions. Bangladesh J. Bot. 2019, 48, 9–15. [Google Scholar] [CrossRef]
  59. Schrader, S.M.; Wise, R.R.; Wacholtz, W.F.; Ort, D.R.; Sharkey, T.D. Thylakoid membrane responses to moderately high leaf temperature in Pima cotton. Plant. Cell Environ. 2004, 27, 725–735. [Google Scholar] [CrossRef]
  60. Wise, R.R.; Olson, A.J.; Schrader, S.M.; Sharkey, T.D. Electron transport is the functional limitation of photosynthesis in field-grown Pima cotton plants at high temperature. Plant. Cell Environ. 2004, 27, 717–724. [Google Scholar] [CrossRef]
  61. Morison, J.I.L.; Lawlor, D.W. Interactions between increasing CO2 concentration and temperature on plant growth. Plant. Cell Environ. 1999, 22, 659–682. [Google Scholar] [CrossRef] [Green Version]
  62. Taub, D.R.; Seemann, J.R.; Coleman, J.S. Growth in elevated CO2 protects photosynthesis against high-temperature damage. Plant. Cell Environ. 2000, 23, 649–656. [Google Scholar] [CrossRef] [Green Version]
  63. Prasad, P.V.V.; Allen, L.H., Jr.; Boote, K.J. Crop Responses to Elevated Carbon Dioxide and Interaction with Temperature: Grain Legumes. Journal of Crop Improvement, and: Ecological Responses and Adaptations of Crops to Rising Atmospheric Carbon Dioxide (ed: Zoltán Tuba); Food Products Press, an imprint of The Haworth Press, Inc.: Binghamton, NY, USA, 2005; pp. 113–154. [Google Scholar] [CrossRef]
  64. Dwivedi, S.K.; Kumar, S.; Prakash, V.; Mondal, S.; Mishra, J.S. Influence of rising atmospheric CO2 concentrations and temperature on morpho-physiological traits and yield of rice genotypes in sub-humid climate of Eastern India. AJPS 2015, 6, 2339–2349. [Google Scholar]
  65. Prasad, P.V.V.; Boote, K.J.; Allen, L.H., Jr.; Thomas, J.M.G. Super-optimal temperatures are detrimental to peanut (Arachis hypogea L.) reproductive processes and yield at both ambient and elevated carbon dioxide. Glob. Chang. Biol. 2003, 9, 1775–1787. [Google Scholar] [CrossRef] [Green Version]
  66. Kimball, B.A.; Kobayashi, K.; Bindi, M. Responses of agricultural crops to Free-Air CO2 Enrichment. Adv. Agron. 2002, 77, 293–368. [Google Scholar]
  67. Bahuguna, R.N.; Jagadish, S.V.K. Temperature regulation of plant phenological development. Environ. Exp. Bot. 2015, 111, 83–90. [Google Scholar] [CrossRef]
  68. Sanchez, B.; Rasmussen, A.; Porter, J. Temperatures and the growth and development of maize and rice: A review. Glob. Chang. Biol. 2014, 20, 408–417. [Google Scholar] [CrossRef] [PubMed]
  69. Saha, S.; Sehgal, V.K.; Chakraborty, D.; Pal, M. Atmospheric carbon dioxide enrichment induced modifications in canopy radiation utilization, growth and yield of chickpea Cicer arietinum L. Agric. Meteorol. 2015, 202, 102–111. [Google Scholar] [CrossRef]
  70. Singh, R.N.; Mukherjee, J.; Sehgal, V.K.; Krishnan, P.; Das, D.K.; Dhakar, R.K.; Bhatia, A. Interactive effect of elevated tropospheric ozone and carbon dioxide on radiation utilisation, growth and yield of chickpea (Cicer arietinum L.). Int. J. Biometeorol. 2021, 65, 1939–1952. [Google Scholar] [CrossRef] [PubMed]
  71. Fang, S.; Su, H.; Liu, W.; Tan, K.; Ren, S. Infrared warming reduced winter wheat yields and some physiological parameters, which were mitigated by irrigation and worsened by delayed sowing. PLoS ONE 2013, 8, e67518. [Google Scholar] [CrossRef] [PubMed]
  72. Dong, W.; Chen, J.; Zhang, B.; Tian, Y.; Zhang, W. Responses of biomass growth and grain yield of midseason rice to the anticipated warming with FATI facility in East China. Field Crops Res. 2011, 123, 259–265. [Google Scholar] [CrossRef]
  73. Wang, X.; Liu, F. Effects of Elevated CO2 and Heat on Wheat Grain Quality. Plants 2021, 10, 1027. [Google Scholar] [CrossRef] [PubMed]
  74. Pendall, E.; Bridgham, S.; Hanson, P.J.; Hungate, B.; Kicklighter, D.W.; Johnson, D.W.; Law, B.E.; Luo, Y.; Megonigal, J.P.; Olsrud, M.; et al. Below-ground process responses to elevated CO2 and temperature: A discussion of observations, measurement methods and models. New Phytol. 2004, 162, 311–322. [Google Scholar] [CrossRef]
  75. Satapathy, S.S.; Swain, D.K.; Pasupalak, S.; Bhadoria, P.B.S. Effect of elevated [CO2] and nutrient management on wet and dry season rice production in subtropical India. Crop J. 2015, 3, 468–480. [Google Scholar] [CrossRef] [Green Version]
  76. Kim, H.Y.; Lieffering, M.; Miura, S.; Kobayashi, K.; Okada, M. Growth and nitrogen uptake of CO2-enriched rice under field conditions. New Phytol. 2001, 150, 223–229. [Google Scholar] [CrossRef]
  77. Carvalho, J.M.; Barreto, R.F.; Prado, R.D.M.; Habermann, E.; Branco, R.B.F.; Martinez, C.A. Elevated CO2 and warming change the nutrient status and use efficiency of Panicum maximum Jacq. PLoS ONE 2020, 15, e0223937. [Google Scholar] [CrossRef] [Green Version]
  78. Jin, J.; Tang, C.; Sale, P. The impact of elevated carbon dioxide on the phosphorus nutrition of plants: A review. Ann. Bot. 2015, 116, 987–999. [Google Scholar] [CrossRef] [Green Version]
  79. Nie, M.; Lu, M.; Bell, J.; Raut, S.; Pendall, E. Altered root traits due to elevated CO2: A meta-analysis. Glob. Ecol. Biogeogr. 2013, 22, 1095–1105. [Google Scholar] [CrossRef]
  80. Dong, J.; Hunt, J.; Delhaize, E.; Zheng, S.J.; Jin, C.W.; Tang, C. Impacts of elevated CO2 on plant resistance to nutrient deficiency and toxic ions via root exudates: A review. Sci. Total Environ. 2021, 754, 142434. [Google Scholar] [CrossRef] [PubMed]
  81. Drigo, B.; Van Veen, J.A.; Kowalchuk, G.A. Specific rhizosphere bacterial and fungal groups respond differently to elevated atmospheric CO2. ISME J. 2009, 3, 1204–1217. [Google Scholar] [CrossRef] [PubMed]
  82. Krey, T.; Vassilev, N.; Baum, C.; Lobermann, B.E. Effects of long-term phosphorus application and plant-growth promoting rhizobacteria on maize phosphorus nutrition under field conditions. Eur. J. Soil Biol. 2013, 55, 124–130. [Google Scholar] [CrossRef]
  83. Yang, L.; Wang, Y.; Huang, J.; Zhu, J.; Yang, H.; Liu, G.; Liu, H.; Dong, G.; Hu, J. Seasonal changes in the effects of free-air CO2 enrichment (FACE) on phosphorus uptake and utilization of rice at three levels of nitrogen fertilization. Field Crops Res. 2007, 102, 141–150. [Google Scholar] [CrossRef]
  84. Roy, K.S.; Bhattacharyya, P.; Neogi, S.; Rao, K.S.; Adhya, T.K. Combined effect of elevated CO2 and temperature on dry matter production, net assimilation rate, C and N allocations in tropical rice (Oryza sativa L.). Field Crops Res. 2012, 139, 71–79. [Google Scholar] [CrossRef]
Figure 1. Nitrogen uptake by leaf, stem and fruit of tomato plants as influenced by elevated CO2 and temperature at 50% flowering, peak fruiting and at harvest stages (n = 15). Note: According to DMRT, values with same alphabet(s) do not differ statistically at the 0.05 level; Refer Table 1 for the description of the treatments.
Horticulturae 07 00509 g001
Figure 2. Phosphorus uptake by leaf, stem and fruit of tomato plants as influenced by elevated CO2 and temperature at 50% flowering, peak fruiting and at harvest stages (n = 15). Note: According to DMRT, values with same alphabet(s) do not differ statistically at the 0.05 level; Refer Table 1 for the description of the treatments.
Horticulturae 07 00509 g002
Figure 3. Potassium uptake by leaf, stem and fruit of tomato plants as influenced by elevated CO2 and temperature at 50% flowering, peak fruiting and at harvest stages (n = 15). Note: According to DMRT, values with same alphabet(s) do not differ statistically at the 0.05 level; Refer Table 1 for the description of the treatments.
Horticulturae 07 00509 g003
Figure 4. Total NPK uptake and root dry weight of tomato plants as influenced by elevated CO2 and temperature (n = 15). Refer Table 1 for the description of the treatments.
Horticulturae 07 00509 g004
Figure 5. Relationship between growth parameters, radiation interception and nutrient uptake of tomato under elevated CO2 and temperature.
Horticulturae 07 00509 g005
Table 1. Treatment details of the experiment.
Treatment No.TreatmentDescription
T1C0T0Ambient CO2 and ambient temperature at OTC
T2C1T0Elevated CO2 (550 ± 20 ppm) and ambient temperature
T3C1T1Elevated CO2 (550 ± 20 ppm) and elevated temperature of +2 °C
T4C2T0Elevated CO2 (700 ± 20 ppm) and ambient temperature
T5C2T1Elevated CO2 (700 ± 20 ppm) and elevated temperature +2 °C
T6C0T1Ambient CO2 and elevated temperature +2 °C
T7C0T0Ambient CO2 and ambient temperature at open field
Table 2. Average CO2, Temperature values recorded under each of the OTCs and the actual weather conditions prevailed during the study.
DescriptionAverage CO2 Concentration (ppm)Mean Temperature (°C)
Ambient CO2 and ambient temperature at OTC-25.8 (1.1)
Elevated CO2 (550 ± 20 ppm) and ambient temperature554 (29)-
Elevated CO2 (550 ± 20 ppm) and elevated temperature of +2 °C552 (33)27.2 (1.1)
Elevated CO2 (700 ± 20 ppm) and ambient temperature701 (32)-
Elevated CO2 (700 ± 20 ppm) and elevated temperature +2 °C702 (36)27.4 (1.4)
Ambient CO2 and elevated temperature +2 °C-26.8 (1.1)
Ambient CO2 and ambient temperature at Open field414 (25)24.9 (1.1)
Actual Weather
Tmean24.6 (0.6)
Tmaximum (°C)30.7 (1.3)
Tminimum (°C)17.6 (1.5)
RHmean (%)81.8 (5)
Mean sunshine hours5.5 (2.1)
Total Rainfall (mm)940.5 (197)
Note: Values in parenthesis represents standard deviation between the daily values.
Table 3. Effect of elevated CO2 and temperature on leaf area and leaf area index (LAI) of tomato at different growth stages.
Leaf Area (cm2/Plant)LAI
Treatments50% FloweringPeak Fruitingat Harvest50% FloweringPeak Fruitingat Harvest
(Mean ± SE)
T13943.44 ± 60.23 c5382.56 ± 82.221 e1184.46 ± 18.090 c, d0.49 ± 0.009 c0.66 ± 0.012 d0.15 ± 0.003 c
T24431.26 ± 92.236 b8660.76 ± 180.280 b4193.75 ± 87.299 a0.55 ± 0.012 b1.07 ± 0.021 a0.52 ± 0.012 a
T34193.89 ± 87.303 b, c7488.56 ± 155.887 c3524.27 ± 73.358 b0.52 ± 0.012 b, c0.92 ± 0.018 b0.44 ± 0.009 b
T44829.93 ± 73.774 a9110.68 ± 139.178 a4201.54 ± 64.192 a0.60 ± 0.009 a1.12 ± 0.019 a0.52 ± 0.007 a
T54167.54 ± 104.891 b, c6764.23 ± 170.229 d1274.69 ± 32.076 c0.51 ± 0.012 b, c0.84 ± 0.022 c0.16 ± 0.003 c
T63572.29 ± 94.510 d4149.21 ± 109.772 f1112.68 ± 29.438 d0.44 ± 0.012 d0.51 ± 0.012 e0.14 ± 0.003 c
T74002.58 ± 105.898 c6398.35 ± 169.293 d1231.72 ± 32.591 c, d0.49 ± 0.012 c0.79 ± 0.021 c0.15 ± 0.006 c
SEM±87.97145.3251.950.010.020.01
LSD (p = 0.05)271.07447.77160.080.030.060.02
Note: According to DMRT, values with same alphabet(s) do not differ statistically at the 0.05 level; Refer Table 1 for the description of the treatments.
Table 4. Effect of elevated CO2 and temperature on leaf area duration (LAD) and crop growth rate (CGR) of tomato at different growth stages.
LAD (Days)CGR (g/m2/day)
Treatments0–50% Flowering50% Flowering-Peak FruitingPeak Fruiting-HarvestTotal LAD0–50% Flowering50% Flowering-Peak FruitingPeak Fruiting-HarvestAverage CGR
(Mean ± SE)
T110.95 ± 0.165 c25.91 ± 0.394 e6.08 ± 0.092 d42.94 ± 0.657 e0.78 ± 0.012 f2.13 ± 0.034 e1.04 ± 0.015 c1.32 ± 0.019 f
T212.31 ± 0.255 b36.37 ± 0.756 b11.90 ± 0.247 a60.58 ± 1.261 b1.72 ± 0.035 b3.05 ± 0.066 b2.26 ± 0.045 a2.35 ± 0.048 b
T311.65 ± 0.244 b, c32.45 ± 0.675 c10.20 ± 0.211 b54.30 ± 1.130 c1.33 ± 0.027 c2.88 ± 0.062 b2.24 ± 0.047 a2.15 ± 0.047 c
T413.42 ± 0.205 a38.72 ± 0.593 a12.33 ± 0.190 a64.47 ± 0.984 a1.85 ± 0.027 a3.87 ± 0.058 a2.32 ± 0.036 a2.68 ± 0.039 a
T511.58 ± 0.290 b, c30.37 ± 0.764 d7.44 ± 0.188 c49.39 ± 1.242 d1.12 ± 0.027 d2.62 ± 0.067 c2.21 ± 0.057 a1.99 ± 0.050 d
T69.92 ± 0.261 d21.45 ± 0.567 f4.87 ± 0.129 e36.24 ± 0.959 f0.46 ± 0.012 g1.66 ± 0.044 f1.38 ± 0.038 b1.17 ± 0.030 g
T711.12 ± 0.294 c28.89 ± 0.764 d7.06 ± 0.188 c47.07 ± 1.247 d1.01 ± 0.026 e2.37 ± 0.065 d1.46 ± 0.041 b1.61 ± 0.044 e
SEM±0.240.650.181.070.030.060.040.04
LSD (p = 0.05)0.751.990.553.290.080.170.130.12
Note: According to DMRT, values with same alphabet(s) do not differ statistically at the 0.05 level; Refer Table 1 for the description of the treatments.
Table 5. Effect of elevated CO2 and temperature on cumulative radiation interception and phenological stages initiation of tomato.
Cumulative Radiation Interception (MJ/m2)Days Taken for First Initiation
Treatments50% FloweringPeak Fruitingat HarvestBranch InitiationFlower InitiationFruit InitiationFruit Maturation
(Mean ± SE)
T1122.75 ± 1.876 c333.20 ± 5.089 c, d410.91 ± 6.276 b23.37 ± 0.387 a, b38.00 ± 0.255 a, b48.60 ± 0.417 a75.20 ± 1.149 a, b
T2141.03 ± 2.935 a, b365.40 ± 7.607 a481.49 ± 10.024 a23.00 ± 0.479 b36.95 ± 0.540 b47.67 ± 0.436 a, b, c74.00 ± 0.804 a, b, c
T3139.24 ± 2.899 a, b355.40 ± 7.399 a, b466.71 ± 9.716 a22.80 ± 0.348 b, c35.93 ± 0.749 c, d46.13 ± 0.961 b, c, d72.33 ± 1.504 b, c, d
T4143.61 ± 2.194 a365.77 ± 5.589 a479.41 ± 7.324 a22.77 ± 0.239 b, c35.80 ± 0.547 c, d45.47 ± 0.693 c, d70.80 ± 1.081 c, d
T5137.10 ± 3.448 a, b353.07 ± 8.884 a, b, c455.96 ± 11.472 a21.63 ± 0.282 c35.06 ± 0.570 c45.20 ± 1.138 d69.40 ± 1.746 d
T6121.12 ± 3.204 c316.40 ± 8.369 d393.76 ± 10.419 b23.33 ± 0.720 a, b37.33 ± 0.673 a, b, c48.13 ± 0.955 a, b74.33 ± 1.646 a, b, c
T7134.54 ± 3.557 b342.35 ± 7.428 b, c416.18 ± 11.013 b24.63 ± 0.676 a39.20 ± 0.719 a49.27 ± 0.136 a77.00 ± 1.406 a
SEM±2.877.209.450.440.610.791.40
LSD (p = 0.05)8.8322.1929.121.351.872.444.31
Note: According to DMRT, values with same alphabet(s) do not differ statistically at the 0.05 level; Refer Table 1 for the description of the treatments.
Publisher’s Note: MDPI stays neutral with regard to jurisdictional claims in published maps and institutional affiliations.

