Article

The Combined Effect of Pseudomonas stutzeri and Biochar on the Growth Dynamics and Tolerance of Lettuce Plants (Lactuca sativa) to Cadmium Stress

1
Department of Biology, Faculty of Science and Arts, King Khalid University, Mohail 61321, Assir, Saudi Arabia
2
Agricultural Research Center, Department of Microbiology, Soils, Water and Environment Research Institute, Giza 12112, Egypt
3
Agricultural Research Center, Department of Vegetable Research, Horticultural Research Institute, Giza 12112, Egypt
*
Author to whom correspondence should be addressed.
Horticulturae 2021, 7(11), 430; https://doi.org/10.3390/horticulturae7110430
Submission received: 17 September 2021 / Revised: 16 October 2021 / Accepted: 19 October 2021 / Published: 22 October 2021
(This article belongs to the Special Issue Phytotoxicity of Heavy Metals in Horticultural Plants and Security)

Abstract

:
Agricultural activities lead to the accumulation of cadmium (Cd) in the soil. It is necessary to identify effective and economical ways to reduce the soil Cd bioavailability. To achieve this, three bacterial strains, Pseudomonas stutzeri, P. koreensis, and P. fluorescens, were tested for tolerance and biosorption of different concentrations of Cd (0, 5, 10, 15, 20, and 25 mg L−1). During the 2020 and 2021 seasons, a pot experiment was conducted using four different soil amendments (control, biochar, P. stutzeri, and a combination) under four levels of Cd (0, 40, 80, and 120 mg kg−1) and assessing the effect on growth parameters, physiological modifications, antioxidant enzymes, and Cd accumulation in lettuce plants (Lactuca sativa cv. Balady). In vitro, the results showed that P. stutzeri was the most tolerant of Cd. Our findings in pot trials showed that T4 (biochar + P. stutzeri) was a more efficient treatment in terms of the growth parameters, with 452.00 g plant−1 was recorded for fresh weight, 40.10 g plant−1 for dry weight, 18.89 cm plant−1 for plant height, 6.03 cm2 for leaf area, and 20.48 for the number of leaves plant−1, while in terms of physiological characteristics, we recorded 1.29 mg g−1 FW, 0.35 μg g−1 FW, and 3.69 μg g−1 FW for total chlorophyll, carotenoids, and total soluble sugar, respectively; this was also reflected in the number of antioxidant enzymes and intensity of soil biological activities in soil treated with 120 mg kg−1 Cd compared with the control and other treatments in the first season. A similar trend was observed in the second season. Additionally, significantly lower Cd was observed in both the root (67%) and shoots (78%). Therefore, a combined application of biochar and P. stutzeri could be used as an alternative to mitigate Cd toxicity.

1. Introduction

Heavy metal pollution is a serious environmental problem that negatively affects soil fertility and plant productivity and threatens human health [1,2]. It can also change the function and structure of an ecosystem owing to its stability and toxic nature [3,4]. Cadmium (Cd) is one of the toxic heavy metals discharged into the environment through fossil fuel combustion, mining, smelting, metal plating, Ni–Cd batteries, fungicides and pesticides, phosphate fertilizers, dyes, photographs, textile processes, stabilizers, and alloy manufacturing [5,6,7]. In addition, Cd is a causative agent in many diseases, especially of the lungs, kidneys, liver, and reproductive organs, including Itai-itai disease, and is classified as a human carcinogen [5,8]. According to the Agency for Toxic Substances and Disease Registry [9], the permissible limit of Cd in the soil is 85 mg kg−1 and 0.02 mg kg−1 in plants. Therefore, when plants grow in soil contaminated with Cd, we find that it is absorbed and accumulated in their edible tissues, through the membrane transport systems used for Fe [10], or Zn or Ca [11], and thus enters the food chain. Cadmium is a very important pollutant because it is easily soluble in water and has harmful effects even at low concentrations [12], which cause stunting, chlorosis, and leaf roll and stimulate the production of oxygen free radicals while reducing the number of enzymatic and nonenzymatic antioxidants [13,14]. In addition, the high accumulation of Cd in plants affects the growth of plants through stomatal closure, reduction of nutrient uptake, and disturbances in photosynthesis and respiration. Reactive oxygen species (ROS) are extremely harmful at higher concentrations, oxidizing various proteins such as catalase, ascorbate peroxidase, and lipids owing to changes in cell structure and mutations [15].
In this context, the lettuce plant is a good model in which to study the mechanisms responsible for the accumulation of Cd in its tissues. There are several strategies for the remediation of heavy metals from soil, i.e., physical, chemical, and biological strategies. The physical and chemical methods are expensive, labor-intensive, and cause permanent changes in the properties of the soil, as they sometimes result in secondary pollutants. Biological methods, on the other hand, are effective and eco-friendly [16,17]. Therefore, an appropriate technology that can be used to solve this problem is bioremediation technology, which reduces the transfer of Cd to the soil by adding biosorbent materials such as biochar and microorganisms. These biosorbent materials depend on characteristics such as the biomass as well as physical and chemical properties of metals, pH, and temperature.
Biochar is charcoal that contains ash, H, O, N, and S, which are added to the soil to improve different properties and increase productivity [18]. In addition, it is characterized by a high surface area and internal porosity; it contains highly effective functional groups and acts as an inoculum source for microorganisms [19]. In addition, it has a high pH, which immobilizes heavy metal cations in the soil [20]. The addition of biochar to the soil also increases the soil nutrient supply and microbial activity and decreases nutrient leaching [21,22], helping to improve the supply of essential macro- and micronutrients for plant growth [23]. This also improves the soil structure by increasing the porosity and aeration of the soil [24], boosting nutrient retention in the micropores of the soil [25], and reducing the toxicity of heavy metals such as Zn, Cu, Cd, and Ni in many plant species by several mechanisms including immobilization in the soil, pH modification, alterations in the redox state in the soil, and improvement of the biological properties [4,26].
Microorganisms can enhance the availability of heavy metals through solubilization and mobilization in the soil solution by decreased pH, which is called phytoremediation, or by chemical transformation of metal ions from toxic forms to nontoxic forms; thus, the plant uptake of minerals increases [2,4]. On the contrary, microorganisms can reduce the availability of metals by bioaccumulation (external and intracellular), immobilization, chelation, and active removal [2,27]. Among them, Pseudomonas stutzeri is Gram-negative, aerobic, lives in mine wastewaters polluted with different heavy metals [28,29], and has been extensively studied for its well-adapted metal resistance properties [30,31].
Therefore, the objective of this research was to investigate the effect of P. stutzeri, biochar, and their combination on the growth parameters, physiological modifications, antioxidant enzymes, and Cd accumulation in lettuce plants grown in a pot experiment contaminated with different levels of Cd during the 2020 and 2021 seasons.

2. Materials and Methods

2.1. Pseudomonas Strains and Growth Conditions

Three bacterial strains, Pseudomonas stutzeri SARS 1001, P. koreensis MG209738, and P. fluorescens SARS 201, were obtained from the Department of Agricultural Microbiology, Soils, Water, and Environment Research Institute (SWERI), ARC, Egypt. For optimum growth, these bacteria were cultured in King’s B (KB) broth medium [32], which contains (g L−1) glycerol 20, tryptone 20, MgSO4 0.732, and K2HPO4 0.514 at 30 °C, pH 7.4 ± 0.2, on a rotary shaker at 150 rpm for 72 h.

2.2. Assessment of Different Pseudomonas Strains for Cd Tolerance

A stock solution of 100 mg L−1 was prepared using CdCl2.2.5H2O (Merck, Germany, CAS: 7790-78-5; Lot No. 239208). Different concentrations (0, 5, 10, 15, 20, and 25 mg L−1) of stock solution were made up in Erlenmeyer flasks containing 50 mL of KB broth and 1 mL of fresh cultures of different Pseudomonas strains (108 CFU mL−1) were inoculated and incubated in the shaker at 150 rpm at 30 °C for three days. Five replicates were performed, and the growth of bacteria was measured by optical density (OD) at 540 nm using a UV/Visible spectrophotometer (Jenway model 6705, UK). The blank used was set with a sterile uninoculated KB medium.

2.3. Biosorption of Cd by Different Pseudomonas Strains

To study the effect of different concentrations of Cd on biosorption by different Pseudomonas strains, initial concentrations of 0, 5, 10, 15, 20, and 25 mg L−1 were used with 108 CFU mL−1 of fresh cultures at 30 °C and 150 rpm for three days. Then, bacterial cultures were centrifuged at 5000 rpm for 10 min, and 5 mL of the supernatant was filtered and analyzed using an Atomic Absorption Spectrophotometer (AAS PerkinElmer 3300). KB broth, with the treated concentration of Cd and without inoculum, was used as a blank for the study. The differences from the first and the last concentration indicated the biosorption of Cd by the bacterial strains and the experiment was performed in triplicate [33].

2.4. Biochar Characterization

Under oxygen-depleted and 400 °C conditions (Muffel furance, Lenton model S33 6BW, 1100 °C, UK), slow pyrolysis of rice husks and corn stalks (1:1) was prepared as biochar with physical and chemical properties as follows: moisture content, 31 g kg−1; water holding capacity, 942 g kg−1; bulk density, 0.2 g cm−3; specific surface area, 34 m2 g−1; pH 7.10; and EC, 0.68 dS m−1. The content of N, P, K, and Cd was 27.01, 8.15, 12.71, and 0.00 g kg−1, respectively.

2.5. Pot Trial

Sandy soil was washed thrice with 0.1 M HCl, followed by distilled water several times to remove other minerals, and autoclaved twice at 1.5 par, 121 °C for 4 h, then treated with different Cd levels by dissolving it in distilled water and leaving the mixture for two weeks [34]. Under greenhouse conditions, a polyethylene bag (20 cm in diameter and 30 cm in height) was filled with 5 kg of sandy soil that was incorporated with biochar (BC). The experiment was conducted as a split-plot design with eight replicates.
Pollution treatments with Cd (0, 40, 80, and 120 mg kg−1) were considered as the main plots, while the inoculation and biochar treatments were subplots. The subplots were control, inoculated with superior strain, P. stutzeri SARS 1001, biochar treatment at a rate of 10 ton ha−1, and a combination of P. stutzeri + biochar. The soil was inoculated with treatments with P. stutzeri inocula (10 mL pot−1) before transplanting to obtain a final inoculation of 108 CFU kg−1. Noninoculated treatments received 10 mL of King’s B medium pot−1. Uniformly sized lettuce seedlings (Lactuca sativa cv. Baladi) were transplanted into each pot on 5 and 10 January during the 2020 and 2021 seasons. According to Skrdleta [35], a nutrient solution was used for irrigation once or twice weekly that contained macroelements as follows (g L−1): K2HPO4—0.2, NH4SO4—0.03, MgSO4.7H2O—0.2, FeCl3—0.01, CaCl2—0.376, and K2SO4—0.845. The microelement amounts were as follows (mg/L): H3BO3—1.855, MnSO4.4H2O—2.231, ZnSO4.7H2O—0.288, CuSO4.5H2O—0.25, and NaMO4—0.412. Using a diluted KOH solution, the pH of the nutrient solution was adjusted to 6.9.

2.6. Trait Measurements

2.6.1. Growth Parameters

Five healthy plants per treatment were harvested 70 days after transplanting, then the fresh and dry weight (g plan−1), plant height (cm plant−1), leaf area (cm2), and number of leaves were measured. The fresh and dry weight of the plant was measured by an electronic balance (ADAM model PW 214, 500 g, UK), while the leaf area was measured using a leaf area meter (CI-203 area meter, USA).

2.6.2. Physiological Characteristics

Thirty days after transplanting, a leaf sample from every treatment was collected and frozen to determine the following variables: photosynthetic pigments, carotenoids, total soluble sugars, proline, and activity of antioxidant enzymes.

2.6.3. Photosynthetic Pigments

From every treatment, 0.1 g of leaf sample from every treatment was ground and extracted in 5 mL of acetone (80%) to determine the total chlorophylls and carotenoids as described by [36]. After being centrifuged at 13,000× g for 10 min, the supernatant was measured at 663 nm, 645 nm, and 470 nm. Total chlorophylls and carotenoids were calculated and expressed as mg g−1 FW.

2.6.4. Total Soluble Sugars (TSSs)

We used the protocol described by [37]. Briefly, a 0.5 g leaf sample from every treatment was homogenized in 5 mL of ethanol (80%), and then placed at 80 °C for 30 min in a water bath. The supernatants were collected after centrifuging at 10,000× g for 10 min to measure the total soluble sugars’ concentration at 620 nm by a UV spectrophotometer (Model 6705), based on a glucose standard curve and expressed as mg g−1 FW.

2.6.5. Proline

Proline concentrations were determined using the methods described by [38]. Briefly, 0.5 g of leaf sample from every treatment was homogenized with 5 mL of ethanol (95%) and centrifuged at 5000× g. In a test tube, the supernatant was collected and mixed with 1 mL of alcoholic extract, 1 mL of distilled water, 2 mL of ninhydrin, and 2 mL of glacial acetic acid under water bath conditions (100 °C). In cold water, the reaction was stopped after 1 h and mixed with 4 mL of toluene. Proline concentrations were estimated at 520 nm using a UV spectrophotometer (Jenway model 6705, UK) based on a proline standard curve and expressed as µmol g−1 FW.

2.6.6. Activity of Antioxidant Enzymes

In order to estimate the ascorbate peroxidase (APX) and catalase (CAT) enzyme activities, briefly, a 1 g leaf sample was homogenized in a cooled Tris-HCl buffer (0.1 mol L−1, pH 7.8) containing 1 mmol L−1 EDTA + 1 mmol L−1 dithiothreitol + 5 mL polyvinyl pyrrolidone (4%). To measure the ascorbate peroxidase (APX) activity, we used a reaction mixture consisting of 20 µL crude leaf extract, 660 µL potassium phosphate buffer (pH 7.0), 660 µL ascorbic acid solution, and 660 µL H2O2. Enzyme activity was measured at 290 nm for 3 min [39]. For catalase (CAT) activity, a 1 g leaf sample was extracted in a porcelain mortar containing 0.1 M sodium phosphate buffer (pH 7.1). At 25 °C, the reaction mixture consisted of 25 mM L−1 Tris-acetate buffer (pH 7.0) + 0.8 mM L−1 EDTA-Na + 20 mM L−1 H2O2. Enzyme activity was measured at 240 nm for 3 min using a UV spectrophotometer Model 6705 [40]. Enzyme activities were calculated in the form of unit mg −1 protein.

2.7. Soil Microbiological Activity

2.7.1. Microbial Biomass Carbon

By the fumigation extraction technique, the microbial biomass carbon (MBC) was determined [41]. From each treatment, 25 g soil samples were placed in a beaker (100 mL capacity) and fumigated for 24 h at 25 °C with ethanol-free chloroform. After that, samples were extracted with 0.5 M K2SO4 (100 mL) for 30 min and then extractable organic carbon (EC) was analyzed by K2Cr2O7 and concentrated with H2SO4 at 170 °C for 30 min, then titrated using ferrous ammonium sulfate (0.04 M) with ferroin. According to Cao and Zhiping [42], MBC was calculated 30 days after transplanting using three replicates by the following equation:
MBC = EC fumigated soil − EC un-fumigated soil/Kc
where EC is the extractable organic carbon and Kc is the K2SO4 extract efficiency factor (0.379).

2.7.2. CO2 Evolution

According to the method reported by [43], the CO2 evolution was determined. Three replicates were taken from each treatment and pre-incubated at 25 °C and 60% moisture for six days, then 10 g of sample (in a 2-mm sieve) was placed into Erlenmeyer flasks (1 L capacity) and incubated for three days. In a beaker (50 mL capacity) containing 25 mL of 0.1 M NaOH solution, the evolution of CO2 was observed. The total carbon dioxide was precipitated as BaCO3 with BaCl2 and estimated by titration with an excess of sodium hydroxide to pH 8.3 with 0.10 M HCl solution.

2.7.3. Dehydrogenase Activity (DHA)

DHA was determined by [44]. In the dark, 2 g of air-dried soil was added to 2 mL of tetrazolium chloride solution and incubated at 30 °C for 24 h. Triphenyl formazan (TPF) was extracted with 10 mL acetone and measured at 485 nm using a UV spectrophotometer (Model 6705) based on the TPF standard curve and expressed as µg TPF g−1 dry soil day−1.

2.8. Determination of Cd in Plant Organs

According to Humphries [45], plant roots and shoots were thoroughly rinsed in distilled water and dried in an oven at 70 °C for 24 h, and then ground in a stainless-steel blender. Half a gram of the ground samples was mixed with 4.0 mL HNO3 and 1.0 mL HClO4, digested at 230 °C, and filtered to obtain a clear solution. The total concentration of Cd was analyzed by flame atomic absorption spectroscopy (AAS PerkinElmer 3300).

2.9. Bioconcentration and Translocation Factors

The Cd content efficiency of lettuce plants was measured for each plant part (roots and shoots). The bioconcentration factor (BCF) and translocation factor (TF) were calculated using the following equations [46,47]:
BCF = Concentration of Cd in roots/Concentration of Cd in test soil
TF = Concentration of Cd in shoots/Concentration of Cd in roots

2.10. Statistical Analysis

The data were statistically analyzed according to the analysis of variance (ANOVA) procedure, using CoStat software (Pack-age 6.45, CoHort, USA). The differences between the means were compared at p < 0.05 using DMRT [48]. Data are presented as the mean ± SD.

3. Results

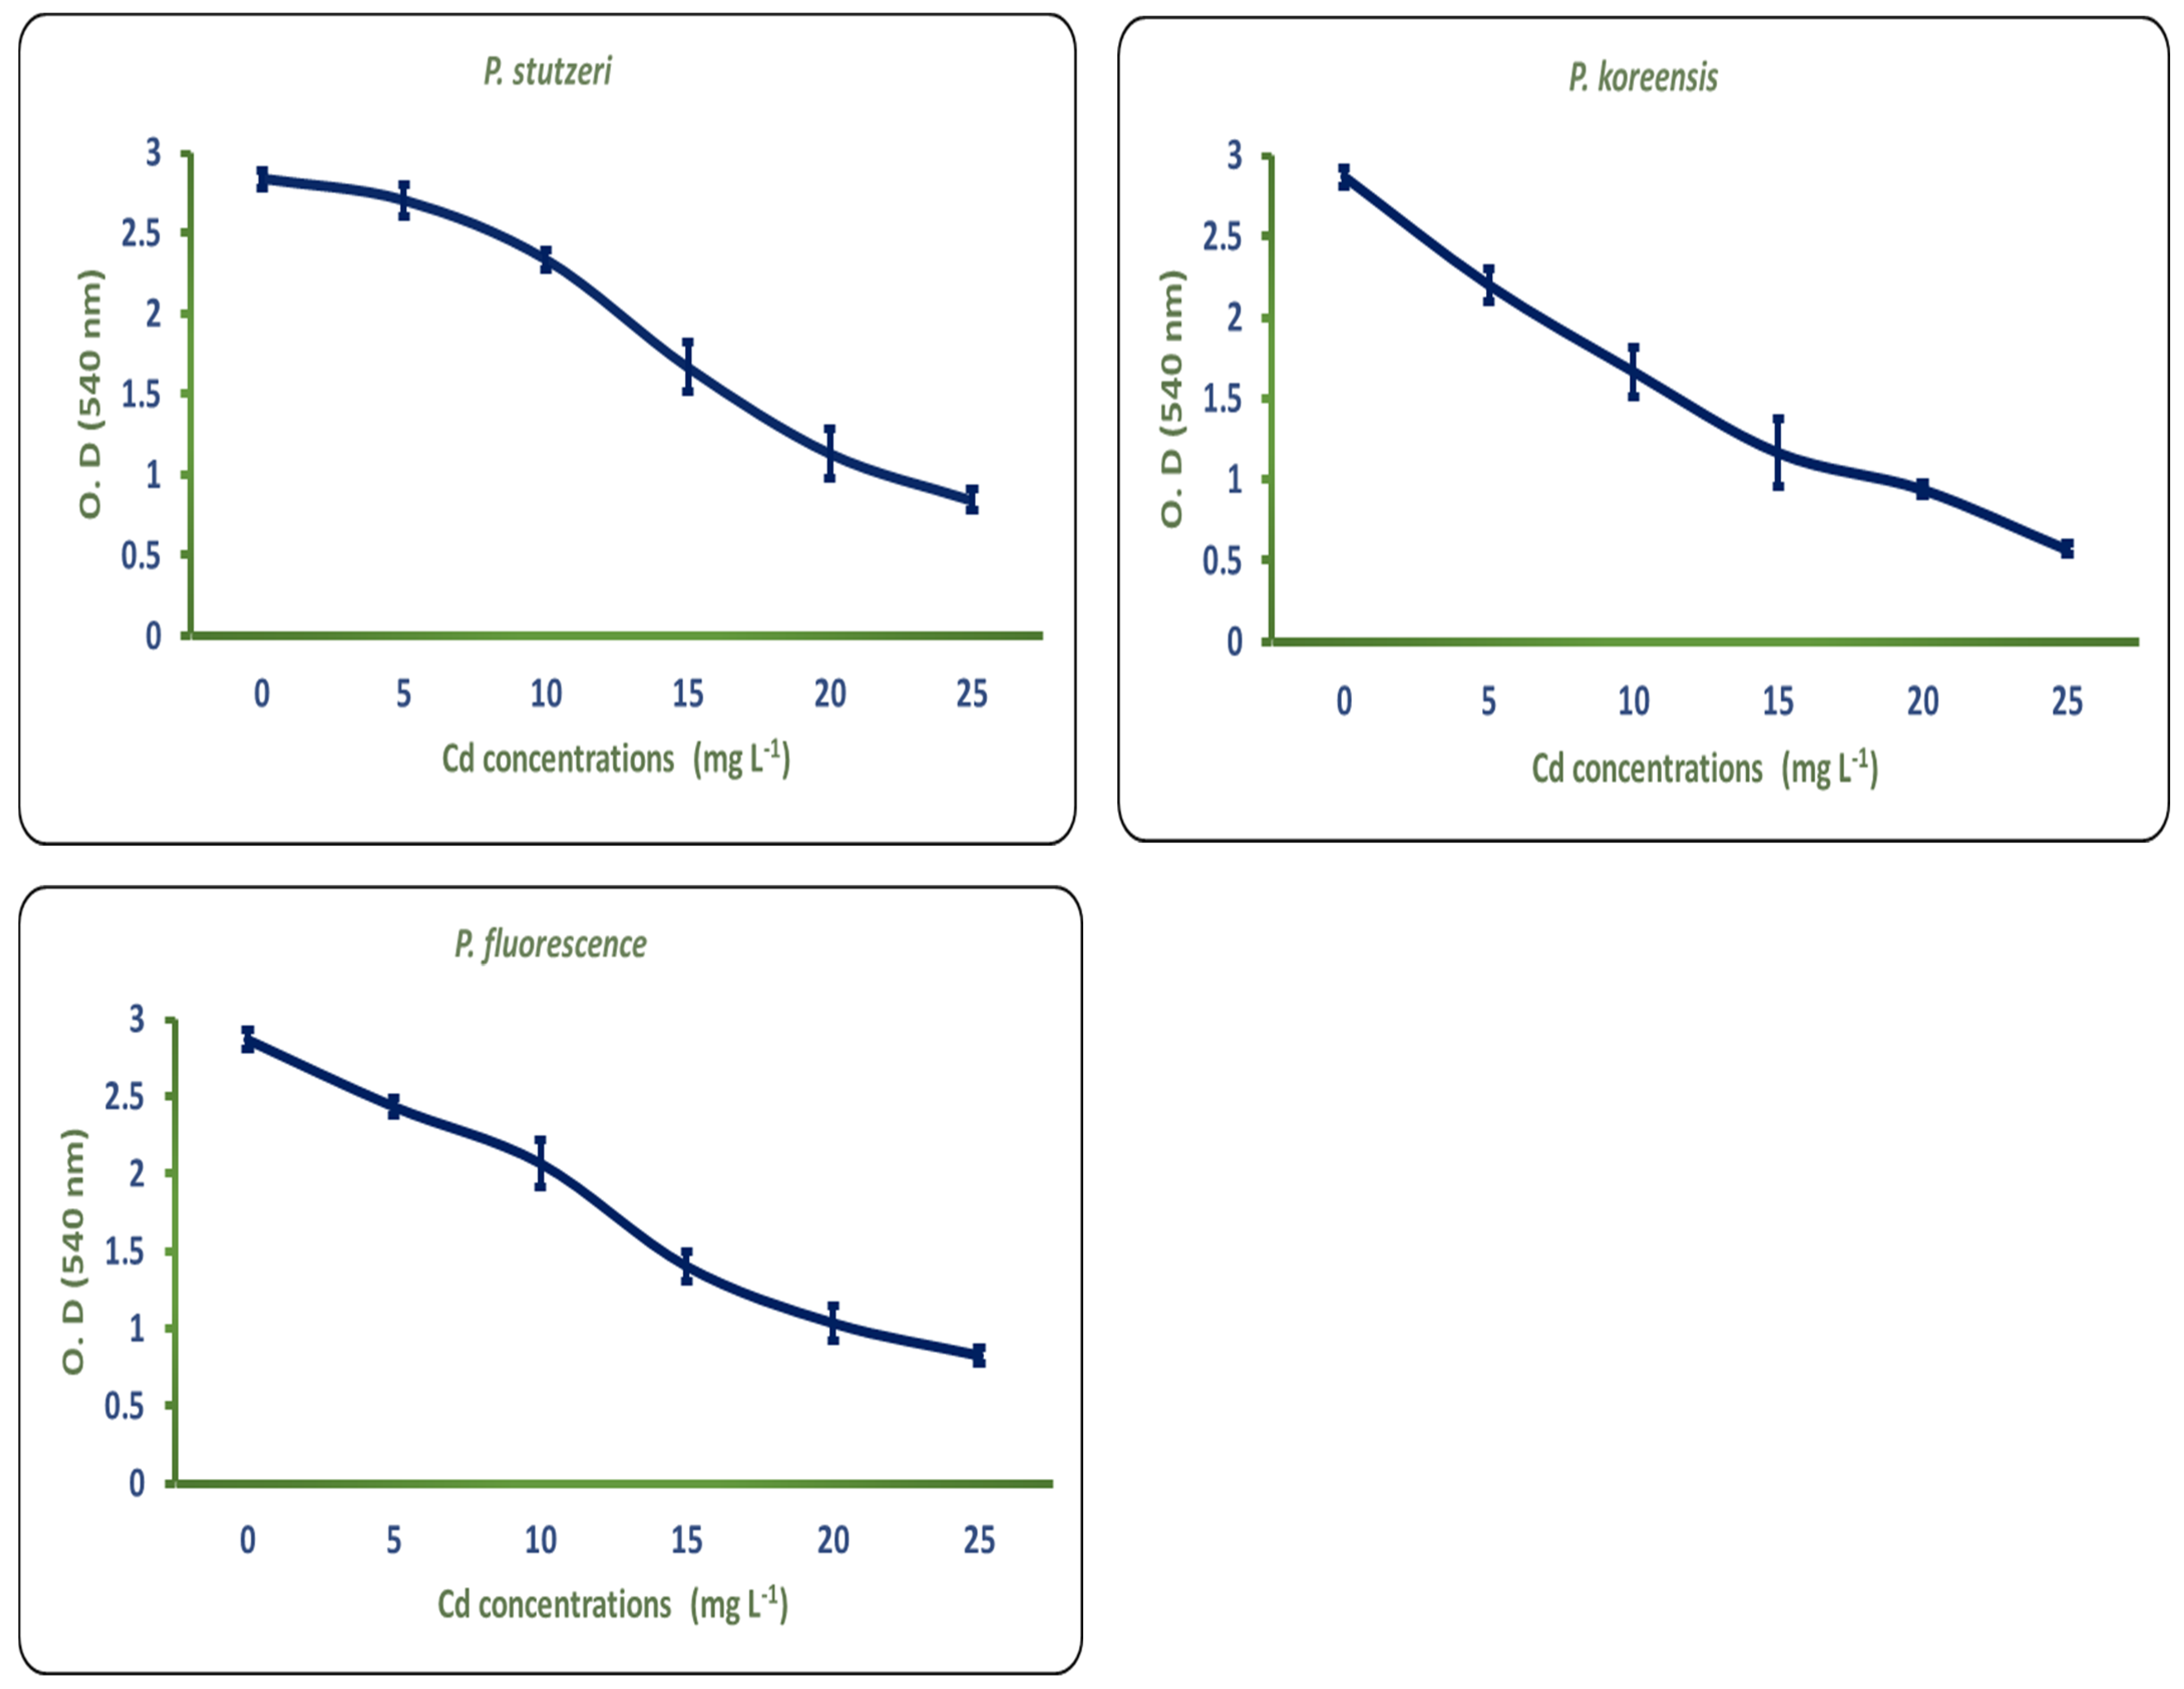
3.1. Assessment of Different Pseudomonas Strains for Cd Tolerance

After incubation for 72 h, the growth patterns of Pseudomonas strains (P. stutzeri, P. koreensis, and P. fluorescens) showed marked variation when grown in a KB broth medium supplemented with different concentrations of Cd (0, 5, 10, 15, 20, and 25 mg L−1). Compared with the normal growth curve (no Cd), the optical density (OD540) of different strains showed a decrease in growth with increasing Cd concentration. It was noticed that the P. stutzeri strain was the most tolerant to higher Cd concentrations as compared with the other strains, which had good ability to grow on the KB broth medium supplemented with 25 mg L−1 Cd (Figure 1).

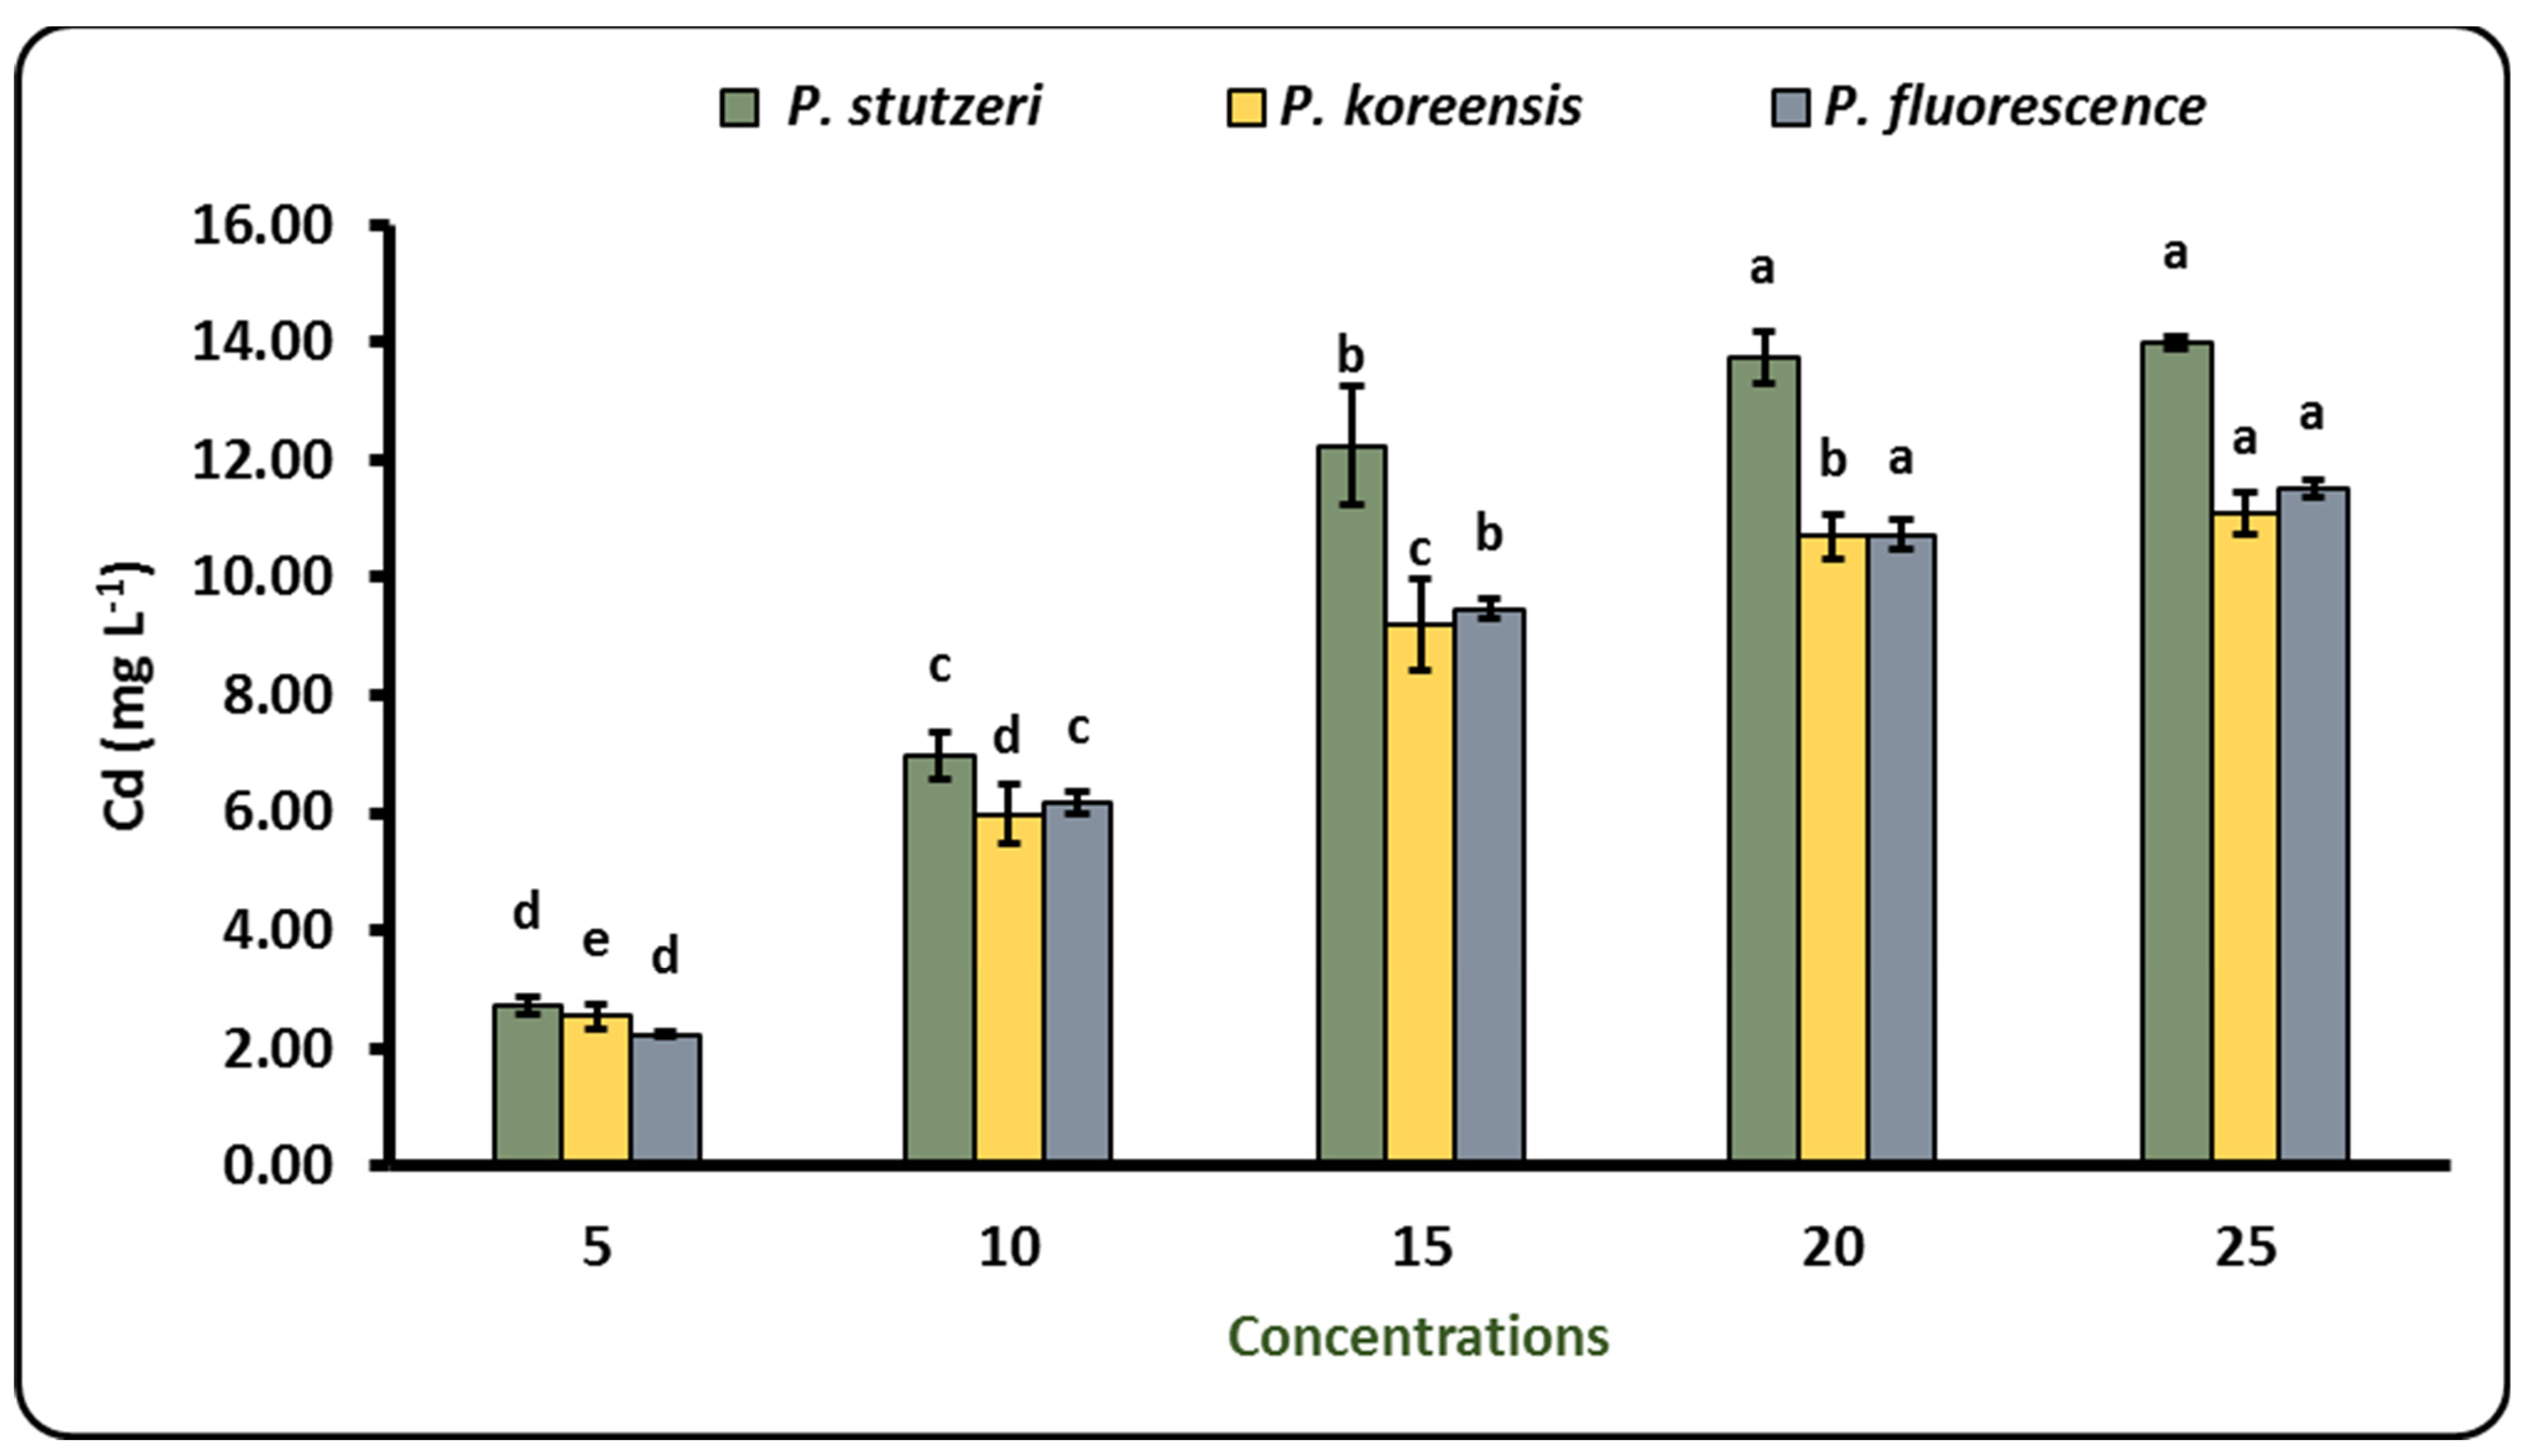
3.2. Biosorption of Cd by Different Pseudomonas Strains

To gain insight into the biosorption of different concentrations of Cd by different Pseudomonas strains, we measured it in a supernatant using an atomic absorption spectrophotometer (Figure 2). Of the three strains tested, the biosorption by P. stutzeri was more abundant.
Compared with the lower concentration of Cd (5 mg L−1), biosorption of Cd was significantly elevated at all other concentrations tested and increased with the increase in concentration. At 25 mg L−1, increases of 55.96%, 44.28%, and 46.04% were observed for P. stutzeri, P. koreensis, and P. fluorescens as compared with other concentrations of Cd, respectively. Herein, biosorption of Cd by different strains of Pseudomonas followed the descending order of P. stutzeri > P. fluorescens > P. koreensis (Figure 2).

3.3. Pot Trial

3.3.1. Growth Parameters

Under different concentrations of Cd (0, 40, 80, and 120 mg kg−1) and soil amendments (control, biochar, inoculation with P. stutzeri, and combination), significant differences (p < 0.05) in the growth parameters of lettuce plants, i.e., fresh and dry weight, plant height, leaf area, and number of leaves, were recorded during the two growing seasons (Table 1). Generally, a combination treatment (biochar + inoculation with P. stutzeri) increased the growth parameters over the control treatment under different Cd stress conditions.
Seventy days after transplanting, treated lettuce plants with 120 T4 (120 mg kg−1 and combination) showed significantly increased fresh weight (g plant−1)—298 (control, T1) to 408 (biochar, T2), 366 (inoculation with P. stutzeri, T3), and 452 (biochar + inoculation with P. stutzeri, T4)—whereas the same treatment increased the dry weight (g plant−1) from 25.85 (control, T1) to 36.05 (biochar, T2), 32.28 (inoculation with P. stutzeri, T3), and 40.10 (biochar + inoculation with P. stutzeri, T4) in 2020, as shown in Table 1. A similar trend was observed in 2021. In the same way, the application of soil amendments alleviated the detrimental effect of Cd stress on plant height, leaf area, and number of leaves. The T4 treatment was more efficient, with 18.89 cm plant−1 recorded for plant height, 6.03 cm2 for leaf area, and 20.48 for the number of leaves plant−1 under soil treated with 120 mg kg−1 Cd compared with the control and other treatments in the first season (Table 1).

3.3.2. Physiological Characteristics

The total chlorophyll, carotenoid, total soluble sugar, and proline contents of lettuce leaves showed significant differences (p < 0.05) 30 days after transplanting with respect to different applications of soil amendments (T1 (control), T2 (biochar), T3 (inoculation with P. stutzeri), and T4 (biochar + inoculation with P. stutzeri)) under different concentrations of Cd stress (Table 2).
The highest value of total chlorophyll was 1.29, followed by 1.23 and 1.17 mg g−1 FW for 120T4 treatment (120 mg kg−1 Cd and biochar + inoculation with P. stutzeri), followed by 120T3 treatment (120 mg kg−1 Cd and inoculation with P. stutzeri) and 120T2 treatment (120 mg kg−1 Cd and biochar) over the control treatment (120T1), in 2020 (Table 2). On the other hand, under different soil applications, T4 treatment (biochar + inoculation with P. stutzeri) was the best treatment, with 0.96, 0.89, 0.70, and 0.35 μg g−1 FW recorded for carotenoids; 6.96, 6.37, 5.71, and 3.69 μg g−1 FW for TSS; and 7.22, 6.17, 7.49, and 8.79 µmol g−1 FW for proline under different concentrations of Cd (0, 40, 80, and 120 mg kg−1) compared with the other studied treatments. The same trend was noticed in 2021. From the results mentioned above, a descending order of T4 > T2 > T3 > T1 was seen for different applications of soil amendments under Cd stress conditions (Table 2).

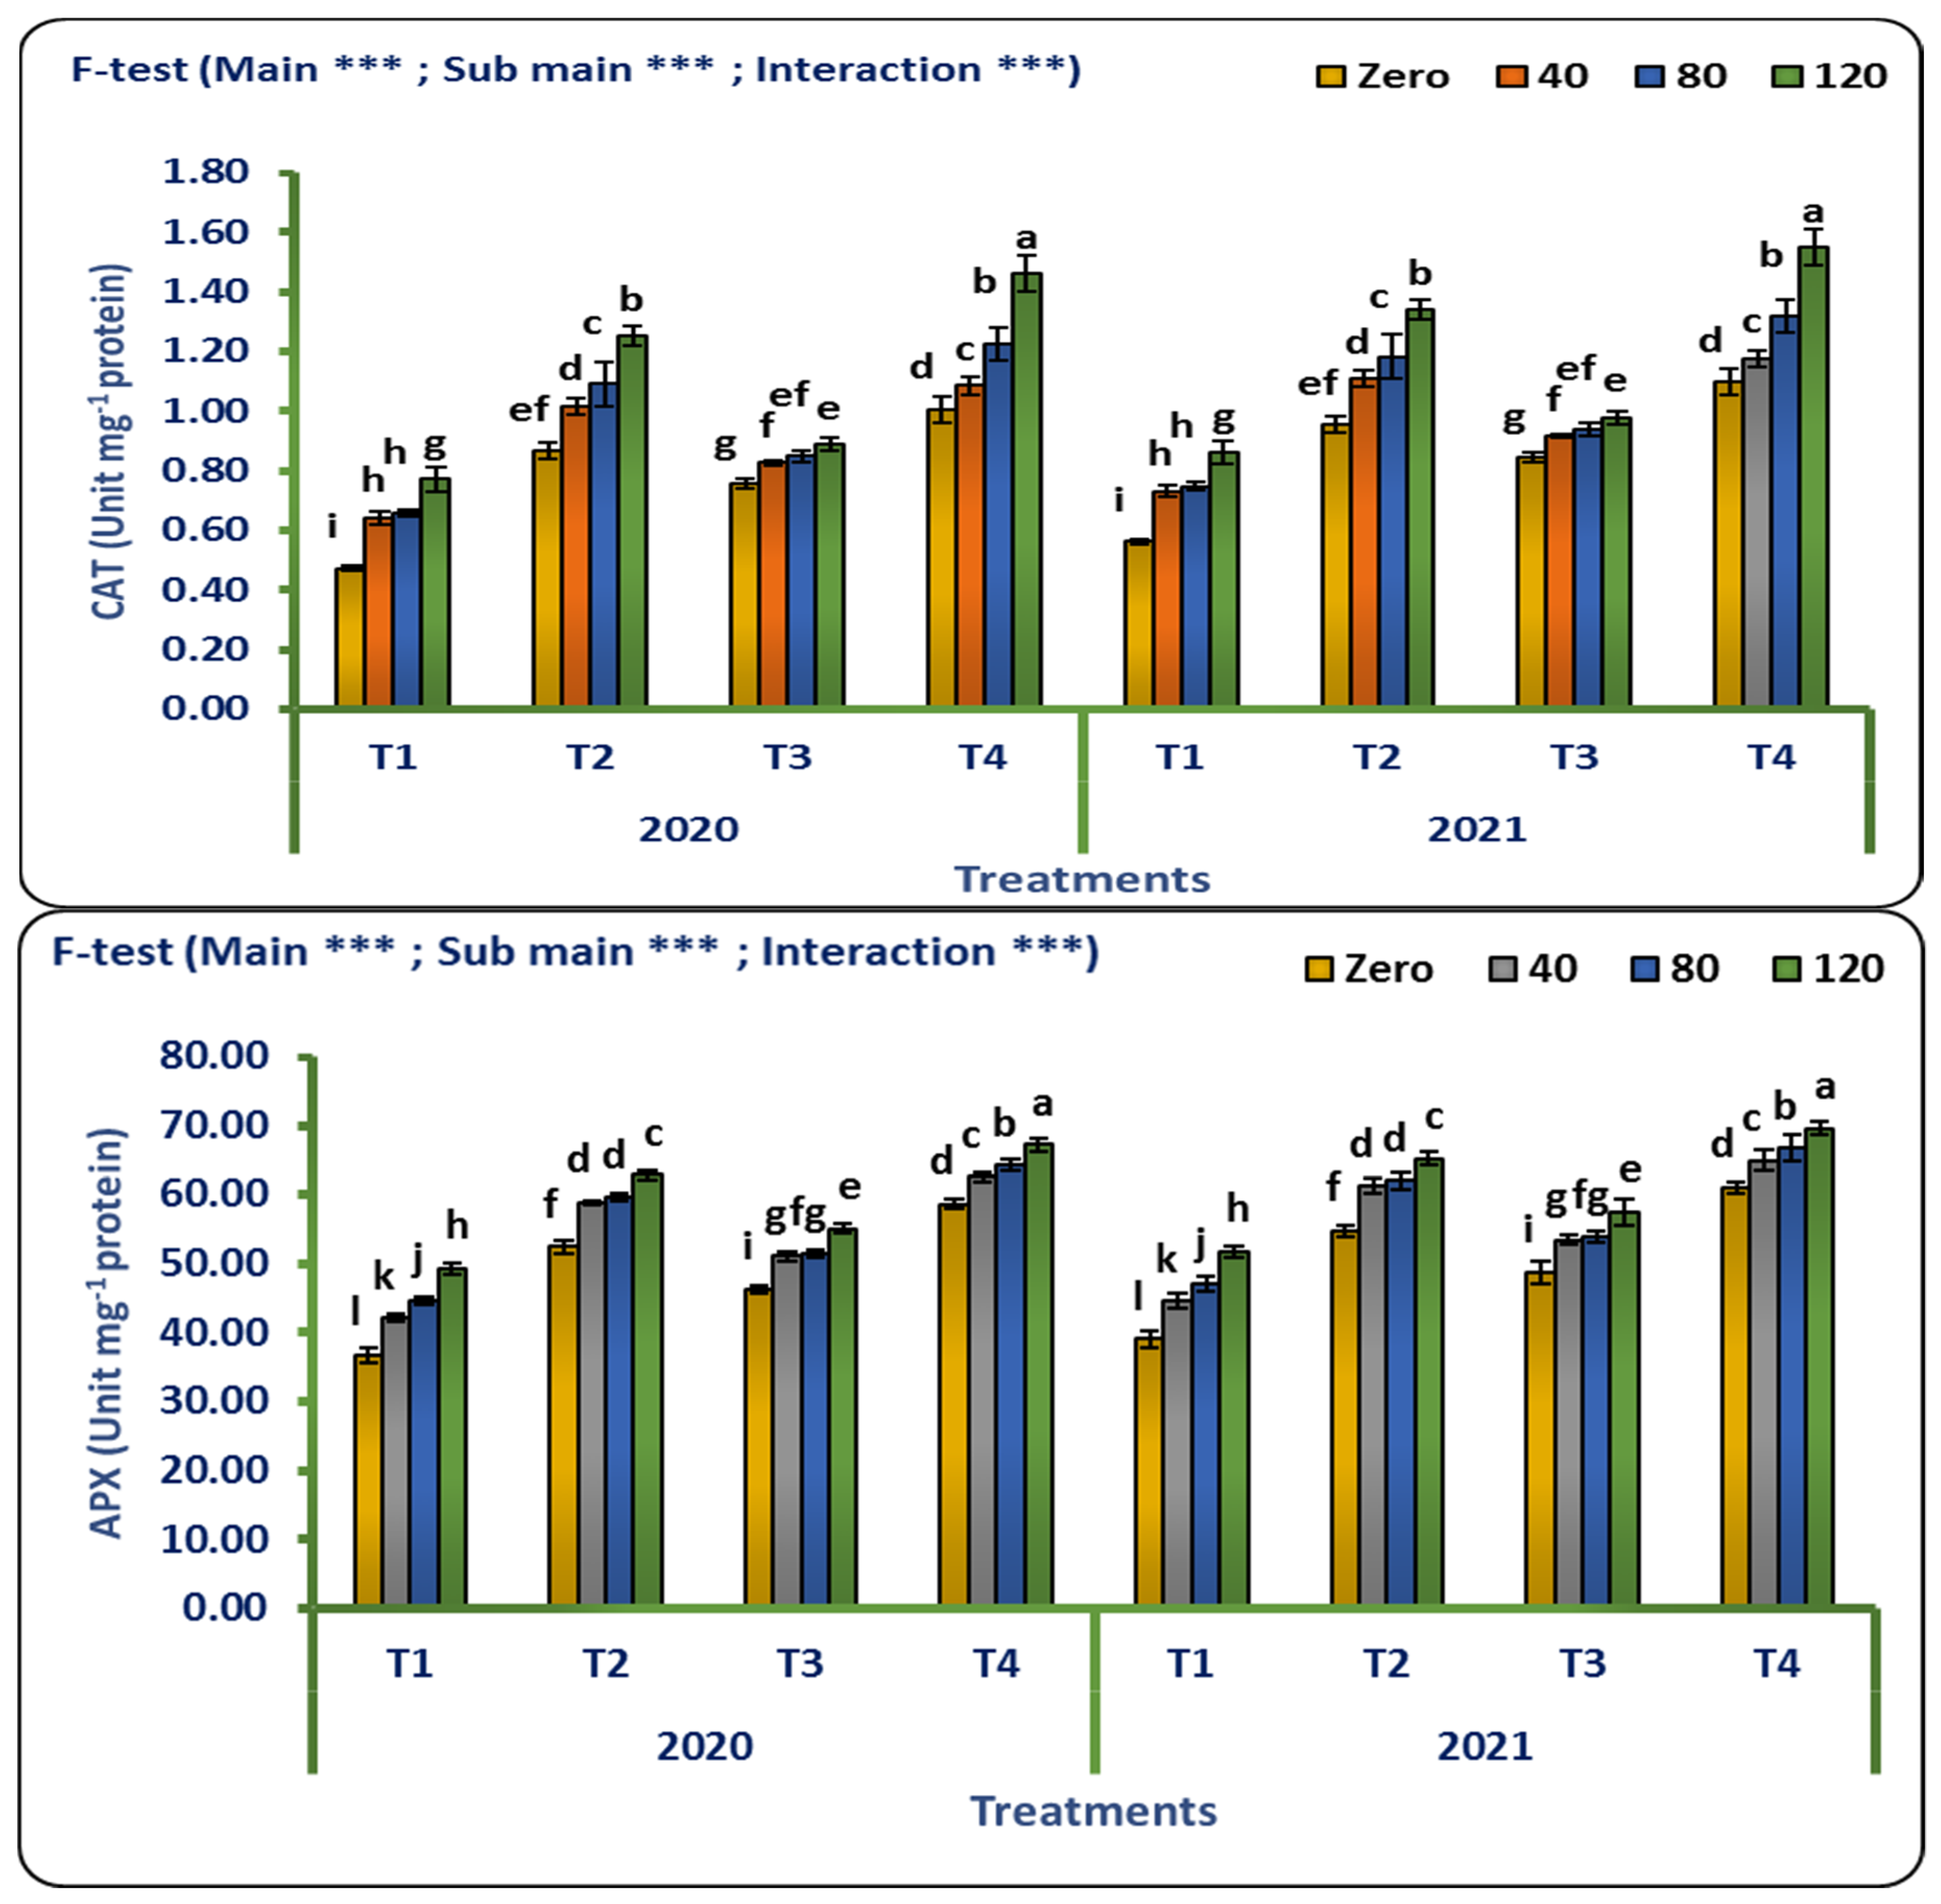
3.3.3. Activity of Antioxidant Enzymes

The data presented in Figure 3 show that the activities of catalase (CAT) and ascorbate peroxidase (APX) were significantly changed as a result of soil amendment treatments and Cd stress.
Thirty days after transplanting, soil amendments significantly decreased the antioxidant enzymes’ (APX and CAT) activity in lettuce leaves over the control under nonstressed conditions, but an increased amount of these enzymes was observed under Cd stress (Figure 3). Under Cd-stressed conditions, T4 treatment (biochar + inoculation with P. stutzeri) efficiently increased the CAT content by 1.01, 1.09, 1.23, and 1.46 unit mg−1 protein and 1.10, 1.18, 1.32, and 1.55 unit mg−1 protein for 0, 40, 80, and 120 mg Kg−1, compared with the other studied treatments in 2020 and 2021, respectively. Regarding APX activity, the highest values were observed with T4 treatment (67.17 and 69.57 unit mg−1 protein), followed by T2 treatment (62.79 and 65.19 unit mg−1 protein), compared with the control treatment (49.31 and 51.71 unit mg−1 protein), under 120 mg kg−1 Cd stress conditions during the 2020 and 2021 seasons, respectively (Figure 3).

3.3.4. Soil Microbiological Activity

Microbial biomass carbon (MBC) in sandy soil treated with Cd stress showed a significant difference between different soil amendment treatments during the two growing seasons (Table 3). MBC increased with applications of biochar (T2), inoculation with P. stutzeri (T3), and biochar + inoculation with P. stutzeri (T4) by 3.43, 3.37, and 3.49 mg g−1 soil, respectively, compared with the control treatment (T1) under 120 mg kg−1 Cd in 2020. The MBC in the pots treated with a combination with biochar + inoculation with P. stutzeri was higher than that in the pots treated with biochar or inoculation with P. stutzeri only at the same rates of Cd stress (Table 3).
The evolution of CO2 increased significantly (p < 0.05), ranging from 21.67 to 235 mg CO2/100 g soil (Table 3). Among Cd stress treatments, the maximum CO2 evolution was found in the pots treated with 40 mg kg−1 Cd, whereas the lowest was recorded in the 120 mg kg−1 Cd treatment.
For instance, lettuce plants treated with 120 mg kg−1 Cd showed significantly increased CO2 evolution values (mg CO2/100 g soil), from 21.67 (control, T1) to 89.00 (biochar, T2), 131.67 (inoculation with P. stutzeri, T3), and 175 (biochar + inoculation with P. stutzeri, T4). The same trend was observed for DHA (mg TPF g−1 soil day−1) under 120 mg kg−1 Cd stress —recorded at 208.00, followed by 164.67 and 122.00 for the T4 treatment, followed by the T3 treatment and T2 treatment, compared with the control treatment (54.67), respectively, in the first season (Table 3). Similar results were noticed in 2021. From the results mentioned above, a descending order of T4 > T3 > T2 > T1 was seen for different applications of soil amendments under different Cd concentrations.

3.3.5. Cadmium Content

The data presented in Table 4 show that lettuce plants treated by soil amendment treatments had diminished Cd content and accumulation in lettuce plant tissues. Biochar + inoculation with P. stutzeri treatment (T4) significantly reduced the Cd content and accumulation in lettuce plants. For instance, the Cd content in the control plant was 92.71 and 84.37 μg g−1 dry mass, and changed to 30.90 and 22.56 μg g−1 dry mass when lettuce plants were treated with the T4 treatment under 120 mg kg−1 Cd for root and shoots, respectively, in 2020 (Table 4). These results clearly show that treating lettuce plants with a combined treatment (biochar + inoculation with P. stutzeri) had a better effect because the Cd content was lower compared with biochar or inoculation with P. stutzeri only.
The bioconcentration factor (BCF) and translocation factor (TF) of lettuce plants under Cd stress (120 mg kg−1) illustrated that the application of biochar together with P. stutzeri significantly diminished the accumulation of Cd in plant tissues—recorded at 0.23 followed by 0.25 and 0.30 µg g−1 for the T2 treatment, followed by the T4 treatment and T3 treatment, compared with the control treatment T1 (0.77) for BCF, respectively. The same trend was observed in TF (Table 4). The same pattern was observed in the roots and shoots in 2021. From the results above, the concentrations of Cd in the roots and shoots of lettuce cultivated in treated soil with the 120 mg kg−1 Cd + combination soil amendment treatment showed a high decrease by 3- and 3.7-fold, respectively, compared with the control treatment.

4. Discussion

Anthropological activities such as smelting, mining, and excessive fertilizer use, as well as industrial waste discharge, pose a serious threat to the environment [49]. Previous studies have shown that heavy metal contamination not only alters the soil microbial community composition and activity, but also poses a threat to human health in the food chain [50].

4.1. Differential Tolerance Levels of Tested Pseudomonas Strains to Gradients’ Cadmium Concentrations

The growth patterns of Pseudomonas strains varied widely when grown in KB broth supplemented with different concentrations of Cd (0, 5, 10, 15, 20, and 25 mg L−1). Compared with the normal growth curve of the bacteria (0 Cd), it was found that the P. stutzeri strain was the most tolerant to higher applied Cd concentrations (25 mg L−1) (Figure 1). These results indicate that the organism may possess Cd resistance gene(s) that may be induced upon exposure. Some studies have shown that genes induced by Cd stress are generally inducible in nature to save energy, which can be lost if the genes are constitutively expressed even under normal conditions [31,51,52].
Additionally, the genesis of certain metal resistance mechanisms is dependent on the interactions of the metal with the cell. The cell acquires metal resistance by preventing metals from reaching sensitive cellular components or modifying them to reduce their toxicity. Heavy metal resistance can be due to one or more of several mechanisms such as (1) metal ion binding, (2) enzymes that make the cell wall of bacteria impermeable to the metal, (3) enzymes that catalyzes the conversion of metal into nontoxic forms, and (4) efflux mechanisms [34,53,54].

4.2. Cadmium Biosorption by Different Pseudomonas Strains

The biosorption of Cd by different Pseudomonas strains was significantly elevated for the concentrations tested. An increase of 55.96%, 44.28%, and 46.04% was observed at 25 mg L−1 for P. stutzeri, P. koreensis, and P. fluorescens compared with other concentrations, respectively (Figure 2). Of the three strains tested, the biosorption formed by P. stutzeri was relatively more abundant than those formed by P. koreensis and P. fluorescens. The data showed that the biosorption of Cd decreased with increasing concentrations of Cd ions. This decrease in biosorption may be attributed to there being an insufficient number of free sites for the biosorption of metals. At lower concentrations, all-metal ions in the solution could react with the binding sites, and thus the biosorption ratio was higher than that of higher ion concentrations. Similar results have been obtained by several researchers [55,56,57]—they reported that the biosorption capacity of the biomass decreased with the increasing initial concentration of heavy metals.

4.3. Pot Experiment

4.3.1. Plant Growth Analysis

The application of soil amendments (control, biochar, inoculation with P. stutzeri, and a combination) alleviated the adverse effects of Cd stress and improved the vegetative parameters of lettuce plants such as fresh and dry weight, plant height, leaf area, and the number of leaves under different concentrations of Cd stress (Table 1). Our findings revealed that lettuce plants treated with a combination treatment (biochar + inoculation with P. stutzeri) had a higher ability to enhance growth indicators, supported by soil–microbe interaction and biochar amendments to the soil.
These alterations in the growth parameters of lettuce are due to reduced Cd mobility in soils after using bioadsorbents, i.e., biochar and microorganisms. The use of microbial metabolic capacity to absorb/remove environmental pollutants provides an economical and safe alternative compared with other physical and chemical methods. On the other hand, biochar is added to soil to improve soil quality and crop productivity; it has a large surface area and a high number of functional groups, and generally has a high pH, which makes it able to immobilize heavy metal cations in soils [20]. Previous studies showed that the addition of 1% biochars (sawdust fly ash, bagasse fly ash, and rice husk ash), with 2% microorganisms (P. aeruginosa, Bacillus subtilis, and Beauveria bassiana), led to enhanced growth parameters for rice grown in Cd-contaminated soil [58]. Mondal [26] showed that biochar application (5.5 Mg ha−1) and PGPR (Rhizobium, Bacillus sp., Azotobacter, and Azospirillum) enhanced the biomass (roots and shoots) of common beans (Phaseolus vulgaris L. cv. Falguni) grown in pots treated with different levels of Cd. A similar trend was observed by [4], who found that PGPR strains (Bacillus) inoculated along with 1% biochar led to an ameliorated stress effect of Cr and the ability to improve the plant growth attributes of wheat.

4.3.2. Physiological Traits

Photosynthesis pigments and physiological properties play an important role in improving leaf health and crop performance [59]. It has been established that lettuce plants are sensitive to the adverse effects of Cd stress, which leads to a decrease in photosynthetic pigments and poorer physiological properties owing to a lack of biosynthesis. This may be due to the replacement of Mg2+ by Cd in the chlorophyll molecule [26,60]. However, soil amendment through the application of biochar and inoculation with P. stutzeri (combined treatment, T4) showed a great ability to enhance the biosynthesis of photosynthetic pigments, such as total chlorophyll, carotenoids, and total soluble sugar under sandy soil affected by Cd stress (Table 2). This is directly related to the N2 content of the leaf, which is the macronutrient needed for the development of chlorophyll [61,62]. These results can explain the increase in photosynthetic pigments found when combining biochar and inoculation with P. stutzeri in this study, which are reflected in healthy plants. Additionally, the combined treatment enhanced the synthesis of total soluble sugars and, at the same time, reduced proline levels in lettuce plants grown in soils affected by Cd stress, which may be due to the excess of hormones synthesized by P. stutzeri, resulting in increased endogenous phytohormone levels, which stimulate developmental processes such as carbohydrate and protein synthesis [63,64].

4.3.3. Antioxidant Enzymes Activities

Under abiotic stresses, such as heavy metal stress, plants increase the activity of antioxidant enzymes in their main state; this depends on the sensitivity to plant stress as a main line of defense to cope with excessive amounts of antioxidants ROS [65,66]. According to our results (Figure 3), antioxidant enzymatic activities such as CAT and APX were significantly amplified with Cd stress, as a direct result of the increased production of ROS compounds and the induction of defense systems of antioxidant enzymes as well as the neutralizing of these compounds. Thus, lettuce plants treated with biochar and inoculation with P. stutzeri under a high concentration of Cd (120 mg kg−1) showed improved antioxidant enzymatic activity compared with untreated stressed plants and control plants. From our results, it appears that antioxidant enzymatic defense systems play an important role in the defense strategies used in lettuce plants against Cd toxicity. This defense can be activated at the transcriptional level and the induction of enzymatic activity can help the plant adapt to Cd toxicity. This research indicates that the suppression of oxidative degradation is a key mechanism by which lettuce can stimulate antioxidant enzymes. A similar trend in SOD and APX enzyme activity has been reported in Phragmaites australis (roots and leaves) when exposed to Cd [67]. Additionally, an increase in Cd-induced SOD and APX activities has been reported in rye [68], Lemna polyrhiza [69], and lettuce [66].

4.3.4. Microbiological Activity in the Soil

Soil biological properties were significantly affected by Cd concentrations, soil amendments, and their interaction (Table 3). The application of Cd (especially 120 mg kg−1) significantly reduced soil biological properties’ (microbial biomass carbon (MBC), CO2, and dehydrogenase (DHA)) activities compared with the control. Under soil amendments, the highest activity (3.49 mg g−1 soil) of MBC (175 mg CO2/100 g soil) of CO2 evaluation and the highest level of DHA (208.00 mg TPF g−1 soil day−1) were recorded with the application of biochar and inoculation with P. stutzeri (combination treatment, T4) at a Cd level of 120 mg kg−1 compared with the control (Table 3).
Reduced plant growth under Cd contamination impairs plant metabolic processes by decreasing biochemical and physiological efficiency, limiting root perfusion and, consequently, the formation of organic compounds in roots. This caused a decrease in microbial biomass substrates and enzyme activities. Therefore, heavy metals denature enzyme proteins owing to interactions with enzyme active sites and substrate complexes [70]. This decrease was observed in MBC, CO2, and DHA in the current study. Several researchers have reported the detrimental effect of heavy metals (Cd) on soil biological activities [26,71]. The significant remediation effect of soil amendment with biochar and inoculation with P. stutzeri on soil biological activities is due to the lower exchangeable soil fraction of Cd, which is due to the microbial population, specific microbial groups, and physicochemical properties of soil [58]. On the other hand, biochar is a rich source of C and P and this availability of C provided a substrate for microbes, thereby increasing soil biological activities under Cd contamination [72,73].

4.3.5. Cadmium Content of Lettuce Plants

Irrespective of Cd concentrations, lettuce plants grown without soil amendments (control) showed the highest accumulation of Cd in the roots and leaves, while the addition of soil amendments significantly lowered the level of Cd in both the roots (by 67%) and the shoots (by 78%). Therefore, Cd concentrations, soil amendments, and the effects of their interaction were significant for root and leaf Cd accumulation, which reflected the bioconcentration factor (BCF) and translocation factor (TF) of lettuce plants (Table 4).
From these results, it appears that the transformation of Cd into insoluble forms is due to biosorption by microorganisms and/or biochar [74,75]. Additionally, the mechanism of Cd adsorption with biochar is mainly an electrostatic reaction owing to high adsorption by an acidic solution [76] and, during the desorption stage, H+ ions displace Cd ions bound to biochar [77]. Additionally, Suksabye [58] showed that the form for adsorption between Cd2+ and biochar in soil is stable and cannot be leached in the solution fixed on the surface of biochar (negatively charged). Additionally, under the soil treated with 15 mg kg−1 of Cd, bioaugmentation of Aeromonas sp. in the rhizosphere of Vetiveria zizanioides increased the uptake of Cd to 67.7% [16]. Several studies are underway and assess the effect of physical, chemical, and biological treatments for the remediation of heavy metals from soil such as P. japonica and organic amendments (peat moss and compost) on the growth and metal tolerance of Celosia argentea L. [2]. It was found that dual application of TiO2 NPs and P. fluorescens enhanced the Cd content and accumulation by Trifolium repens in Cd-contaminated soil [17], and a combined application of biochar and PGPR (six strains of Bacillus spp.) significantly reduced the Cr concentration by up to 0.28 ± 1.01 mg/kg in wheat plants [4].

5. Conclusions

The effect of biochar and microorganisms on Cd accumulation in lettuce plants grown in different levels of Cd-contaminated soil was investigated. Under soil treated with 120 mg kg−1 Cd, a combined treatment (biochar and inoculation with P. stutzeri) led to a significant enhancement in growth parameters—452.00 g plant−1, 40.10 g plant−1, 18.89 cm plant−1, 6.03 cm2, and 20.48 plant−1 for fresh weight, dry weight, plant height, leaf area, and number of leaves, respectively. The physiological characteristics were 1.29 mg g−1 FW, 0.35 μg g−1 FW, and 3.69 μg g−1 FW for total chlorophyll, carotenoids, and total soluble sugar, respectively. These results reflect an increase in antioxidant enzymes and soil biological activities and a decrease in Cd absorption by 67% in roots and 78% in shoots. Therefore, the current study suggested that a combined application of biochar and P. stutzeri could be used as an alternative to mitigate Cd toxicity.

Author Contributions

Conceptualization, A.E.-D.O., M.E., A.M.H. and D.K.F.; methodology, A.E.-D.O., M.E. and A.M.H.; software, A.E.-D.O.; validation, A.E.-D.O. and M.E.; formal analysis, A.E.-D.O. and M.E.; investigation, A.E.-D.O. and M.E.; resources, A.E.-D.O. and D.K.F.; data curation, A.E.-D.O., A.M.H. and M.E.; writing—original draft preparation, A.E.-D.O.; writing—review and editing, A.E.-D.O.; visualization, A.E.-D.O. and M.E.; supervision, A.E.-D.O.; funding acquisition, M.E. All authors have read and agreed to the published version of the manuscript.

Funding

This research received no external funding.

Institutional Review Board Statement

Not applicable.

Informed Consent Statement

Not applicable.

Data Availability Statement

The data that supports the findings of this study are contained within the article and available from the corresponding author upon reasonable request.

Acknowledgments

The authors extend their appreciation to the Deanship of Scientific Research at King Khalid University for funding this work through the Research Groups Project under grant number R.G.P. 1/112/42. All of the authors are grateful for the support provided by the Soils, Water, and Environment Research Institute (SWERI) and the Department of Vegetarian Restaurants, Horticultural Research Institute, Agriculture Research Center (ARC), Egypt.

Conflicts of Interest

The authors declare no conflict of interest.

References

  1. Arshad, M.; Khan, A.H.; Hussain, I.; Anees, M.; Iqbal, M.; Soja, G.; Linde, C.; Yousaf, S. The reduction of chromium (VI) phytotoxicity and phytoavailability to wheat (Triticum aestivum L.) using biochar and bacteria. Appl. Soil Ecol. 2017, 114, 90–98. [Google Scholar] [CrossRef]
  2. Iqbal, A.; Mushtaq, M.; Khan, A.; Nawaz, I.; Yousaf, S.; Iqbal, M. Influence of Pseudomonas japonica and organic amendments on the growth and metal tolerance of Celosia argentea L. Environ. Sci. Pollut. Res. 2020, 27, 24671–24685. [Google Scholar] [CrossRef] [PubMed]
  3. Wei, B.; Yang, L. A review of heavy metal contaminations in urban soils, urban road dusts and agricultural soils from China. Microchem. J. 2010, 94, 99–107. [Google Scholar] [CrossRef]
  4. Mazhar, R.; Ilyas, N.; Arshad, M.; Khalid, A.; Hussain, M. Isolation of heavy metal-tolerant PGPR strains and amelioration of chromium effect in wheat in combination with biochar. Iran. J. Sci. Technol. Trans. A Sci. 2020, 44, 1–12. [Google Scholar] [CrossRef]
  5. Boparai, H.K.; Joseph, M.; O’Carroll, D.M. Kinetics and thermodynamics of cadmium ions removal by adsorption onto nano zerovalent iron particles. J. Hazard Mater. 2011, 186, 458–465. [Google Scholar] [CrossRef] [PubMed]
  6. Gutierrez-Segura, E.; Solache-Rio, M.; Colin-Cruz, A.; Fall, C. Adsorption of cadmium by Na and Fe modified zeolitic tuffs and carbonaceous material from pyrolyzed sewage sludge. J. Env. Manag. 2012, 97, 6–13. [Google Scholar] [CrossRef]
  7. Khan, M.A.; Khan, S.; Khan, A.; Alam, M. Soil contamination with cadmium, consequences and remediation using organic amendments. Sci. Total Env. 2017, 601, 1591–1605. 8. [Google Scholar] [CrossRef] [PubMed]
  8. Balkaya, N.; Cesur, H. Adsorption of cadmium from aqueous solution by phosphogypsum. Chem. Eng. J. 2008, 140, 247–254. [Google Scholar] [CrossRef]
  9. ASTDR. Toxicological Profile for Cadmium; Prepared for US Department of Health and Human Services, Public Health Service, Agency for Toxic Substances and Disease Registry (ASTDR); ASTDR: Atlanta, GA, USA, 1999.
  10. Takahashi, R.; Ishimaru, Y.; Nakanishi, H.; Nishizawa, N.K. Role of the iron transporter OsNRAMP1 in cadmium uptake and accumulation in rice. Plant Signal. Behav. 2011, 6, 1813–1816. [Google Scholar] [CrossRef] [Green Version]
  11. Zorrig, W.; Abdelly, C.; Berthomieu, P. The phylogenetic tree gathering the plant Zn/Cd/Pb/Co P1B-ATPases appears to be structured according to the botanical families. Comptes Rendus Biol. 2011, 334, 863–871. [Google Scholar] [CrossRef]
  12. Zorrig, W.; El Khouni, A.; Ghnaya, T.; Davidian, J.C.; Abdelly, C.; Berthomieu, P. Lettuce (Lactuca sativa): A species with a high capacity for cadmium (Cd) accumulation and growth stimulation in the presence of low Cd concentrations. J. Hortic. Sci. Biotechnol. 2013, 88, 783–789. [Google Scholar] [CrossRef]
  13. Benavides, M.P.; Gallego, S.M.; Tomaro, M.L. Cadmium toxicity in plants. Braz J. Plant Physiol. 2005, 17, 21–34. [Google Scholar] [CrossRef] [Green Version]
  14. Akoto, O.; Addo, D.; Baidoo, E.; Agyapong, E.A.; Apau, J.; Fei-Baffoe, B. Heavy metal accumulation in untreated wastewater-irrigated soil and lettuce (Lactuca sativa). Environ. Earth Sci. 2015, 74, 6193–6198. [Google Scholar] [CrossRef]
  15. Ishibashi, Y.; Cervantes, C.; Silver, S. Chromium reduction in Pseudomonas putida. Appl. Environ. Microbiol. 1990, 56, 2268–2270. [Google Scholar] [CrossRef] [PubMed] [Green Version]
  16. Itusha, A.W.; Jabez, O.; Mohanasrinivasan, V. Enhanced uptake of Cd by biofilm forming Cd resistant plant growth promoting bacteria bioaugmented to the rhizosphere of Vetiveria zizanioides. Int. J. Phytoremediat. 2019, 21, 487–495. [Google Scholar] [CrossRef] [PubMed]
  17. Zand, A.D.; Alireza, M.T.; Azar, V.H. Application of titanium dioxide nanoparticles to promote phytoremediation of Cd-polluted soil: Contribution of PGPR inoculation. Bioremediat. J. 2020, 24, 171–189. [Google Scholar] [CrossRef]
  18. Novak, J.M.; Busscher, W.J.; Laird, D.L.; Ahmedna, M.; Watts, D.W.; Niandou, M.A.S. Impact of biochar amendment on fertility of a Southeastern Coastal Plain soil. Soil Sci. 2009, 174, 105–112. [Google Scholar] [CrossRef] [Green Version]
  19. Herrmann, L.; Lesueur, D. Challenges of formulation and quality of biofertilizers for successful inoculation. Appl. Microbiol. Biotechnol. 2013, 97, 8859–8873. [Google Scholar] [CrossRef] [PubMed]
  20. Beesley, L.; Moreno-Jimenez, E.; Gomez-Eyles, J.L. Effect of biochar and greenwaste compost amendments on mobility, bioavailability and toxicity of inorganic and organic contaminants in a multielement polluted soil. Env. Pollut. 2010, 158, 2282–2287. [Google Scholar] [CrossRef] [PubMed]
  21. Lehmann, J.; Rillig, M.C.; Thies, J.; Masiello, C.A.; Hockaday, W.C.; Crowley, D. Biochar effects on soil biota–a review. Soil Biol. Biochem. 2011, 43, 1812–1836. [Google Scholar] [CrossRef]
  22. Ventura, M.; Sorrenti, G.; Panzacchi, P.; George, E.; Tonon, G. Biochar reduces short-term nitrate leaching from a horizon in an apple orchard. J. Env. Qual. 2013, 42, 76–82. [Google Scholar] [CrossRef]
  23. Major, J.; Lehmann, J.; Rondon, M.; Goodale, C. Fate of soil-applied black carbon: Downward migration, leaching and soil respiration. Glob. Chang. Biol. 2010, 16, 1366–1379. [Google Scholar] [CrossRef]
  24. Lehmann, J.; da Silva, J.P.; Steiner, C.; Nehls, T.; Zech, W.; Glaser, B. Nutrient availability and leaching in an archaeological Anthrosol and a Ferralsol of the Central Amazon basin: Fertilizer, manure and charcoal amendments. Plant Soil 2003, 249, 343–357. [Google Scholar] [CrossRef]
  25. Lehmann, J.; Joseph, S. Biochar for environmental management: An introduction. In Biochar for Environmental Management: Science, Technology and Implementation, 2nd ed.; Lehmann, J., Joseph, S., Eds.; Earthscan from Routledge: London, UK, 2015; pp. 1–1214. [Google Scholar]
  26. Mondal, S.C.; Sarma, B.; Farooq, M.; Nath, D.J.; Gogoi, N. Cadmium bioavailability in acidic soils under bean cultivation: Role of soil additives. Int. J. Environ. Sci. Technol. 2020, 17, 153–160. [Google Scholar] [CrossRef]
  27. Nadeem, S.M.; Imran, M.; Naveed, M.; Khan, M.Y.; Ahmad, M.; Zahir, Z.A.; Crowley, D.E. Synergistic use of biochar, compost and plant growth-promoting rhizobacteria for enhancing cucumber growth under water deficit conditions. J. Sci Food Agric. 2017, 97, 5139–5145. [Google Scholar] [CrossRef]
  28. Singleton, P.; Sainsbury, D. Dictionary of Microbiology and Molecular Biology; Wiley: New York, NY, USA, 1987; Volume 721. [Google Scholar]
  29. Cho, J.S.; Hur, J.S.; Kang, B.H.; Kim, P.J.; Sohn, B.K.; Lee, H.J.; Jung, Y.K.; Heo, J.S. Biosorption of copper by immobilized biomass of Pseudomonas stutzer. J. Microbiol. Biotechnol. 2001, 11, 964–972. [Google Scholar]
  30. Singh, P.B.; Hatton, J.B.; Singh, B.; Cowie, L.A.; Kathuria, A. Influence of biochars on nitrous oxide emission and nitrogen leaching from two contrasting soils. J. Env. Qual. 2010, 39, 1224–1235. [Google Scholar] [CrossRef]
  31. Deb, S.; Ahmed, S.F.; Basu, M. Metal accumulation in cell wall: A possible mechanism of cadmium resistance by Pseudomonas stutzeri. Bull. Environ. Contamin. Toxicol. 2013, 90, 323–328. [Google Scholar] [CrossRef]
  32. King, E.; Ward, W.; Ramy, D. Two simple media for the demonstration of pyocyanin and fluorescence. J. Lab. Clin. Med. 1954, 44, 301–307. [Google Scholar]
  33. Massadeh, A.M.; Al-Momani, F.A.; Haddad, H.I. Removal of lead and cadmium by halophilic bacteria isolated from the Dead Sea shore, Jordan. Biol. Trace Elem. Res. 2005, 108, 259–269. [Google Scholar] [CrossRef]
  34. Omara, A.A. Study on Relationship of N2- Fixing and Phosphate–Dissolving Microorganisms with Soil Heavy Metals Pollution. Master’s Thesis, Faculty of Agriculture Mansoura University of Egypt, Mansoura, Egypt, 2009. [Google Scholar]
  35. Skradleta, V.; Gaudinova, A.; Necova, M.; Hydrakova, A. Behaviour of nodulated Pisum sativum L. under short term nitrate stress conditions. Biol. Plant 1984, 26, 364. [Google Scholar] [CrossRef]
  36. Lichtenthaler, H.K. Chlorophylls and carotenoids: Pigments of photosynthetic biomembranes. In Methods in Enzymology; Academic Press: San Diego, CA, USA, 1987; Volume 148, pp. 350–382. [Google Scholar]
  37. Hendrix, D.L. Rapid extraction and analysis of nonstructural carbohydrates in plant tissues. Crop. Sci. 1993, 33, 1306–1311. [Google Scholar] [CrossRef]
  38. Bates, L.S.; Waldren, R.P.; Teare, I.D. Rapid determination of free proline for water-stress studies. Plant Soil 1973, 39, 205–207. [Google Scholar] [CrossRef]
  39. Nakano, Y.; Asada, K. Hydrogen peroxide is scavenged by ascorbate specific peroxidase in spinach chloroplasts. Plant Cell Physiol. 1981, 5, 867–880. [Google Scholar]
  40. Rao, M.V.; Paliyath, C.; Ormrod, D.P.; Murr, D.P.; Watkins, C.B. Influence of salicylic acid on H2O2 production, oxidative stress and H2O2-metabolizing enzymes: Salicylic acidmediated oxidative damage requires H2O2. Plant Physiol. 1997, 115, 137–149. [Google Scholar] [CrossRef] [PubMed] [Green Version]
  41. Wu, J.; Joergensen, R.G.; Pommerening, B. Measurement of soil microbial biomass C by fumigation-extraction an automated procedure. Soil Biol. Biochem. 1990, 22, 1167–1169. [Google Scholar] [CrossRef]
  42. Hu, X.; Cao, C.; Zhiping, A. Size and activity of the soil microbial biomass and chemical and biological properties. Commun. Soil Sci. Plant Anal. 2007, 40, 2072–2086. [Google Scholar]
  43. Coleman, D.C.; Anderson, R.V.; Cole, C.V. Tropic interactions in soils as they affect energy and nutrient dynamics. IV. Flows of metabolic and biomass carbon. Microb. Ecol. 1978, 4, 373–380. [Google Scholar] [CrossRef]
  44. Chander, K.; Brookes, C. Is the dehydrogenase assay invalid to estimate microbial activity in copper-contaminated soils? Soil Biol. Biochem. 1991, 23, 909–915. [Google Scholar] [CrossRef]
  45. Humphries, E.C. Mineral components and ash analysis. Mod. Methods. Plant. Anal. 1956, 1, 468–502. [Google Scholar]
  46. Baker, A.J. Accumulators and excluders-strategies in the response of plants to heavy metals. J. Plant Nutr. 1981, 3, 643–654. [Google Scholar] [CrossRef]
  47. Embrandiri, A.; Rupani, P.; Shahadat, M.; Singh, R.; Ismail, S.; Ibrahim, M.; Kadir, A. The phytoextraction potential of selected vegetable plants from soil amended with oil palm decanter cake. Int. J. Recycl. Org. Waste Agric. 2017, 6, 37–45. [Google Scholar] [CrossRef] [Green Version]
  48. Duncan, D.B. Multiple range and multiple F tests. Biometrics 1955, 11, 1–42. [Google Scholar] [CrossRef]
  49. Gallego, S.M.; Pena, L.B.; Barcia, R.A.; Azpilicueta, C.E.; Iannone, M.F.; Rosales, E.P.; Zawoznik, M.S.; Groppa, M.D.; Benavides, M.P. Unravelling cadmium toxicity and tolerance in plants: Insight into regulatory mechanisms. Env. Exp. Bot. 2012, 83, 33–46. [Google Scholar] [CrossRef]
  50. Xie, Y.; Fan, J.; Zhu, W.; Amombo, E.; Lou, Y.; Chen, L.; Fu, J. Effect of heavy metals pollution on soil microbial diversity and bermudagrass genetic variation. Front. Plant Sci. 2016, 7, 755. [Google Scholar] [CrossRef] [PubMed]
  51. Haritha, A.; Sagar, K.P.; Tiwari, A.; Kiranmayi, P.; Rodrigue, A.; Mohan, P.M.; Singh, S.S. MrdH, a novel metal resistance determinant of Pseudomonas putida KT2440, is flanked by metalinducible mobile genetic elements. J. Bacteriol. 2009, 191, 5976–5987. [Google Scholar] [CrossRef] [PubMed] [Green Version]
  52. Abdelatey, L.M.; Khalil, W.K.B.; Ali, T.H.; Mahrous, K.F. Heavy metal resistance and gene expression analysis of metal resistance genes in gram positive and gram negative bacteria present in Egyptian soil. J. Appl. Sci. Env. Sanit. 2011, 6, 201–211. [Google Scholar]
  53. Trevos, J.T.; Oddie, K.M.; Belliveau, B.H. Metal resistance in bacteria FEMS Microbiol. Rev. 1985, 32, 39–54. [Google Scholar]
  54. Zhang, C.G.; Xu, H.X.; Jiang, J.N.; Zhang, C.S.C.; Li, L.; Liu, Q.S. Microbial ecology in water area polluted by high concentrations of Cd2+ and Pb2+. Chin. J. Appl. Ecol. 1993, 4, 423–429. [Google Scholar]
  55. Lu, W.B.; Shi, J.J.; Wang, C.H.; Chang, J.S. Biosorption of lead, copper and cadmium by an indigenous isolate Enterobacter sp. J1 possessing high heavy-metal resistance. J. Hazard. Mater. 2006, 134, 80–86. [Google Scholar] [CrossRef] [PubMed]
  56. Gabr, R.M.; Hassan, S.H.A.; Shoreit, A.A.M. Biosorption of lead and nickel by living and non-living cells of Pseudomonas aeruginosa ASU 6a. Int Biodeterior. Biodegrad. 2008, 62, 195–203. [Google Scholar] [CrossRef]
  57. Oh, S.E.; Hassan, S.H.; Joo, J.H. Biosorption of heavy metals by lyophilized cells of Pseudomonas stutzeri. World J. Microbiol. Biotechnol. 2009, 25, 1771–1778. [Google Scholar] [CrossRef]
  58. Suksabye, P.; Pimthong, A.; Dhurakit, P.; Mekvichitsaeng, P.; Thiravetyan, P. Effect of biochars and microorganisms on cadmium accumulation in rice grains grown in Cd-contaminated soil. Environ. Sci. Pollut. Res. 2016, 23, 962–973. [Google Scholar] [CrossRef]
  59. Salim, B.B.M.; Hikal, M.S.; Osman, H.S. Ameliorating the deleterious effects of saline water on the antioxidants defense system and yield of eggplant using foliar application of zinc sulphate. Ann. Agric. Sci. 2019, 64, 244–251. [Google Scholar] [CrossRef]
  60. Santos, D.; Duarte, B.; Caçador, I. Biochemical and photochemical feedbacks of acute Cd toxicity in Juncus acutus seedlings: The role of non-functional Cd-chlorophylls. Estuar. Coast Shelf Sci. 2015, 167, 228–239. [Google Scholar] [CrossRef]
  61. Akhtar, S.S.; Andersen, M.N.; Liu, F. Biochar mitigates salinity stress in potato. J. Agron. Crop Sci. 2015, 201. [Google Scholar] [CrossRef]
  62. Hafez, E.M.; Alsohim, A.S.; Farig, M.; Omara, A.E.-D.; Rashwan, E.; Kamara, M.M. Synergistic effect of biochar and plant growth promoting rhizobacteria on alleviation of water deficit in rice plants under salt-affected soil. Agronomy 2019, 9, 847. [Google Scholar] [CrossRef] [Green Version]
  63. Swarnalakshmi, K.; Yadav, V.; Tyagi, D.; Dhar, D.W.; Kannepalli, A.; Kumar, S. Significance of plant growth promoting rhizobacteria in grain legumes: Growth promotion and crop production. Plants 2020, 9, 1596. [Google Scholar] [CrossRef] [PubMed]
  64. Hafez, E.M.; Osman, H.S.; Gowayed, S.M.; Okasha, S.A.; Omara, A.E.-D.; Sami, R.; Abd El-Monem, A.M.; Abd El-Razek, U.A. Minimizing the adversely impacts of water deficit and soil salinity on maize growth and productivity in response to the application of plant growth-promoting Rhizobacteria and Silica nanoparticles. Agronomy 2021, 11, 676. [Google Scholar] [CrossRef]
  65. Hafez, E.M.; Omara, A.E.D.; Alhumaydhi, F.A.; El-Esawi, M.A. Minimizing hazard impacts of soil salinity and water stress on wheat plants by soil application of vermicompost and biochar. Phys. Plant. 2021, 172, 587–602. [Google Scholar] [CrossRef]
  66. Kolahi, M.; Kazemi, E.M.; Yazdi, M.; Goldson-Barnaby, A. Oxidative stress induced by cadmium in lettuce (Lactuca sativa Linn.): Oxidative stress indicators and prediction of their genes. Plant Physiol. Biochem. 2020, 146, 71–89. [Google Scholar] [CrossRef] [PubMed]
  67. Iannelli, M.; Pietrini, F.; Fiore, L.; Petrilli, L.; Massacci, A. Antioxidant response to cadmium in Phragmites australis plants. Plant Physiol. Biochem. 2002, 40, 977–982. [Google Scholar] [CrossRef]
  68. Xiao, L.; Guo, H.; Wang, S.; Li, J.; Wang, Y.; Xing, B. Carbon dots alleviate the toxicity of cadmium ions (Cd2+) toward wheat seedlings. Env. Sci. Nan. 2019, 6, 1493–1506. [Google Scholar] [CrossRef]
  69. Unadkat, K.; Parikh, P. Localization of Cadmium metal ion in Lemna polyrhiza L. using SEM morphology and EDX analysis. Environ. Conserv. J. 2019, 20, 81–86. [Google Scholar] [CrossRef]
  70. Vig, K.; Megharaj, M.; Sethunathan, N.; Naidu, R. Bioavailability and toxicity of cadmium to microorganisms and their activities in soil: A review. Adv. Env. Res. 2003, 8, 121–135. [Google Scholar] [CrossRef]
  71. Gomes, N.C.M.; Landi, L.; Smalla, K.; Nannipieri, P.; Brookes, P.C.; Renella, G. Effects of Cd- and Zn-enriched sewage sludge on soil bacterial and fungal communities. Ecotoxicol. Env. Saf. 2010, 73, 1255–1263. [Google Scholar] [CrossRef] [PubMed]
  72. Ahemad, M.; Kibret, M. Mechanisms and applications of plant growth promoting rhizobacteria: Current perspective. J. King Saud Univ. Sci. 2014, 26, 1–20. [Google Scholar] [CrossRef] [Green Version]
  73. Sarma, B.; Buragohain, S.; Nath, D.J.; Gogoi, N. Temporal responses of soil biological characteristics to organic inputs and mineral fertilizers under wheat cultivation in inceptisol. Arch. Agron. Soil Sci. 2016, 63. [Google Scholar] [CrossRef]
  74. Liu, X.; Hu, X.; Zhang, X.; Chen, X.; Chen, J.; Yuan, X. Effect of Bacillus subtilis and NTA-APG on pyrene dissipation in phytoremediation of nickel co-contaminated wetlands by Scirpus triqueter. Ecotoxicol. Env. Saf. 2018, 154, 69–74. [Google Scholar] [CrossRef]
  75. El-Nahrawy, S.; Elhawat, N.; Alshaal, T. Biochemical traits of Bacillus subtilis MF497446: Its implications on the development of cowpea under cadmium stress and ensuring food safety. Ecotoxicol. Env. Saf. 2019, 180, 384–395. [Google Scholar] [CrossRef]
  76. Zhai, Y.; Wei, X.; Zeng, G.; Zhang, D.; Chu, K. Study of adsorbent derived from sewage sludge for the removal of Cd2+, Ni2+ in aqueous solution. Sep. Purif. Technol. 2004, 38, 191–196. [Google Scholar] [CrossRef]
  77. Tajar, A.F.; Kaghazchi, T.; Soleimani, M. Adsorption of cadmium from aqueous solutions on sulfurized activated carbon prepared from nut shells. J. Hazard. Mater. 2009, 165, 1159–1164. [Google Scholar] [CrossRef] [PubMed]
Figure 1. Growth pattern of Pseudomonas strains in the absence (0 Cd) and presence of different concentrations (0, 5, 10, 15, 20, and 25 mg L−1) of Cd.
Horticulturae 07 00430 g001
Figure 2. Biosorption of different concentrations of Cd (5, 10, 15, 20, and 25 mg L−1) by Pseudomonas strains. Means followed by different letters indicate significant differences between treatments according to Duncan’s test (p < 0.05).
Horticulturae 07 00430 g002
Figure 3. Combined effects of different concentrations of Cd and soil amendments on catalase (CAT) and ascorbate peroxidase (APX) activities in lettuce leaves 30 days after transplanting. Means followed by different letters indicate significant differences between treatments according to Duncan’s test (p < 0.05). Values are means ± standard deviation (SD) from three replicates. 0:0 mg kg−1 of Cd; 40:40 mg kg−1 of Cd; 80:80 mg kg−1 of Cd; 120:120 mg kg−1 of Cd; T1: control; T2: biochar (10 ton ha−1); T3: inoculation with P. stutzeri; and T4: combination (biochar + P. stutzeri). ***: High significant.
Horticulturae 07 00430 g003
Table 1. Combined effects of different concentrations of Cd and soil amendments on the fresh weight, dry weight, plant height, leaf area, and number of leaves in lettuce plants at 70 days after transplanting during the 2020 and 2021 seasons.
TreatmentsFresh Weight
(g Plant−1)
Dry Weight
(g Plant−1)
Plant Height
(cm Plant−1)
Leaf Area
(cm2)
Number of Leaves
(Plant−1)
First season (2020)
0 T1387.00 ± 5.29 h33.88 ± 0.48 h34.30 ± 0.51 d10.74 ± 0.16 d36.80 ± 0.54 d
0 T2481.33 ± 5.13 c42.59 ± 0.56 c36.17 ± 0.59 c11.31 ± 0.18 c38.78 ± 0.62 c
0 T3427.33 ± 4.51 e37.75 ± 0.41 e33.79 ± 0.61 d10.58 ± 0.19 d36.26 ± 0.65 d
0 T4512.00 ± 6.24 a45.56 ± 0.57 a43.03 ± 0.97 a13.41 ± 0.30 a46.04 ± 1.02 a
40 T1354.33 ± 4.51 j30.91 ± 0.41 j28.12 ± 0.43 f8.85 ± 0.13 f30.26 ± 0.45 f
40 T2459.00 ± 4.58 d40.63 ± 0.42 d31.86 ± 0.87 e9.99 ± 0.27 e34.22 ± 0.92 e
40 T3401.67 ± 4.16 fg35.45 ± 0.32 fg32.09 ± 0.74 e10.06 ± 0.23 e34.46 ± 0.78 e
40 T4491.67 ± 5.03 b43.71 ± 0.46 b38.66 ± 0.87 b12.07 ± 0.27 b41.42 ± 0.92 b
80 T1336.67 ± 4.04 k29.31 ± 0.37 k26.25 ± 1.09 g8.28 ± 0.33 g28.28 ± 1.16 g
80 T2453.67 ± 2.08 d40.14 ± 0.19 d29.26 ± 0.64 f9.20 ± 0.20 f31.46 ± 0.68 f
80 T3399.00 ± 4.36 g35.28 ± 0.40 g28.97 ± 0.52 f9.11 ± 0.16 f31.16 ± 0.55 f
80 T4479.33 ± 4.04 c42.59 ± 0.37 c33.79 ± 1.06 d10.58 ± 0.32 d36.26 ± 1.12 d
120 T1298.67 ± 6.81 l25.85 ± 0.62 l13.84 ± 0.71 j4.48 ± 0.22 j15.14 ± 0.75 j
120 T2408.67 ± 6.11 f36.05 ± 0.56 f16.73 ± 0.94 i5.37 ± 0.29 i18.20 ± 0.99 i
120 T3366.00 ± 3.61 i32.28 ± 0.33 i17.87 ± 0.43 hi5.71 ± 0.13 hi19.40 ± 0.45 hi
120 T4452.00 ± 4.36 d40.10 ± 0.40 d18.89 ± 0.64 h6.03 ± 0.20 h20.48 ± 0.68 h
Second season (2021)
0 T1389.33 ± 4.93 h34.55 ± 0.86 h34.39 ± 0.50 d10.75 ± 0.16 d37.68 ± 0.54 d
0 T2484.67 ± 4.93 c43.26 ± 0.84 c36.22 ± 0.55 c11.33 ± 0.18 c39.66 ± 0.62 c
0 T3430.67 ± 5.69 e38.97 ± 0.41 f33.83 ± 0.61 d10.61 ± 0.18 d37.14 ± 0.65 d
0 T4514.00 ± 6.24 a46.78 ± 0.57 a43.07 ± 0.97 a13.42 ± 0.31 a46.92 ± 1.02 a
40 T1357.33 ± 2.08 j31.58 ± 0.95 i28.17 ± 0.39 f8.87 ± 0.13 f31.14 ± 0.45 f
40 T2461.33 ± 4.93 d42.63 ± 1.35 cd31.82 ± 0.79 e10.03 ± 0.25 e35.10 ± 0.92 e
40 T3404.00 ± 4.58 g36.67 ± 0.32 g32.13 ± 0.75 e10.08 ± 0.22 e35.34 ± 0.78 e
40 T4493.33 ± 5.51 b44.93 ± 0.46 b38.70 ± 0.87 b12.10 ± 0.28 b42.30 ± 0.92 b
80 T1339.33 ± 3.21 k29.97 ± 0.27 j26.28 ± 1.11 g8.29 ± 0.33 g29.16 ± 1.16 g
80 T2456.33 ± 2.08 d41.14 ± 1.18 de29.28 ± 0.64 f9.20 ± 0.20 f32.34 ± 0.68 f
80 T3403.67 ± 6.66 g36.50 ± 0.40 g29.01 ± 0.52 f9.13 ± 0.16 f32.04 ± 0.55 f
80 T4481.67 ± 4.51 c44.14 ± 0.90 bc33.84 ± 1.04 d10.59 ± 0.33 d37.14 ± 1.12 d
120 T1302.00 ± 7.81 l24.18 ± 2.70 k13.91 ± 0.67 j4.50 ± 0.21 j16.02 ± 0.75 j
120 T2412.67 ± 5.13 f35.94 ± 0.72 gh16.75 ± 0.95 i5.39 ± 0.29 i19.08 ± 0.99 i
120 T3369.33 ± 4.93 i32.17 ± 0.28 i17.91 ± 0.43 hi5.73 ± 0.13 hi20.28 ± 0.45 hi
120 T4454.33 ± 4.73 d40.65 ± 0.82 e18.92 ± 0.65 h6.05 ± 0.17 h21.36 ± 0.68 h
F-test
Main***************
Sub main***************
Interaction***************
Means followed by different letters indicate significant differences between treatments according to Duncan’s test (p < 0.05). Values are means ± standard deviation (SD) from three replicates. 0:0 mg kg−1 of Cd; 40:40 mg kg−1 of Cd; 80:80 mg kg−1 of Cd; 120:120 mg kg−1 of Cd; T1: control; T2: biochar (10 ton ha−1); T3: inoculation with P. stutzeri; and T4: combination (biochar + P. stutzeri); ***: High significant.
Table 2. Combined effects of different concentrations of Cd and soil amendments on total chlorophyll, carotenoids, TSS, and proline contents in lettuce leaves 30 days after transplanting during the 2020 and 2021 seasons.
TreatmentsTotal Chlorophyll
(mg g−1 FW)
Carotenoids
(μg g−1 FW)
TSS
(μg g−1 FW)
Proline
(µmol g−1 FW)
First season (2020)
0 T12.20 ± 0.03 d0.75 ± 0.04 d5.78 ± 0.07 d8.13 ± 0.10 ef
0 T22.31 ± 0.03 c0.94 ± 0.02 a6.03 ± 0.08 c8.08 ± 0.05 f
0 T32.17 ± 0.04 d0.91 ± 0.01 ab5.71 ± 0.08 d7.46 ± 0.05 hi
0 T42.71 ± 0.06 a0.96 ± 0.02 a6.96 ± 0.13 a7.22 ± 0.25 j
40 T11.84 ± 0.03 f0.64 ± 0.02 f4.94 ± 0.06 f8.60 ± 0.05 d
40 T22.06 ± 0.05 e0.86 ± 0.05 b5.45 ± 0.12 e7.54 ± 0.25 gh
40 T32.07 ± 0.04 e0.81 ± 0.02 c5.48 ± 0.10 e7.28 ± 0.05 ij
40 T42.46 ± 0.05 b0.89 ± 0.05 b6.37 ± 0.12 b6.17 ± 0.08 k
80 T11.73 ± 0.06 g0.53 ± 0.08 g4.69 ± 0.15 g8.77 ± 0.14 cd
80 T21.90 ± 0.04 f0.71 ± 0.03 de5.10 ± 0.09 f8.30 ± 0.20 e
80 T31.89 ± 0.03 f0.68 ± 0.04 ef5.06 ± 0.07 f7.68 ± 0.20 g
80 T42.17 ± 0.06 d0.70 ± 0.05 e5.71 ± 0.14 d7.49 ± 0.20 gh
120 T11.00 ± 0.04 j0.30 ± 0.02 i3.01 ± 0.10 j9.94 ± 0.15 a
120 T21.17 ± 0.06 i0.37 ± 0.02 h3.40 ± 0.13 i9.60 ± 0.20 b
120 T31.23 ± 0.03 hi0.33 ± 0.03 hi3.56 ± 0.06 hi8.97 ± 0.20 c
120 T41.29 ± 0.04 h0.35 ± 0.02 h3.69 ± 0.09 h8.79 ± 0.20 cd
Second season (2021)
0 T12.38 ± 0.03 d0.84 ± 0.04 d5.89 ± 0.07 d8.19 ± 0.10 ef
0 T22.48 ± 0.02 c1.02 ± 0.01 a6.17 ± 0.08 c8.16 ± 0.05 f
0 T32.34 ± 0.02 d0.99 ± 0.01 ab5.85 ± 0.08 d7.55 ± 0.05 gh
0 T42.90 ± 0.06 a1.03 ± 0.02 a7.09 ± 0.13 a7.27 ± 0.25 i
40 T12.02 ± 0.03 f0.73 ± 0.02 f5.05 ± 0.06 g8.66 ± 0.05 d
40 T22.22 ± 0.05 e0.94 ± 0.05 b5.59 ± 0.12 e7.63 ± 0.25 g
40 T32.26 ± 0.04 e0.89 ± 0.02 c5.61 ± 0.10 e7.37 ± 0.05 hi
40 T42.65 ± 0.05 b0.96 ± 0.05 b6.50 ± 0.12 b6.22 ± 0.08 j
80 T11.91 ± 0.06 g0.62 ± 0.08 g4.80 ± 0.15 h8.83 ± 0.14 cd
80 T22.06 ± 0.04 f0.79 ± 0.03 e5.24 ± 0.09 f8.39 ± 0.20 e
80 T32.08 ± 0.03 f0.76 ± 0.04 ef5.19 ± 0.07 fg7.73 ± 0.20 g
80 T42.36 ± 0.06 d0.77 ± 0.05 ef5.84 ± 0.14 d7.54 ± 0.20 gh
120 T11.18 ± 0.04 j0.39 ± 0.02 i3.12 ± 0.10 k10.00 ± 0.15 a
120 T21.33 ± 0.06 i0.45 ± 0.02 h3.54 ± 0.13 j9.69 ± 0.20 b
120 T31.42 ± 0.03 h0.41 ± 0.03 hi3.69 ± 0.06 ij9.02 ± 0.20 c
120 T41.48 ± 0.04 h0.43 ± 0.02 hi3.82 ± 0.09 i8.84 ± 0.20 cd
F-test
Main************
Sub main************
Interaction************
Means followed by different letters indicate significant differences between treatments according to Duncan’s test (p < 0.05). Values are means ± standard deviation (SD) from three replicates. TSS: total soluble sugar; 0:0 mg kg−1 of Cd; 40:40 mg kg−1 of Cd; 80:80 mg kg−1 of Cd; 120:120 mg kg−1 of Cd; T1: control; T2: biochar (10 ton ha−1); T3: inoculation with P. stutzeri; and T4: combination (biochar + P. stutzeri); ***: High significant.
Table 3. Combined effects of different concentrations of Cd and soil amendments on microbial biomass carbon, CO2 evaluation, and dehydrogenase of lettuce leaves 30 days after transplanting during the 2020 and 2021 seasons.
TreatmentsMicrobial Biomass Carbon
(mg g−1 Soil)
CO2 Evaluation
(mg CO2/100 g Soil)
Dehydrogenase (DHA)
(mg TPF g−1 Soil d−1)
First season (2020)
0 T14.40 ± 0.03 d110.00 ± 5.29 h143.00 ± 5.29 h
0 T24.37 ± 0.04 d150.33 ± 4.51 e183.33 ± 4.51 e
0 T34.51 ± 0.03 c204.33 ± 5.13 c237.33 ± 5.13 c
0 T44.91 ± 0.06 a235.00 ± 6.24 a268.00 ± 6.24 a
40 T14.04 ± 0.03 f77.33 ± 4.51 j110.33 ± 4.51 j
40 T24.27 ± 0.04 e124.67 ± 4.16 fg157.67 ± 4.16 fg
40 T34.26 ± 0.05 e182.00 ± 4.58 d215.00 ± 4.58 d
40 T44.66 ± 0.05 b214.67 ± 5.03 b247.67 ± 5.03 b
80 T13.93 ± 0.06 g59.67 ± 4.04 k92.67 ± 4.04 k
80 T24.09 ± 0.03 f122.00 ± 4.36 g155.00 ± 4.36 g
80 T34.10 ± 0.04 f176.67 ± 2.08 d209.67 ± 2.08 d
80 T44.37 ± 0.06 d202.33 ± 4.04 c235.33 ± 4.04 c
120 T13.20 ± 0.04 j21.67 ± 6.81 l54.67 ± 6.81 l
120 T23.43 ± 0.03 hi89.00 ± 3.61 i122.00 ± 3.61 i
120 T33.37 ± 0.06 i131.67 ± 6.11 f164.67 ± 6.11 f
120 T43.49 ± 0.04 gh175.00 ± 4.36 d208.00 ± 4.36 d
Second season (2021)
0 T14.62 ± 0.03 cd116.00 ± 5.29 h147.70 ± 5.29 h
0 T24.56 ± 0.06 d156.17 ± 4.25 e188.63 ± 5.46 e
0 T34.69 ± 0.03 c209.83 ± 5.13 c243.83 ± 5.13 c
0 T45.11 ± 0.06 a242.80 ± 6.24 a275.00 ± 6.24 a
40 T14.26 ± 0.03 f83.33 ± 4.51 j115.03 ± 4.51 j
40 T24.45 ± 0.04 e130.17 ± 4.16 g164.17 ± 4.16 g
40 T34.44 ± 0.05 e187.50 ± 4.58 d221.50 ± 4.58 d
40 T44.86 ± 0.05 b222.47 ± 5.03 b254.67 ± 5.03 b
80 T14.15 ± 0.06 g65.67 ± 4.04 k97.37 ± 4.04 k
80 T24.27 ± 0.03 f127.50 ± 4.36 g161.50 ± 4.36 g
80 T34.30 ± 0.04 f183.70 ± 0.85 d216.50 ± 1.80 d
80 T44.57 ± 0.06 d210.13 ± 4.04 c242.33 ± 4.04 c
120 T13.42 ± 0.04 j27.67 ± 6.81 l59.37 ± 6.81 l
120 T23.61 ± 0.03 i94.50 ± 3.61 i128.50 ± 3.61 i
120 T33.57 ± 0.06 i139.47 ± 6.11 f171.67 ± 6.11 f
120 T43.69 ± 0.04 h182.80 ± 4.36 d215.00 ± 4.36 d
F-test
Main*********
Sub main*********
Interaction*********
Means followed by different letters indicate significant differences between treatments according to Duncan’s test (p < 0.05). Values are means ± standard deviation (SD) from three replicates. 0:0 mg kg−1 of Cd; 40:40 mg kg−1 of Cd; 80:80 mg kg−1 of Cd; 120:120 mg kg−1 of Cd; T1: control; T2: biochar (10 ton ha−1); T3: inoculation with P. stutzeri; and T4: combination (biochar + P. stutzeri); ***: High significant.
Table 4. Combined effects of different concentrations of Cd and soil amendments on the content of Cd in the roots and shoots, bioconcentration, and translocation factors in lettuce plants 70 days after transplanting during the 2020 and 2021 seasons.
TreatmentsCd Content in Root (µg g−1)Cd Content in Shoots (µg g−1)Bioconcentration Factor (BCF)Translocation Factor (TF)
First season (2020)
0 T10.000.000.000.00
0 T20.000.000.000.00
0 T30.000.000.000.00
0 T40.000.000.000.00
40 T123.53 ± 1.00 f15.19 ± 1.00 f0.58 ± 0.02 c0.64 ± 0.02 d
40 T212.08 ± 0.75 g3.74 ± 0.75 g0.30 ± 0.02 ef0.30 ± 0.04 f
40 T313.61 ± 0.33 g5.27 ± 0.33 g0.34 ± 0.01 d0.38 ± 0.02 e
40 T47.84 ± 0.33 h5.54 ± 0.98 g0.19 ± 0.01 h0.70 ± 0.10 c
80 T165.17 ± 7.66 b56.83 ± 7.66 b0.81 ± 0.10 a0.87 ± 0.02 a
80 T222.03 ± 1.21 f13.69 ± 1.21 f0.27 ± 0.02 ef0.62 ± 0.02 d
80 T327.49 ± 2.55 e19.15 ± 2.55 e0.34 ± 0.03 d0.69 ± 0.03 c
80 T421.72 ± 2.55 f13.38 ± 2.55 f0.27 ± 0.03 ef0.61 ± 0.05 d
120 T192.71 ± 3.50 a84.37 ± 3.50 a0.77 ± 0.03 b0.91 ± 0.00 a
120 T227.96 ± 1.16 de19.62 ± 1.16 de0.23 ± 0.01 gh0.70 ± 0.01 c
120 T336.67 ± 1.17 c28.33 ± 1.17 c0.30 ± 0.01 de0.77 ± 0.01 b
120 T430.90 ± 1.17 d22.56 ± 1.17 d0.25 ± 0.01 fg0.73 ± 0.01 bc
Second season (2021)
0 T10.000.000.000.00
0 T20.000.000.000.00
0 T30.000.000.000.00
0 T40.000.000.000.00
40 T124.61 ± 1.26 f15.24 ± 0.96 f0.61 ± 0.02 c0.61 ± 0.03 ef
40 T212.10 ± 0.74 h3.81 ± 0.74 g0.30 ± 0.02 ef0.31 ± 0.04 h
40 T313.95 ± 0.84 h5.32 ± 0.35 g0.34 ± 0.02 d0.38 ± 0.01 g
40 T48.34 ± 0.82 i5.60 ± 0.98 g0.20 ± 0.02 h0.67 ± 0.09 de
80 T165.22 ± 6.99 b56.89 ± 7.66 b0.81 ± 0.10 a0.87 ± 0.03 a
80 T223.05 ± 1.03 fg13.78 ± 1.18 f0.28 ± 0.02 ef0.59 ± 0.04 f
80 T327.83 ± 3.01 e19.52 ± 2.96 e0.34 ± 0.04 d0.70 ± 0.03 cd
80 T421.91 ± 2.31 g13.75 ± 3.01 f0.27 ± 0.03 ef0.62 ± 0.07 ef
120 T191.10 ± 3.64 a84.43 ± 3.55 a0.77 ± 0.03 b0.92 ± 0.01 a
120 T228.29 ± 1.31 e19.77 ± 1.23 e0.23 ± 0.01 gh0.69 ± 0.02 cd
120 T337.34 ± 1.79 c28.92 ± 1.63 c0.31 ± 0.01 de0.77 ± 0.02 b
120 T431.28 ± 1.39 d23.56 ± 2.16 d0.26 ± 0.01 fg0.75 ± 0.04 bc
F-test
Main************
Sub main************
Interaction************
Means followed by different letters indicate significant differences between treatments according to Duncan’s test (p < 0.05). Values are means ± standard deviation (SD) from three replicates. 0:0 mg kg−1 of Cd; 40:40 mg kg−1 of Cd; 80:80 mg kg−1 of Cd; 120:120 mg kg−1 of Cd; T1: control; T2: biochar (10 ton ha−1); T3: inoculation with P. stutzeri; and T4: combination (biochar + P. stutzeri); ***: High significant.
Publisher’s Note: MDPI stays neutral with regard to jurisdictional claims in published maps and institutional affiliations.

