Article

Effects of IBA Combined with NAA/Melatonin/Citric Acid on Rooting Characteristics of Grape Rootstocks

College of Enology, Northwest A&F University, Yangling 712100, China
*
Authors to whom correspondence should be addressed.
Horticulturae 2026, 12(7), 858; https://doi.org/10.3390/horticulturae12070858
Submission received: 5 June 2026 / Revised: 11 July 2026 / Accepted: 13 July 2026 / Published: 15 July 2026
(This article belongs to the Special Issue Research on Grape Stress Resistance Cultivation and Genetic Breeding)

Highlights

What are the main findings?
  • We optimized novel IBA–melatonin (MLT) and IBA–citric acid (CA) compound rooting formulas for hardwood cuttings of seven grape rootstocks, with 400 mg/L IBA + 1.2 mM MLT screened as the optimal universal formula.
  • The optimal MLT combination significantly improved root morphology, root activity and soluble substance accumulation, and balanced endogenous hormone levels in grape rootstock cuttings.
  • Transcriptome analysis revealed that MLT promotes adventitious rooting mainly by regulating plant hormone signal transduction and MAPK signaling pathways in grape rootstocks.
What are the implications of the main findings?
  • The optimized formulas provide practical technical support for large-scale and standardized propagation of grape rootstocks.
  • The clarified physiological and molecular mechanisms advance the theoretical research on rooting regulation of woody plant cuttings.
  • This work provides a new reference for the application of MLT and CA as efficient rooting promoters in horticultural cutting propagation.

Abstract

Efficient rooting is essential for the propagation of grape rootstocks. This study aimed to identify an effective rooting formulation for hardwood cuttings and to investigate its underlying physiological and molecular mechanisms. Seven grape rootstocks were treated with indole-3-butyric acid (IBA) combined with melatonin (MLT) or citric acid (CA), with IBA plus naphthaleneacetic acid (NAA) and water serving as controls. Rooting performance was comprehensively evaluated using morphological traits, physiological characteristics, endogenous hormone contents, and transcriptome analysis. Among all treatments, 400 mg/L IBA combined with 1.2 mM MLT exhibited the best rooting performance. This treatment significantly enhanced root activity, soluble sugar, and soluble protein contents. It also increased IAA and GA3 levels and improved the IAA/ABA and GA3/ABA ratios compared with the controls. Transcriptome analysis of ‘110R’ revealed that MLT-responsive genes were mainly enriched in plant–pathogen interaction, hormone signal transduction, and MAPK signaling pathways. Transcription factor families including MYB, ERF, and NAC were identified as potential regulators. Collectively, these findings demonstrate that IBA–MLT combined application promotes rooting by regulating physiological metabolism, hormone balance, and gene expression, providing a theoretical basis for improving grape propagation efficiency.

1. Introduction

Grape (Vitis vinifera L.) is one of the most important fruit tree species in China, characterized by a long cultivation history and abundant germplasm resources. It plays a vital role in optimizing agricultural industrial structure and increasing farmers’ income. China ranks first globally in both grape cultivation area and production, highlighting the enormous scale of its grape industry [1]. However, grape production is frequently constrained by diseases and pests, soil-related stresses, and various abiotic stresses. Grafting onto resistant rootstocks has therefore become a core strategy for addressing these challenges and achieving high-quality and efficient grape cultivation. Excellent rootstocks can not only significantly enhance plant resistance to drought, salinity, soil-borne diseases, and other adverse conditions, but also regulate vine vigor and improve fruit quality [2,3,4]. At present, several resistant grape rootstocks, such as ‘Beta’ (Vitis berlandieri × Vitis riparia) and ‘5BB’(V. berlandieri × V. riparia), have been introduced and widely utilized in China [5].
The selection of grapevine rootstocks is a crucial factor influencing adventitious root formation and subsequent vineyard performance, as different rootstocks exhibit substantial genetic and physiological variability in rooting capacity, stress tolerance, and nutrient uptake efficiency [6,7]. In this study, seven widely used grapevine rootstocks, including ‘101-14’, ‘SO4’, ‘Beta’, ‘1103P’, ‘3309’, ‘110R’, and ‘5BB’, were selected to represent diverse genetic backgrounds derived from Vitis riparia, Vitis berlandieri, and Vitis rupestris hybridization systems [8]. These rootstocks have been extensively documented to differ in vigor, drought resistance, and rooting performance, making them ideal materials for comparative studies on adventitious root formation. For instance, ‘101-14 Mgt’ (V. riparia × V. rupestris) is known for its high rooting ability and adaptability to calcareous soils, whereas ‘1103P’ (V. berlandieri × V. rupestris) exhibits strong drought tolerance but relatively slower rooting initiation [9,10]. Similarly, ‘SO4’ and ‘3309C’ show contrasting responses in carbohydrate allocation and auxin sensitivity during root induction [11,12]. Overall, these genotype-dependent differences are closely associated with endogenous auxin metabolism, carbohydrate availability, and antioxidant capacity, which jointly determine rooting efficiency and root system architecture.
Vegetative propagation through cuttings is the primary approach for preserving the desirable traits of rootstocks and realizing large-scale nursery production. However, significant differences exist in the rooting ability among grape rootstock genotypes, and some elite genotypes exhibit poor adventitious root formation, which has become a major bottleneck limiting their commercial application. Therefore, improving rooting efficiency is crucial for grape rootstock propagation [13,14]. Among exogenous regulators, indole-3-butyric acid (IBA) remains the most widely used auxin for promoting rooting in hardwood cuttings due to its high stability and strong ability to induce root primordia formation. In commercial and experimental systems, IBA is often combined with naphthaleneacetic acid (NAA) to enhance rooting efficiency; however, the response is highly genotype-dependent and sometimes leads to inconsistent root quality or abnormal shoot development. Given these limitations, researchers have increasingly explored alternatives to conventional auxin mixtures. In recent years, increasing attention has been given to combining IBA with emerging plant growth regulators such as melatonin (MT) and citric acid (CA) as potential alternatives to conventional auxin mixtures. Melatonin, a multifunctional indoleamine molecule, has been widely reported to regulate plant growth and stress adaptation through antioxidant defense, redox homeostasis, and hormonal signaling modulation. Recent studies have demonstrated that exogenous melatonin significantly enhances adventitious root formation in woody and horticultural plants by promoting auxin accumulation and activating auxin-responsive genes, thereby improving root initiation and elongation capacity [15,16]. Importantly, accumulating evidence suggests a strong functional interaction between melatonin and auxin signaling pathways, where melatonin can regulate endogenous indole-3-acetic acid (IAA) biosynthesis, polar auxin transport, and the expression of key auxin-responsive genes involved in root development [17,18]. For example, melatonin has been shown to enhance adventitious rooting by increasing endogenous IAA levels and modulating ROS-scavenging systems in grapevine and other species [19]. In addition, citric acid, a central intermediate of the tricarboxylic acid (TCA) cycle, has been reported to improve root system architecture by enhancing energy metabolism, nutrient uptake efficiency, and stress tolerance, although its role in adventitious rooting regulation remains relatively underexplored compared with phytohormones [20,21]. Despite these advances, most existing studies focus on single-factor treatments, and limited information is available regarding the synergistic or comparative effects of IBA combined with melatonin or citric acid on woody plant cutting propagation.
Although IBA-based rooting systems have been widely applied, several critical knowledge gaps remain. First, systematic comparisons between conventional IBA–NAA formulations and emerging IBA–melatonin or IBA–citric acid combinations are still scarce, particularly in economically important woody crops such as grapevine rootstocks. Second, most studies primarily focus on morphological rooting parameters, while the integrated regulatory mechanisms involving physiological metabolism, endogenous hormone balance, and transcriptional regulation remain insufficiently characterized. Third, genotype-dependent responses to exogenous regulators are often reported but rarely linked to molecular mechanisms, limiting the development of universally effective rooting strategies. Furthermore, although melatonin–auxin crosstalk has been suggested to play a central role in root development, the precise regulatory networks underlying this interaction, especially in woody cutting systems, are still poorly understood. Therefore, a comprehensive analysis integrating rooting morphology, physiological traits, hormone profiling, and transcriptome data is urgently needed to clarify the regulatory mechanisms of exogenous hormone combinations in adventitious root formation.
Based on these gaps, the present study aims to evaluate the effects of IBA combined with melatonin or citric acid on adventitious root formation in multiple grape rootstocks, compare their performance with the conventional IBA–NAA treatment, and elucidate the physiological and molecular mechanisms underlying rooting regulation through integrated morphological, physiological, hormonal, and transcriptomic analyses. We hypothesize that melatonin or citric acid, when combined with IBA, can more effectively enhance Adventitious root formation is a complex developn than traditional IBA–NAA treatments by regulating endogenous auxin homeostasis, improving energy metabolism, and activating key signaling pathways such as plant hormone signal transduction and MAPK cascades, thereby leading to improved rooting efficiency and genotype adaptability.
In the present study, seven grape rootstocks (‘101-14’, ‘SO4’, ‘Beta’, ‘1103P’, ‘3309’, ‘110R’, and ‘5BB’) were used as experimental materials. Hardwood cuttings were treated with IBA combined with different concentrations of MLT or CA to evaluate their effects on rooting performance. We hypothesized that these novel formulations would promote adventitious root formation by regulating endogenous hormone balance and activating key physiological and molecular pathways. To test this, we measured root morphological traits, physiological indices, hormone contents, and transcriptomic profiles. The aim was to identify efficient and stable rooting formulations and to provide a theoretical basis for large-scale grape rootstock propagation.

2. Materials and Method

2.1. Experimental Materials

This study was conducted from 2024 to 2025 at the Grape Experimental Base of Northwest A&F University and the Grape Stress Physiology Laboratory of the College of Enology. The experimental vineyard is located in Caoxin Village, Yangling District, Xianyang City, Shaanxi Province, China (108°4′52.1″ E, 34°16′21.8″ N). The region is characterized by a warm temperate, semi-humid, and semi-arid climate. During the summer experimental period, the average temperature ranged from 15 °C to 27 °C, with a historical extreme maximum temperature of 41.9 °C.
The experimental materials were collected from a vineyard with sandy loam and cinnamon soil. Standard vineyard management practices were followed throughout the growing season. Fertilization consisted of organic fertilizer combined with N–P–K compound fertilizer according to local production recommendations. The vineyard was equipped with a drip irrigation system, and irrigation was applied as required. Pest and disease management was conducted following local viticultural practices, and thiamethoxam and spinetoram were applied when necessary to control insect pests and maintain healthy vine growth.
Seven grape rootstock cultivars, namely ‘101-14’, ‘SO4’, ‘Beta’, ‘1103P’, ‘3309’, ‘110R’, and ‘5BB’, were used as plant materials in this study. To ensure the reliability and comparability of the experimental data, one-year-old healthy grapevines with uniform growth vigor and consistent cultivation conditions were selected for each cultivar as experimental materials.

2.2. Experimental Methods

The study consisted of two sequential experiments. The first experiment (air layering, Section 2.2.1) was a preliminary screening designed to identify the optimal auxin formulation from a range of IBA and NAA concentrations. Air layering was selected for this initial step because it enables rapid rooting assessment while minimizing carbohydrate and water stress confounders. Meanwhile s (Section 3.1) identified 400 mg/L IBA + 200 mg/L NAA as the optimal auxin combination. The second experiment (hardwood cutting, Section 2.2.2) was subsequently conducted to test whether MLT or CA could further enhance rooting when added to this auxin baseline. Hardwood cuttings were used in this confirmatory phase because they reflect the actual commercial propagation system. Thus, the first experiment established the auxin foundation, and the second evaluated the supplementary effects of MLT and CA against this baseline.

2.2.1. Experiment on Combined Rooting Formulations of NAA and IBA

The experiment was conducted from July to August 2024 at the Caoxinzhuang Experimental Base of Northwest A&F University. The grape air-layering method described by Zhang Ning and Liu Shuang (2012) was adopted with slight modifications [22]. Vigorous and uniformly growing fruiting shoots from the middle and upper portions of the vines were selected as experimental materials. Two to three leaves near the fruiting mother branch were removed, and a girdling treatment was performed on the shoot bark. The wounding length was approximately 1 cm, with the depth reaching the cambium layer without damaging the xylem tissue.
Subsequently, the prepared rooting formulations were evenly applied to the girdled area. An air-layering rooting box was then installed and filled with a substrate consisting of peat, vermiculite, and perlite mixed at a volume ratio of 1:1:1 (v/v/v), followed by sealing and fixation. During the layering period, watering was carried out every 3–4 days to maintain adequate substrate moisture. Samples were collected and investigated 28 days after treatment.
The experiment employed a completely randomized design with a total of nine treatments. Different combinations of indole-3-butyric acid (IBA) (Sigma-Aldrich, St. Louis, MO, USA) and naphthaleneacetic acid (NAA) (Sigma-Aldrich, St. Louis, MO, USA) at varying concentrations were used as experimental treatments. A treatment containing 400 mg/L ABT No.2 rooting powder (Beijing Aoboxing Biotech Co., Ltd., Beijing, China) served as the positive control, while distilled water treatment was used as the blank control (CK). Detailed treatment formulations are shown in Table 1.
For each treatment, nine healthy shoots with uniform thickness and vigorous growth were selected for air-layering, and three biological replicates were established.

2.2.2. Preparation of Cuttings and Cutting Conditions

The hardwood cutting procedure described by Zhang Dan et al. (2022) was adopted with slight modifications [23]. During the winter pruning season, healthy one-year-old canes exhibiting full maturation, plump buds, and free from visible diseases and pests were selected as experimental materials. The shoots were cut into segments measuring 5–8 cm in length, each retaining two buds. The upper end of each cutting was trimmed horizontally at 1.5–2.0 cm above the bud, while the lower end was cut obliquely approximately 1.0 cm below the bud to facilitate rooting.
Following preparation, the cuttings were surface-sterilized by immersion in 800-fold diluted 50% carbendazim solution for 30 min. After sterilization, the basal portions of the cuttings were soaked in the respective rooting agent solutions for 2 h prior to planting.
The rooting substrate consisted of peat, vermiculite, and perlite mixed at a volume ratio of 1:1:1 (v/v/v). The substrate was disinfected by spraying with 800-fold diluted 50% carbendazim solution (Jiangsu Pesticide Co., Ltd., Nanjing, China) and subsequently air-dried under natural conditions before being transferred into foam seedling trays for use.
The cutting experiment was conducted in January 2025 in a greenhouse under semi-natural light conditions. The greenhouse air temperature was maintained at 20 ± 2 °C, while plastic film covering was applied to maintain relative air humidity at 70% ± 5%. An electrically heated seedbed system was used to regulate the substrate temperature at 28 ± 2 °C. For each grape rootstock cultivar and treatment, 30 cuttings were prepared, with three biological replicates established for each treatment.

2.2.3. Design of Rooting Agent Treatments

The experiment was conducted using a completely randomized design with a total of eight treatments. In all treatments, the concentration of indole-3-butyric acid (IBA) was maintained at 400 mg/L. The previously screened combined formulation of IBA and naphthaleneacetic acid (NAA) (IN) was used as the hormone control, while distilled water treatment served as the blank control (CK). Detailed compositions of the different treatments are presented in Table 2.
The concentrations of MLT and CA used in this experiment were selected based on previous reports and preliminary considerations of concentration-dependent rooting responses. For MLT, three concentrations, 0.8, 1.0, and 1.2 mM, were chosen to represent a narrow effective range that has been reported to promote root development, auxin-related signaling, and stress adaptation in horticultural and woody plants. For CA, concentrations of 0.1%, 0.3%, and 0.5% were selected as low, medium, and relatively high levels, respectively, because citric acid has been reported to affect root morphology, energy metabolism, nutrient availability, and stress-related physiological processes. All MLT and CA treatments were combined with a fixed basal concentration of 400 mg/L IBA to compare their supplementary effects under the same auxin background. The IBA + NAA treatment, previously screened in the air-layering experiment, was used as the conventional auxin control.

2.2.4. Determination of Rooting Morphological Traits

At 28 days after cutting, the numbers of rooted and sprouted cuttings in each treatment were recorded, and the rooting rate and sprouting rate were calculated according to the following formulas:
Rooting rate (%) = Number of rooted cuttings/Total number of cuttings × 100%
Sprouting rate (%) = Number of sprouted cuttings/Total number of cuttings × 100%
Root morphological characteristics of the cuttings were determined using a root scanning analysis system (Wanshen, Hangzhou, China), including average root number, average root length, and average root diameter.

2.2.5. Comprehensive Evaluation of Rooting Performance

A membership function method was employed to comprehensively evaluate the rooting performance of different treatments. The membership function was calculated using the following formula:
U ( X i ) = X i X m i n X m a x X m i n
where U ( X i ) represents the membership function value of the i -th index, X i represents the measured value of the corresponding index, and X m a x and X m i n   represent the maximum and minimum values of that index among all treatments, respectively.
The average value of the membership function values for all evaluated indices was used as the comprehensive evaluation index. A higher value indicated a better overall rooting performance.

2.2.6. Determination of Root Physiological Indices

Based on the comprehensive evaluation results obtained from the membership function analysis, the treatments IM1, IC2, IN, and CK, which exhibited relatively superior overall rooting performance, were selected for the determination of root physiological indices. Newly formed root samples were collected at 28 days after cutting, immediately frozen in liquid nitrogen, and stored at −80 °C for subsequent analyses.
Root soluble sugar content was determined using the anthrone colorimetric method (anthrone from Sigma-Aldrich, St. Louis, MO, USA) [24]. Briefly, 0.20 g of fresh root tissue was ground thoroughly in liquid nitrogen, followed by the addition of 10 mL distilled water. The mixture was extracted in a boiling water bath for 30 min and subsequently cooled to room temperature. After centrifugation at 8000× g for 10 min, the supernatant was collected for analysis. A 0.5 mL aliquot of the extract was transferred into a test tube, followed by the addition of 5 mL freshly prepared anthrone–sulfuric acid reagent. The mixture was thoroughly mixed and reacted in a boiling water bath for 10 min, then rapidly cooled to room temperature. Distilled water was used as the blank control, and absorbance was measured at 620 nm. A standard curve was established using glucose standard solutions, and soluble sugar content was calculated accordingly. The results were expressed as mg/g fresh weight (FW).
Root soluble protein content was determined using the Coomassie Brilliant Blue G-250 method (Bio-Rad, Hercules, CA, USA) [25]. Approximately 0.20 g of fresh root tissue was homogenized in 5 mL phosphate buffer solution (pH 7.0) under ice-bath conditions. The homogenate was centrifuged at 12,000× g and 4 °C for 15 min, and the supernatant was collected as the crude enzyme extract. Subsequently, 0.1 mL of the extract was mixed with 5 mL Coomassie Brilliant Blue G-250 reagent and incubated at room temperature for 2 min. Phosphate buffer solution was used as the blank control, and absorbance was measured at 595 nm. A standard curve was generated using bovine serum albumin (BSA) standard solutions, and soluble protein content was calculated based on the standard curve. The results were expressed as mg/g FW.
Root activity was determined using a modified triphenyl tetrazolium chloride (TTC) method [26]. Briefly, 0.50 g of fresh root tissue was incubated with 5 mL of 0.4% TTC solution and 5 mL phosphate buffer solution (pH 7.0) in the dark at 37 °C for 2 h. After incubation, the reaction was terminated by adding 2 mL of 1 mol/L sulfuric acid. The root samples were then removed, gently blotted dry with filter paper, and cut into small pieces. Subsequently, 10 mL ethyl acetate was added to extract the red triphenyl formazan (TTF) pigment in a boiling water bath until the root tissues were completely decolorized. After cooling, the extract volume was adjusted to a constant volume, and absorbance was measured at 485 nm. Root activity was calculated according to the TTF standard curve, and the results were expressed as μg/(g·h).

2.2.7. Determination of Endogenous Hormone Contents in Roots

For hormone analysis, root samples were collected from each treatment, immediately frozen in liquid nitrogen, and stored at −80 °C until analysis. Approximately 0.2 g of frozen tissue was ground into a fine powder in liquid nitrogen and extracted with methanol/water/formic acid (79:20:1, v/v/v) at 4 °C for 12 h. The extract was centrifuged at 12,000× g for 15 min at 4 °C, and the supernatant was collected and filtered through a 0.22 μm membrane filter prior to instrumental analysis. The endogenous contents of indole-3-acetic acid (IAA), gibberellic acid (GA3), abscisic acid (ABA), jasmonic acid (JA), and salicylic acid (SA) in root tissues were quantified using liquid chromatography–tandem mass spectrometry (LC–MS/MS) [27].
Chromatographic separation was on a Shim-pack XR-ODS III column (2.0 mm × 75 mm, 1.6 μm) (Shimadzu, Kyoto, Japan). The mobile phase consisted of 5 mmol/L ammonium formate containing 0.05% formic acid and methanol. The flow rate was maintained at 0.3 mL/min, the column temperature was set at 40 °C, and the injection volume was 5 μL. External standards of IAA, GA3, ABA, JA, and SA were used for identification and quantification; calibration curves were prepared using different concentrations of the standards, and hormone contents were calculated according to the corresponding standard curves. Three biological replicates were included for each treatment to ensure the reliability and reproducibility of the experimental data.

2.3. Transcriptome Sequencing and Bioinformatics Analysis

2.3.1. Sample Collection, RNA Extraction, Library Construction, and Sequencing

To further elucidate the molecular mechanisms underlying melatonin-mediated regulation of adventitious root formation in grape rootstocks, the grape rootstock cultivar ‘110R’, which exhibited a representative rooting response, was selected for transcriptome sequencing analysis.
Cuttings treated with 1.0 mM melatonin (MLT) (Aladdin, Shanghai, China) and distilled water (CK) were sampled, and newly formed root tip tissues were collected at 21 days after treatment. Three independent biological replicates were established for each treatment. Immediately after collection, all samples were rapidly frozen in liquid nitrogen and subsequently stored at −80 °C until further analysis.
Total RNA extraction, RNA quality assessment, cDNA library construction, and Illumina-based high-throughput sequencing were performed by Shanghai Majorbio Bio-pharm Technology Co., Ltd. (Shanghai, China). Only RNA samples that satisfied the quality requirements for integrity, purity, and concentration were used for subsequent library preparation and sequencing. The raw sequencing data generated were subsequently subjected to quality control, reference genome alignment, identification of differentially expressed genes (DEGs), and downstream functional enrichment analyses.

2.3.2. Sequencing Data Quality Control and Reference Genome Alignment

Raw sequencing reads were subjected to stringent quality control procedures to remove adapter sequences, low-quality reads, and reads containing a high proportion of ambiguous nucleotides (N bases), thereby obtaining high-quality Clean reads for subsequent analyses.
The filtered Clean reads were subsequently aligned to the grape reference genome for transcriptomic analysis. Differential gene expression profiles among samples were statistically analyzed and summarized using the cloud-based bioinformatics platform provided by Shanghai Majorbio Bio-pharm Technology Co., Ltd.

2.3.3. Identification of Differentially Expressed Genes and Functional Enrichment Analysis

Gene expression levels among different treatment groups were normalized and analyzed for differential expression using the DESeq2 software package (version 1.40.0). Genes with |log2FC| ≥ 1 and padj < 0.05 were identified as differentially expressed genes (DEGs). The numbers of upregulated and downregulated DEGs were subsequently statistically summarized.
Functional enrichment analysis of the identified DEGs was conducted using the cloud-based bioinformatics platform provided by Shanghai Majorbio Bio-pharm Technology Co., Ltd. Gene Ontology (GO) enrichment analysis was performed to classify DEG functions into three major categories: biological process (BP), cellular component (CC), and molecular function (MF), thereby revealing the functional distribution characteristics of the DEGs. In addition, Kyoto Encyclopedia of Genes and Genomes (KEGG) pathway enrichment analysis was carried out to identify significantly enriched metabolic pathways and signal transduction pathways.
Through these analyses, the molecular mechanisms underlying the regulation of adventitious root formation in the grape rootstock ‘110R’ under different treatments were further elucidated.

2.3.4. Analysis of Transcription Factors and Key Pathway-Related Genes

Based on the annotation results of differentially expressed genes (DEGs), transcription factors were identified from the DEG dataset and subsequently classified into their corresponding families. Particular emphasis was placed on transcription factor families closely associated with plant hormone signal transduction, cell division and differentiation, stress responses, and adventitious root formation, including ERF, MYB, NAC, bHLH, WRKY, GRAS, AUX/IAA, and ARF.
Combined with the KEGG enrichment results, pathways specifically enriched under melatonin treatment and closely related to adventitious root development were further screened and analyzed. These pathways mainly included the plant–pathogen interaction pathway, plant hormone signal transduction pathway, and plant MAPK signaling pathway. Furthermore, heatmaps of key gene expression profiles were generated to comparatively analyze the expression patterns of core regulatory genes among different treatments, thereby providing deeper insight into the molecular regulatory mechanisms underlying melatonin-mediated adventitious root formation in grape rootstocks.

2.4. Data Analysis

All statistical analyses were performed using SPSS 20.0, and figures were generated using GraphPad Prism 10. Although the experimental design comprises two factors (7 rootstock cultivars × 8 treatments), the primary objective of this study was not to quantify the abstract interaction effects between genotype and treatment—which are expected to be significant given the high genetic variability in rooting capacity—but rather to screen the optimal rooting formulation within the context of each genotype, a standard and practical strategy in rootstock cutting propagation research.
Accordingly, our analytical strategy specifically employed one-way analysis of variance (one-way ANOVA) to evaluate differences among treatments within each rootstock cultivar, followed by Duncan’s multiple range test (p < 0.05) for post hoc comparisons. This approach was chosen for three principal reasons. First, due to the substantial inherent differences in rooting ability among grape rootstocks (e.g., vigorous ‘101-14’ vs. slow-rooting ‘5BB’), pooling all data into a two-way ANOVA model would severely violate the assumption of homogeneity of variances (as verified by Levene’s test), potentially yielding unreliable interaction p-values and diluting the significant treatment effects observable within specific cultivars. Second, the key evaluation metric in this study—the comprehensive membership function value—is a non-parametric, rank-based index constructed specifically to handle multi-dimensional heterogeneous traits within each cultivar. This index is inherently incompatible with the parametric assumptions of a two-way general linear model. Third, our experimental design prioritized sufficient replication (30 cuttings per treatment per cultivar) to ensure robust within-cultivar comparisons rather than a balanced factorial decomposition aimed at testing global interaction terms.
Therefore, the combination of cultivar-specific one-way ANOVA and membership function-based comprehensive evaluation provides a straightforward, statistically defensible, and practically relevant framework that directly addresses the core objective of formulation screening. We acknowledge that a two-way ANOVA could offer global main effects and interaction estimates; however, such an approach would not effectively answer the specific formulation-selection questions central to this study. All reported differences were considered statistically significant at p < 0.05.

3. Results and Analysis

3.1. Experiment on Combined Rooting Formulations of IBA and NAA

3.1.1. Effects of Combined IBA and NAA Formulations on the Rooting Rate of Grape Rootstocks

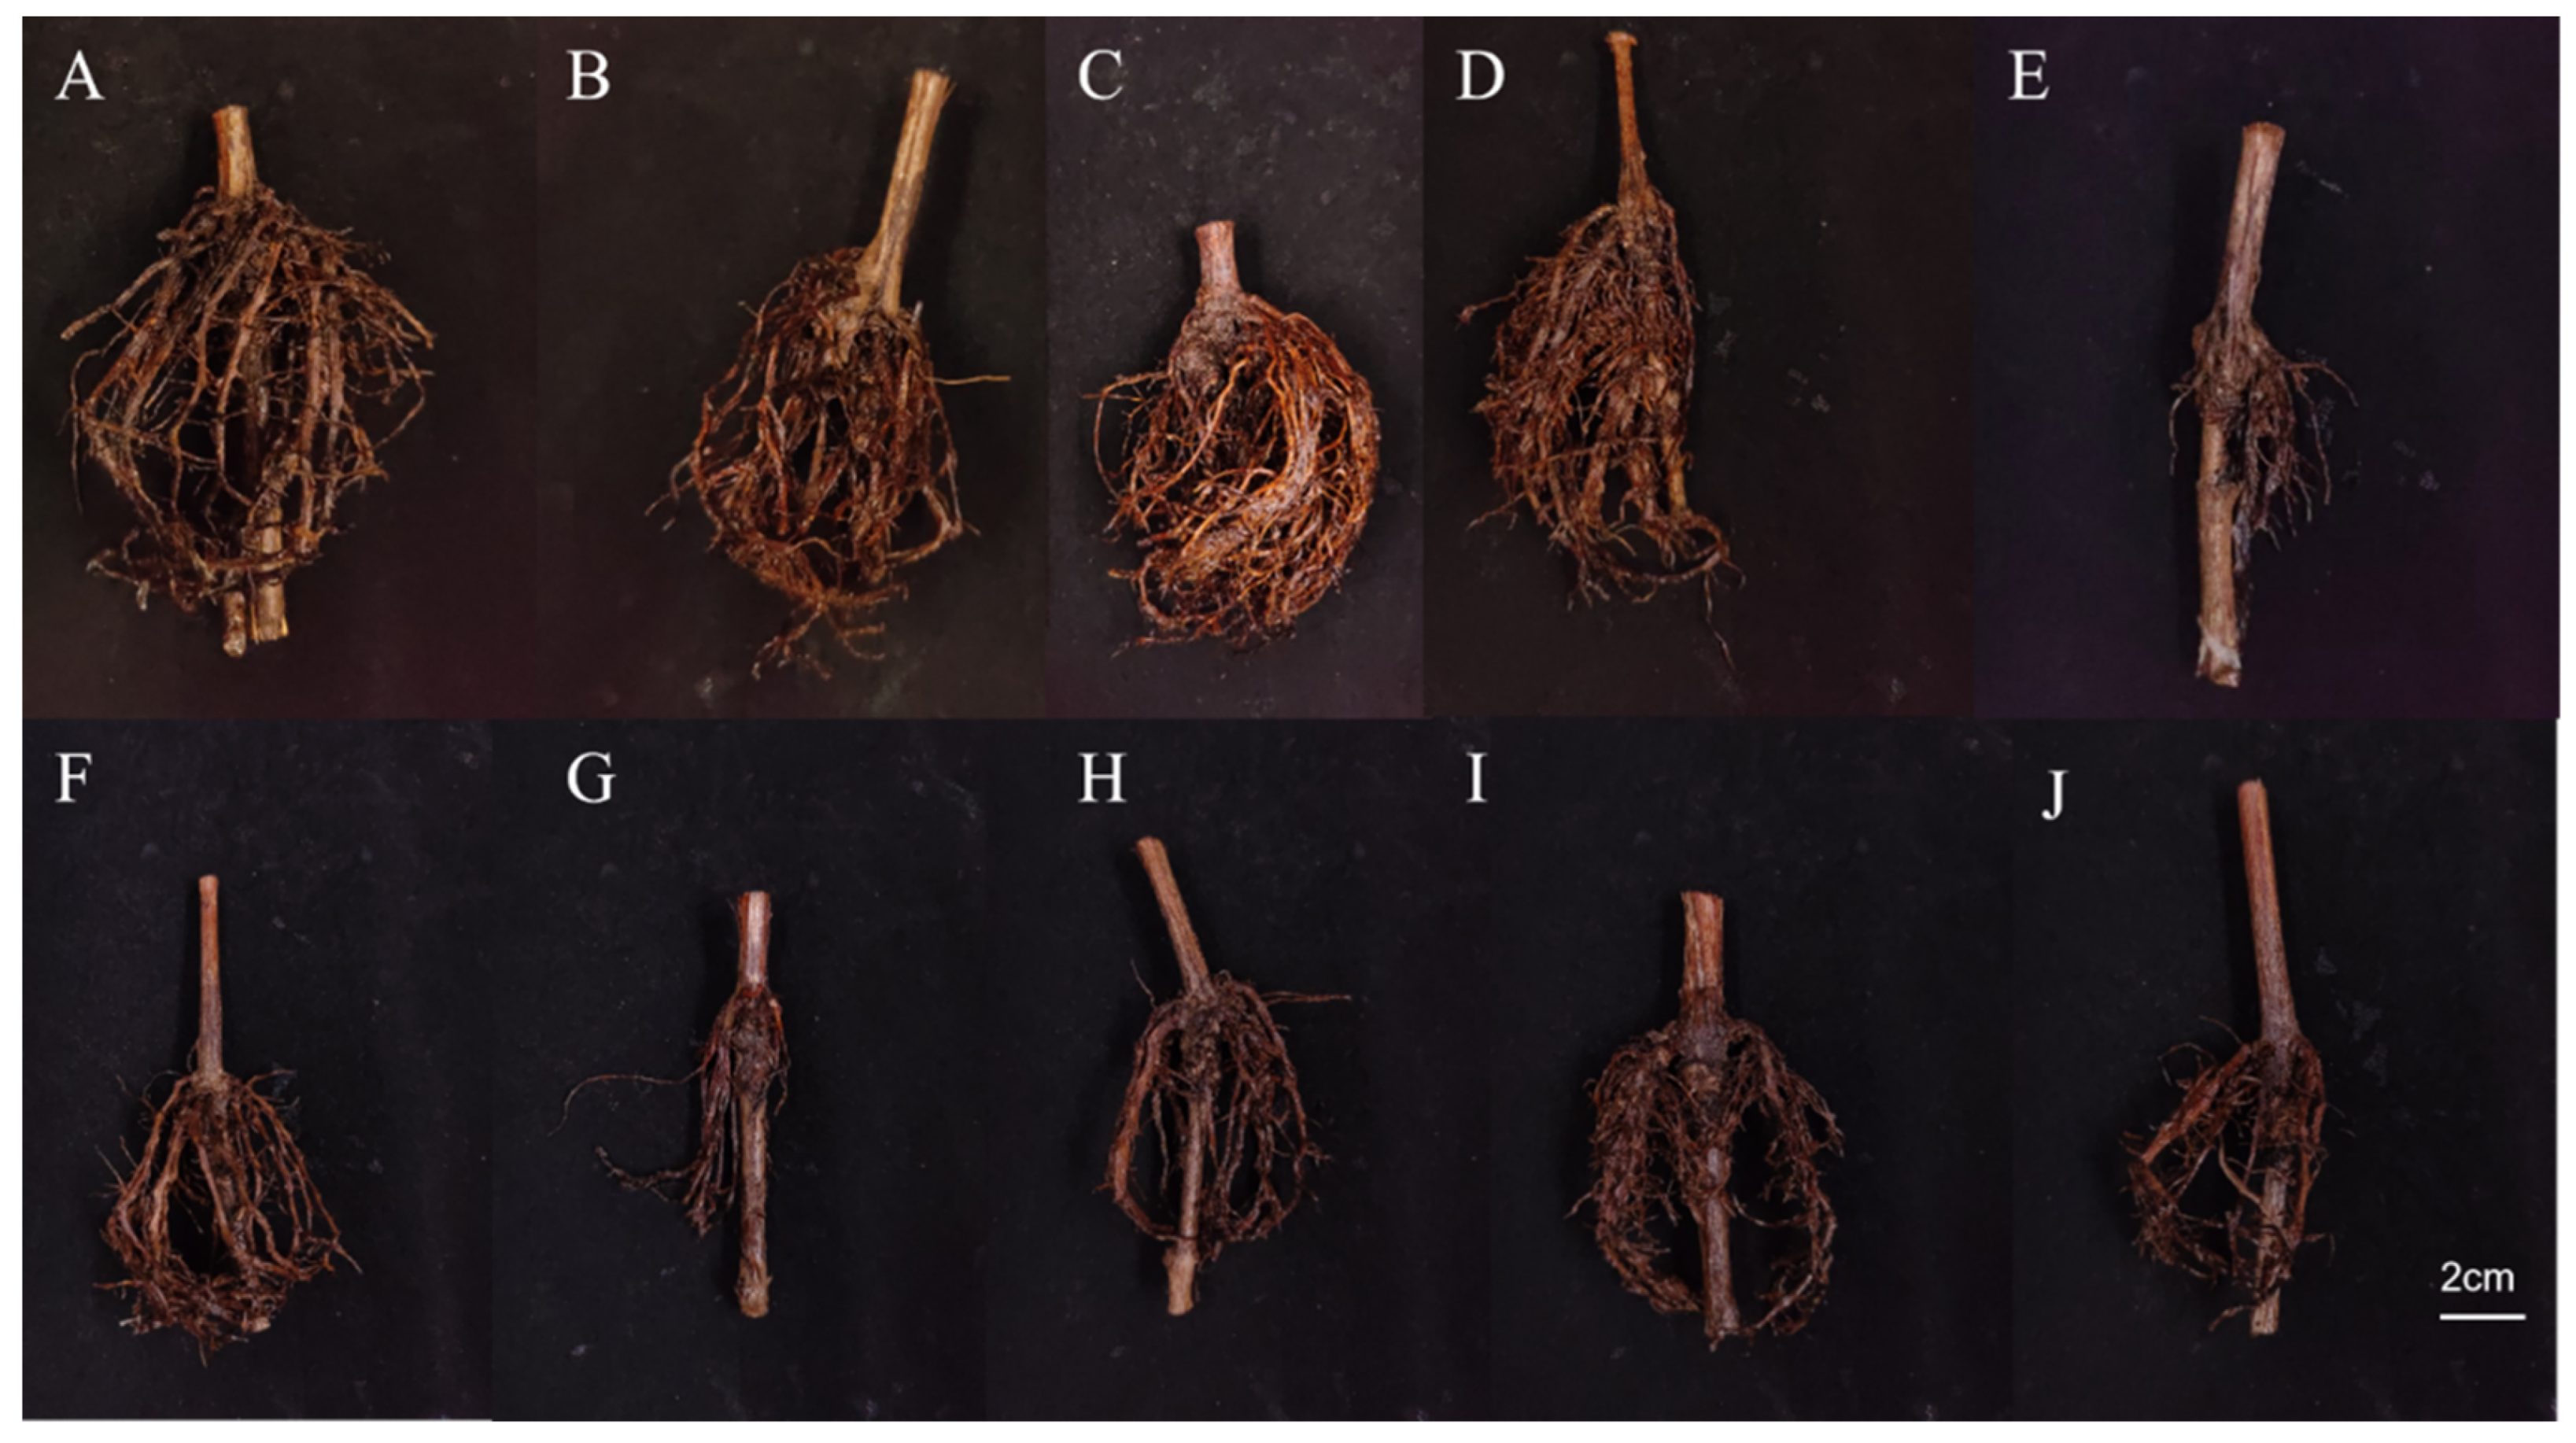
Significant differences in rooting rate were observed among treatments across the seven rootstocks (Figure 1, Table 3). Among all formulations, I2N1 (400 mg/L IBA + 200 mg/L NAA) exhibited the best overall performance, with an average rooting rate of 77.23%, exceeding ABT (63.99%) and CK (21.76%) by 20.69 and 55.47 percentage points, respectively. I2N1 achieved the highest rooting rates in ‘101-14’ (91.67%), ‘Beta’ (68.33%), ‘3309’ (83.33%), and ‘1103P’ (82.83%). However, genotype-specific responses were observed: ‘SO4’ performed best under I1N1 (83.33%), while ‘5BB’ responded most favorably to ABT (74.07%), indicating that the optimal auxin combination is partially genotype-dependent although I2N1 demonstrated broad applicability.

3.1.2. Effects of Combined IBA and NAA Formulations on the Rooting Performance Index of Grape Rootstocks

The rooting performance index, integrating rooting rate, root number, root length, and root diameter, showed that I2N1 consistently outperformed other treatments across most cultivars, with an average inter-cultivar index of 6.32 (Table 4). This value was substantially higher than those of I2N2 (4.19) and ABT (3.95), confirming the synergistic effect of combined IBA and NAA application.

3.2. Effects of Rooting Agents on Rooting Traits of Grape Rootstock Cuttings

3.2.1. Rooting and Sprouting Rates

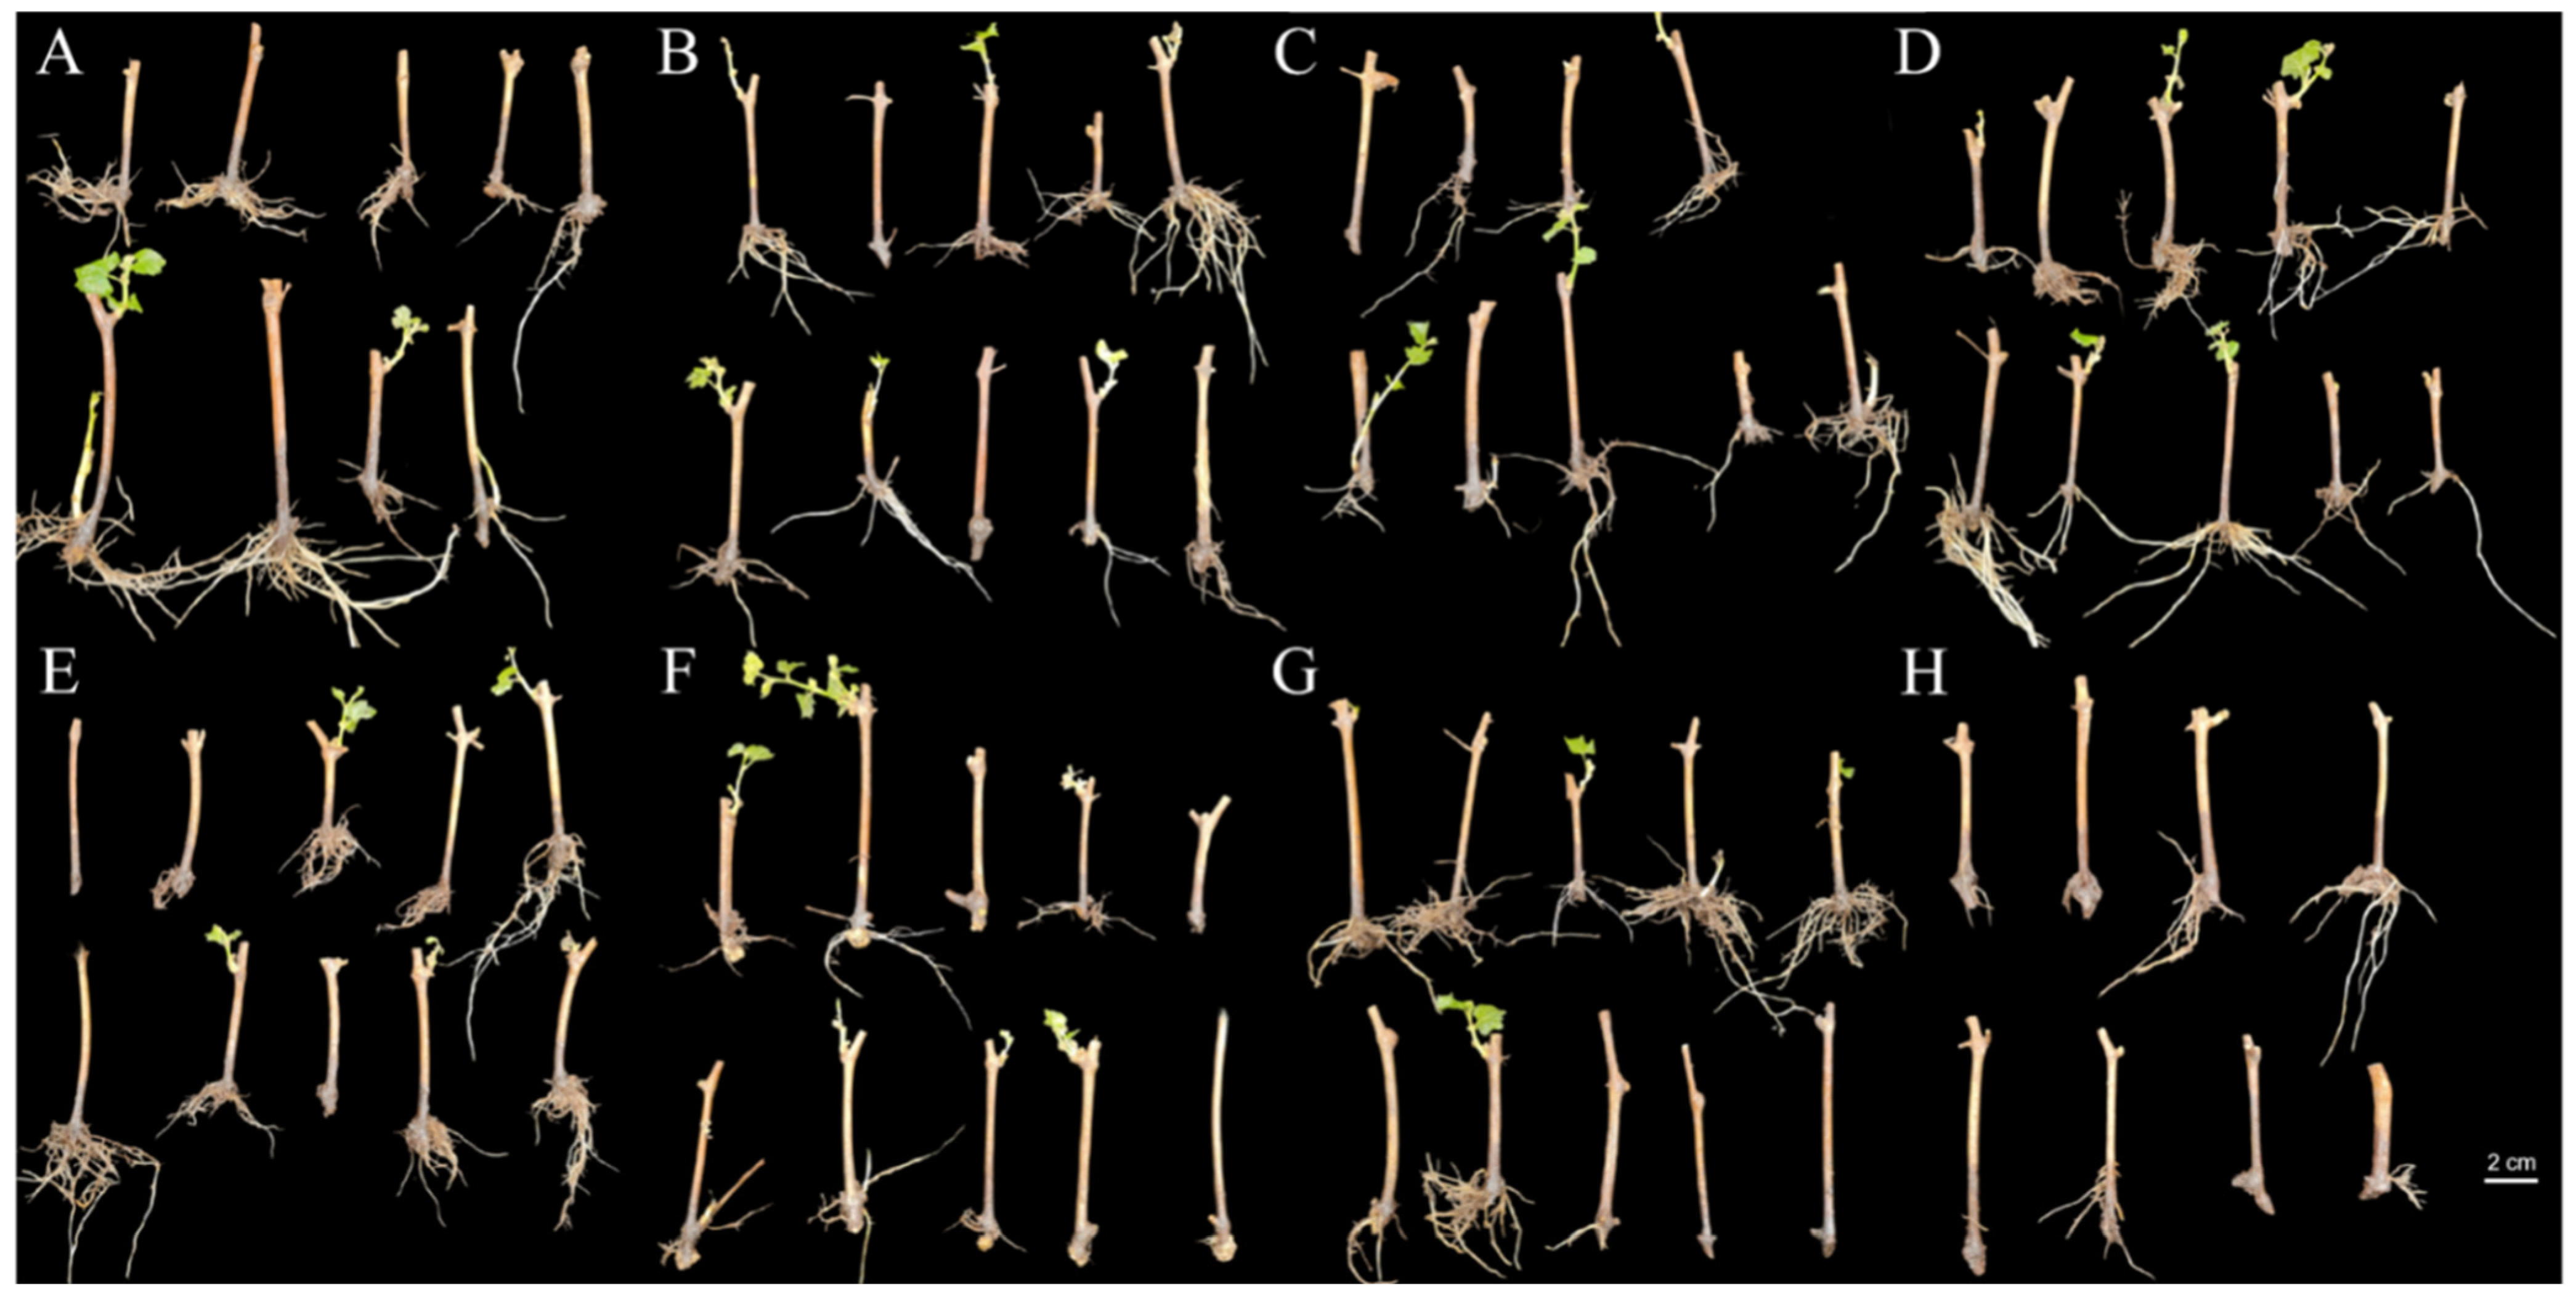
The results indicated that different rooting agent formulations significantly enhanced the rooting rates of hardwood cuttings in the seven grape rootstocks after 28 days of cultivation, while the rooting-promoting effects of the same formulation exhibited clear rootstock-specific characteristics among different genotypes (Table 5). As illustrated in Figure 2, different rooting agent treatments markedly affected the root morphological characteristics of ‘5BB’ cuttings. Compared with the CK treatment, the combined treatment groups produced a greater number of adventitious roots with more uniform root distribution, accompanied by significant increases in root length and root biomass. These results indicate that the combined application of exogenous hormones effectively promoted root system development and improved the overall rooting quality of ‘5BB’ cuttings.
Among all treatments, the IM3 treatment (400 mg/L IBA + 0.8 mM MLT) exhibited the best overall rooting-promoting effect, achieving an average rooting rate of 57.26% across the seven rootstock cultivars. This value was 2.9 percentage points higher than that obtained with the previously screened optimal rooting formulation IN (400 mg/L IBA + 200 mg/L NAA, 54.36%) and 2.39-fold higher than that of the control treatment (CK, 23.92%). The IM3 treatment increased the rooting rate of ‘101-14’ to 96.67%, which was significantly higher than those observed under the other treatments for the same cultivar. In addition, the IM3 treatment also resulted in rooting rates exceeding 70% in ‘1103P’, ‘110R’, and ‘5BB’, indicating that this formulation possessed relatively broad applicability among different grape rootstocks.
The IM2 treatment (400 mg/L IBA + 1.0 mM MLT) produced a significantly higher rooting rate than the IN treatment in the ‘SO4’ rootstock. This finding further supports the conclusion that the rooting-promoting effects of identical treatments may exhibit genotype-specific responses among different grape rootstocks. Overall, the combined exogenous application of IBA with CA or MLT demonstrated rooting-promoting effects comparable to those achieved by the conventional IBA–NAA combined formulation.
Sprouting rate reflects cutting physiological activity and formulation safety, and determines whether rooted cuttings can develop into healthy seedlings. Different rooting formulations significantly enhanced sprouting rates across the seven rootstocks (Table 6). The IM2 treatment (400 mg/L IBA + 1.0 mM MLT) achieved the highest average sprouting rate (42.56%), exceeding IN (39.25%) and IM3 (31.77%) by 8.43% and 33.96%, respectively. This may be attributed to melatonin’s role in promoting axillary bud sprouting through oxidative stress alleviation and cell division stimulation. In contrast, IBA–NAA and IBA–CA combinations primarily facilitate root primordium differentiation, resulting in distinct regulatory effects on root–shoot coordination.

3.2.2. Effects on Root Growth Parameters

Table 7 and Table 8 presents the measurements of average root number (AN), average root length (AL), and average root diameter (AD) of the seven grape rootstock cultivars after 28 days of hardwood cutting propagation. Different rooting agent formulations exhibited significant regulatory effects on the root morphological parameters of all tested grape rootstocks, and pronounced interactions between treatment specificity and rootstock genotype were observed.
Regarding average root number, the IC2 treatment (400 mg/L IBA + 0.3% CA) exhibited the highest average value across the seven rootstock cultivars, reaching 5.02 roots per cutting. This represented increases of 22.74% and 146.08% compared with the IN treatment (400 mg/L IBA + 200 mg/L NAA, 4.09 roots) and the distilled water control (CK, 2.04 roots), respectively, indicating that IC2 was the most effective formulation for promoting adventitious root formation in the tested rootstocks. The IM1 treatment (400 mg/L IBA + 0.8 mM MLT) ranked second, with an average root number of 4.72 roots, and similarly exhibited a strong promotive effect on root formation.
In terms of average root length, the IC2 treatment (400 mg/L IBA + 0.3% CA) also showed the best performance, with an average root length of 8.07 cm across cultivars, which was significantly higher than those of the other treatment groups. Compared with the IN treatment (400 mg/L IBA + 200 mg/L NAA, 5.98 cm) and the distilled water control (CK, 2.65 cm), the average root length under IC2 increased by 34.95% and 204.53%, respectively. The IC1 treatment ranked second, with an average root length of 6.48 cm, also demonstrating a strong promotive effect on root elongation. Among the combined IBA–melatonin treatments, the IM3 treatment (400 mg/L IBA + 0.8 mM MLT) exhibited the greatest average root length, reaching 7.56 cm, suggesting that melatonin-mediated regulation of root elongation exhibited a clear concentration-dependent effect.
Regarding average root diameter, the IM1 treatment (400 mg/L IBA + 0.8 mM MLT) achieved the highest average root diameter across cultivars, reaching 0.62 mm, which represented a 24.00% increase compared with the CK treatment (0.50 mm).

3.2.3. Effects on Rooting Performance Index

As presented in Table 8, the IC2 treatment (400 mg/L IBA + 0.4% CA) demonstrated superior overall rooting performance across most tested grape rootstock cultivars, with an average inter-cultivar rooting performance index of 2.14. The IM2 treatment (400 mg/L IBA + 1.0 mM MLT) achieved a comparable average index of 2.13, indicating overall performance closely aligned with that of the IC2 treatment. The IM1 treatment (400 mg/L IBA + 0.8 mM MLT) yielded an average rooting performance index of 2.09, reflecting a consistently favorable effect on comprehensive root development.
When the rooting performance index was considered separately, the treatment showing the highest value varied among rootstock cultivars. For example, IM3, corresponding to 400 mg/L IBA + 0.8 mM MLT, produced the highest rooting performance index in ‘3309’, whereas IN, corresponding to 400 mg/L IBA + 200 mg/L NAA, produced the highest rooting performance index in ‘5BB’. These results highlight the importance of genotype-specific optimization of rooting hormone combinations to achieve maximal adventitious root formation (Table 9).

3.3. Comprehensive Evaluation of Rooting Performance Based on the Membership Function Method

The rooting-promoting effects of eight formulations were evaluated based on seven parameters: overall rooting rate, sprouting rate, average root number, average root length, average root diameter, and rooting performance index. As shown in Table 10, 400 mg/L IBA + 1.2 mM MLT obtained the highest average membership function value, Av(R) = 0.49, ranking first among all treatments. The treatments 400 mg/L IBA + 1.0 mM MLT and 400 mg/L IBA + 0.5% CA showed comparable comprehensive performance, both with Av(R) = 0.47. The treatment 400 mg/L IBA + 0.3% CA ranked next, with Av(R) = 0.46. The conventional auxin formulation, 400 mg/L IBA + 200 mg/L NAA, obtained an Av(R) of 0.44.
This evaluation highlights the genotype-specific optimization of hormone combinations, demonstrating that certain IBA–CA and IBA–MLT formulations can achieve maximal rooting efficiency in grape rootstock cuttings.

3.4. Effects of Selected Formulations on Root Physiological Traits and Endogenous Hormones of Cuttings

3.4.1. Effects on Root Physiological Metabolism

Based on the measured rooting morphological parameters of grape rootstock cuttings under different rooting agent treatments, two superior rooting formulations, namely IC2 (400 mg/L IBA + 0.3% CA) and IM1 (400 mg/L IBA + 1.2 mM melatonin), were selected for further investigation. Their effects on soluble sugar content, soluble protein content, root activity, and endogenous hormone levels in hardwood cuttings of grape rootstocks were subsequently evaluated.
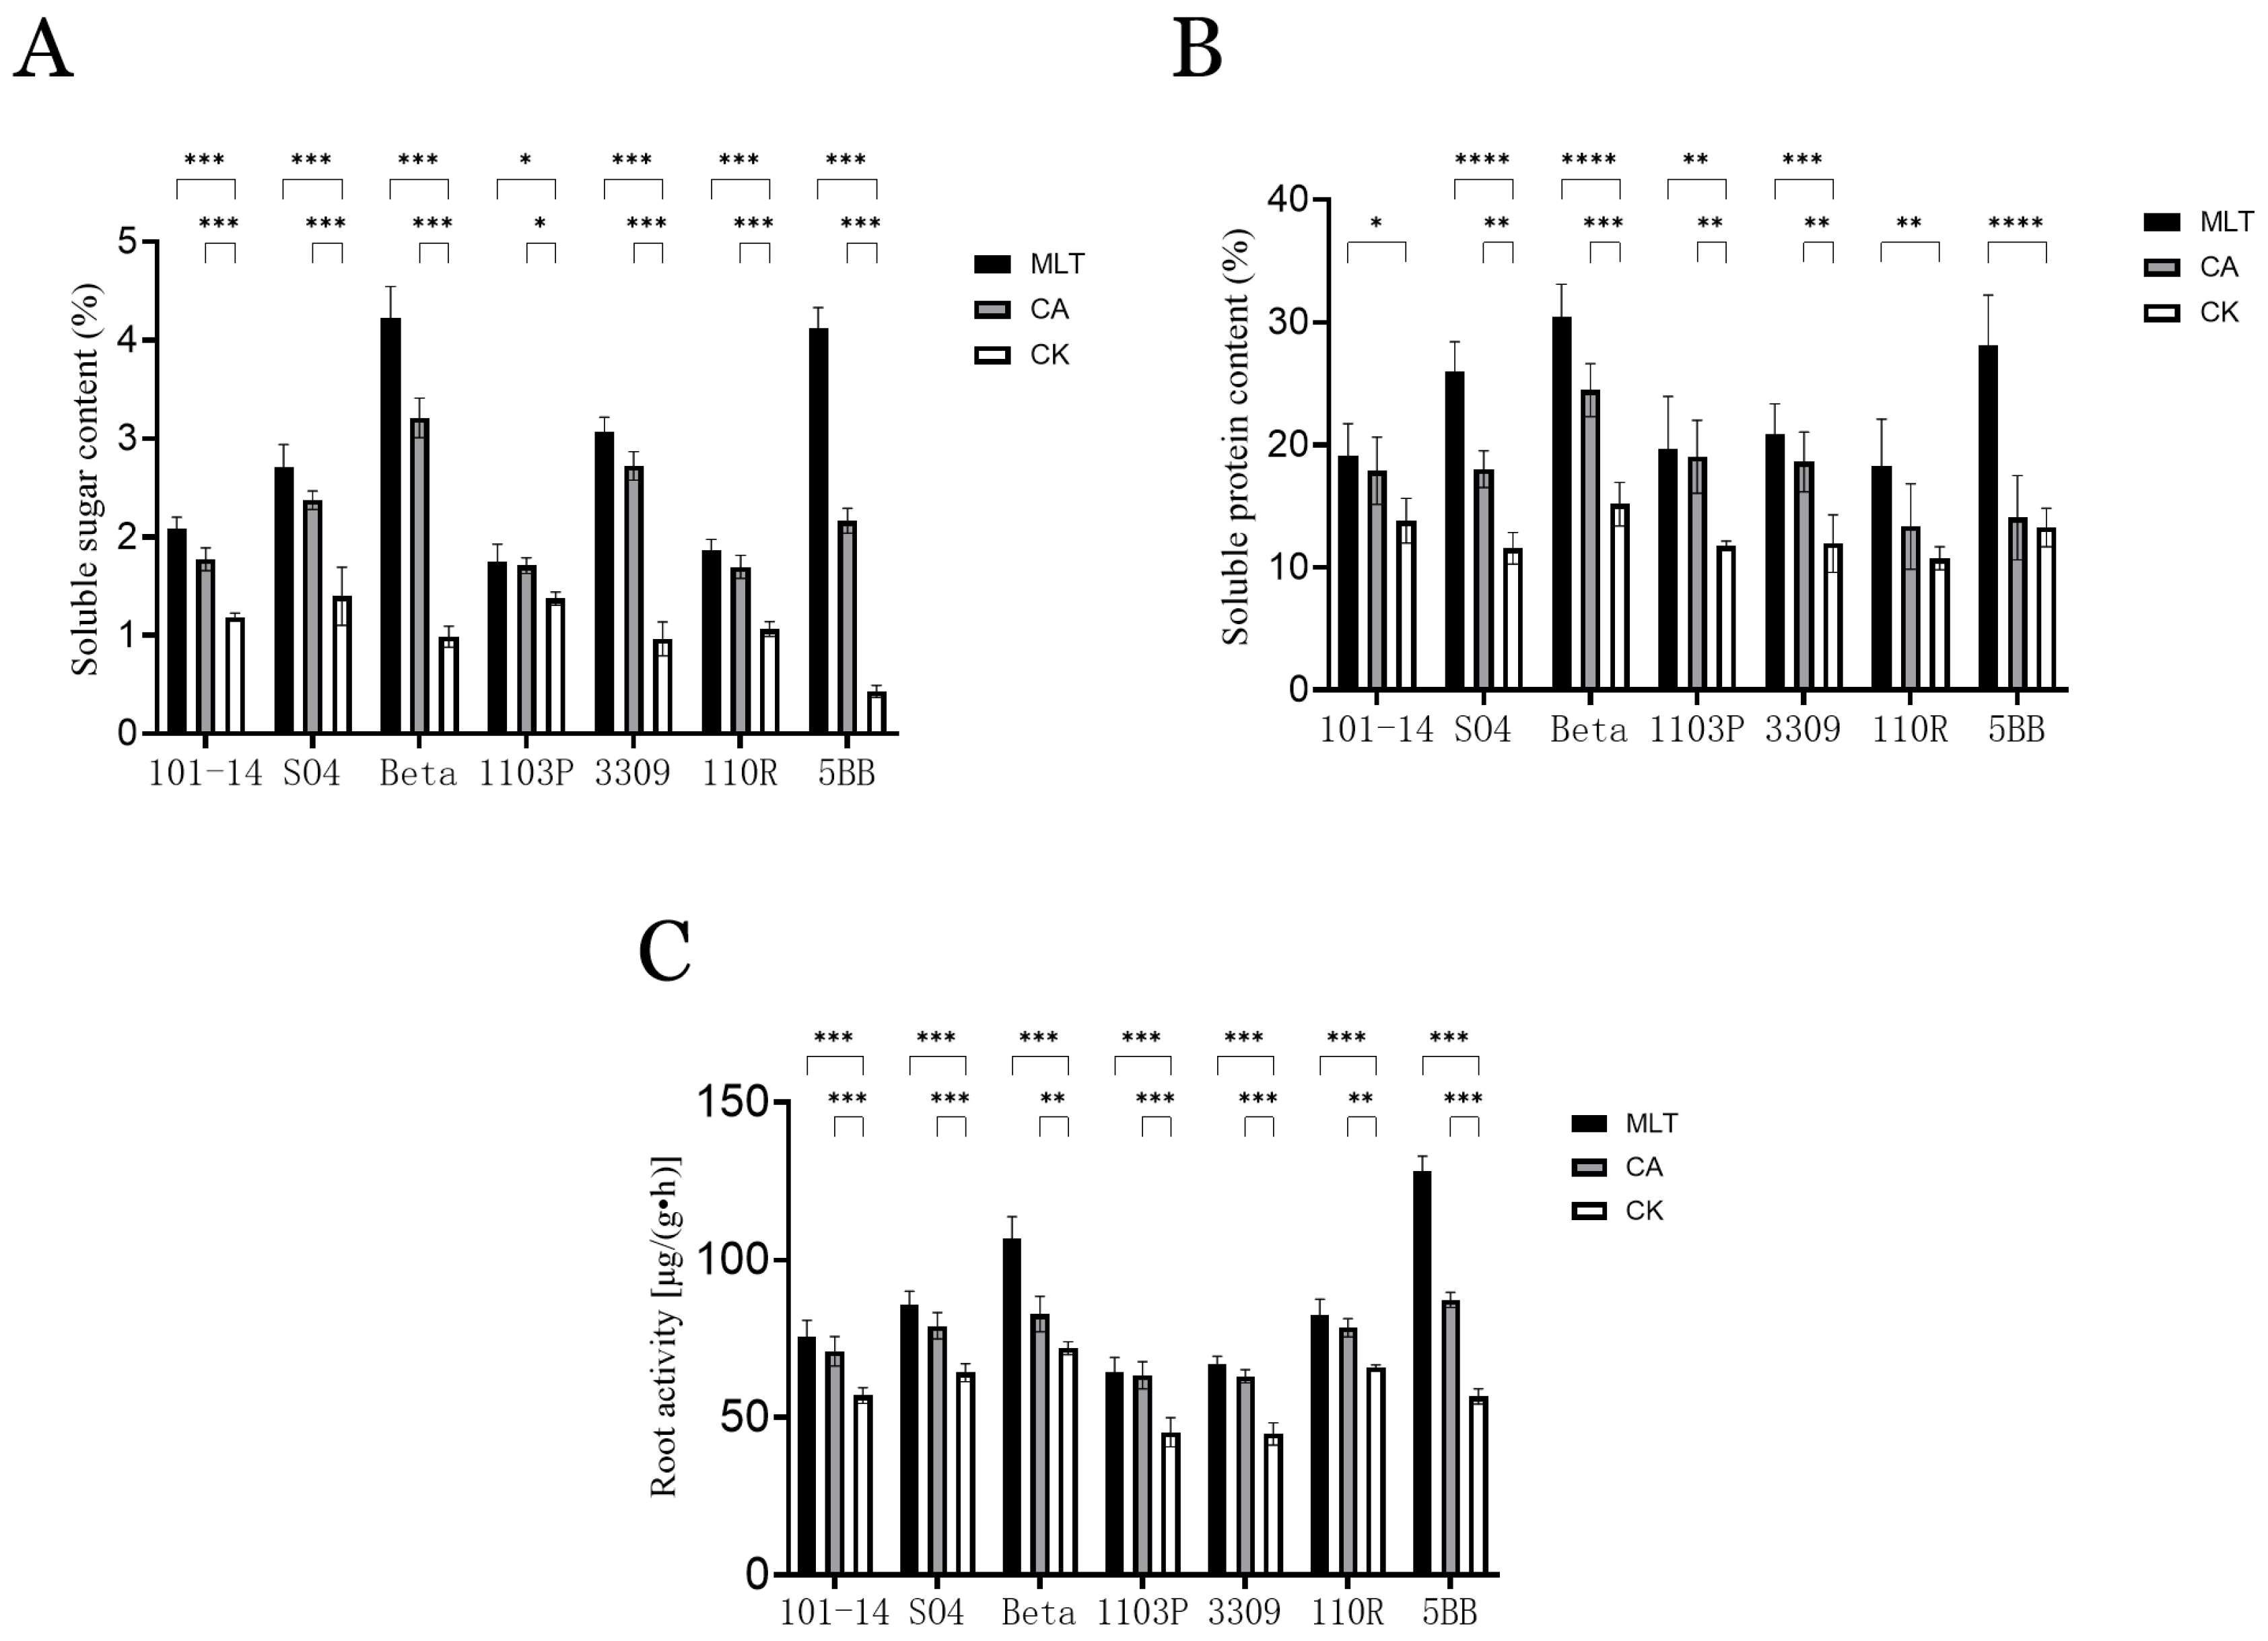
Root soluble sugars serve as the primary energy source and osmotic regulatory substances during the rooting process of grape hardwood cuttings. Their content levels reflect the nutritional reserves and rooting potential of cuttings from the perspective of physiological metabolism (Figure 3A). As the two top-ranked formulations based on the comprehensive evaluation in this study, the IM1 treatment (400 mg/L IBA + 1.2 mM MLT) and the IC2 treatment (400 mg/L IBA + 0.3% CA) generally exhibited superior regulatory effects on root soluble sugar content in the seven grape rootstocks compared with the distilled water control (CK), while also showing clear rootstock-specific responses.
Among the tested rootstocks, the ‘Beta’ rootstock exhibited the highest soluble sugar content under the IM1 treatment, reaching 4.23%, which was significantly higher than those under the IC2 treatment (3.21%) and the CK treatment (0.99%). In the ‘1103P’ rootstock, both the IM1 and IC1 treatments significantly increased soluble sugar content compared with the CK treatment, whereas only minor differences were observed between the two treatments.
Root soluble protein serves as a fundamental substance for enzyme synthesis and structural protein construction during the rooting process of grape hardwood cuttings. Its content reflects the activity of rooting-related physiological metabolism (Figure 3B). Both the IM1 treatment (400 mg/L IBA + 1.2 mM MLT) and the IC2 treatment (400 mg/L IBA + 0.3% CA) significantly increased root soluble protein content across the seven grape rootstocks.
Specifically, in the ‘Beta’ rootstock, the IM2 treatment produced the highest root soluble protein content at 30.45 mg/g, which was significantly higher than that under the IC1 treatment (24.47 mg/g) and the CK treatment (11.57 mg/g). In the ‘5BB’ rootstock, there was no significant difference between the IC1 treatment (14.08 mg/g) and CK (12.27 mg/g). Additionally, both the MLT and IC1 treatments had no significant effect on the soluble protein content in the ‘1103P’ rootstock.
Root activity is a key indicator for evaluating the physiological function and absorptive metabolic capacity of roots in grape hardwood cuttings, and its level is directly associated with the post-rooting growth potential of cuttings (Figure 3C). As the two top-ranked formulations based on the comprehensive evaluation, the MLT treatment (400 mg/L IBA + 1.2 mM melatonin) and the CA treatment (400 mg/L IBA + 0.3% citric acid) both significantly enhanced root activity in the seven grape rootstocks and generally exhibited superior effects compared with the water control (CK).
Among the tested rootstocks, the ‘Beta’ rootstock showed the highest root activity under the MLT treatment, reaching 106.92 μg/(g·h), which was significantly higher than those under the CA treatment 82.78 μg/(g·h) and the CK treatment 71.97 μg/(g·h). Similarly, in the ‘5BB’ rootstock, root activity under the MLT treatment 128.26 μg/(g·h) was markedly higher than that under the CA treatment 87.32 μg/(g·h) and the CK treatment 58.60 μg/(g·h). In other rootstocks, including ‘101-14’ and ‘SO4’, both the MLT and CA treatments also significantly increased root activity compared with the CK treatment, although certain treatment effects exhibited rootstock-specific differences among cultivars.

3.4.2. Regulation of Endogenous Hormone Homeostasis

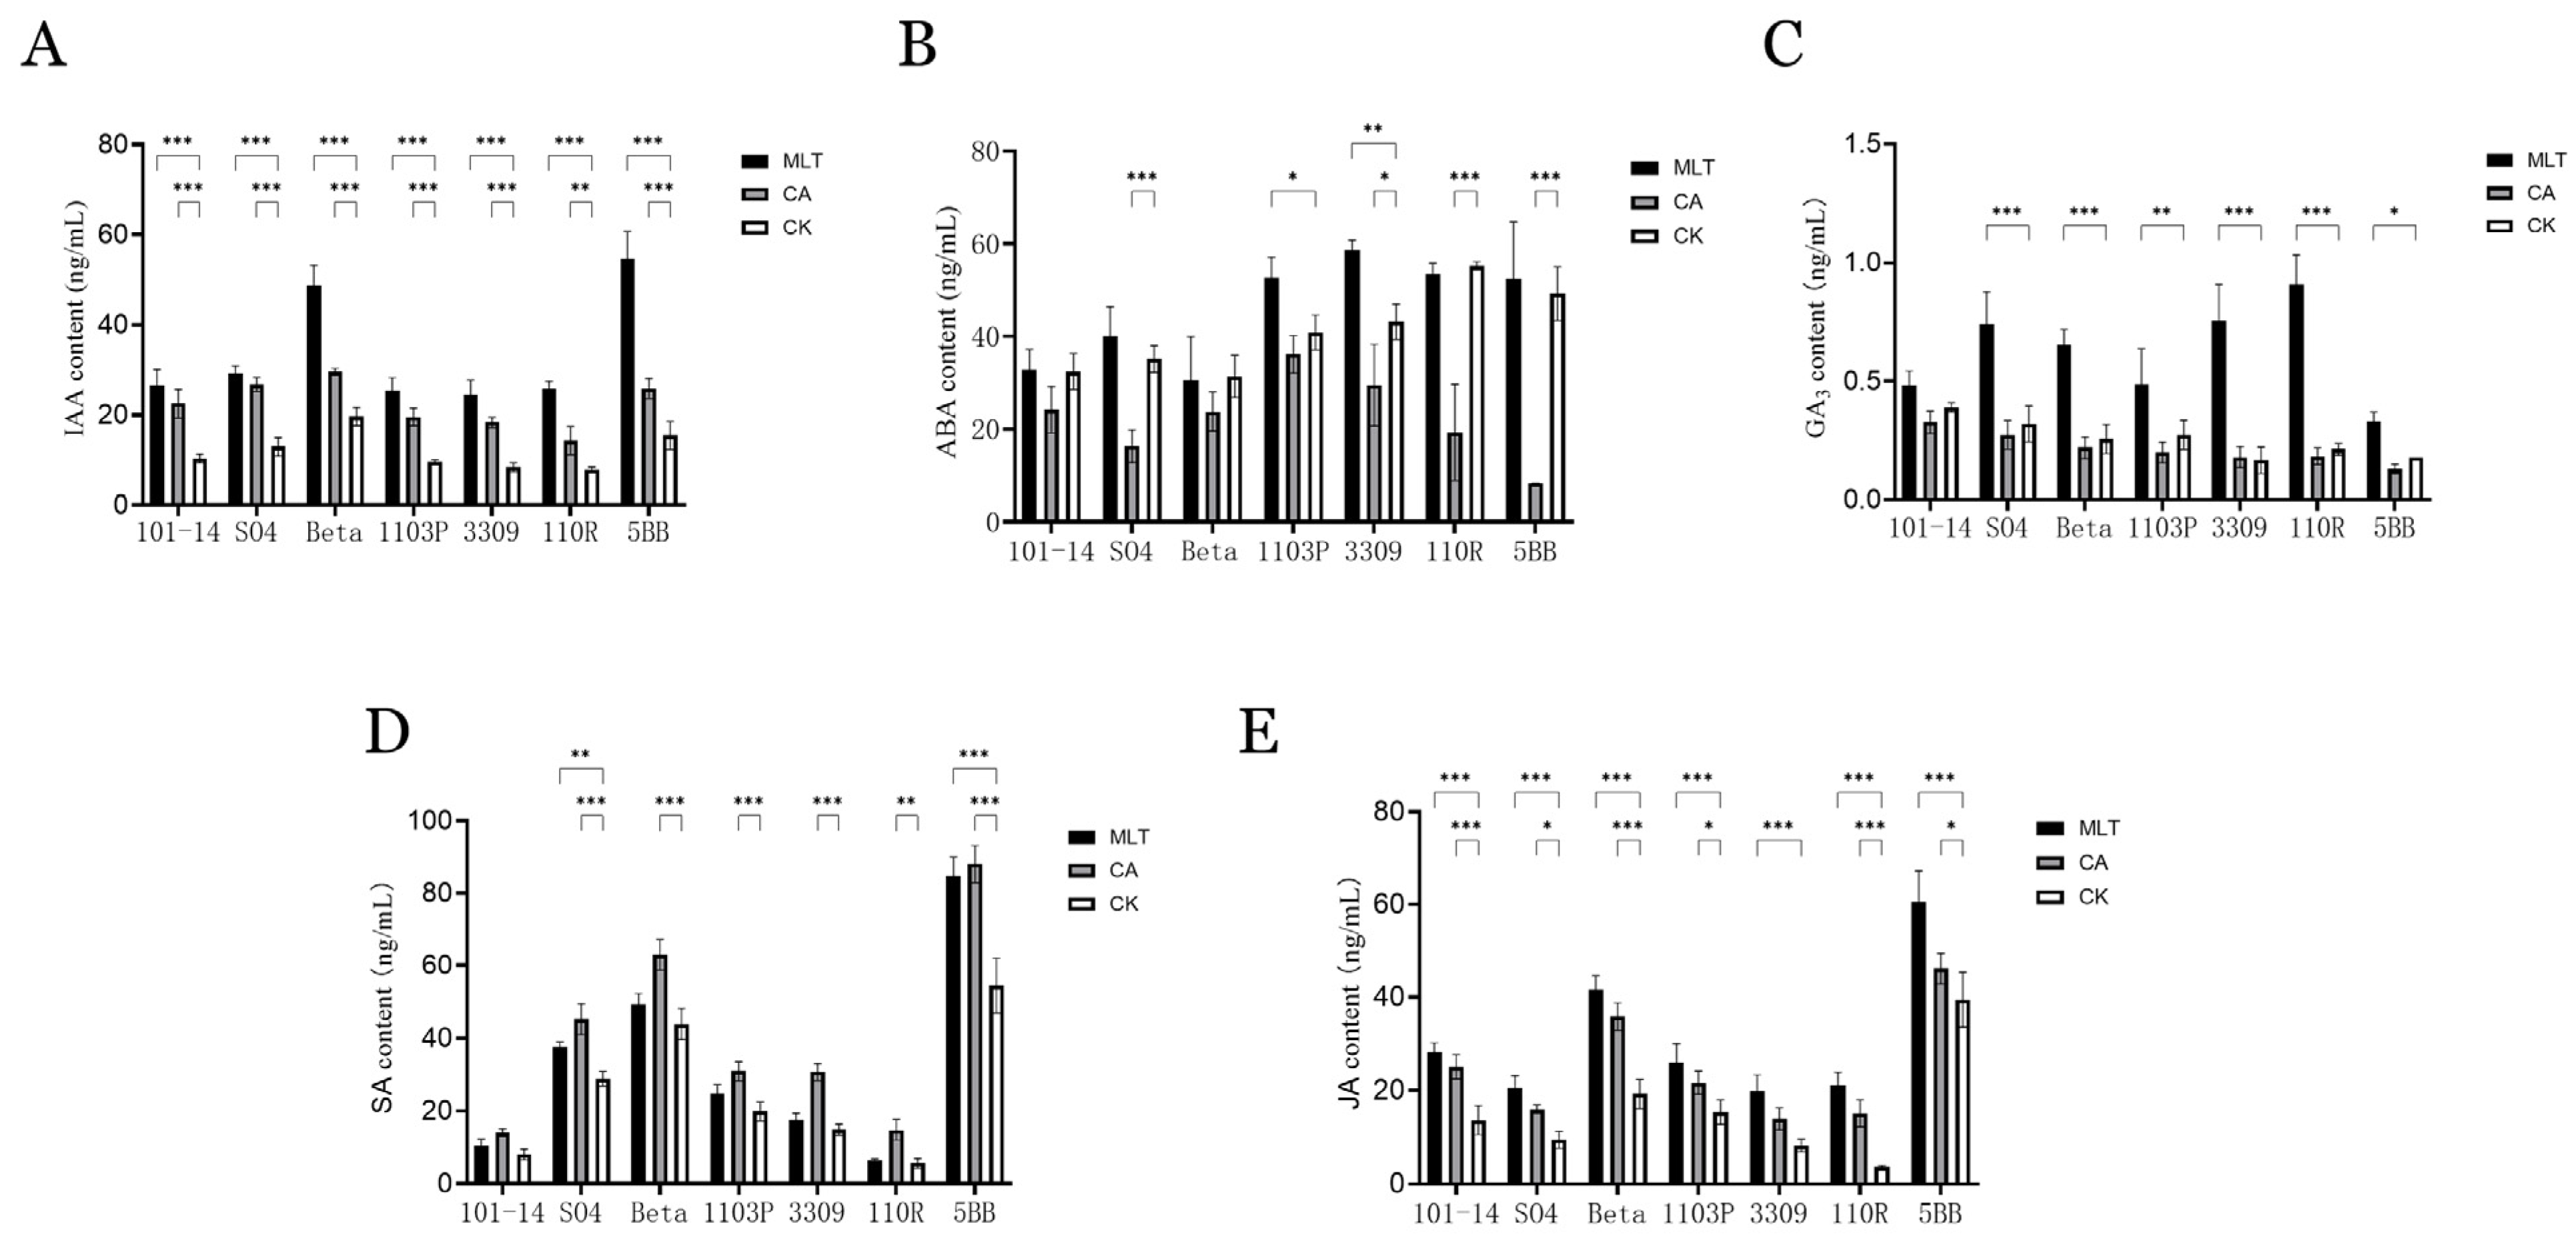
Endogenous hormones, including IAA, ABA, GA3, SA, and JA, are key signaling substances regulating the rooting process of grape hardwood cuttings, and the balance among these hormones directly influences the physiological responses associated with adventitious root formation. The two optimal formulations identified in this study, namely the MLT treatment (400 mg/L IBA + 1.2 mM melatonin) and the CA treatment (400 mg/L IBA + 0.3% citric acid), both exhibited significant regulatory effects on the levels of the five endogenous hormones in the roots of the seven grape rootstocks (Figure 4).
Among these hormones, IAA content was generally significantly higher under both the MLT and CA treatments than under the water control (CK). For example, the IAA content in the ‘5BB’ rootstock reached 54.75 ng/mL following the MLT treatment, which was more than three times higher than that of the CK treatment, indicating that these formulations effectively enhanced the accumulation of rooting-promoting hormones. In contrast, ABA content exhibited differential responses to the MLT and CA treatments. Under the CA treatment, ABA levels in all seven rootstocks were lower than those in the CK treatment, with the most pronounced reduction observed in the ‘5BB’ rootstock. Conversely, ABA content under the MLT treatment was generally higher than that under the CK treatment, although no significant differences were observed in ‘101-14’ and ‘Beta’. These results suggest that the regulation of ABA by MLT and CA may be inversely associated with stress adaptation responses in different rootstocks.
GA3 content was also generally higher under the MLT treatment than under the CK treatment. For instance, the GA3 content in the ‘SO4’ rootstock reached 0.74 ng/mL following the MLT treatment, which was significantly higher than those under the CA and CK treatments. Similarly, the JA content in the ‘5BB’ rootstock under the MLT treatment reached 60.56 ng/mL, significantly exceeding those under the other treatments. In contrast, the CA treatment generally reduced GA3 levels in the roots of cuttings compared with the CK treatment, although these differences were not statistically significant. The variation trend of JA content was similar to that of IAA, with both the MLT and CA treatments significantly increasing JA accumulation, whereas no significant difference was observed between the CA treatment and CK in the ‘3309’ rootstock.
Both the MLT and CA treatments also increased SA content in the roots of cuttings, although the promotive effect of the CA treatment on SA accumulation was generally greater than that of the MLT treatment. Collectively, these results indicate that MLT and CA exert distinct regulatory effects on GA3 and ABA metabolism. Specifically, the CA treatment tended to reduce GA3 content, whereas the melatonin treatment promoted ABA accumulation, suggesting that the two formulations may enhance rooting through different physiological and regulatory mechanisms.

3.5. Mechanisms of Melatonin-Mediated Rooting Promotion

3.5.1. Identification of Differentially Expressed Genes (DEGs)

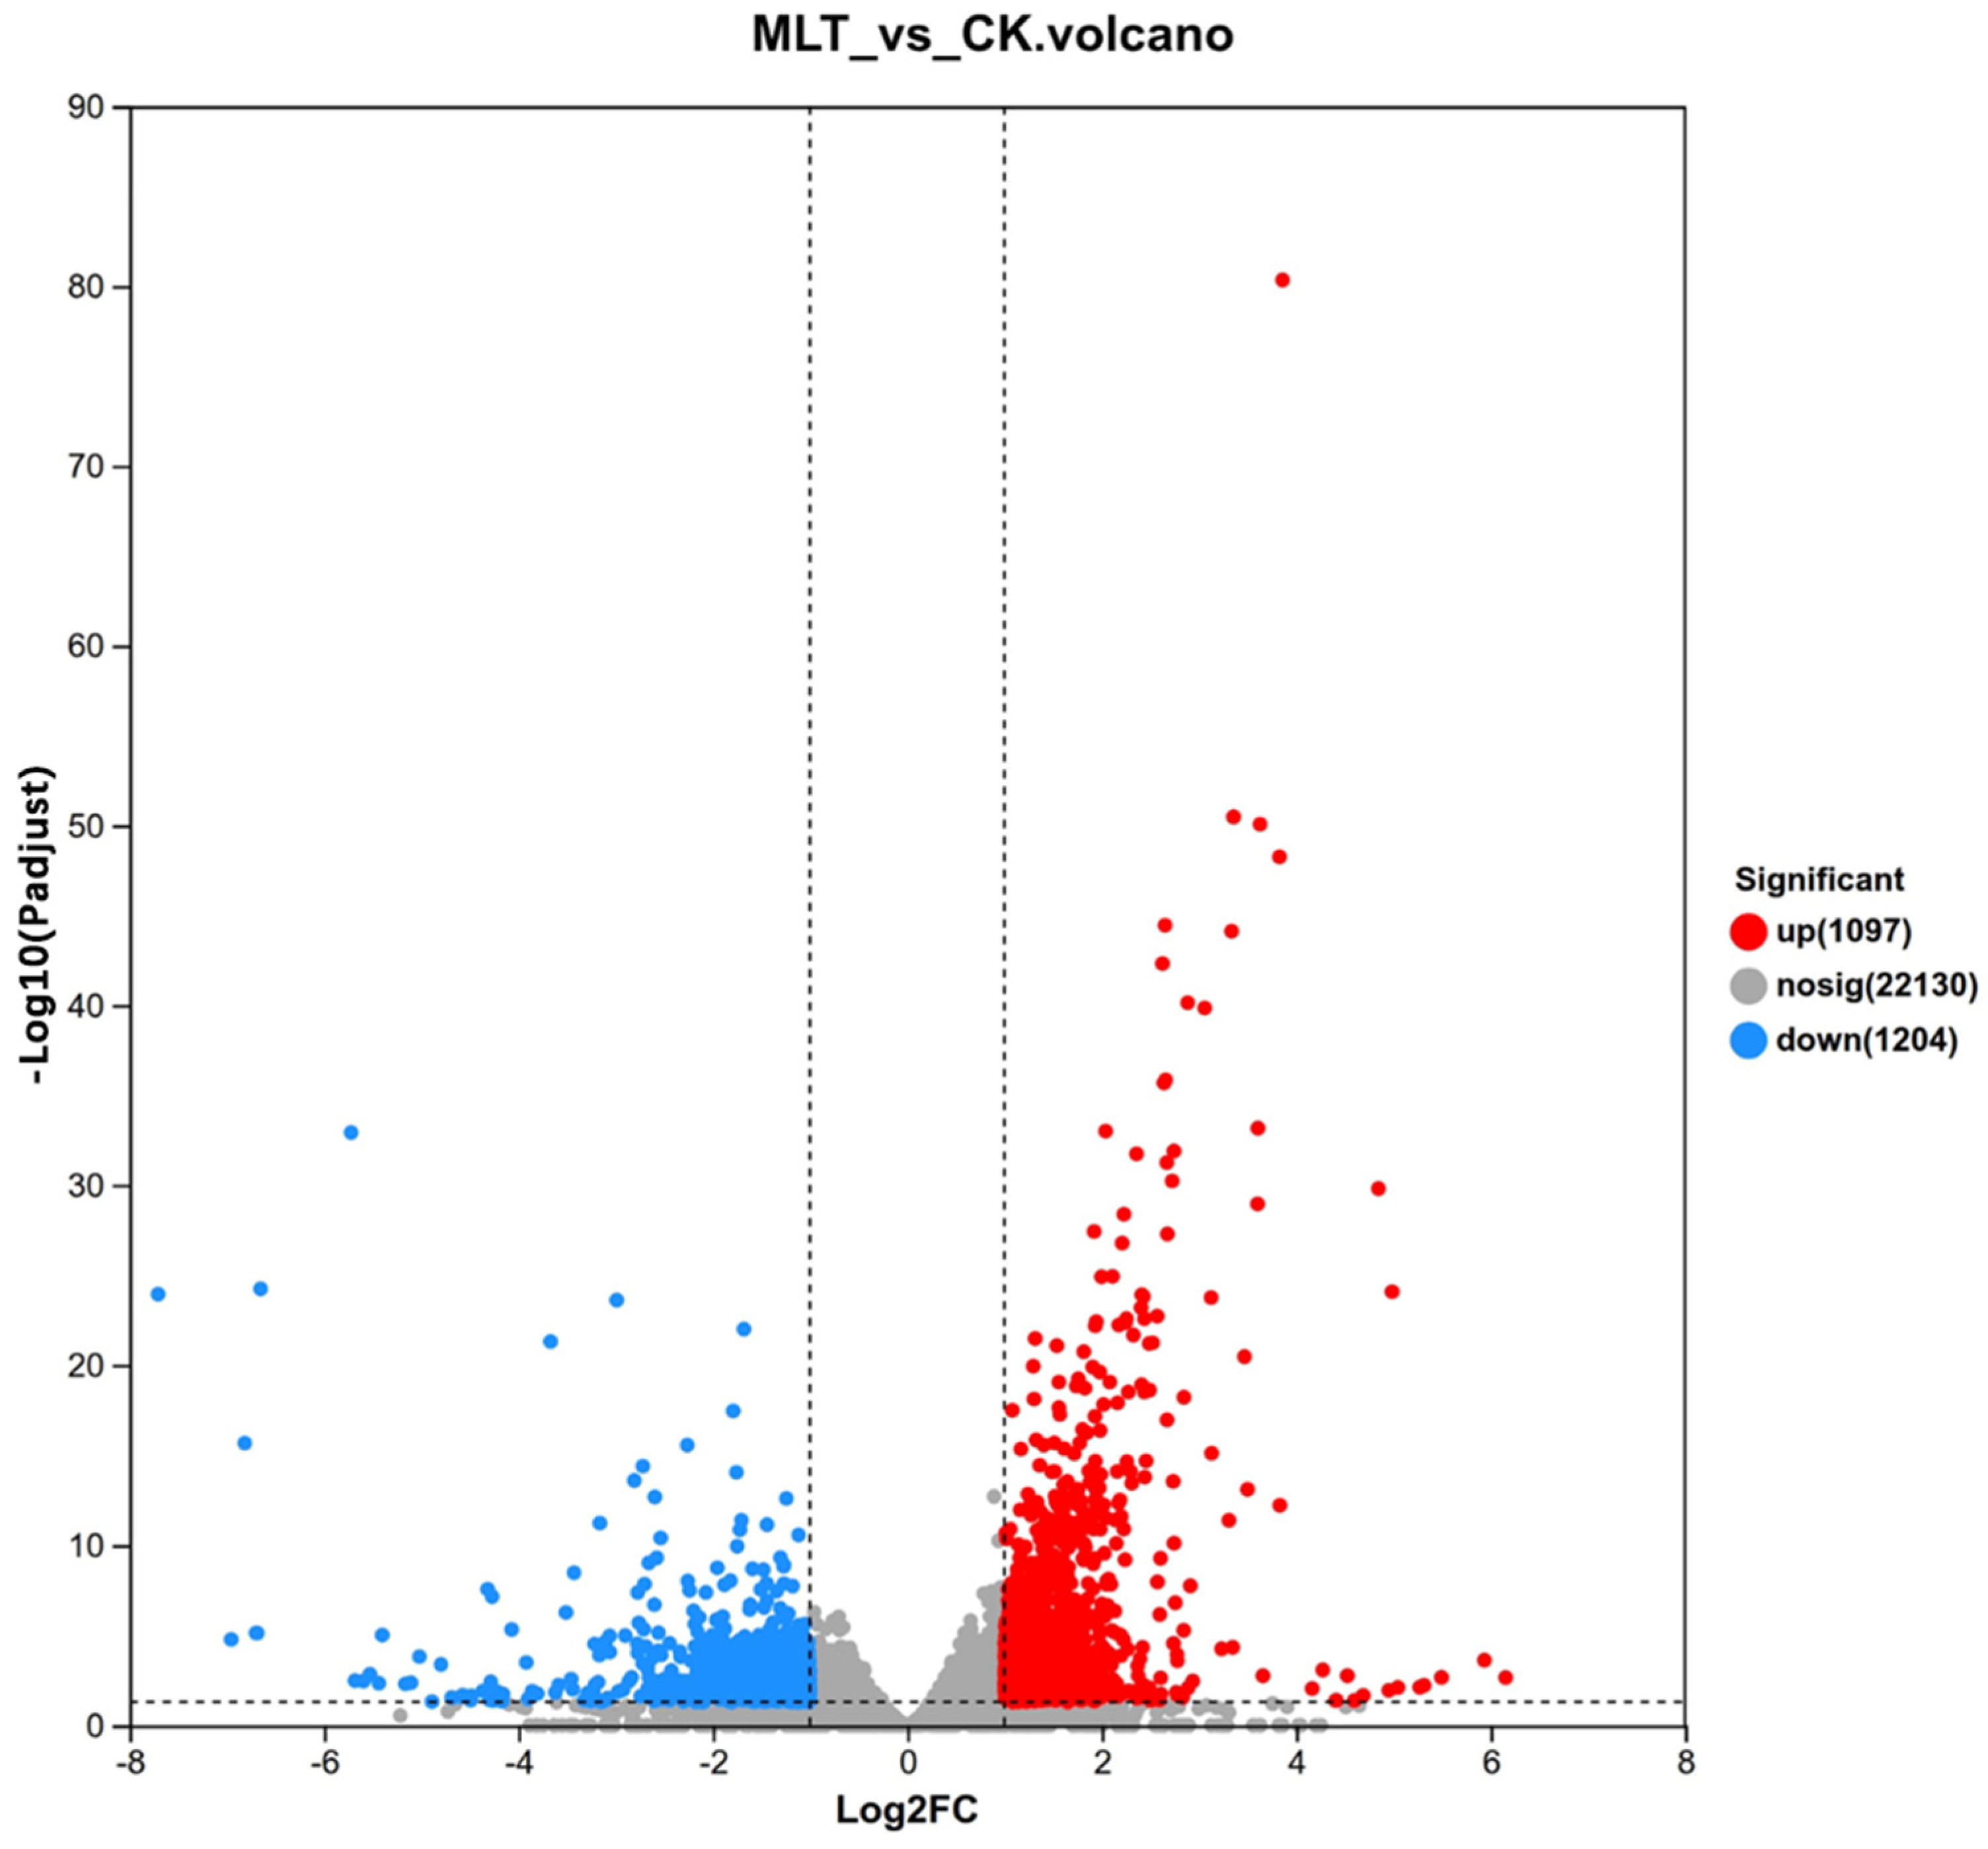
Under different rooting agent treatments, adventitious root formation in ‘110R’ grape rootstock cuttings involved complex molecular regulatory mechanisms. Analysis of differentially expressed genes (DEGs) enables a comprehensive and in-depth characterization of the molecular response patterns underlying melatonin (MLT)-mediated regulation of adventitious root formation in the ‘110R’ rootstock. Based on the sequencing and alignment results, DEGs between the MLT-treated group and the CK group were identified using the screening criteria of (|log_2FC| ≥ 1) and (p-value < 0.05). The results revealed substantial differences in transcriptomic regulation between treatments. Specifically, a total of 2301 DEGs were identified in the comparison between the MLT and CK groups, including 1097 upregulated genes and 1204 downregulated genes.

3.5.2. Sample Correlation and PCA Analyses of CK and MLT-Treated Samples

To ensure the reliability of the RNA-seq data and to visualize the overall transcriptional reprogramming induced by MLT, principal component analysis (PCA) and sample correlation analysis were performed on the transcriptomic datasets.
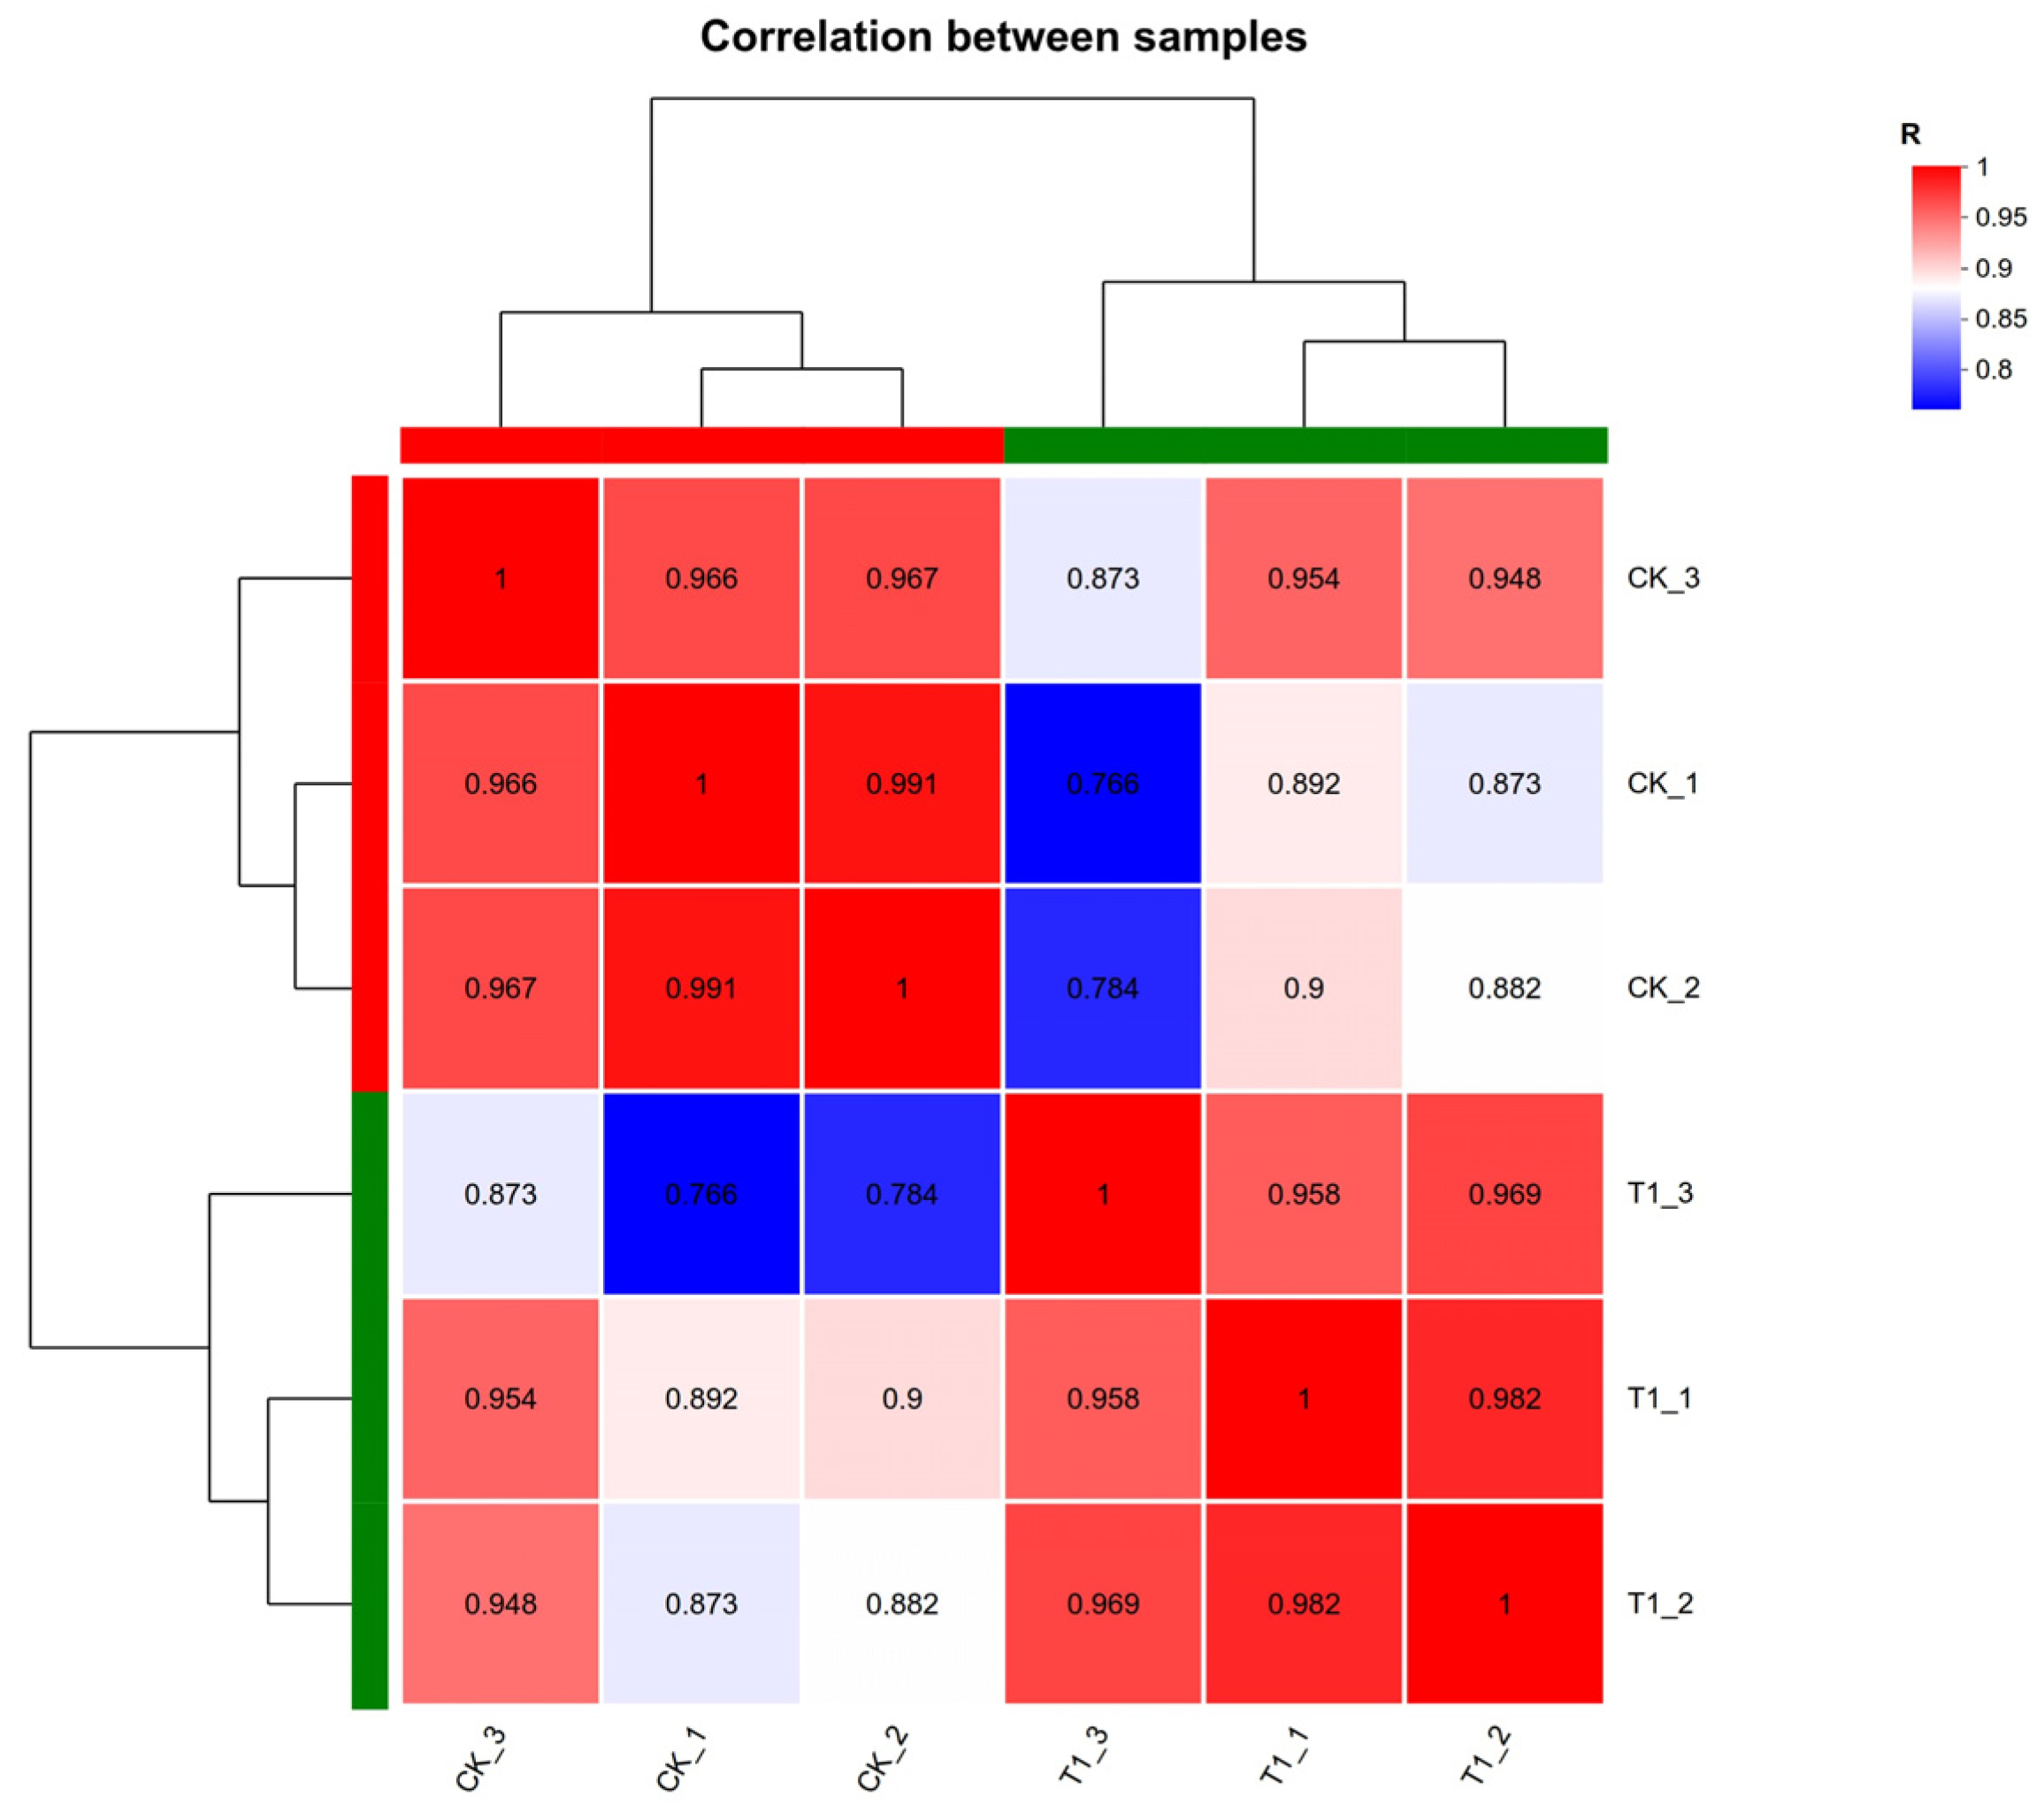
As shown in the sample correlation heatmap, the biological replicates within the CK and MLT treatment groups generally exhibited high correlations, indicating good reproducibility and reliability of the sequencing or expression data (Figure 5).
Within the CK group, the three replicates showed high correlation coefficients among themselves. Specifically, the correlation coefficient between CK_1 and CK_2 reached 0.991, while those between CK_1 and CK_3, and between CK_2 and CK_3, were 0.966 and 0.967, respectively. This indicates good consistency among the CK group replicates (Figure 6).
Within the MLT treatment group, T1_1, T1_2, and T1_3 also showed high inter-replicate correlations, with coefficients ranging from 0.958 to 0.982. The highest correlation was observed between T1_1 and T1_2 (0.982), followed by T1_2 vs. T1_3 (0.969) and T1_1 vs. T1_3 (0.958), confirming overall stability among the MLT treatment replicates.
In contrast, correlations between CK and MLT treatment groups were relatively lower, with some inter-group coefficients dropping to 0.766–0.900. For example, the correlation coefficients between T1_3 and CK_1, and between T1_3 and CK_2, were 0.766 and 0.784, respectively, markedly lower than the intra-group correlations. This suggests that MLT treatment induced substantial changes in the overall expression patterns or physiological responses of the samples.
Hierarchical clustering results also showed that CK and MLT treatment samples could be generally distinguished into two major branches, further indicating that MLT treatment exerted a pronounced global regulatory effect on grape rootstock cuttings.

3.5.3. GO Enrichment Analysis of Differentially Expressed Genes (DEGs)

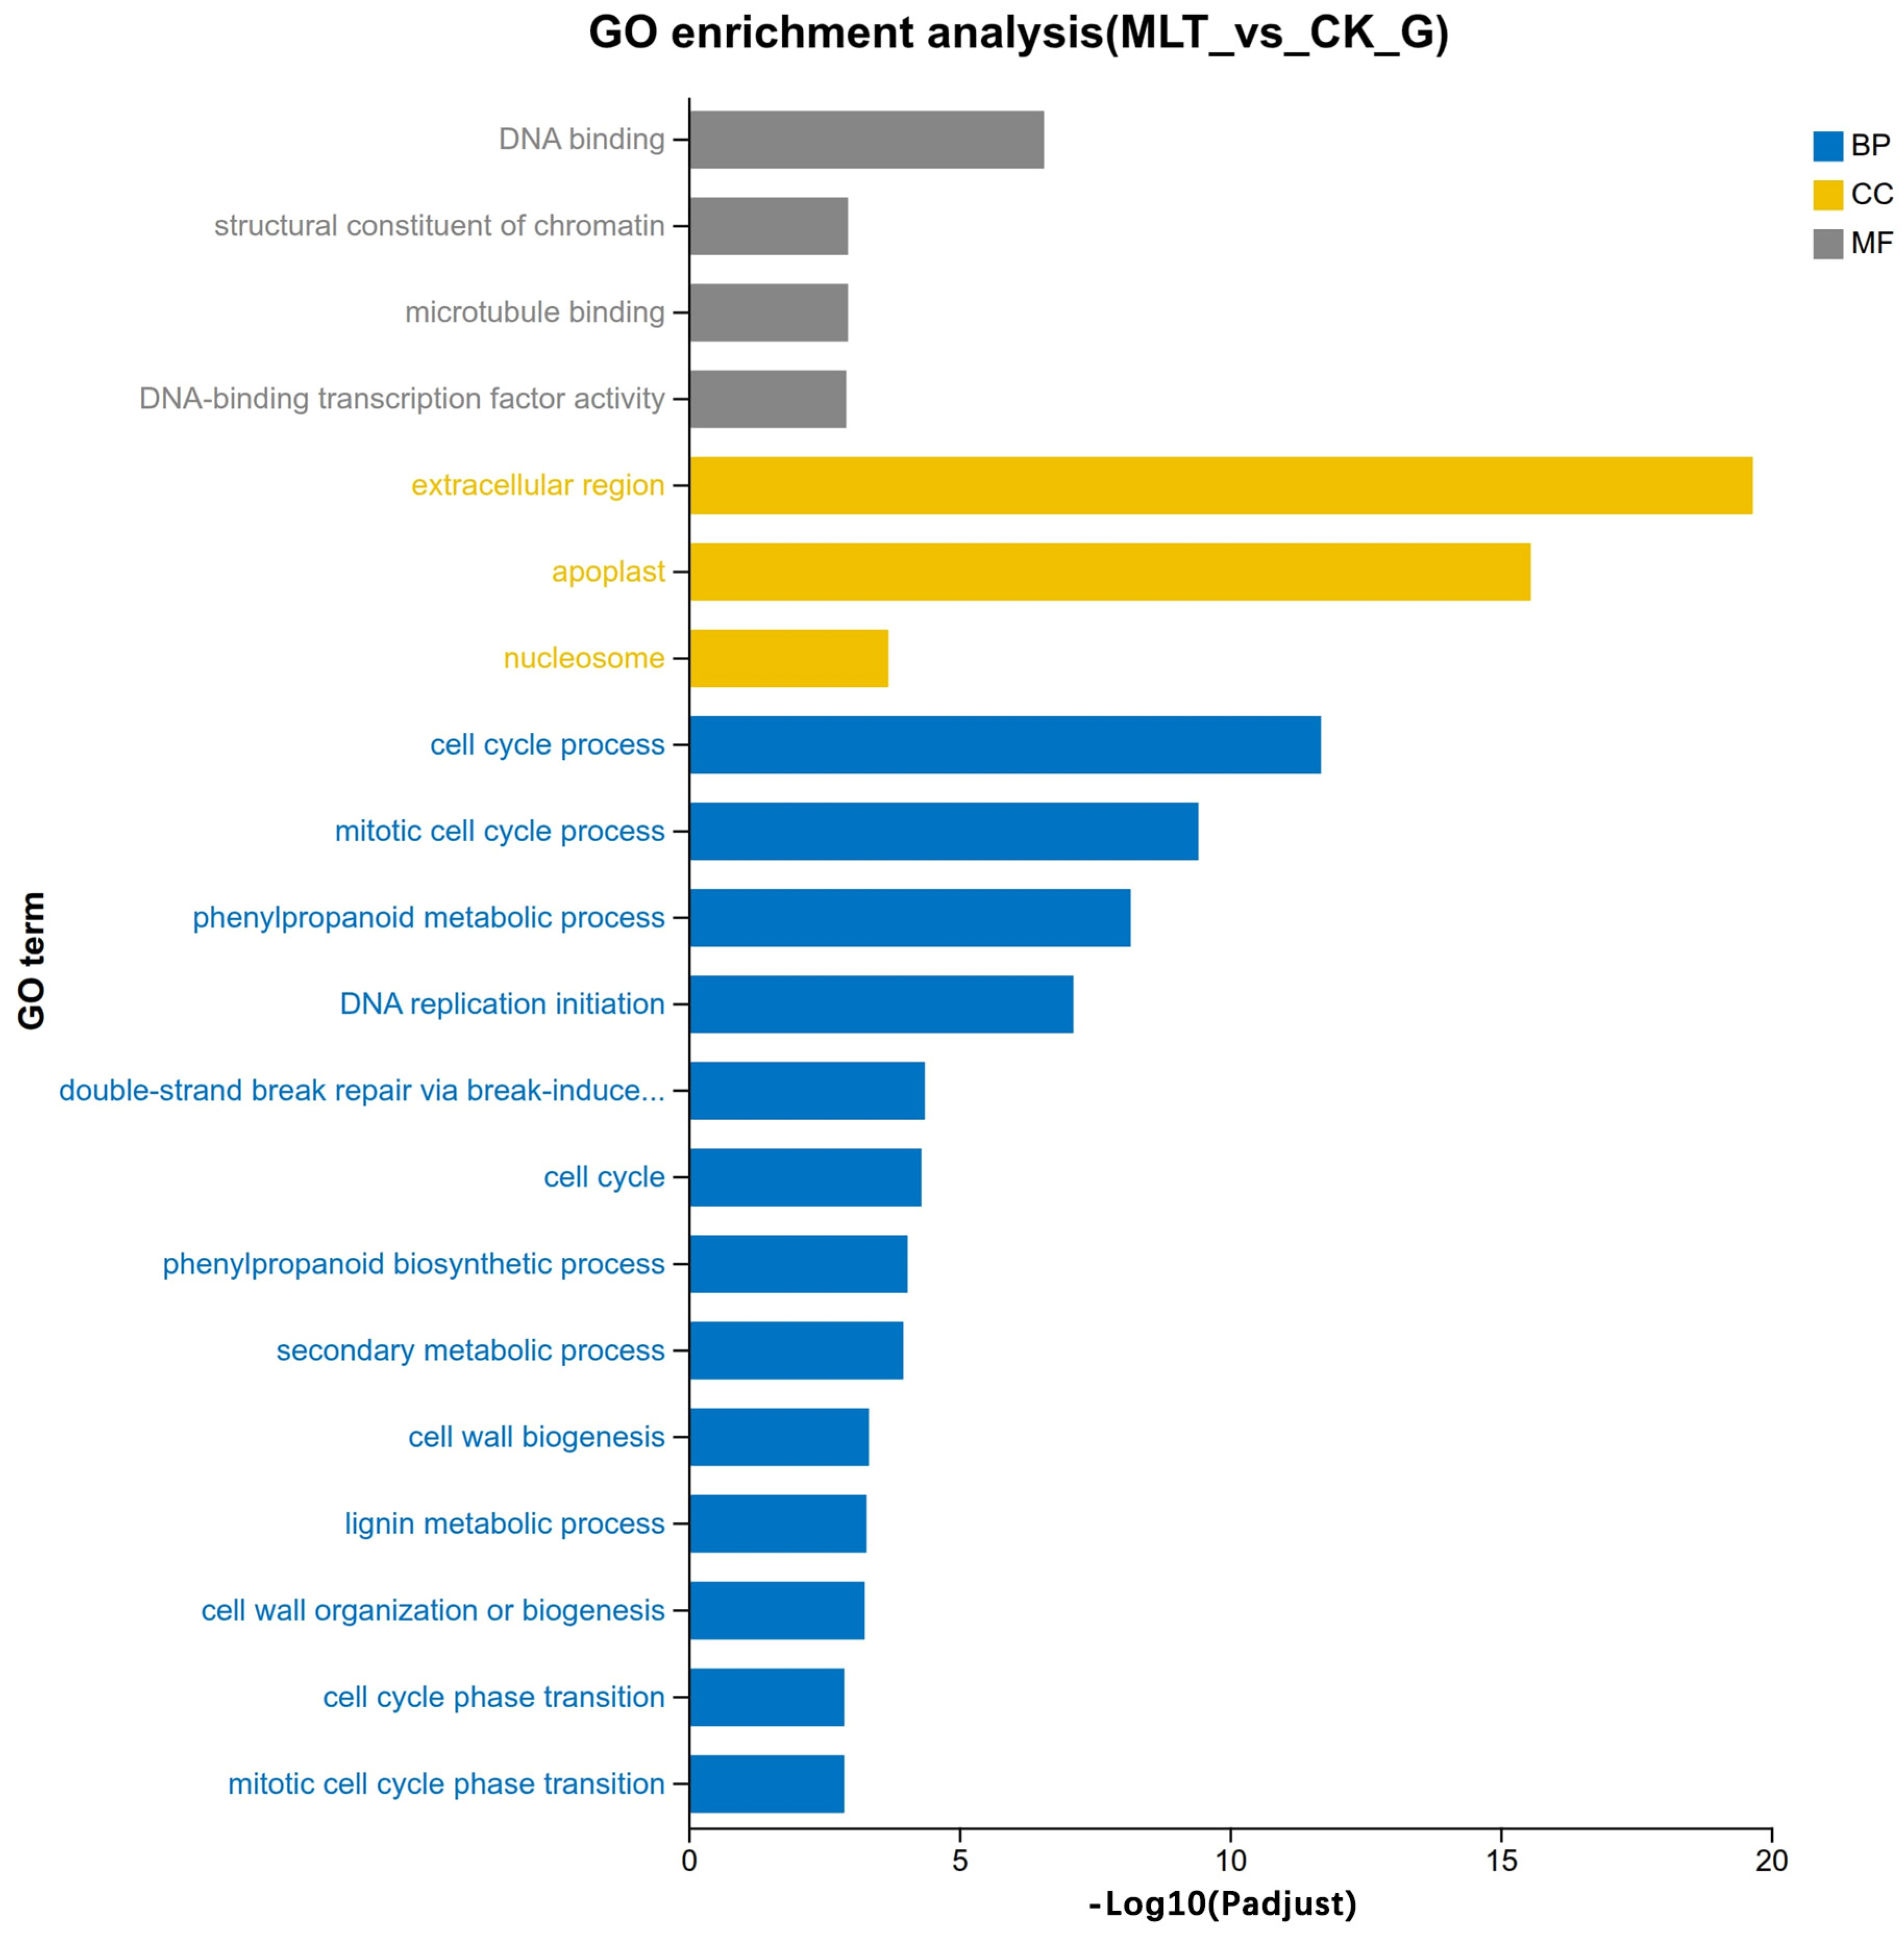
The GO enrichment analysis results for the MLT vs. CK comparison are presented in Figure 7. Differentially expressed genes (DEGs) showed significant enrichment across the three major Gene Ontology (GO) categories: molecular function (MF), cellular component (CC), and biological process (BP).
Within the MF category, DEGs were primarily enriched in terms such as DNA binding, structural constituent of chromatin, microtubule binding, and DNA-binding transcription factor activity. These enrichments suggest that MLT treatment may influence transcriptional regulation, chromatin structural dynamics, and cytoskeletal organization in root tip cells.
In the CC category, DEGs were mainly enriched in extracellular region, apoplast, and nucleosome. Nucleosome-related terms are closely associated with chromatin assembly, DNA replication, and transcriptional regulation, whereas extracellular region and apoplast are involved in cell wall formation, intercellular signaling, and cell expansion. These findings indicate that MLT treatment may participate in root tip growth and development through modulation of nuclear architecture and extracellular functional processes.
Within the BP category, DEGs were predominantly enriched in cell cycle process, mitotic cell cycle process, DNA replication initiation, cell cycle, cell cycle phase transition, mitotic cell cycle phase transition, phenylpropanoid metabolic process, phenylpropanoid biosynthetic process, secondary metabolic process, cell wall biogenesis, lignin metabolic process, and cell wall organization or biogenesis. These enriched pathways are mainly associated with cell cycle regulation, DNA replication, mitosis, cell wall construction, and phenylpropanoid and lignin metabolism. Enrichment of cell cycle- and mitosis-related terms suggests that MLT treatment may enhance the division activity of root apical meristem cells, thereby providing a cytological basis for adventitious root primordium formation and root tip elongation. Meanwhile, the enrichment of pathways related to cell wall biogenesis, lignin metabolism, and phenylpropanoid metabolism indicates that MLT may contribute to root morphogenesis through regulation of cell wall synthesis, remodeling, and secondary metabolic processes.
Overall, these results suggest that MLT treatment may promote root tip development and adventitious root formation in grape rootstocks by coordinately regulating cell proliferation and cell wall remodeling processes.

3.5.4. KEGG Pathway Analysis of Differentially Expressed Genes (DEGs)

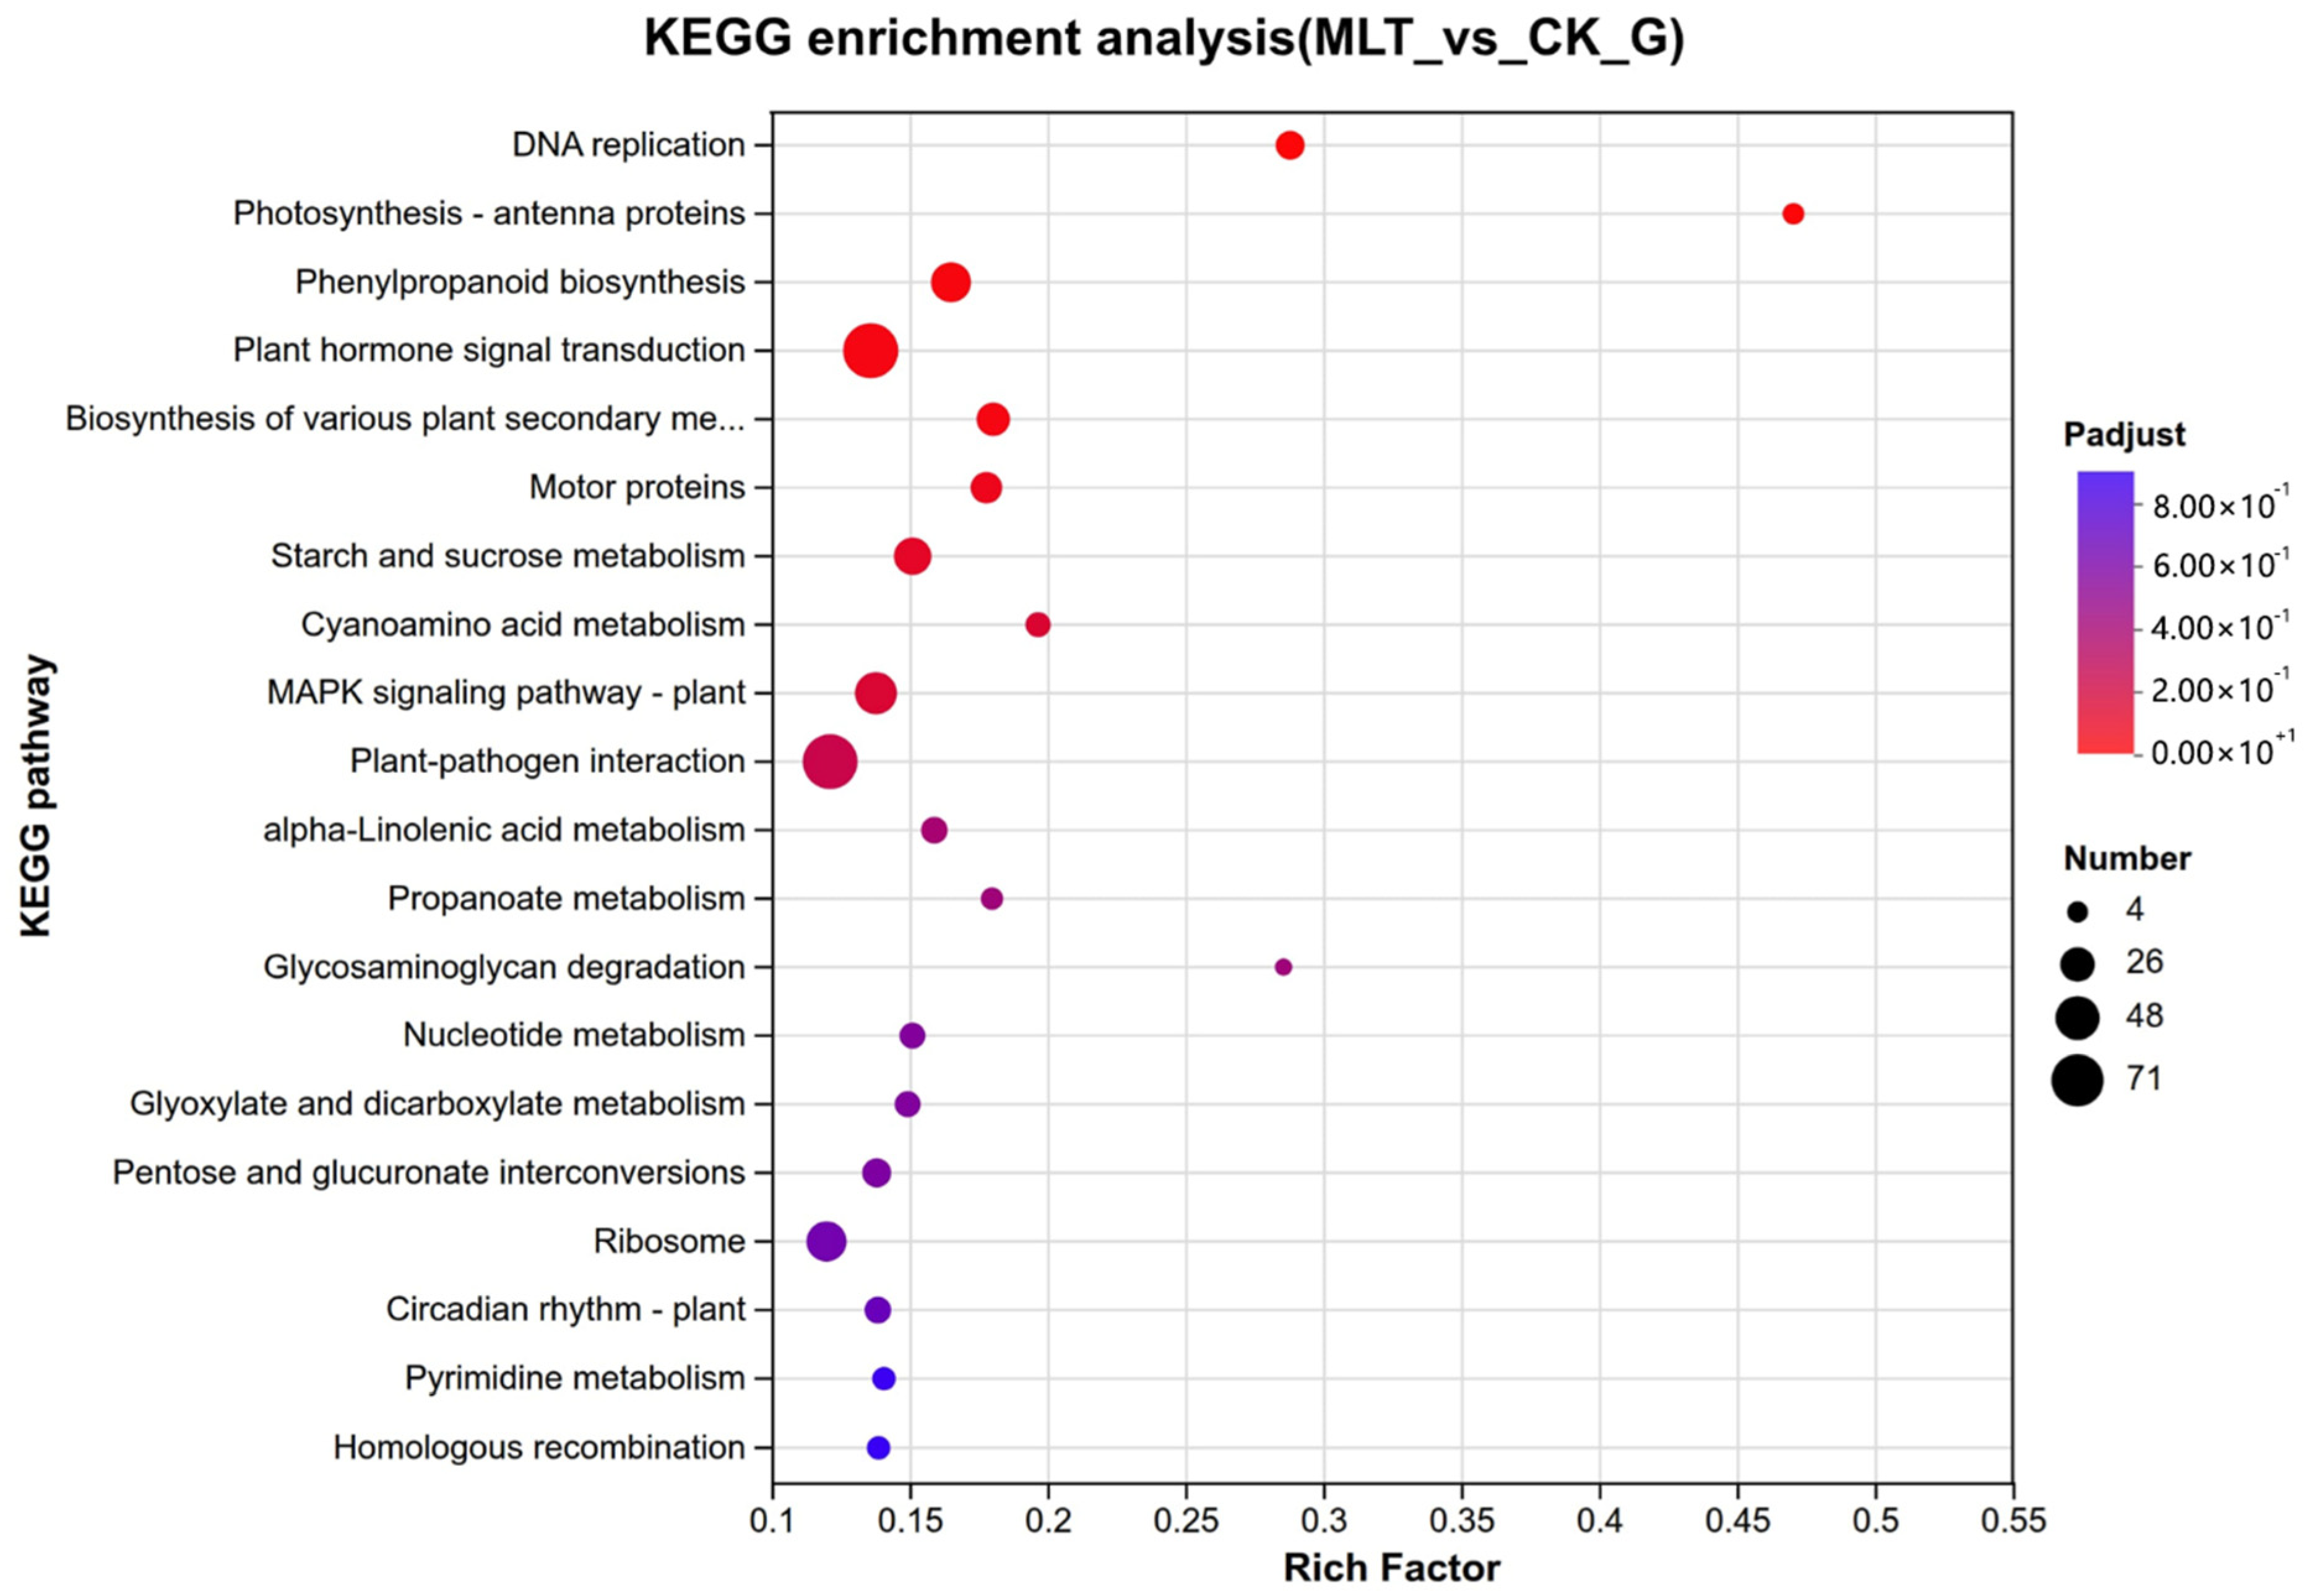
The KEGG pathway enrichment analysis of DEGs in the MLT vs. CK comparison is presented in Figure 8. Overall, the DEGs were primarily enriched in pathways related to genetic information processing (GIP), metabolism (M), and signal transduction, suggesting that melatonin treatment may influence grape rootstock root tip growth and adventitious root formation by regulating DNA replication and repair, protein synthesis, metabolic processes, cell wall remodeling, and hormone signaling.
Within the genetic information processing pathways, DEGs were predominantly enriched in DNA replication, homologous recombination, and ribosome-related pathways. These pathways are closely associated with genetic material replication, DNA damage repair, and protein translation, indicating that MLT treatment may enhance DNA replication and protein synthesis in root tip cells, thereby maintaining the division and proliferation activity of root apical meristem cells and providing a molecular basis for adventitious root primordium formation and root tip elongation.
Within metabolism-related pathways, pyrimidine metabolism and nucleotide metabolism were prominently enriched, suggesting that MLT treatment may provide sufficient precursors for DNA and RNA synthesis, thereby supporting cell cycle progression. Additionally, secondary metabolic pathways, including phenylpropanoid biosynthesis and the biosynthesis of various plant secondary metabolites, were significantly enriched. Phenylpropanoid metabolism is closely associated with the synthesis of lignin, flavonoids, and phenolic compounds, which may contribute to cell wall formation, vascular tissue differentiation, mechanical support of roots, and enhanced antioxidant capacity in root tip tissues.
Furthermore, DEGs were enriched in starch and sucrose metabolism, pentose and glucuronate interconversions, glyoxylate and dicarboxylate metabolism, propanoate metabolism, alpha-linolenic acid metabolism, and cyanoamino acid metabolism pathways. These pathways are involved in energy supply, carbon skeleton formation, synthesis of cell wall polysaccharide precursors, lipid signaling metabolism, and amino acid metabolism, potentially providing the material and energy foundation for root tip cell division, elongation, and cell wall remodeling.
In signal transduction and environmental adaptation pathways, DEGs were also enriched in plant hormone signal transduction, plant MAPK signaling pathway, plant–pathogen interaction, and circadian rhythm pathways. These pathways are closely related to endogenous hormone homeostasis, MAPK cascade responses, reactive oxygen species regulation, and environmental responses, indicating that MLT may coordinate hormone signaling and stress-response processes to regulate root tip growth and development (Figure 9).
Overall, following MLT treatment, DEGs were mainly enriched in pathways related to DNA replication and repair, nucleotide metabolism, protein translation, carbohydrate metabolism, phenylpropanoid and secondary metabolism, cell wall remodeling, and hormone/MAPK signaling. These results suggest that melatonin may promote root tip development and adventitious root formation in grape rootstocks by enhancing root cell proliferation, improving material and energy supply, regulating cell wall construction, and coordinating signaling processes.

3.5.5. Expression Patterns of Key Rooting Gene Families

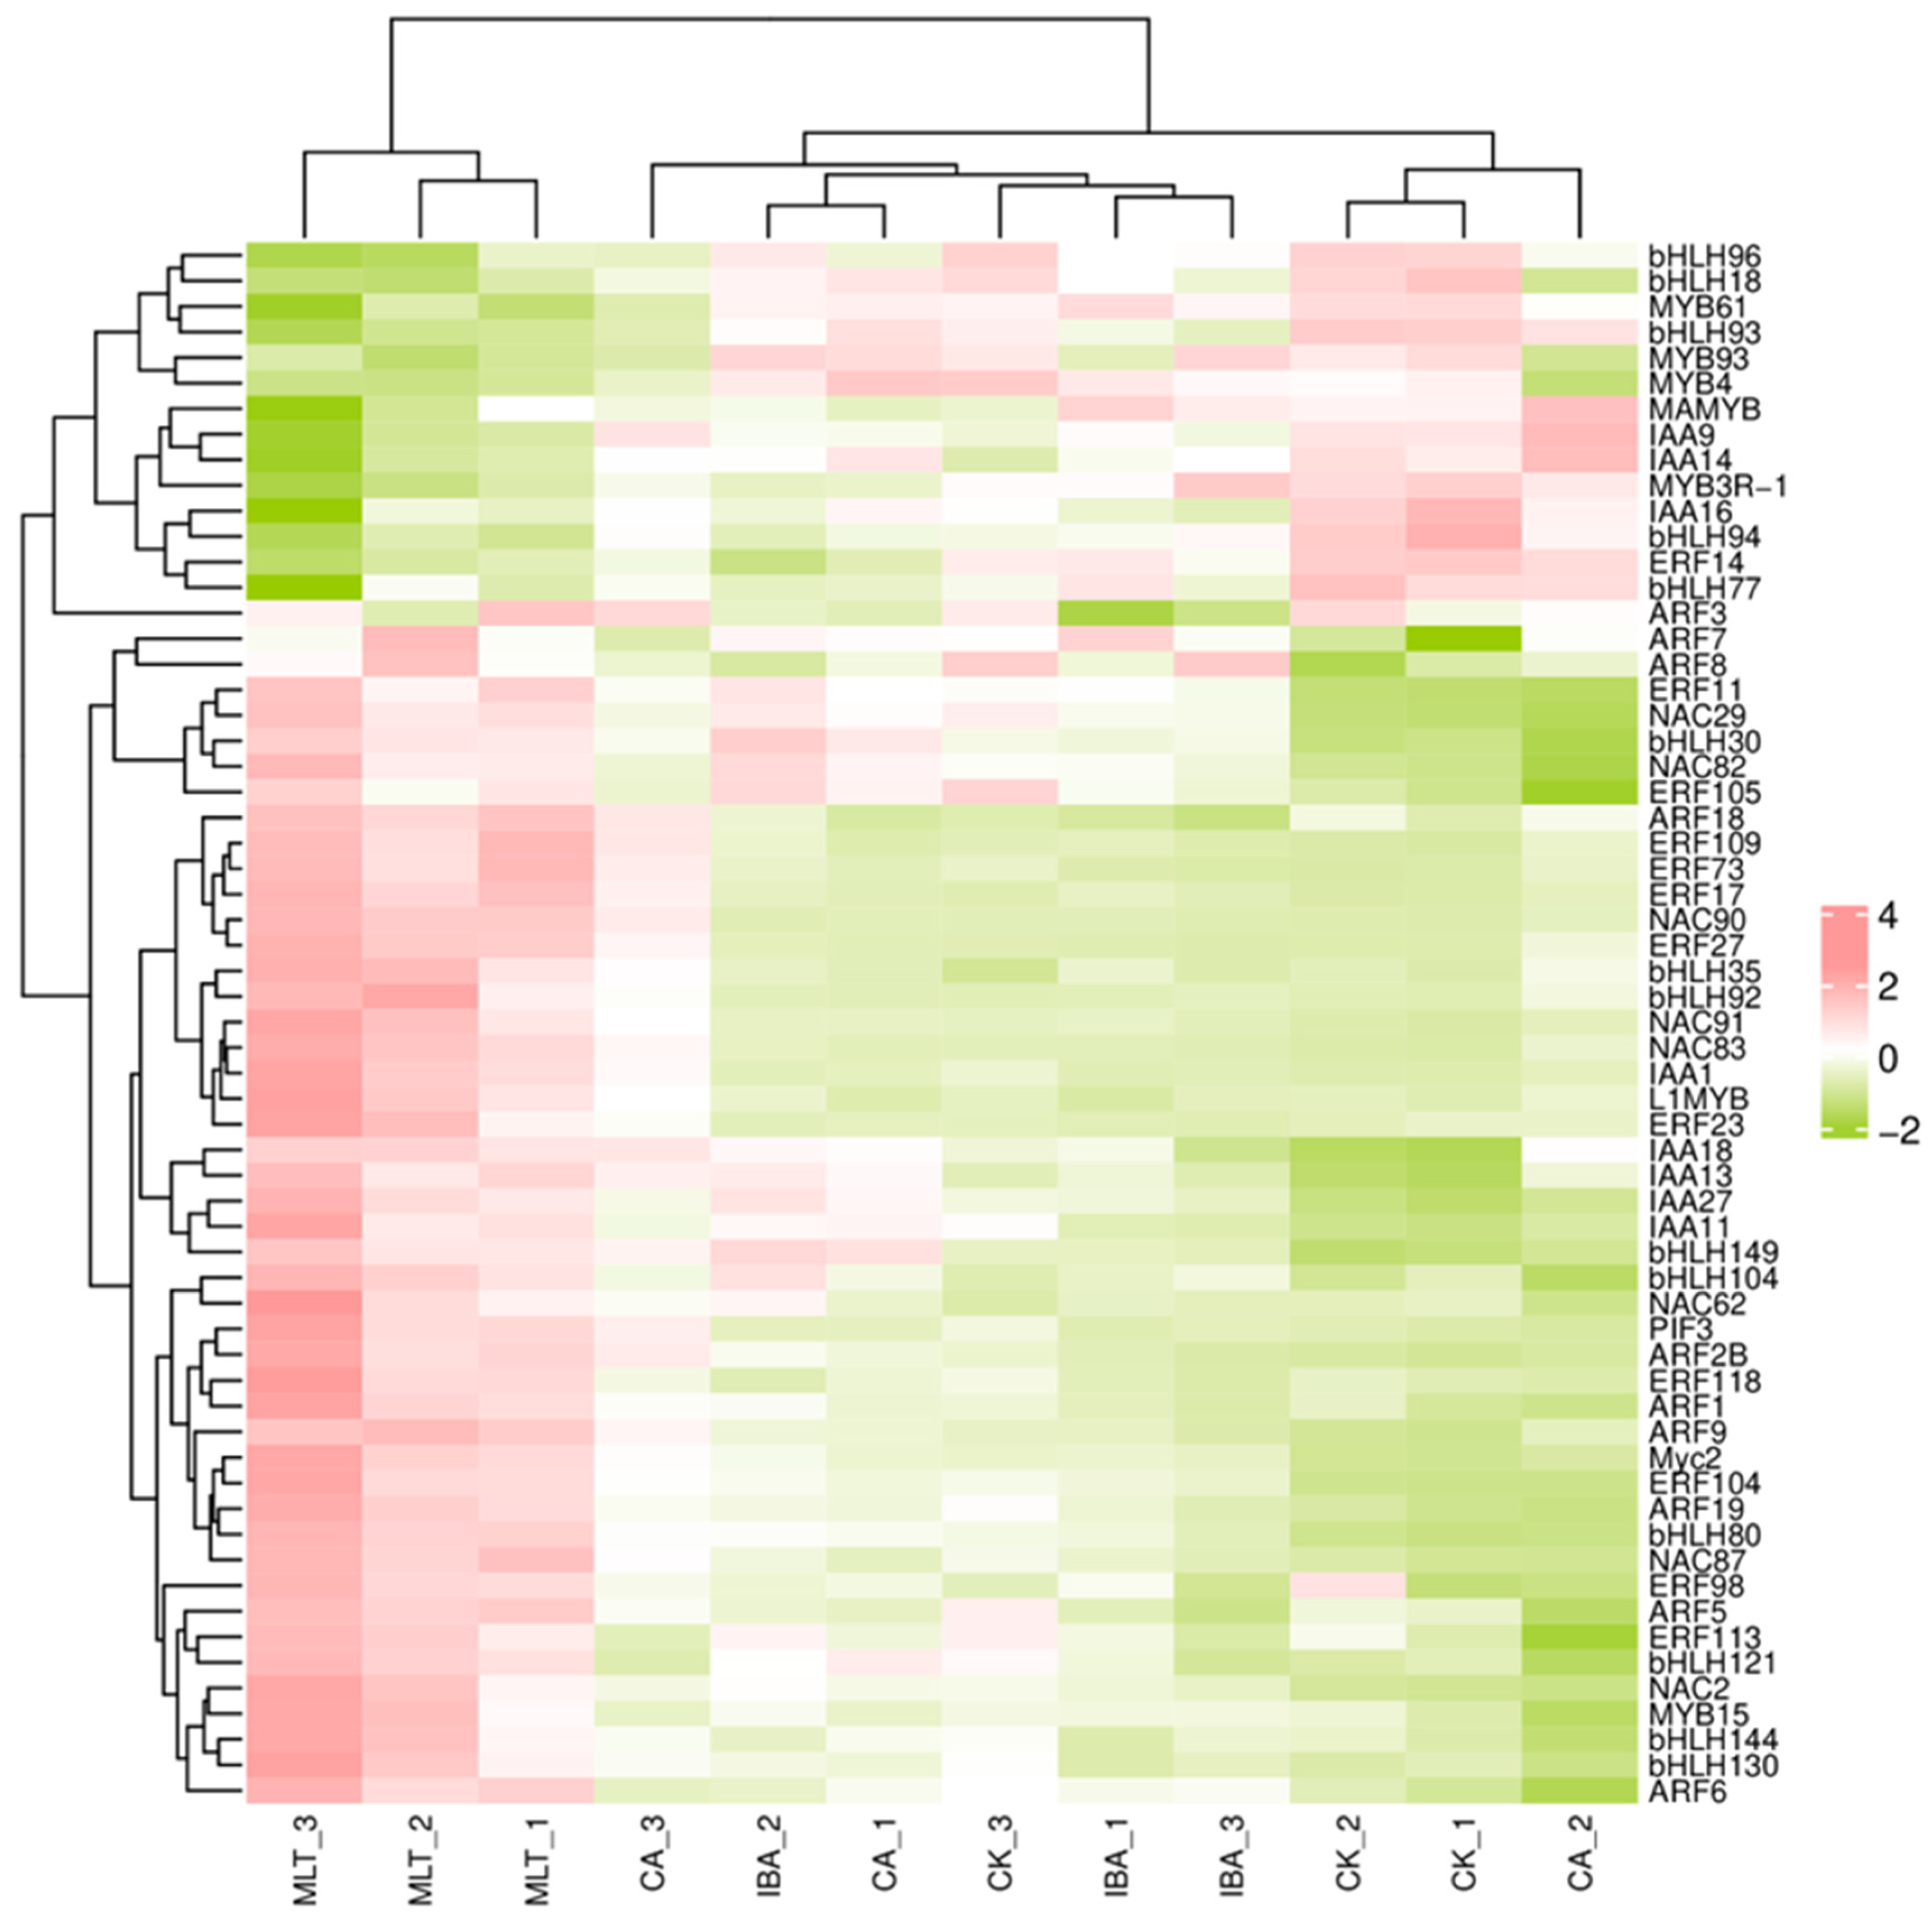
To elucidate the transcriptional regulatory mechanisms by which melatonin (MLT) and citric acid (CA) promote adventitious root formation, this study systematically analyzed the distribution of transcription factors (TFs) among differentially expressed genes (DEGs) derived from transcriptome sequencing data. Based on DEG analysis and prior literature, six TF/regulatory factor families—ERF, MYB, bHLH, NAC, AUX/IAA, and ARF—closely associated with plant hormone signaling, stress responses, and root development were selected. Hierarchical clustering was performed on the DEGs within these families, and expression heatmaps were generated (Figure 10).
The results revealed clear differential expression patterns of these six core regulatory families across treatments, with consistent trends among biological replicates, confirming data reliability. MLT treatment robustly induced the majority of the selected genes, with over 80% showing upregulation. Notably, ERF109, PIF3, NAC90, ARF19, and IAA1—genes implicated in adventitious root formation, hormone signaling, and cell division and elongation—were markedly upregulated, indicating that MLT may enhance adventitious rooting by activating key transcriptional regulatory networks.
By comparison, CA treatment exhibited more moderate effects, with only a subset of core genes showing moderate upregulation, suggesting that CA primarily regulates a limited set of rooting-related genes during adventitious root formation. Gene expression patterns under IBA treatment differed from those under MLT; some core rooting-promoting genes were less strongly upregulated, suggesting that MLT and conventional rooting hormone IBA may influence adventitious rooting via distinct transcriptional regulatory mechanisms.
Family-specific analysis indicated that ERF genes were highly responsive to MLT treatment, potentially linked to ethylene signaling, stress response, and root primordium induction. MYB, bHLH, and NAC families likely act cooperatively in controlling cell differentiation, cell wall remodeling, and root tip elongation. Changes in ARF and AUX/IAA expression highlight the auxin signaling pathway as a key route for MLT-mediated adventitious root induction. Overall, these findings suggest that MLT promotes adventitious root formation in grape rootstocks by coordinating multiple transcriptional regulatory modules—including ERF, MYB, bHLH, NAC, ARF, and AUX/IAA—to enhance hormone signaling, cell division and differentiation, and root development-related gene expression.

3.5.6. Expression Analysis of Key Genes in MLT-Specifically Enriched Pathways

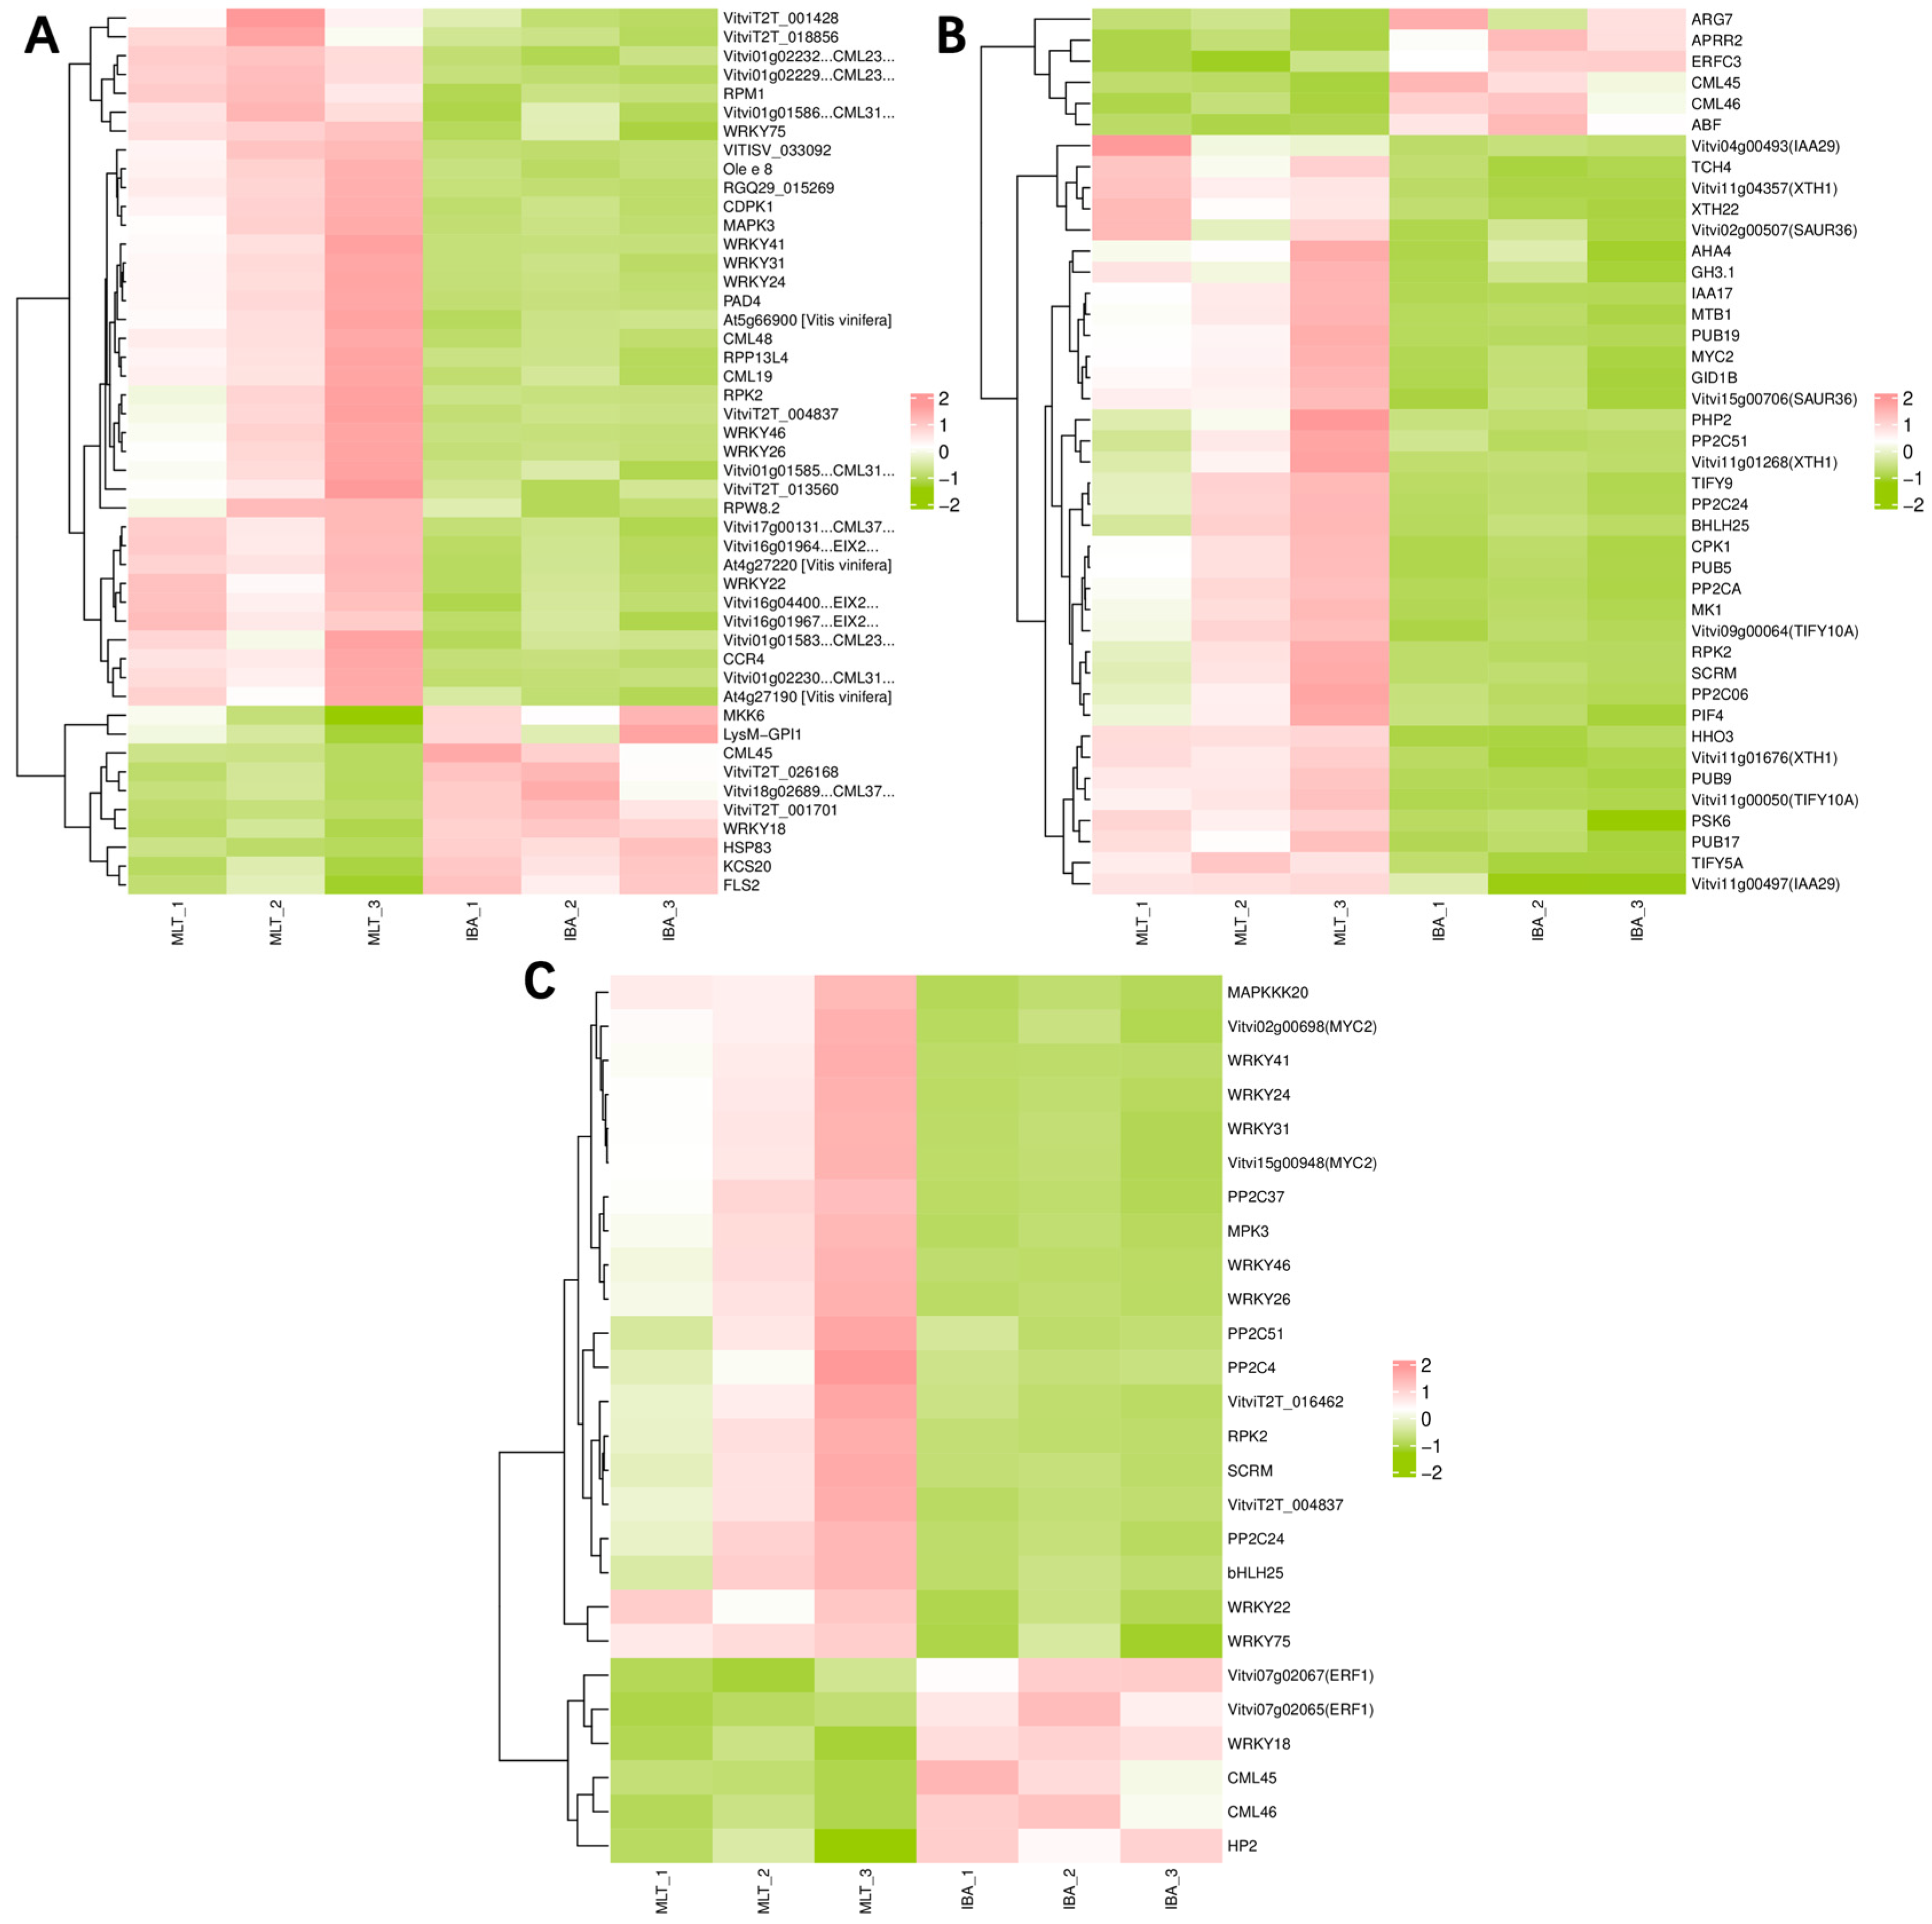
To further elucidate the specific regulatory mechanisms by which melatonin (MLT) promotes adventitious root formation in grape rootstocks, this study focused on pathways significantly enriched in the MLT treatment relative to the IBA treatment, including the plant–pathogen interaction pathway, plant hormone signal transduction pathway, and plant MAPK signaling pathway.
Within the plant–pathogen interaction pathway, MLT treatment significantly upregulated genes encoding EIX2 homologs, CML family proteins, CDPK1, MAPK3, RPM1, RPP13L4, as well as multiple WRKY transcription factors, including WRKY22, WRKY24, WRKY26, WRKY31, WRKY41, WRKY46, and WRKY75. These genes are primarily involved in pattern recognition, Ca2+ signaling, MAPK cascade activation, and defense-related transcriptional regulation. Since adventitious root formation in cuttings is commonly accompanied by wound responses and stress signal activation, the induction of these genes suggests that MLT does not simply activate immune responses; rather, it may facilitate crosstalk among defense signaling, wound responses, and developmental pathways, thereby establishing a physiological environment favorable for adventitious root formation.
In the plant hormone signal transduction pathway, MLT treatment markedly regulated multiple hormone-responsive genes. Auxin-responsive genes, including IAA17, IAA29, GH3.1, and SAUR36, were significantly upregulated, indicating that auxin signaling may represent a central regulatory pathway in MLT-mediated adventitious root formation. Simultaneously, cell wall remodeling-related genes such as TCH4, XTH1, and XTH22 were also significantly induced, suggesting that MLT may promote cell wall loosening and restructuring, thereby facilitating root primordium emergence and root elongation. In addition, genes associated with multiple hormone signaling pathways, including GID1B, TIFY, PP2C, CPK1, MK1, and members of the PUB family, were differentially regulated, implying that MLT may coordinately integrate gibberellin, jasmonic acid, abscisic acid, and brassinosteroid signaling during adventitious root development.
Within the plant MAPK signaling pathway, MLT treatment significantly upregulated core MAPK cascade components, including MAPKKK20 and MPK3, while simultaneously activating downstream regulatory genes such as WRKY, bHLH, PP2C, and RPK2. As a central signaling hub linking environmental stimuli, hormone signaling, defense responses, and developmental regulation, the MAPK pathway likely plays an essential role in coordinating stress adaptation and root developmental processes. These findings suggest that MLT may activate MAPK cascade signaling to further regulate downstream transcription factors and hormone-responsive genes, thereby integrating stress responses with adventitious root formation.
Collectively, compared with IBA treatment, MLT exhibited a more pronounced signal integration effect. Its rooting-promoting activity may depend on a coordinated regulatory network involving “defense/wound response–MAPK signaling–multihormone regulation–cell wall remodeling.” Within this network, auxin signaling appears to function as the central regulatory axis, while Ca2+ signaling, WRKY-mediated transcriptional regulation, MAPK cascade activation, and multihormone interactions collectively contribute to the initiation, emergence, and elongation of adventitious root primordia in grape rootstocks.

4. Discussion

Adventitious root formation in hardwood cuttings is a complex developmental process that generally involves several successive stages, including wound perception, callus or cambial cell activation, cell dedifferentiation, root founder cell specification, root primordium initiation, primordium emergence through surrounding tissues, and subsequent root elongation. In grape hardwood cuttings, this process is particularly dependent on the physiological status of dormant cane tissues, carbohydrate reserves, endogenous auxin distribution, oxidative stre42ss balance, and the ability of cambial or parenchyma cells near the basal cutting region to regain meristematic activity. After cutting, mechanical injury rapidly activates wound-related signaling, reactive oxygen species (ROS) production, calcium signaling, and hormone redistribution. These early responses interact with auxin signaling to trigger cell division and root primordium initiation. During later stages, sufficient energy supply, soluble carbohydrate availability, protein synthesis, cell wall loosening, and vascular reconnection are required for root primordium emergence and root elongation. Therefore, adventitious rooting should be considered as an integrated developmental and physiological process rather than a response controlled by a single regulator.
In this context, our experiments using commercial rooting agents and novel compound formulations provide empirical insights. Commercial rooting agent ABT, one of the most widely applied rooting stimulants in horticultural and fruit tree propagation, has been extensively used in grape, apple, citrus, and forest species through cuttings and air-layering. The primary active components of ABT are auxins, including IBA and NAA [28]. These compounds promote cell division and differentiation and induce the conversion of cambial cells into root primordia, thereby accelerating adventitious root formation and enhancing rooting rate and root system quality [29]. Previous studies have demonstrated that ABT significantly improves rooting rate, root number, and root vitality in grape cuttings, while also enhancing seedling adaptability to environmental stresses [30]. Our air-layering results further indicated that ABT exhibited favorable rooting-promoting effects across seven grape rootstock genotypes, with average rooting rates markedly higher than the water-treated control. However, rooting performance in certain rootstocks remained constrained by genotype-dependent effects. These findings suggest that although conventional commercial rooting agents such as ABT have a well-established production basis and stable application performance, their rooting efficiency still varies among different grape rootstocks, and their capacity to comprehensively improve root quality remains limited. Therefore, introducing novel bioactive compounds such as melatonin (MLT) and citric acid (CA) into formulations represents an important strategy for improving vegetative propagation efficiency. Our results showed that after combined application of IBA with MLT or CA, the rooting rate, rooting performance index, and root physiological activity in certain rootstocks were superior to those observed under ABT treatment, indicating that newly developed compound rooting agents hold promising potential for large-scale grape rootstock propagation.
Indole-3-butyric acid (IBA) is a commonly used auxin-type regulator in woody plant cutting propagation. It induces adventitious root formation by activating auxin signaling pathways, promoting cell dedifferentiation and redifferentiation, and regulating redox homeostasis [31,32]. In this study, a concentration of 400 mg/L IBA was used as the base formulation for compound treatments. The results showed that combining IBA with either MLT or CA improved rooting performance of hardwood cuttings to varying degrees. Among these, 400 mg/L IBA + 1.2 mM MLT exhibited the most favorable overall performance, suggesting that MLT can serve as an effective auxiliary component to enhance adventitious root formation capacity.
Melatonin (MLT) is an indole-based compound widely present in plants and is involved in plant growth and development, antioxidant defense, and hormonal signaling regulation [16,17,33,34]. Recent studies have demonstrated that melatonin can regulate root architecture by modulating auxin synthesis, transport, and signaling, as well as by affecting ROS homeostasis and the expression of genes involved in cell division and cell wall modification [17,18,35]. For instance, Mao et al. (2020) [15] showed that melatonin promotes adventitious root formation in apple by enhancing the function of MdWOX11, and Xu et al. (2025) [36] reported that MLT promotes grape root growth by regulating endogenous hormones, signaling molecules, and secondary metabolism. In the present study, MLT compound treatments significantly improved rooting rate, root number, and root length across multiple rootstocks, further confirming its strong potential in promoting rooting during grape rootstock cutting propagation. Importantly, the observed increase in endogenous IAA content under MLT treatment, together with upregulation of auxin-responsive genes (IAA17, IAA29, GH3.1, SAUR36) in the transcriptome, supports the view that MLT enhances auxin signaling, which is a central driver of root primordium initiation [18,35]. Moreover, MLT treatment also affected the levels of ABA, GA3, JA, and SA, indicating that it may coordinate multiple hormonal pathways to create a favorable hormonal balance for rooting. This multi-hormone network is consistent with recent reports that melatonin acts as a master regulator integrating auxin, gibberellin, jasmonate, and abscisic acid signals during root development [37,38].
It should be noted that all MLT treatments in this study were applied in combination with a fixed concentration of IBA (400 mg/L), rather than as standalone applications. Therefore, the observed rooting-promoting effects cannot be solely attributed to MLT; rather, they likely reflect a synergistic interaction between MLT and IBA. IBA may establish a foundational auxin signaling environment that primes cambial cells for root primordium initiation, while MLT may further optimize this process by modulating antioxidant capacity, carbohydrate metabolism, and stress-responsive gene expression. This interpretation is supported by the fact that the IBA + NAA (IN) treatment also achieved considerable rooting rates, indicating that IBA alone is sufficient to induce rooting to a substantial degree. Future experiments using IBA alone, MLT alone, and inhibitor-based approaches are required to dissect the causal roles of MLT and its interaction with auxin.
Citric acid (CA), a central intermediate of the tricarboxylic acid (TCA) cycle, may also contribute to adventitious rooting through several physiological mechanisms. As a key organic acid in respiratory metabolism, CA is closely associated with energy supply, ATP production, and carbon skeleton provision for amino acid and cell wall precursor synthesis [20,21]. In addition, CA can influence rhizosphere pH, metal ion chelation, nutrient availability, and cellular pH regulation, which may enhance mineral uptake and maintain metabolic activity under stress conditions during cutting propagation [20]. Recent studies have shown that exogenous CA can alter root morphology and development through ROS-dependent and ROS-independent pathways [20], and that CA in root exudates can promote beneficial microbial colonization and plant growth [21]. In our study, CA combined with IBA (especially IC2, 400 mg/L IBA + 0.3% CA) significantly improved root number, root length, and root activity in several rootstocks, although its overall comprehensive performance was slightly lower than the optimal MLT formulation. The CA treatment tended to reduce ABA content and increase SA content, suggesting that CA may alleviate stress and promote defense-related signaling, which could facilitate root initiation under wound-induced conditions. These results indicate that CA acts as a supportive supplement to IBA, primarily through enhancing energy metabolism and stress tolerance, rather than through direct hormonal signaling like MLT.
Adventitious root formation requires sufficient energy and material resources. Soluble sugars provide substrates for respiration and carbon skeletons for cell division, while soluble proteins are involved in enzymatic reactions, structural construction, and signal transduction [39,40,41,42,43]. In this study, MLT and CA compound treatments increased root soluble sugar and soluble protein contents as well as root vigor. These findings are consistent with Zhang et al. (2022) [23], who reported that MLT increased soluble sugar content and promoted protein-to-sugar conversion in lily, and with Duan et al. (2022) [44], who demonstrated that MLT enhanced soluble sugar, protein, and root activity in cotton under salt stress. The increased root activity indicates enhanced absorptive and metabolic capacity of newly formed roots, which is beneficial for post-rooting growth and seedling establishment. These results suggest that compound treatments provide a physiological foundation for adventitious root initiation and new root growth by improving carbon-nitrogen metabolism and overall root metabolic activity.
Endogenous hormone balance is a key factor regulating adventitious root formation. IAA promotes root primordium initiation and cell division, whereas ABA is generally associated with growth inhibition and stress responses. GA3, JA, and SA may also participate in root development and wound responses through interactions with auxin signaling [19,45,46,47,48,49,50]. The differential ABA responses to MLT and CA reflect distinct modes of action. Under CA treatment, enhanced TCA-cycle-mediated energy metabolism alleviates metabolic stress that triggers ABA biosynthesis, while increased soluble sugars may exert feedback inhibition on NCED activity, a key enzyme in ABA synthesis [20]. The antagonistic IAA–ABA interaction, where elevated IAA suppresses ABA accumulation, may also contribute. Conversely, maintained or slightly elevated ABA under MLT is consistent with melatonin’s role as a stress-priming molecule [16,33]. Moderate ABA elevation may facilitate vascular differentiation and root maturation, while concurrent IAA increase prevents excessive growth inhibition [47]. This interpretation is supported by differential regulation of PP2C and other ABA signaling genes in the transcriptome.
The MLT-induced GA3 increase underpins improved root elongation. GA3 promotes cell elongation via DELLA degradation, permitting expression of cell wall-loosening genes, including XTH and expansin families [48]. The synergistic auxin–GA3 interaction—auxin stimulates GA biosynthesis via GA20ox, while GA signaling enhances auxin responsiveness—likely amplifies root elongation under MLT. Upregulation of GID1B (GA receptor) further supports GA signaling activation at the transcriptional level. Together, these results indicate that MLT promotes a favorable auxin–GA3 balance coordinately supporting root primordium initiation and subsequent elongation. In this study, MLT treatment increased IAA content and modulated ABA, GA3, JA, and SA levels, suggesting that MLT may optimize multi-hormonal balance to establish an endogenous hormonal environment favorable for adventitious root formation. Notably, the increase in IAA content was consistent with the observed improvement in rooting traits, indicating that enhanced auxin signaling is one of the key mechanisms by which MLT promotes rooting. The reduction in ABA under CA treatment may reduce stress-induced inhibition, while the elevation of SA could enhance defense priming, both of which may indirectly support root development. Gökbayrak et al. (2020) [51] also confirmed that melatonin can induce adventitious root formation in the grape rootstock 5BB, supporting our findings.
To elucidate the molecular mechanisms of MLT, we performed transcriptome sequencing on root tips of the ‘110R’ grape rootstock. It should be noted that this transcriptome primarily reflects the molecular responses of newly formed root tissues under individual treatments with MLT, IBA, or CA, and the synergistic mechanisms in combined treatments require further validation. The results showed that MLT treatment induced a large number of differentially expressed genes (2301 DEGs), triggering a broader transcriptional response compared to IBA or CA alone. Similarly, Wang et al. (2022) [52] reported that MLT promotes adventitious root formation in cucumber hypocotyls through transcriptional reprogramming.
GO and KEGG enrichment analyses indicated that MLT significantly affects processes including DNA replication, cell cycle, ribosome function, starch and sucrose metabolism, phenylpropanoid biosynthesis, plant hormone signal transduction, MAPK signaling, and plant–pathogen interactions. Specifically, DNA replication, cell cycle, and ribosome pathways are associated with cell division and protein synthesis, providing the cellular machinery for root primordium formation. Starch and sucrose metabolism aligns with the observed accumulation of soluble sugars, indicating enhanced energy supply. Phenylpropanoid metabolism and cell wall–related processes (e.g., TCH4, XTH1, XTH22) may contribute to cell wall loosening and remodeling, facilitating root primordium emergence and elongation [53]. Plant hormone signaling enrichment is consistent with the endogenous hormone changes observed in this study. These findings are in agreement with Xu et al. (2025) [36], who investigated MLT-regulated transcriptional networks involved in grape root development.
The transcriptome analysis indicated that IBA–MLT treatment coordinately regulated multiple biological processes essential for adventitious rooting. The transcriptomic data directly link gene expression changes to the observed physiological improvements. The increase in soluble sugar content under MLT treatment is supported by upregulation of starch and sucrose metabolism genes, including α-amylase, β-amylase, and sucrose synthase, which promote carbohydrate mobilization from storage reserves [54]. The enhanced root activity (TTC reduction) correlates with transcriptional upregulation of TCA cycle, oxidative phosphorylation, and ATP synthesis genes, confirming that improved root vigor has a molecular basis in enhanced energy metabolism. The improvement in root length is mechanistically linked to upregulation of cell wall remodeling genes (TCH4, XTH1, XTH22), which encode xyloglucan endotransglucosylase/hydrolases that catalyze cell wall loosening and expansion [53]. The increased IAA content aligns with activation of auxin-responsive genes (IAA17, IAA29, GH3.1, SAUR36), while elevated GA3 is consistent with upregulation of GID1B and modulation of DELLA-related transcripts [17,48]. Additionally, enrichment of phenylpropanoid biosynthesis pathways provides a molecular basis for enhanced antioxidant capacity, as phenylpropanoids mitigate oxidative stress during root primordium formation [4]. Collectively, these transcriptome–physiology connections confirm that MLT promotes rooting through a coordinated regulatory network integrating hormone balance, energy metabolism, cell wall remodeling, and stress signaling. Enrichment of hormone signal transduction genes, particularly auxin-related ones, suggests roles in founder cell activation and root primordium initiation, while changes in ABA, JA, SA, and GA signaling may reflect stress adjustment and developmental transitions. MAPK pathway enrichment implies transduction of wound and treatment signals via stress perception and ROS signaling. Differential expression of carbohydrate metabolism genes indicates enhanced energy supply for root development, and cell cycle- and cell wall-related genes suggest activation of cell division and wall remodeling, which are critical for primordium emergence and root elongation. Thus, the transcriptome supports a model in which MLT promotes rooting through integrated regulation of hormone signaling, stress responses, energy metabolism, and structural remodeling.
Within plant hormone signaling pathways, MLT upregulated auxin-responsive genes such as IAA17, IAA29, GH3.1, and SAUR36, suggesting that it enhances root sensitivity to auxin signaling [18,35]. Upregulation of cell wall-modifying genes, including TCH4, XTH1, and XTH22, may facilitate root primordium emergence and elongation [53]. Additionally, changes in genes such as GID1B (GA signaling), TIFY (JA signaling), and PP2C (ABA signaling) indicate that MLT may also participate in GA3, JA, and ABA pathways, thereby constructing a multi-hormone network with auxin as the central regulator [37,44].
Notably, MLT treatment significantly enriched pathways related to plant–pathogen interactions and MAPK signaling, with upregulation of genes such as CML, CDPK1, MAPK3, and multiple WRKY transcription factors [55]. The activation of MAPK signaling under MLT treatment acts as a coordinated hub integrating wound, hormonal, and developmental signals, rather than a mere stress response. Cutting-induced ROS and DAMPs activate MAPK cascades, particularly MPK3 and MPK6, which phosphorylate downstream WRKY transcription factors to regulate wound healing, oxidative stress tolerance, and cell cycle progression [55,56]. MPK3 also modulates auxin responsiveness by phosphorylating AUX/IAA proteins and influences ethylene production via ACC synthase regulation [57]. Concurrent upregulation of calcium signaling genes (CML, CDPK1) further supports this integration, as Ca2+ fluxes activate MAPK cascades through calcium-dependent kinases, forming a Ca2+ → CDPK → MAPK → WRKY signaling module that coordinates stress adaptation and root developmental reprogramming [56]. This framework aligns with recent reports identifying MLT as a modulator of MAPK cascades during plant stress responses and developmental transitions [38,57]. The cutting process involves mechanical wounding and oxidative stress, and moderate activation of Ca2+, MAPK, and WRKY-mediated defense/wound responses may help maintain cellular homeostasis and promote adventitious root induction [56]. This is consistent with the findings of Wang et al. (2022) [52], who observed significant enrichment of the plant–pathogen interaction pathway during MLT-promoted adventitious rooting in cucumber, and aligns with the recent review by Mansoor et al. (2024) describing MLT as a regulator of MAPK cascades [57]. Khan et al. (2022) also reported that MLT regulates plant stress responses and growth via MAPK signaling [38]. Therefore, the MAPK pathway may serve as a key signaling hub linking wound responses, hormone regulation, and root development under MLT treatment. The coordinated regulation of defense/wound signaling, MAPK cascades, hormone pathways, and cell wall remodeling suggests that MLT promotes rooting not by a single linear pathway but through an integrated network that prepares the cutting for both stress adaptation and developmental reprogramming.
In summary, combining IBA with either MLT or CA can improve the rooting of hardwood cuttings in grape rootstocks, with 400 mg/L IBA + 1.2 mM MLT showing the most favorable effect. The integrated physiological and transcriptomic analyses reveal that MLT promotes adventitious root formation through three interconnected regulatory layers: (1) at the metabolic level, by enhancing soluble sugar and protein accumulation and root respiratory activity, as supported by the upregulation of starch/sucrose metabolism and TCA cycle genes; (2) at the hormonal level, by increasing IAA and GA3 while modulating ABA, JA, and SA to create a favorable hormonal balance, as corroborated by the activation of auxin-responsive and GA signaling genes; and (3) at the transcriptional level, by activating hormone signaling, MAPK cascades, cell cycle, and cell wall remodeling pathways. The concordance between physiological measurements and transcriptomic profiles validates that the observed rooting promotion has a solid molecular basis, while the genotype-specific responses highlight the importance of cultivar-adapted optimization for practical propagation applications. MLT may promote adventitious root formation and new root growth by (1) enhancing nutrient metabolism and root vigor; (2) regulating the balance of endogenous hormones (IAA, ABA, GA3, JA, SA); and (3) activating pathways related to the cell cycle, carbohydrate metabolism, phenylpropanoid metabolism, hormone signaling, MAPK signaling, and wound/defense responses. Citric acid primarily acts through energy metabolism and stress alleviation, with moderate effects. However, because MLT and CA were applied together with IBA, the present results reflect combined treatment effects. Future studies integrating qRT-PCR, inhibitor treatments, and functional validation of key genes (e.g., IAA17, MAPK3, WRKY families) are still needed to further elucidate the molecular mechanisms underlying the synergistic promotion of rooting by MLT and IBA. Additionally, large-scale nursery validation and cost–benefit analyses are required to assess the practical applicability of these optimized formulations in commercial grape rootstock production.
A limitation of this study is that selected differentially expressed genes were not validated by qRT-PCR. Although the RNA-seq data provided useful information on candidate genes and pathways associated with adventitious root formation under IBA–MLT treatment, further qRT-PCR validation and functional analyses are required to confirm the expression patterns and biological roles of these genes.


Author Contributions

X.W. and M.T. supervised the project. Y.Y., Y.M., Y.Z. and J.C. conceived the study and designed the experiments. Y.Y., Y.M., Y.Z. and J.C. analyzed data and wrote the manuscript. All authors have read and agreed to the published version of the manuscript.

Funding

This study was funded by Special projects on biological seed industry and intensive processing of agricultural products (202402AE090004-02) and Guangxi Key Research and Development Program (GuikenongAB241484010).

Data Availability Statement

The original contributions presented in this study are included in the article. Further inquiries can be directed to the corresponding author.

Conflicts of Interest

The authors declare that they have no known competing financial interests or personal relationships that could have appeared to influence the work reported in this paper.

References

  1. Zhang, Z. Current Status and Development Trends of Grape Seedling Production in China. Chin. Foreign Grapes Wines 2015, 75. [Google Scholar] [CrossRef]
  2. Liu, Y.; Guo, J.; Li, L. Overview of Research on Grapevine Rootstock Stress Resistance. J. North. Agric. 2017, 45, 105–108. [Google Scholar]
  3. Zhang, M.; Zhang, X.; Ma, T.; Sun, Y.; Zhang, J.; Liang, J.; Yao, W. Research progress on the effects of rootstock on grape growth and development, fruit quality, and stress resistance. J. Fruit Sci. 2026, 43, 407–423. [Google Scholar] [CrossRef]
  4. Tang, H.; Wang, Q.; Xie, H.; Li, W. The function of secondary metabolites in resisting stresses in horticultural plants. Fruit Res. 2024, 4, e021. [Google Scholar] [CrossRef] [Scilit]
  5. Zhao, Q.; Sun, P.; Zhang, L.; Xu, X.; Li, Z. Overview of stress resistant grape rootstock. North. Fruits 2024, 1–4. [Google Scholar] [CrossRef]
  6. Zang, Y.; Lv, S.; Li, B.; Zhang, L.; Xie, K.; Yang, J.; Xi, Z. Different Rootstock Effects on the Drought Resistance of Vitis vinifera L. Wine Grape Marselan. Physiol. Plant. 2025, 177, e70587. [Google Scholar] [CrossRef] [Scilit] [PubMed]
  7. Han, X.; Wang, Y.; Lu, H.C.; Yang, H.Y.; Li, H.Q.; Gao, X.T.; Pei, X.X.; He, F.; Duan, C.Q.; Wang, J. The combined influence of rootstock and vintage climate on the grape and wine flavonoids of Vitis vinifera L. cv. Cabernet Sauvignon in eastern China. Front. Plant Sci. 2022, 13, 978497. [Google Scholar] [CrossRef] [Scilit] [PubMed]
  8. Minio, A.; Cochetel, N.; Massonnet, M.; Figueroa-Balderas, R.; Cantu, D. HiFi chromosome-scale diploid assemblies of the grape rootstocks 110R, Kober 5BB, and 101-14 Mgt. Sci. Data 2022, 9, 660. [Google Scholar] [CrossRef] [Scilit] [PubMed]
  9. D’Amico, F.; Candela, M.; Turroni, S.; Biagi, E.; Brigidi, P.; Bega, A.; Vancini, D.; Rampelli, S. The Rootstock Regulates Microbiome Diversity in Root and Rhizosphere Compartments of Vitis vinifera Cultivar Lambrusco. Front. Microbiol. 2018, 9, 2240. [Google Scholar] [CrossRef] [Scilit] [PubMed]
  10. Oliveira, C.R.S.; Mendonca Junior, A.F.; Leão, P.C.S. Rootstock Effects on Fruit Yield and Quality of ‘BRS Tainá’ Seedless Table Grape in Semi-Arid Tropical Conditions. Plants 2024, 13, 2314. [Google Scholar] [CrossRef] [Scilit] [PubMed]
  11. Blois, L.; de Miguel, M.; Bert, P.F.; Ollat, N.; Rubio, B.; Voss-Fels, K.P.; Schmid, J.; Marguerit, E. Dissecting the genetic architecture of root-related traits in a grafted wild Vitis berlandieri population for grapevine rootstock breeding. Theor. Appl. Genet. 2023, 136, 223. [Google Scholar] [CrossRef] [Scilit] [PubMed]
  12. Fichtl, L.; Steng, K.; Schnepf, A.; Friedel, M. Rootstock genotype shapes whole-plant 3-D architecture and biomass allocation in field-grown grapevines. Ann. Bot. 2025, 136, 1613–1629. [Google Scholar] [CrossRef] [Scilit] [PubMed]
  13. Wu, J.; Shi, J.; Zhao, Y.; Li, Y.; Chen, Y.; Ma, Y.; Pan, W.; Du, Y.; Wu, J. Effects of disinfection, substrates, and plant growth regulators on scale propagation in Lilium spp. Ornam. Plant Res. 2025, 5, e036. [Google Scholar] [CrossRef] [Scilit]
  14. Ji, Y.; Xue, L.; Lei, J. Regulation of scape elongation through gibberellin and auxin detected by hormone metabolomic profiling in Clivia miniata. Ornam. Plant Res. 2025, 5, e041. [Google Scholar] [CrossRef] [Scilit]
  15. Mao, J.; Niu, C.; Li, K.; Chen, S.; Tahir, M.M.; Han, M.; Zhang, D. Melatonin promotes adventitious root formation in apple by promoting the function of MdWOX11. BMC Plant Biol. 2020, 20, 536. [Google Scholar] [CrossRef] [Scilit] [PubMed]
  16. Liang, C.; Xu, H.; Li, D.; Ma, C.; Lv, Y.; Liu, J. Melatonin: A multifaceted regulator of root development, stress responses, and hormonal crosstalk in horticultural crops. Front. Plant Sci. 2026, 17, 1718959. [Google Scholar] [CrossRef] [Scilit] [PubMed]
  17. Wei, W.; Tao, J.J.; Yin, C.C.; Chen, S.Y.; Zhang, J.S.; Zhang, W.K. Melatonin regulates gene expressions through activating auxin synthesis and signaling pathways. Front. Plant Sci. 2022, 13, 1057993. [Google Scholar] [CrossRef] [Scilit] [PubMed]
  18. Yang, L.; You, J.; Li, J.; Wang, Y.; Chan, Z. Melatonin promotes Arabidopsis primary root growth in an IAA-dependent manner. J. Exp. Bot. 2021, 72, 5599–5611. [Google Scholar] [CrossRef] [Scilit] [PubMed]
  19. Tian, Q.; Wang, G.; Dou, J.; Niu, Y.; Li, R.; An, W.; Tang, Z.; Yu, J. Melatonin Modulates Tomato Root Morphology by Regulating Key Genes and Endogenous Hormones. Plants 2024, 13, 383. [Google Scholar] [CrossRef] [Scilit] [PubMed]
  20. Zhang, T.; Peng, J.T.; Chu, J.; Luo, S.; Lee, J.; Sánchez Rodríguez, D.B.; Gundran, K.; Xia, X.; Garay-Arroyo, A.; Richardson, J.A.; et al. Citric acid alters Arabidopsis root morphology and development through ROS-dependent and ROS-independent mechanisms. Plant Physiol. 2026, 201, kiag194. [Google Scholar] [CrossRef] [Scilit] [PubMed]
  21. Jiao, H.; Xu, W.; Hu, Y.; Tian, R.; Wang, Z. Citric Acid in Rice Root Exudates Enhanced the Colonization and Plant Growth-Promoting Ability of Bacillus altitudinis LZP02. Microbiol. Spectr. 2022, 10, e0100222. [Google Scholar] [CrossRef] [Scilit] [PubMed]
  22. Zhang, N.; Liu, S. High altitude pressure rooting experiment of seedless white heart grape. Agric. Technol. Serv. 2012, 29, 932. [Google Scholar]
  23. Zhang, D.; Zhong, K.; Jiang, Z.; Zhou, Y.; Zhang, H.; Qin, Z. The Effects of Matrix and Plant Growth Regulators on Hard Branch Cutting of Sunshine Rose Grape. S. China Fruits 2022, 51, 125–128. [Google Scholar] [CrossRef]
  24. Yemm, E.W.; Willis, A.J. The estimation of carbohydrates in plant extracts by anthrone. Biochem. J. 1954, 57, 508–514. [Google Scholar] [CrossRef] [Scilit] [PubMed]
  25. Bradford, M. A Rapid and Sensitive Method for the Quantitation of Microgram Quantities of Protein Utilizing the Principle of Potein-Dye Binding. Anal. Biochem. 1976, 72, 248–254. [Google Scholar] [CrossRef] [PubMed]
  26. Bai, B.; Bai, S.; Jin, J.; Huang, L. Improvement of TTC Determination Method for Corn Root Vitality. Corn Sci. 1994, 2, 044–047. [Google Scholar]
  27. Cai, W.J.; Ye, T.T.; Wang, Q.; Cai, B.D.; Feng, Y.Q. A rapid approach to investigate spatiotemporal distribution of phytohormones in rice. Plant Methods 2016, 12, 47. [Google Scholar] [CrossRef] [Scilit] [PubMed]
  28. Qin, Z.; Wang, T.; Song, Z.; Dou, H.; Luo, C.; Zhang, X.; Sun, H.; Zhang, B.; Hou, Y.; Sun, S.; et al. ABT Promotes Adventitious Root Formation in Mulberry Cuttings by Coordinating Hormonal Homeostasis and Defense Priming. Curr. Issues Mol. Biol. 2026, 48, 299. [Google Scholar] [CrossRef] [Scilit] [PubMed]
  29. Sun, J.; Li, H.; Chen, H.; Wang, T.; Quan, J.; Bi, H. The Effect of Hormone Types, Concentrations, and Treatment Times on the Rooting Traits of Morus ‘Yueshenda 10’ Softwood Cuttings. Life 2023, 13, 1032. [Google Scholar] [CrossRef] [Scilit] [PubMed]
  30. Quan, J.; Ni, R.; Wang, Y.; Sun, J.; Ma, M.; Bi, H. Effects of Different Growth Regulators on the Rooting of Catalpa bignonioides Softwood Cuttings. Life 2022, 12, 1231. [Google Scholar] [CrossRef] [Scilit] [PubMed]
  31. Lei, C.; Fan, S.; Li, K.; Meng, Y.; Mao, J.; Han, M.; Zhao, C.; Bao, L.; Zhang, D. iTRAQ-Based Proteomic Analysis Reveals Potential Regulation Networks of IBA-Induced Adventitious Root Formation in Apple. Int. J. Mol. Sci. 2018, 19, 667. [Google Scholar] [CrossRef] [Scilit] [PubMed]
  32. Ghimire, B.K.; Kim, S.H.; Yu, C.Y.; Chung, I.M. Biochemical and Physiological Changes during Early Adventitious Root Formation in Chrysanthemum indicum Linné Cuttings. Plants 2022, 11, 1440. [Google Scholar] [CrossRef] [Scilit] [PubMed]
  33. Sun, C.; Liu, L.; Wang, L.; Li, B.; Jin, C.; Lin, X. Melatonin: A master regulator of plant development and stress responses. J. Integr. Plant Biol. 2021, 63, 126–145. [Google Scholar] [CrossRef] [Scilit] [PubMed]
  34. Corpas, F.J.; Taboada, J.; Rivero, R.M.; Reiter, R.J.; Palma, J.M. Functions of Endogenously Produced and Exogenously Applied Melatonin in Higher Plants. Antioxid. Redox Signal. 2025, 43, 151–188. [Google Scholar] [CrossRef] [Scilit] [PubMed]
  35. Liang, C.; Li, A.; Yu, H.; Li, W.; Liang, C.; Guo, S.; Zhang, R.; Chu, C. Melatonin Regulates Root Architecture by Modulating Auxin Response in Rice. Front. Plant Sci. 2017, 8, 134. [Google Scholar] [CrossRef] [Scilit] [PubMed]
  36. Xu, L.; Yang, W.; Guo, H.; Liu, C.; Chen, A.; Ahmad, S.A.; Wang, X. Transcriptome analysis of grape root to determine the regulatory network response to melatonin. Hortic. Plant J. 2025; in press. [CrossRef] [Scilit]
  37. Arnao, M.B.; Hernández-Ruiz, J. Melatonin and its relationship to plant hormones. Ann. Bot. 2018, 121, 195–207. [Google Scholar] [CrossRef] [Scilit] [PubMed]
  38. Khan, T.A.; Saleem, M.; Fariduddin, Q. Recent advances and mechanistic insights on Melatonin-mediated salt stress signaling in plants. Plant Physiol. Biochem. 2022, 188, 97–107. [Google Scholar] [CrossRef] [Scilit] [PubMed]
  39. Zhang, F.; Liu, L.; Xu, Y.; Li, D.; He, Y.; Wen, S. The effect of different concentrations of NAA on the propagation of stem plum cuttings. Mod. Hortic. 2025, 48, 13–16. [Google Scholar] [CrossRef]
  40. Druege, U.; Franken, P.; Hajirezaei, M.R. Plant Hormone Homeostasis, Signaling, and Function during Adventitious Root Formation in Cuttings. Front. Plant Sci. 2016, 7, 381. [Google Scholar] [CrossRef] [Scilit] [PubMed]
  41. Hao, H.; Xie, B.; Zhao, D.; Kang, J.; Jiang, X.; Gai, Y. Proteomic insights into adventitious root formation in Larix kaempferi. J. Proteom. 2024, 307, 105288. [Google Scholar] [CrossRef] [Scilit] [PubMed]
  42. Roussos, P.A. Adventitious Root Formation in Plants: The Implication of Hydrogen Peroxide and Nitric Oxide. Antioxidants 2023, 12, 862. [Google Scholar] [CrossRef] [Scilit] [PubMed]
  43. Miao, D.; Jia, R.; Li, S.; Xi, S.; Zhu, G.; Wen, S. Research progress on the mechanism of adventitious root formation in woody plants. J. Zhejiang Agric. For. Univ. 2022, 39, 902. [Google Scholar] [CrossRef]
  44. Duan, W.; Lu, B.; Liu, L.; Meng, Y.; Ma, X.; Li, J.; Zhang, K.; Sun, H.; Zhang, Y.; Dong, H.; et al. Effects of Exogenous Melatonin on Root Physiology, Transcriptome and Metabolome of Cotton Seedlings under Salt Stress. Int. J. Mol. Sci. 2022, 23, 9456. [Google Scholar] [CrossRef] [Scilit] [PubMed]
  45. Adem, M.; Sharma, L.; Shekhawat, G.S.; Afranek, M.; Jásik, J. Auxin signaling, transport, and regulation during adventitious root formation. Curr. Plant Biol. 2024, 40, 100385. [Google Scholar] [CrossRef] [Scilit]
  46. Bellini, C.; Pacurar, D.I.; Perrone, I. Adventitious roots and lateral roots: Similarities and differences. Annu. Rev. Plant Biol. 2014, 65, 639–666. [Google Scholar] [CrossRef] [Scilit] [PubMed]
  47. Emenecker, R.J.; Strader, L.C. Auxin-Abscisic Acid Interactions in Plant Growth and Development. Biomolecules 2020, 10, 281. [Google Scholar] [CrossRef] [Scilit] [PubMed]
  48. Jing, T.; Xing, Q.; Shi, Y.; Liu, X.; Müller-Xing, R. Depletion of Gibberellin Signaling Up-Regulates LBD16 Transcription and Promotes Adventitious Root Formation in Arabidopsis Leaf Explants. Int. J. Mol. Sci. 2024, 25, 13340. [Google Scholar] [CrossRef] [Scilit] [PubMed]
  49. Lischweski, S.; Muchow, A.; Guthörl, D.; Hause, B. Jasmonates act positively in adventitious root formation in petunia cuttings. BMC Plant Biol. 2015, 15, 229. [Google Scholar] [CrossRef] [Scilit] [PubMed]
  50. Liu, Y.; Wang, X.; Jing, S.; Jia, C.; Li, H.; Li, C.; He, Q.; Zhang, N.; Guo, Y.D. Integration of Phytomelatonin Signaling with Jasmonic Acid in Wound-induced Adventitious Root Regeneration. Adv. Sci. 2025, 12, e2413485. [Google Scholar] [CrossRef] [Scilit] [PubMed]
  51. Gökbayrak, Z.; Engin, H.; Kiraz, H. Effects of Melatonin and IAA on Adventitious Root Formation in Rootstock 5BB and cv. Cabernet Sauvignon (Vitis vinifera L.). Kahramanmaraş Sütçü İmam Üniv. Tarım Doğa Derg. 2020, 23, 835–841. [Google Scholar] [CrossRef] [Scilit]
  52. Wang, Y.; Pang, D.; Ruan, L.; Liang, J.; Zhang, Q.; Qian, Y.; Zhang, Y.; Bai, P.; Wu, L.; Cheng, H.; et al. Integrated transcriptome and hormonal analysis of naphthalene acetic acid-induced adventitious root formation of tea cuttings (Camellia sinensis). BMC Plant Biol. 2022, 22, 319. [Google Scholar] [CrossRef] [Scilit] [PubMed]
  53. Weeda, S.; Zhang, N.; Zhao, X.; Ndip, G.; Guo, Y.; Buck, G.A.; Fu, C.; Ren, S. Arabidopsis transcriptome analysis reveals key roles of melatonin in plant defense systems. PLoS ONE 2014, 9, e93462. [Google Scholar] [CrossRef] [Scilit] [PubMed]
  54. Ahkami, A.H.; Melzer, M.; Ghaffari, M.R.; Pollmann, S.; Ghorbani Javid, M.; Shahinnia, F.; Hajirezaei, M.R.; Druege, U. Distribution of indole-3-acetic acid in Petunia hybrida shoot tip cuttings and relationship between auxin transport, carbohydrate metabolism and adventitious root formation. Planta 2013, 238, 499–517. [Google Scholar] [CrossRef] [Scilit] [PubMed]
  55. Tiwari, M.; Kumar, R.; Subramanian, S.; Doherty, C.J.; Jagadish, S.V.K. Auxin-cytokinin interplay shapes root functionality under low-temperature stress. Trends Plant Sci. 2023, 28, 447–459. [Google Scholar] [CrossRef] [Scilit] [PubMed]
  56. Arora, D.; Singh, N.; Bhatla, S.C. Calmodulin and calcium-mediated melatonin signaling mechanisms in plants. Theor. Exp. Plant Physiol. 2024, 36, 635–645. [Google Scholar] [CrossRef] [Scilit]
  57. Mansoor, S.; Farooq, I.; Wani, O.A.; Ahmad, P.; Reiter, R.J.; Boo, K.-H.; Chung, Y.S. Melatonin as a modulator of MAPK cascade and ROS-RNS feedforward loop during plant pathogen interaction. Physiol. Mol. Plant Pathol. 2024, 133, 102367. [Google Scholar] [CrossRef] [Scilit]
Figure 1. Rooting status of ‘101-14’ rootstock at 28 days under different rooting agent formulation treatments (air layering). Note: (A): 400 mg·L−1 NAA + 400 mg·L−1 IBA; (B): 400 mg·L−1 NAA + 200 mg·L−1 IBA; (C): 200 mg·L−1 NAA + 400 mg·L−1 IBA; (D): 200 mg·L−1 NAA + 200 mg·L−1 IBA; (E): 400 mg·L−1 NAA; (F): 400 mg·L−1 IBA; (G): 200 mg·L−1 NAA; (H): 200 mg·L−1 IBA; (I): 400 mg·L−1 ABT; (J): CK (ddH2O).
Horticulturae 12 00858 g001
Figure 2. Rooting Performance of ‘5BB’ Rootstock after 28 Days under Different Rooting Agent Treatments. Note: (A): 400 mg·L−1 IBA + 1.2 mM melatonin (MLT); (B): 400 mg·L−1 IBA + 1.0 mM melatonin (MLT); (C): 400 mg·L−1 IBA + 0.8 mM melatonin (MLT); (D): 400 mg·L−1 IBA + 0.5% citric acid (CA); (E): 400 mg·L−1 IBA + 0.3% citric acid (CA); (F): 400 mg·L−1 IBA + 0.1% citric acid (CA); (G): 400 mg·L−1 IBA + 200 mg/L NAA; (H): CK (ddH2O).
Horticulturae 12 00858 g002
Figure 3. Soluble Sugar, Soluble Protein and Root Activity of Roots in Seven Grape Rootstocks after 28 Days of Hardwood Cutting with Different Rooting Treatments. Note: (A): Soluble Sugar Content in Seven Grape Rootstocks after 28 Days of Hardwood Cutting under Different Rooting Treatments. (B): Soluble Protein Content in Seven Grape Rootstocks after 28 Days of Hardwood Cutting under Different Rooting Treatments. (C): Root Activity of Seven Grape Rootstocks after 28 Days of Hardwood Cutting under Different Rooting Treatments. * p < 0.05, ** p < 0.01, *** p < 0.001, and **** p < 0.0001.
Horticulturae 12 00858 g003
Figure 4. Root Hormone Contents in Seven Grape Rootstocks after 28 Days of Hardwood Cutting under Different Rooting Treatments. (A): Root IAA content in seven grape rootstocks after 28 days of hardwood cutting under different rooting treatments. (B): Root GA3 content in seven grape rootstocks after 28 days of hardwood cutting under different rooting treatments. (C): Root ABA content in seven grape rootstocks after 28 days of hardwood cutting under different rooting treatments. (D): Root JA content in seven grape rootstocks after 28 days of hardwood cutting under different rooting treatments. (E): Root SA content in seven grape rootstocks after 28 days of hardwood cutting under different rooting treatments. * p < 0.05, ** p < 0.01, and *** p < 0.001.
Horticulturae 12 00858 g004
Figure 5. Volcano Plot of Differentially Expressed Genes under MLT Treatment.
Horticulturae 12 00858 g005
Figure 6. Correlation heatmap of CK and MLT treatment groups.
Horticulturae 12 00858 g006
Figure 7. GO enrichment bar plot of differentially expressed genes of ‘110R’ grape rootstock under different rooting agent treatments.
Horticulturae 12 00858 g007
Figure 8. KEGG Enrichment Bubble Plot of Differentially Expressed Genes under Different Rooting Treatments in ‘110R’ Grape Rootstock.
Horticulturae 12 00858 g008
Figure 9. Expression trends of ERF, MYB, bHLH, NAC, AUX/IAA, and ARF family genes under MLT, CA, and IBA treatments. Note: The color gradient represents gene expression levels, with red indicating upregulation and green indicating downregulation; CK is the blank control group, MLT is the melatonin treatment group, CA is the citric acid treatment group, and IBA is the indole-3-butyric acid treatment group.
Horticulturae 12 00858 g009
Figure 10. Expression trends of genes in specific pathways under MLT and IBA treatments. (A): Plant–pathogen interaction pathway. (B): Plant hormone signal transduction pathway. (C): MAPK signaling pathway. Note: The color gradient represents gene expression levels, with red indicating upregulation and green indicating downregulation; MLT is the melatonin treatment group, and IBA is the indole-3-butyric acid positive control group.
Horticulturae 12 00858 g010
Table 1. Orthogonal experimental design for air layering.
Treatment No./Hormone CompositionIBA (mg/L)NAA (mg/L)
CK00
I12000
N10200
I24000
N20400
I1N1200200
I2N1400200
I1N2200400
I2N2400400
CK, control (distilled water); IBA, indole-3-butyric acid; MLT, melatonin; CA, citric acid; NAA, naphthaleneacetic acid; ABT, a commercial rooting powder (active auxin components); IAA, indole-3-acetic acid; GA3, gibberellic acid; ABA, abscisic acid; JA, jasmonic acid; SA, salicylic acid; DEGs, differentially expressed genes; GO, Gene Ontology; KEGG, Kyoto Encyclopedia of Genes and Genomes; qRT-PCR, quantitative real-time polymerase chain reaction.
Table 2. Compositions and Concentrations of Plant Growth Regulators under Different Treatments.
TreatmentConcentrations of Rooting Agent Components
IM1400 mg/L IBA + 1.2 mM MLT
IM2400 mg/L IBA + 1.0 mM MLT
IM3400 mg/L IBA + 0.8 mM MLT
IC1400 mg/L IBA + 0.5% CA
IC2400 mg/L IBA + 0.3% CA
IC3400 mg/L IBA + 0.1% CA
IN400 mg/L IBA + 200 mg/L NAA
CKddH2O
Note: IM1, IM2, and IM3 represent IBA combined with 1.2, 1.0, and 0.8 mM MLT, respectively. IC1, IC2, and IC3 represent IBA combined with 0.5%, 0.3%, and 0.1% CA, respectively. IN represents the conventional auxin formulation of 400 mg/L IBA + 200 mg/L NAA.
Table 3. Air layering rooting rate.
Treatment/Cultivar101-14 (%)SO4 (%)BETA (%)3309 (%)1103P (%)110R (%)5BB (%)
CK27.78 ± 5.56 g29.17 ± 4.17 f16.67 ± 5.56 g25.00 ± 8.33 f22.22 ± 11.11 g12.96 ± 3.21 g18.52 ± 12.83 f
I145.83 ± 12.50 f37.50 ± 4.17 e33.75 ± 3.75 e50.00 ± 16.67 cd29.29 ± 0.71 f16.67 ± 0.00 f24.81 ± 4.49 e
N150.00 ± 16.67 ef25.00 ± 8.33 g19.44 ± 2.78 f25.00 ± 8.33 f27.78 ± 16.67 fg27.78 ± 9.62 e18.52 ± 6.42 f
I262.50 ± 4.17 d33.33 ± 0.00 ef45.24 ± 11.90 d33.33 ± 0.00 e42.78 ± 12.78 e33.33 ± 16.67 de37.04 ± 6.42 d
N250.00 ± 16.67 ef62.50 ± 20.83 d27.78 ± 5.56 ef25.00 ± 8.33 f33.33 ± 0.00 ef44.44 ± 9.62 d37.04 ± 6.42 d
I1N175.00 ± 8.33 c83.33 ± 16.67 a50.00 ± 5.56 c41.67 ± 8.33 de55.05 ± 0.51 d88.89 ± 19.25 a70.37 ± 6.42 ab
I2N191.67 ± 8.33 a66.67 ± 33.33 cd68.33 ± 1.67 a83.33 ± 16.67 a82.83 ± 5.62 a81.48 ± 16.97 ab66.67 ± 33.33 abc
I1N287.50 ± 4.17 b83.33 ± 16.67 a56.06 ± 10.61 b66.67 ± 0.00 b72.22 ± 5.56 b73.74 ± 23.54 bc62.96 ± 6.42 bc
I2N266.67 ± 33.33 cd83.33 ± 16.67 a49.49 ± 5.05 c66.67 ± 33.33 bc68.33 ± 1.67 c70.96 ± 25.22 bc70.37 ± 6.42 ab
ABT58.33 ± 25.00 de66.67 ± 0.00 bc63.33 ± 3.33 ab50.00 ± 0.00 cd65.15 ± 1.52 c70.37 ± 6.42 c74.07 ± 12.83 a
Note: Data in the table are presented as mean ± standard deviation. Different lowercase letters after different treatments in the same column indicate significant differences between the two groups (p < 0.05). I2N2: 400 mg·L−1 NAA + 400 mg·L−1 IBA; I1N2: 400 mg·L−1 NAA + 200 mg·L−1 IBA; I2N1: 200 mg·L−1 NAA + 400 mg·L−1 IBA; I1N1: 200 mg·L−1 NAA + 200 mg·L−1 IBA; N2: 400 mg·L−1 NAA; I2: 400 mg·L−1 IBA; N1: 200 mg·L−1 NAA; I1: 200 mg·L−1 IBA; ABT: 400 mg·L−1 ABT; CK: ddH2O.
Table 4. Air layering rooting effect index.
Treatment/Cultivar101-14SO4BETA33091103P110R5BB
CK3.80 ± 1.50 g0.19 ± 0.07 g0.27 ± 0.12 g1.23 ± 0.11 de2.21 ± 0.29 g0.50 ± 0.06 g0.91 ± 0.29 g
I15.54 ± 0.32 e0.26 ± 0.07 f0.61 ± 0.23 f0.96 ± 0.09 f4.35 ± 1.13 cd1.11 ± 0.62 f1.43 ± 0.18 f
N15.25 ± 2.27 f0.31 ± 0.17 e0.47 ± 0.14 f1.26 ± 0.53 d4.50 ± 1.21 c1.04 ± 0.25 f1.09 ± 0.17 fg
I26.70 ± 2.20 d0.97 ± 0.14 c0.94 ± 0.18 e1.31 ± 0.08 cd5.11 ± 3.75 b0.75 ± 0.19 fg2.99 ± 0.28 d
N22.53 ± 1.20 h0.41 ± 0.14 d0.74 ± 0.06 ef0.77 ± 0.20 g3.38 ± 1.10 ef2.32 ± 1.27 e1.32 ± 0.22 f
I1N15.61 ± 2.76 e0.62 ± 0.15 d1.94 ± 0.72 c1.34 ± 0.06 c4.32 ± 1.07 cd2.80 ± 0.88 d2.32 ± 0.56 e
I2N114.67 ± 1.76 a3.28 ± 0.42 a2.49 ± 0.37 a1.39 ± 0.46 bc6.56 ± 2.77 a8.95 ± 3.18 a6.92 ± 4.42 a
I1N25.41 ± 2.40 e0.69 ± 0.06 c1.81 ± 0.36 cd0.94 ± 0.23 f3.98 ± 1.54 de1.72 ± 0.70 ef5.36 ± 1.47 b
I2N212.58 ± 1.83 b1.07 ± 0.10 b2.31 ± 0.28 b2.89 ± 0.24 a2.23 ± 1.11 g3.96 ± 0.88 c4.27 ± 1.14 c
ABT11.61 ± 1.23 c1.02 ± 0.26 bc2.49 ± 0.40 a1.57 ± 0.33 b3.14 ± 0.05 f4.54 ± 1.59 b3.27 ± 0.21 cd
Note: Rooting effect index = rooting rate × average root number × average root length; data in the table are presented as mean ± standard deviation. Different lowercase letters after different treatments in the same column indicate significant differences between the two groups (p < 0.05). I2N2: 400 mg·L−1 NAA + 400 mg·L−1 IBA; I1N2: 400 mg·L−1 NAA + 200 mg·L−1 IBA; I2N1: 200 mg·L−1 NAA + 400 mg·L−1 IBA; I1N1: 200 mg·L−1 NAA + 200 mg·L−1 IBA; N2: 400 mg·L−1 NAA; I2: 400 mg·L−1 IBA; N1: 200 mg·L−1 NAA; I1: 200 mg·L−1 IBA; ABT: 400 mg·L−1 ABT; CK: ddH2O.
Table 5. Rooting Rates of Seven Grape Rootstocks after 28 Days of Hardwood Cutting under Different Rooting Agent Treatments.
Treatment/Cultivar101-14 (%)SO4 (%)BETA (%)3309 (%)1103P (%)110R (%)5BB (%)
IM186.67 ± 11.55 b26.67 ± 20.82 d46.67 ± 11.55 c23.33 ± 5.77 e14.44 ± 3.85 g90.00 ± 10.00 a68.97 ± 7.25 b
IM240.00 ± 17.32 e44.31 ± 8.30 a40.00 ± 26.46 c30.00 ± 18.68 d73.65 ± 11.83 a84.85 ± 26.24 a57.10 ± 4.00 d
IM396.67 ± 5.77 a16.16 ± 3.74 e50.00 ± 17.32 b14.13 ± 3.77 g70.00 ± 20.00 a75.93 ± 5.25 c77.97 ± 6.61 a
IC140.00 ± 0.00 e38.75 ± 12.67 b43.33 ± 11.55 c20.00 ± 10.00 f40.00 ± 0.00 d80.00 ± 0.00 b60.54 ± 11.37 c
IC280.00 ± 34.64 b13.39 ± 5.85 f46.67 ± 15.28 c40.00 ± 10.00 b22.32 ± 12.86 f72.22 ± 6.94 d61.62 ± 9.36 c
IC343.33 ± 5.77 de4.75 ± 0.95 g26.58 ± 7.25 e23.33 ± 11.55 e40.00 ± 17.32 d70.00 ± 10.00 d54.05 ± 4.46 d
IN53.28 ± 5.99 d15.80 ± 7.27 e73.33 ± 5.77 a41.48 ± 17.72 a64.27 ± 14.46 b85.00 ± 13.23 a47.37 ± 2.35 e
CK20.00 ± 0.00 f12.40 ± 1.38 f28.20 ± 7.66 de27.01 ± 15.64 de16.67 ± 6.67 e26.67 ± 5.77 e36.46 ± 7.71 f
Note: Data are presented as mean ± standard deviation (SD). Different lowercase letters within the same column indicate significant differences among treatments at (p < 0.05).
Table 6. Sprouting Rates of Seven Grape Rootstocks under Different Rooting Treatments.
Treatment/Cultivar101-14 (%)SO4 (%)BETA (%)3309 (%)1103P (%)110R (%)5BB (%)
IM136.67 ± 25.17 c16.67 ± 11.55 f0.00 ± 0.00 g23.33 ± 5.77 c16.67 ± 6.67 g40.00 ± 20.00 e57.10 ± 4.00 c
IM213.33 ± 11.55 f38.97 ± 5.56 a36.67 ± 20.82 a19.00 ± 8.54 d72.06 ± 20.32 a61.82 ± 33.18 b56.09 ± 9.19 c
IM330.00 ± 20.00 c23.17 ± 4.18 e6.67 ± 11.55 e17.03 ± 8.23 e40.00 ± 20.00 c48.15 ± 10.50 d57.37 ± 10.32 c
IC126.67 ± 5.77 d36.15 ± 7.66 a3.33 ± 5.77 f10.00 ± 10.00 f26.67 ± 5.77 e53.33 ± 20.82 c69.35 ± 4.35 a
IC233.33 ± 15.28 c35.49 ± 17.07 b6.67 ± 5.77 e23.33 ± 11.55 c19.68 ± 10.02 f57.78 ± 27.04 c54.05 ± 4.46 c
IC316.67 ± 15.28 e28.33 ± 15.04 d13.33 ± 5.77 d10.00 ± 0.00 f26.67 ± 5.77 e46.67 ± 25.17 d59.89 ± 10.87 b
IN49.67 ± 2.08 a15.84 ± 4.05 f13.33 ± 11.55 d28.89 ± 5.09 b47.85 ± 1.87 b85.00 ± 13.23 a34.20 ± 5.94 d
CK0.00 ± 0.00 g12.87 ± 10.63 g26.67 ± 15.28 b13.33 ± 5.77 e22.32 ± 12.86 e10.00 ± 0.00 f26.65 ± 5.91 e
Note: Data are presented as mean ± standard deviation (SD). Different lowercase letters within the same column indicate significant differences among treatments at (p < 0.05).
Table 7. Average Root Number, Root Length, and Root Diameter of Four Grape Rootstocks (101-14, SO4, Beta, and 1103P) after 28 Days of Hardwood Cutting under Different Rooting Agent Treatments.
Treatment/Cultivar101-14SO4BETA1103P
ANALADANALADANALADANALAD
IM13.80 ± 0.80 f6.62 ± 0.99 a0.30 ± 0.01 b4.30 ± 1.81 a2.96 ± 1.16 g0.37 ± 0.03 g5.16 ± 2.18 a3.61 ± 0.16 e0.31 ± 0.07 de8.13 ± 2.20 b4.57 ± 1.00 e1.03 ± 0.08 b
IM27.30 ± 6.06 d3.34 ± 0.24 d0.26 ± 0.01 e3.10 ± 0.68 b4.44 ± 1.25 e0.98 ± 0.12 c2.70 ± 1.13 c7.42 ± 0.91 ab0.34 ± 0.03 c4.93 ± 0.32 d4.49 ± 1.47 e0.32 ± 0.06 f
IM36.27 ± 0.86 e4.39 ± 0.71 b0.28 ± 0.02 cd3.07 ± 0.83 b5.93 ± 0.52 a0.73 ± 0.04 e1.80 ± 0.17 d5.63 ± 1.60 c0.32 ± 0.06 cd4.18 ± 0.95 d7.87 ± 2.00 b0.34 ± 0.03 e
IC16.27 ± 2.05 e3.34 ± 0.24 d0.28 ± 0.03 cd3.11 ± 0.80 b6.06 ± 1.39 a1.24 ± 0.20 a2.96 ± 0.56 b5.01 ± 1.09 d0.31 ± 0.07 de7.49 ± 4.54 b10.38 ± 2.38 a0.42 ± 0.02 d
IC26.13 ± 4.49 e3.86 ± 0.07 c0.25 ± 0.02 e3.51 ± 1.04 b5.17 ± 2.24 bc0.92 ± 0.09 d2.97 ± 1.31 b7.45 ± 2.92 ab0.41 ± 0.03 a10.90 ± 1.57 a7.43 ± 1.50 bc0.52 ± 0.01 c
IC39.97 ± 1.74 a3.60 ± 0.11 cd0.28 ± 0.02 cd1.33 ± 0.58 d5.31 ± 1.57 b0.52 ± 0.07 f1.98 ± 0.58 cd3.89 ± 0.23 de0.38 ± 0.06 b3.60 ± 0.69 e3.92 ± 1.77 f0.29 ± 0.06 g
IN6.23 ± 2.91 e3.41 ± 0.15 d0.31 ± 0.03 b3.61 ± 1.41 b4.84 ± 2.16 d1.13 ± 0.17 b2.55 ± 2.12 bc7.52 ± 4.43 a0.33 ± 0.06 cd2.53 ± 0.50 f6.31 ± 2.16 cd0.43 ± 0.03 d
CK2.87 ± 0.57 g2.35 ± 0.78 e0.36 ± 0.10 a2.29 ± 0.92 c2.20 ± 0.89 h0.77 ± 0.21 e1.70 ± 0.60 d2.97 ± 1.11 f0.24 ± 0.06 f1.73 ± 0.16 g3.26 ± 0.66 g1.22 ± 0.12 a
Different lowercase letters after different treatments in the same column indicate significant differences between the two groups (p < 0.05).
Table 8. Average Root Number, Root Length, and Root Diameter of Three Grape Rootstocks (110R, 5BB, and 3309) after 28 Days of Hardwood Cutting under Different Rooting Agent Treatments.
Treatment/Cultivar110R5BB3309
ANALADANALADANALAD
IM16.27 ± 1.18 bc7.96 ± 2.24 bc0.35 ± 0.05 cd3.20 ± 0.99 de8.11 ± 2.79 d0.82 ± 0.06 a2.17 ± 1.26 d2.42 ± 0.31 d1.18 ± 0.17 a
IM26.67 ± 0.35 ab7.47 ± 0.83 cd0.34 ± 0.03 cd3.93 ± 0.78 c8.81 ± 3.53 cd0.72 ± 0.03 b2.22 ± 1.22 d2.68 ± 0.99 c0.41 ± 0.12 b
IM36.80 ± 1.06 ab6.95 ± 2.23 d0.33 ± 0.04 d3.20 ± 1.08 de19.09 ± 10.05 b0.51 ± 0.03 c3.15 ± 0.59 a3.06 ± 0.95 b0.71 ± 0.18 b
IC18.65 ± 3.77 b0.41 ± 0.06 a3.34 ± 0.82 de8.36 ± 1.79 d0.43 ± 0.15 e2.57 ± 0.40 c3.55 ± 0.19 a5.33 ± 2.47 cd0.33 ± 0.11 c
IC25.33 ± 1.90 cd9.74 ± 2.80 a0.40 ± 0.07 ab3.57 ± 1.10 cd20.70 ± 12.54 a0.53 ± 0.04 c2.70 ± 0.66 bc2.12 ± 0.88 e0.31 ± 0.09 cd
IC36.90 ± 5.55 a7.54 ± 0.75 cd0.34 ± 0.06 cd3.90 ± 1.56 c10.21 ± 5.56 c0.45 ± 0.08 de1.93 ± 0.47 e1.65 ± 0.38 f0.28 ± 0.08 de
IN3.03 ± 1.21 e6.27 ± 0.82 e0.30 ± 0.01 e9.73 ± 4.74 a12.08 ± 7.66 c0.48 ± 0.08 cd0.94 ± 0.34 f1.41 ± 0.31 g0.29 ± 0.03 de
CK3.17 ± 1.26 e2.18 ± 1.04 f0.22 ± 0.04 f2.22 ± 0.48 f3.73 ± 1.79 e0.44 ± 0.10 de0.33 ± 0.15 g1.86 ± 1.19 ef0.27 ± 0.12 e
Note: AN, average root number; AL, average root length; AD, average root diameter. Data are presented as mean ± standard deviation (SD). Different lowercase letters within the same column indicate significant differences among treatments at p < 0.05.
Table 9. Rooting Performance Index of Seven Grape Rootstocks under Different Rooting Treatments.
Treatment/Cultivar101-14SO4BETA33091103P110R5BB
IM12.48 ± 0.44 c0.38 ± 0.06 e1.84 ± 0.71 c0.55 ± 0.37 d1.22 ± 0.31 c5.70 ± 1.49 b0.80 ± 0.01 e
IM23.31 ± 3.61 b0.45 ± 0.12 d2.03 ± 0.99 b0.57 ± 0.26 cd0.73 ± 0.21 d5.08 ± 0.33 cd1.16 ± 0.49 d
IM32.77 ± 0.70 c0.60 ± 0.12 b1.03 ± 0.38 e0.96 ± 0.35 a1.07 ± 0.23 c5.73 ± 0.86 b1.80 ± 0.21 c
IC12.10 ± 0.75 d0.62 ± 0.18 b1.44 ± 0.14 d0.91 ± 0.18 b2.62 ± 1.78 a5.96 ± 2.97 a0.95 ± 0.38 d
IC22.35 ± 1.68 c0.65 ± 0.48 a2.37 ± 1.76 a0.59 ± 0.36 c2.65 ± 0.23 a4.18 ± 1.12 d2.18 ± 0.81 b
IC33.60 ± 0.71 b0.25 ± 0.17 f0.76 ± 0.19 f0.33 ± 0.14 e0.46 ± 0.21 e5.58 ± 4.79 b1.14 ± 0.17 d
IN4.05 ± 4.27 a0.63 ± 0.50 a1.63 ± 1.00 c0.13 ± 0.04 f0.52 ± 0.17 de2.19 ± 1.10 e3.13 ± 1.19 a
CK0.57 ± 0.33 e0.17 ± 0.09 g0.53 ± 0.36 g0.06 ± 0.03 g0.19 ± 0.05 f0.54 ± 0.37 f0.29 ± 0.17 f
Note: Rooting performance index = rooting rate × average root number × average root length. Data are presented as mean ± standard deviation (SD). Different lowercase letters within the same column indicate significant differences among treatments at (p < 0.05).
Table 10. Membership Function Values of Seven Grape Rootstocks after 28 Days of Hardwood Cutting under Different Rooting Treatments.
Treatment/Cultivar101-14SO4BETA33091103P110R5BBAv(R)Ranking
400 mg/L IBA + 1.2 mM MLT0.380.540.510.510.420.580.520.491
400 mg/L IBA + 0.3% CA0.490.360.390.570.330.570.480.462
400 mg/L IBA + 1.0 mM MLT0.270.60.50.480.390.580.450.473
400 mg/L IBA + 0.5% CA0.460.460.310.580.370.540.540.474
400 mg/L IBA + 0.8 mM MLT0.280.680.310.50.450.610.410.465
400 mg/L IBA + 200 mg/L NAA0.440.490.490.350.320.480.480.446
400 mg/L IBA + 0.1% CA0.350.270.220.290.180.530.390.327
CK0.120.220.10.210.210.080.110.158
Note: For each cultivar and treatment, the membership function value represents the mean of the membership function values of X1 (rooting rate), X2 (sprouting rate), X3 (average root number), X4 (average root length), X5 (average root diameter), and X6 (rooting performance index).
Disclaimer/Publisher’s Note: The statements, opinions and data contained in all publications are solely those of the individual author(s) and contributor(s) and not of MDPI and/or the editor(s). MDPI and/or the editor(s) disclaim responsibility for any injury to people or property resulting from any ideas, methods, instructions or products referred to in the content.