Article

Canopy Structure and Water Use Efficiency Variations Between Short- and Long-Day Strawberry Cultivars Revealed by Non-Destructive 3D Phenotyping


1
College of Bioresource Sciences, Nihon University, Fujisawa 2520880, Japan
2
KUBOTA Corporation, Osaka 5900908, Japan
3
Netherlands Plant Eco-Phenotyping Center, Wageningen University & Research, 6708 PE Wageningen, The Netherlands
4
Business Unit Greenhouse Horticulture, Wageningen University & Research, 6708 PB Wageningen, The Netherlands
*
Author to whom correspondence should be addressed.
Horticulturae 2026, 12(6), 752; https://doi.org/10.3390/horticulturae12060752
Submission received: 21 May 2026 / Revised: 15 June 2026 / Accepted: 18 June 2026 / Published: 20 June 2026

Abstract

Cultivars of strawberry (Fragaria × ananassa) differ in photoperiodic responses, which influence the balance between vegetative and reproductive growth, shaping canopy development, biomass production, and water use efficiency (WUE). Using 3D point-cloud phenotyping, this study compared the canopy structure and WUE of the short-day cultivar ‘Sonata’ and long-day cultivar ‘Favori’ grown under identical greenhouse conditions. Cultivar-specific growth and water use traits were quantified using daily non-destructive 3D point cloud phenotyping combined with continuous whole-plant gravimetry, supported by manual and destructive measurements. Non-destructive estimates of plant height and digital biomass corresponded moderately to measurements (height: R2 = 0.628; biomass: R2 = 0.579; mean absolute percentage error (MAPE) = 13.86%). Growth analysis indicated similar relative growth rates between the two cultivars, whereas the crop growth rate was higher in ‘Sonata’ than in ‘Favori’. Integration of growth estimates with gravimetric records revealed higher period average WUE in ‘Sonata’ (3.1 mg g−1) than in ‘Favori’ (2.5 mg g−1). These results highlight the distinctive growth strategies of a canopy-driven pattern in ‘Sonata’ and a reproduction-driven pattern in ‘Favori’. The combined 3D phenotyping–gravimetry framework provides a high-resolution, non-destructive approach to quantify cultivar-specific growth and water use traits.

1. Introduction

Strawberry (Fragaria × ananassa) is a globally important horticultural crop categorized into short- and long-day cultivars based on their photoperiodic responses. Photoperiod serves as a primary coordinator of the balance between vegetative growth and floral induction, thereby shaping canopy development, assimilate allocation, and yield. In strawberries, short days generally promote flower initiation, whereas long days favor vegetative growth and canopy expansion, underscoring photoperiod as a key regulator of growth habit and resource partitioning in this perennial crop [1]. Across various plants, day length governs not only flowering time but also multiple developmental trajectories, reinforcing its central role in coordinating the vegetative and reproductive phases [2,3].
Although flowering under contrasting day lengths has been extensively studied, the differences in canopy architecture and water use efficiency (WUE) between short- and long-day strawberry cultivars during the vegetative phase remain to be quantified. Manipulating photoperiod and light quality alters both floral induction and vegetative traits in strawberry transplants [4], indicating that photoperiodic control extends beyond flowering to morphological development. Previous studies have also reported that photoperiod influences runner formation, leaf development, and biomass allocation in strawberries [5,6]. Therefore, a high-resolution, non-destructive characterization of the association among photoperiod type, canopy structure, and water use during the vegetative stage is essential to enable direct, physiology-linked cultivar comparisons under identical environments.
Recent advances in non-destructive 3D phenotyping have provided the spatial fidelity required to quantify canopy architecture in situ. In strawberry canopies, mobile LiDAR can capture vegetative structures, with strong correlations observed between leaf area and LiDAR-derived metrics such as canopy volume and height [7]. More broadly, 3D reconstruction techniques such as LiDAR and multi-view stereo have been widely applied to estimate canopy structure, biomass, and growth dynamics across diverse crops [8,9]. At the organ level, multi-view stereo can be used to reconstruct dense 3D point clouds of strawberry fruits, enabling precise measurements of berry volume, calyx size, and achene number, thereby validating 3D imaging as a cost-effective phenotyping tool for breeding pipelines [10].
Complementing this tool, the LAST-Straw dataset, an annotated spatiotemporal 3D point cloud dataset of strawberry plants, provides spatiotemporal 3D point clouds across developmental stages and demonstrates automated pipelines for segmentation, skeletonization, and growth tracking in strawberry, providing community resources for method validation and benchmarking [11]. High-resolution laser scanning across more than 500 plant architectures has revealed universal network design principles in shoot systems (e.g., cost–performance trade-offs along a Pareto front), highlighting the broader relevance of 3D architectural analysis to plant function [12]. In parallel, the Plant 3D toolkit delivers practical operations, such as stem–lamina classification, graph skeletonization, and leaf segmentation/labeling, for extracting biologically meaningful traits, including biomass-relevant metrics, from high-resolution point clouds [13].
While 3D phenotyping resolves canopy structures (e.g., plant height and volumetric digital biomass) without disturbing plants, continuous gravimetry captures transpiration dynamics with high temporal fidelity, enabling aggregation into cumulative transpiration. Gravimetric approaches have been widely adopted to quantify whole-plant water use and evaluate water use efficiency (WUE) under controlled environments [14]. WUE is generally defined as biomass production per unit of water consumed, representing an integrative trait that reflects the balance between carbon gain and water loss across scales [15,16]. Integrating structural and physiological data streams enables evaluation of growth indices (relative growth rate; RGR, crop growth rate; CGR) and the relationship between cumulative biomass and transpiration, providing a mechanistic framework for canopy-scale WUE analysis [17]. This integrated approach provides an opportunity to track dynamic changes in resource allocation and water use strategies throughout the entire plant growth cycle. The synergy between high-resolution 3D phenotyping and continuous gravimetric monitoring is critically important, as it enables the capture of temporal variations in biomass conversion efficiency.
The objective of this study was to evaluate the efficacy of 3D point-cloud phenotyping as an alternative to manual measurements in quantifying growth and WUE differences between short- and long-day strawberry cultivars during the vegetative phase. The plant height and digital biomass were directly derived from point clouds, and then the dry matter weight was inferred from the digital biomass using a calibrated prediction model, positioning the analysis within established 3D strawberry pipelines [7,11,13]. In parallel, pot-level transpiration was continuously recorded and aggregated to determine cumulative transpiration. Under identical greenhouse conditions, (i) photoperiod-type differences in canopy formation and daily growth (RGR and CGR) were compared, and (ii) whether the cumulative dry matter–transpiration relationship provides a robust, non-destructive indicator of season-integrated WUE was evaluated.
Despite these advances, no study has quantitatively linked photoperiod-dependent canopy architecture with whole-plant water use dynamics using integrated non-destructive approaches. The main novelty of this study lies in integrating high-resolution 3D point-cloud phenotyping with continuous gravimetric measurements to simultaneously quantify canopy structure, growth dynamics, and season-integrated water use efficiency under controlled photoperiod conditions. This approach extends photoperiod research beyond flowering responses by explicitly linking canopy structure to water use strategies in strawberry.

2. Materials and Methods

2.1. Cultivar and Cultivation Overview

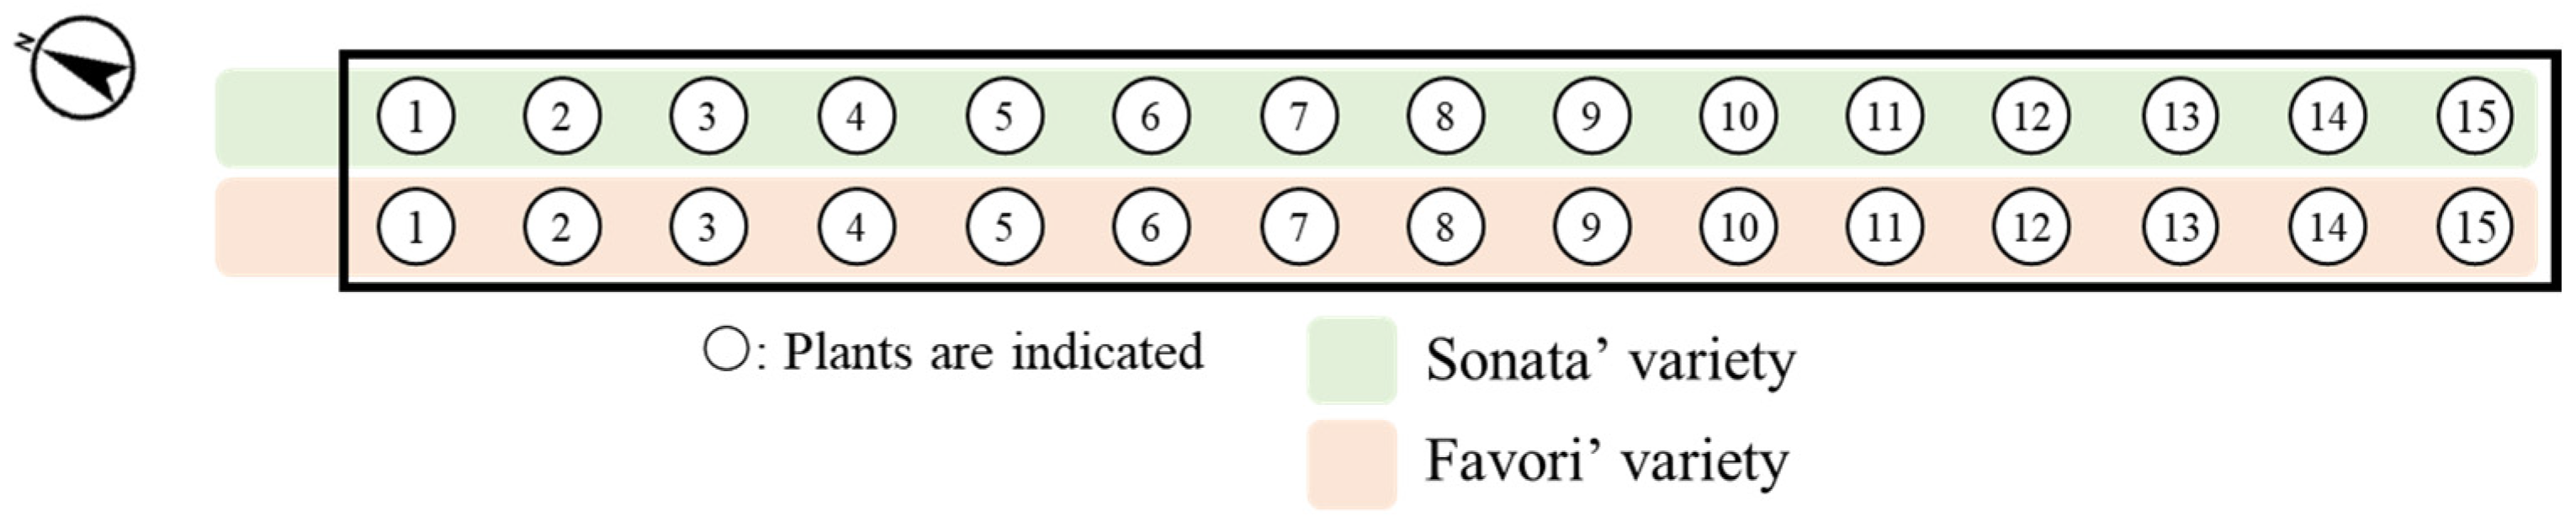
The short-day strawberry cultivar ‘Sonata’ and long-day strawberry cultivar ‘Favori’ were used. Both cultivars were obtained as frigo plants from Henselmans Strawberry Plants (Luttelgeest, The Netherlands). Plants were planted in polystyrene pots filled with cultivation substrate (Jongkind B.V., Aalsmeer, The Netherlands) in the greenhouse of the Netherlands Plant Eco-phenotyping Centre at Wageningen University and Research, Wageningen, The Netherlands, on 30 June 2023. Fifteen seedlings per cultivar were planted. The seedlings were irrigated with tap water for the first 10 days after planting. Thereafter, the plants were irrigated with full-strength Hoagland nutrient solution for 15 days (until 27 July) and then with half-strength Hoagland nutrient solution until the end of the experiment to avoid excessive nutrient accumulation and potential salt stress. The irrigation volume was set to 200 mL per plant per day and was kept constant throughout the experimental period without adjustment for plant growth. The total duration of the experiment was 32 days. The row planting diagram used in this experiment is shown in Figure 1.
Plants were arranged in two separate rows on a planting diagram, with each row corresponding to a single cultivar, as shown in Figure 1. Each plant was treated as an independent experimental unit. Environmental conditions within the greenhouse were maintained as uniformly as possible. For growth analysis, five plants per cultivar were predetermined at the beginning of the experiment and continuously monitored throughout the cultivation period. Measurements were collected repeatedly over time for each plant. One planting table was fitted with two rows of 15 precision scales, resulting in 30 independent weighing units for the pot-grown plants, using Plantarray (Plant-Ditech, Yavne, Israel). Each scale supported a load of up to 12 kg. Pots with a diameter of 23 cm (5 L) were used in the experiment. Each pot was individually watered using a dripper connected to a dedicated pump, which enabled precise control of the watering volume based on the real-time pot weight. Meteorological parameters, including air temperature, relative humidity, CO2 concentration, and photosynthetically active radiation (PAR), were measured every 3 min using an on-site environmental monitoring system.

2.2. Plant Sensing Using 3D Point Cloud Data

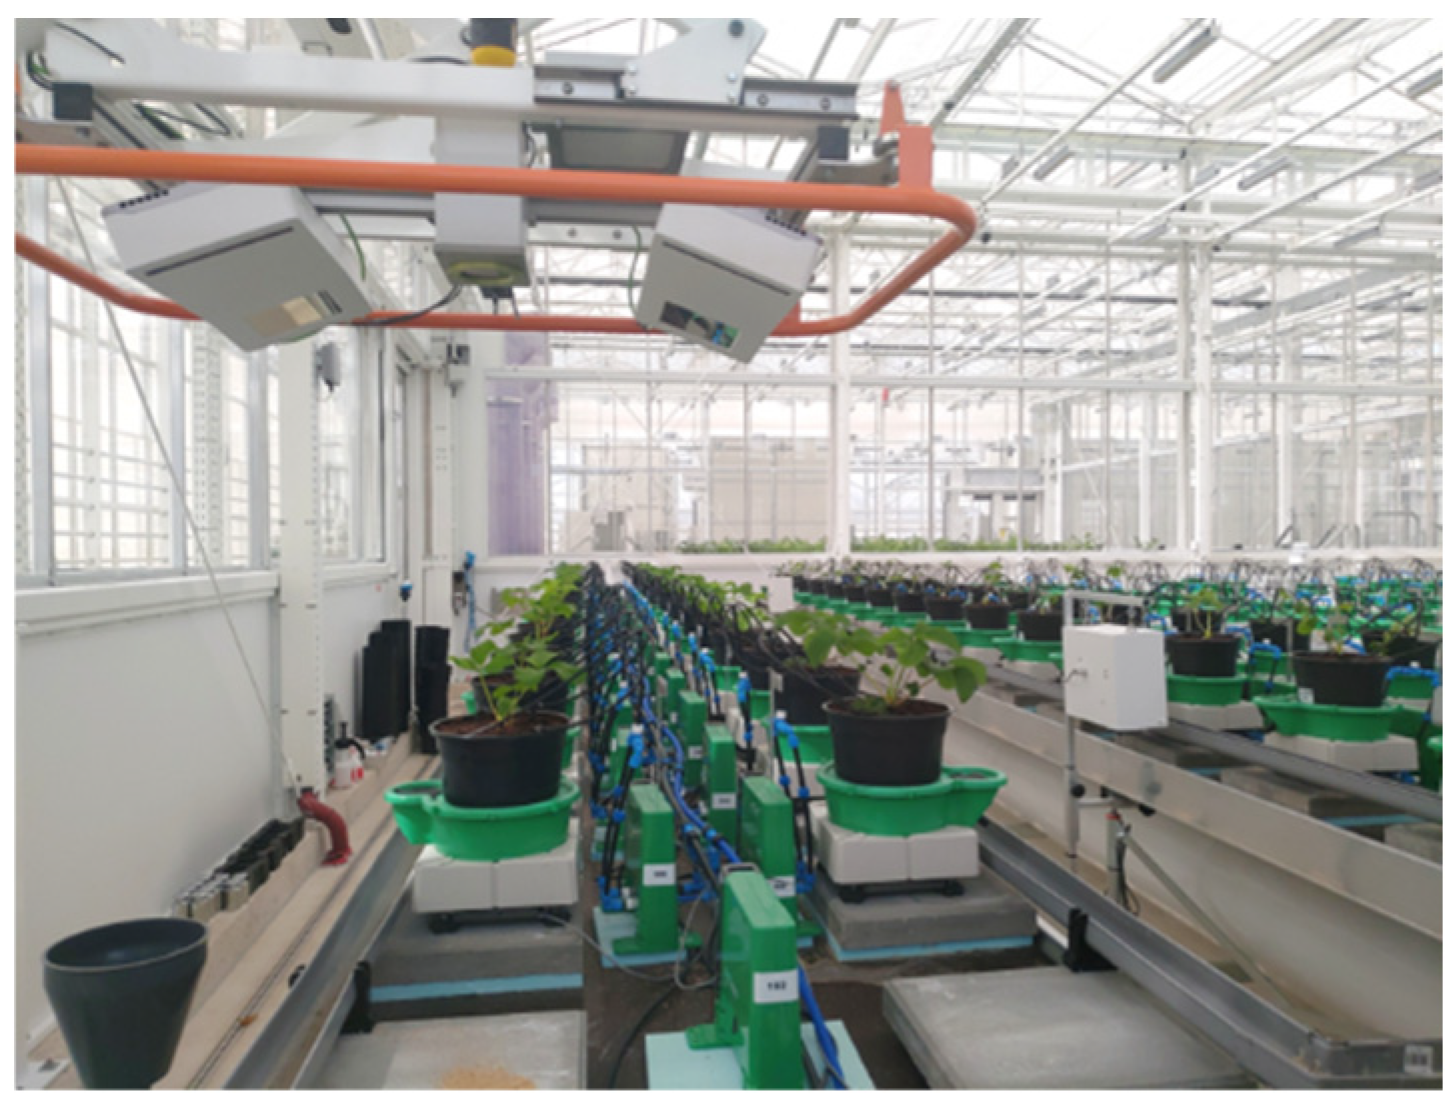
During the cultivation period, 3D point cloud data were acquired once daily for each plant using a DualScan PlantEye F500 multispectral 3D scanner (Phenospex B.V., Heerlen, The Netherlands) installed on an XYZ gantry mounted at the top of the NPEC greenhouse. Figure 2 presents an overview of the cultivation experiments.
PlantEye is equipped with a laser line, RGB LED lighting, and software (as implemented at the NPEC) that fuses 3D point cloud data with RGB data. The device acquires data by moving directly above the plants on the gantry installed in the greenhouse. To ensure repeatability, the operational parameters of the 3D scanner were configured with 3D laser wavelength of 940 nm. PlantEye operates based on a laser triangulation principle. A near-infrared laser line is projected onto the plant surface, and the reflected signal is captured by an offset camera. The displacement of the laser line in the camera image is used to reconstruct the three-dimensional structure of the plant. As the sensor moves along the gantry, successive scans are combined to generate a dense 3D point cloud of the plant canopy. This scanner features a Y-resolution of 1 mm at a constant scanning speed of 20 mm s−1. The distance between the sensor unit and plants during data acquisition was maintained at approximately 100 cm. In this study, plant height and digital biomass were calculated using the acquired 3D point cloud data. To calculate plant height, the distribution of triangular mesh counts generated by connecting adjacent points within the 3D point cloud data was first represented as a histogram along the z-axis. Thereafter, the largest area containing sufficient 3D point cloud data was identified. The highest point within this area was defined as the crop apex, and the plant height was calculated following the method described by Phenospex [18]. Digital biomass was defined and calculated as a non-destructive volumetric proxy for physical plant biomass, computed as the product of the extracted plant height and the 3D projected leaf area. Following the protocol by Phenospex, this calculation operates under the geometric assumption that the plant architecture can be approximated as a regular physical body whose volume is determined by its height and canopy dimensions. The theoretical rationale for linking this volumetric space to actual plant traits is supported by the established framework that such a canopy volume correlates strongly with physical fresh and dry biomass [19,20].

2.3. Plant Growth Analysis

During planting, the plant dry matter weight and leaf area were measured manually. At the end of the experiment on 14 August 2023, the pedicel number, flower number, leaf area, and dry matter weights of the leaves, crown, fruit, and pedicels were measured. The plant height and leaf number were measured manually once per week during the cultivation period. In this study, five plants from each variety were selected as experimental plants. Growth indices RGR and CGR during the cultivation period were calculated using the following equations based on the frameworks established by Radford [21] and Watson [22]:
R G R   g   g 1   d a y 1 = ln W 2 ln W 1 t 2 t 1 ,
C G R g   m 2   d a y 1 = W 2 W 1 t 2 t 1 × 1 G A ,
where RGR is the relative growth rate, CGR is the crop growth rate, W is the dry matter weight (g), t is time (days), and GA is the growing area per plant (m2). After calculating the growth indices for each variety, significance tests were performed for all parameters.

2.4. WUE Analysis

Daily transpiration (g) was measured for all plants during the cultivation period. In addition, the WUE (mg g−1 plant−1) was calculated from the dry matter weight of the plant at the end of cultivation and integrated transpiration. WUE was calculated as the ratio of dry matter accumulation to cumulative transpiration over the cultivation period. Dry matter accumulation (Δ dry matter weight) was estimated by digital biomass using a regression model developed from pooled data of the two cultivars used in this study. Furthermore, cultivar-specific cumulative regression models were fitted to Equation (3) to predict the dry matter weight as a linear function of cumulative transpiration:
D r y   m a t t e r   w e i g h t g = a × X c u m u l a t i v e   t r a n s p i r a t i o n + b
Cumulative transpiration (Σ transpiration) was obtained by integrating daily transpiration over the entire cultivation period, including both daytime and nighttime transpiration. Because dry matter weight was estimated from digital biomass, which mainly reflects aboveground traits, root biomass was not explicitly measured and may not be fully represented in the WUE calculation.

2.5. Statistical Analysis

For the evaluation of plant growth analysis, Student’s t-test was employed to determine differences. All statistical analyses were performed in Microsoft Excel (Microsoft Corporation, Redmond, WA, USA), with statistical significance determined at p < 0.05. Calculations were performed using built-in functions of the software. To evaluate the accuracy of non-destructive estimations, simple linear regression models were developed for plant height derived from 3D point cloud data and dry weight estimated from digital biomass. The reliability of these non-destructive approaches was inferred from the Pearson’s r, coefficient of determination (R2), root mean square error (RMSE), and mean absolute percentage error (MAPE).

3. Results

3.1. Meteorological Conditions in the Experimental Area

Table 1 shows the average values and standard deviations of the meteorological parameters measured during the experimental period.
As shown in Table 1, the meteorological conditions during the cultivation period were stably controlled. All the test plants were placed in the same compartment and thus were under identical meteorological environmental conditions. The average light period during cultivation was approximately 16 h.

3.2. Growth Evaluation of Strawberry Cultivars Through Destruction Analysis

Table 2 shows the actual plant data obtained through destructive analysis at the end of the cultivation experiment.
As shown in Table 2, ‘Sonata’ exhibited significantly greater leaf area and plant dry matter weight than ‘Favori’ (p < 0.05), indicating its stronger vegetative growth capacity. Meanwhile, ‘Favori’ produced more peduncles and flowers, suggesting its higher allocation to reproductive growth. ‘Sonata’ prioritized canopy expansion and biomass accumulation, whereas ‘Favori’ invested resources in flowering and fruit initiation. The higher leaf area in ‘Sonata’ possibly contributed to its superior crop growth rate, whereas the reproductive sink strength in ‘Favori’ may limit vegetative growth. Table 3 shows the growth analysis results for each strawberry cultivar during the cultivation period.
Clear physiological and morphological distinctions were found between ‘Favori’ and ‘Sonata’. As shown in Table 3, the RGR was higher in ‘Favori’ (0.070) than in ‘Sonata’ (0.068), but the difference was not significant. By contrast, the CGR was significantly higher in ‘Sonata’ (16.66) than in ‘Favori’ (12.12), implying greater stand-level biomass production in ‘Sonata’. This pattern supports the interpretation that ‘Sonata’ is a leaf area-driven cultivar, maximizing canopy light interception to elevate stand productivity, whereas ‘Favori’ is an efficiency-driven cultivar, achieving higher assimilation per unit leaf area but operating with a smaller canopy.

3.3. Comparison with Plant Sensing Data Using 3D Point Cloud Data

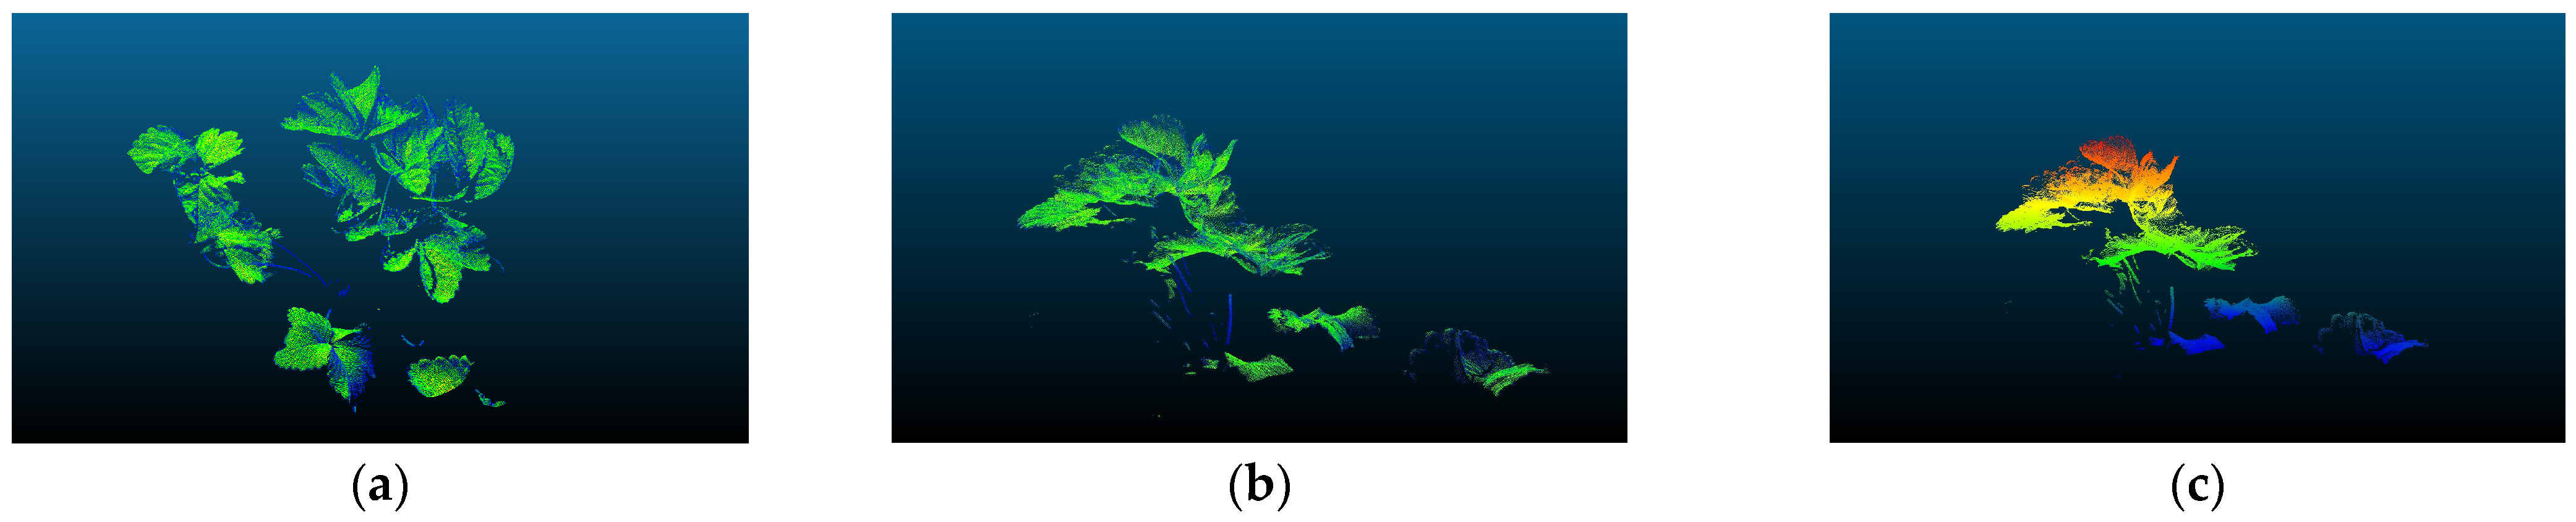
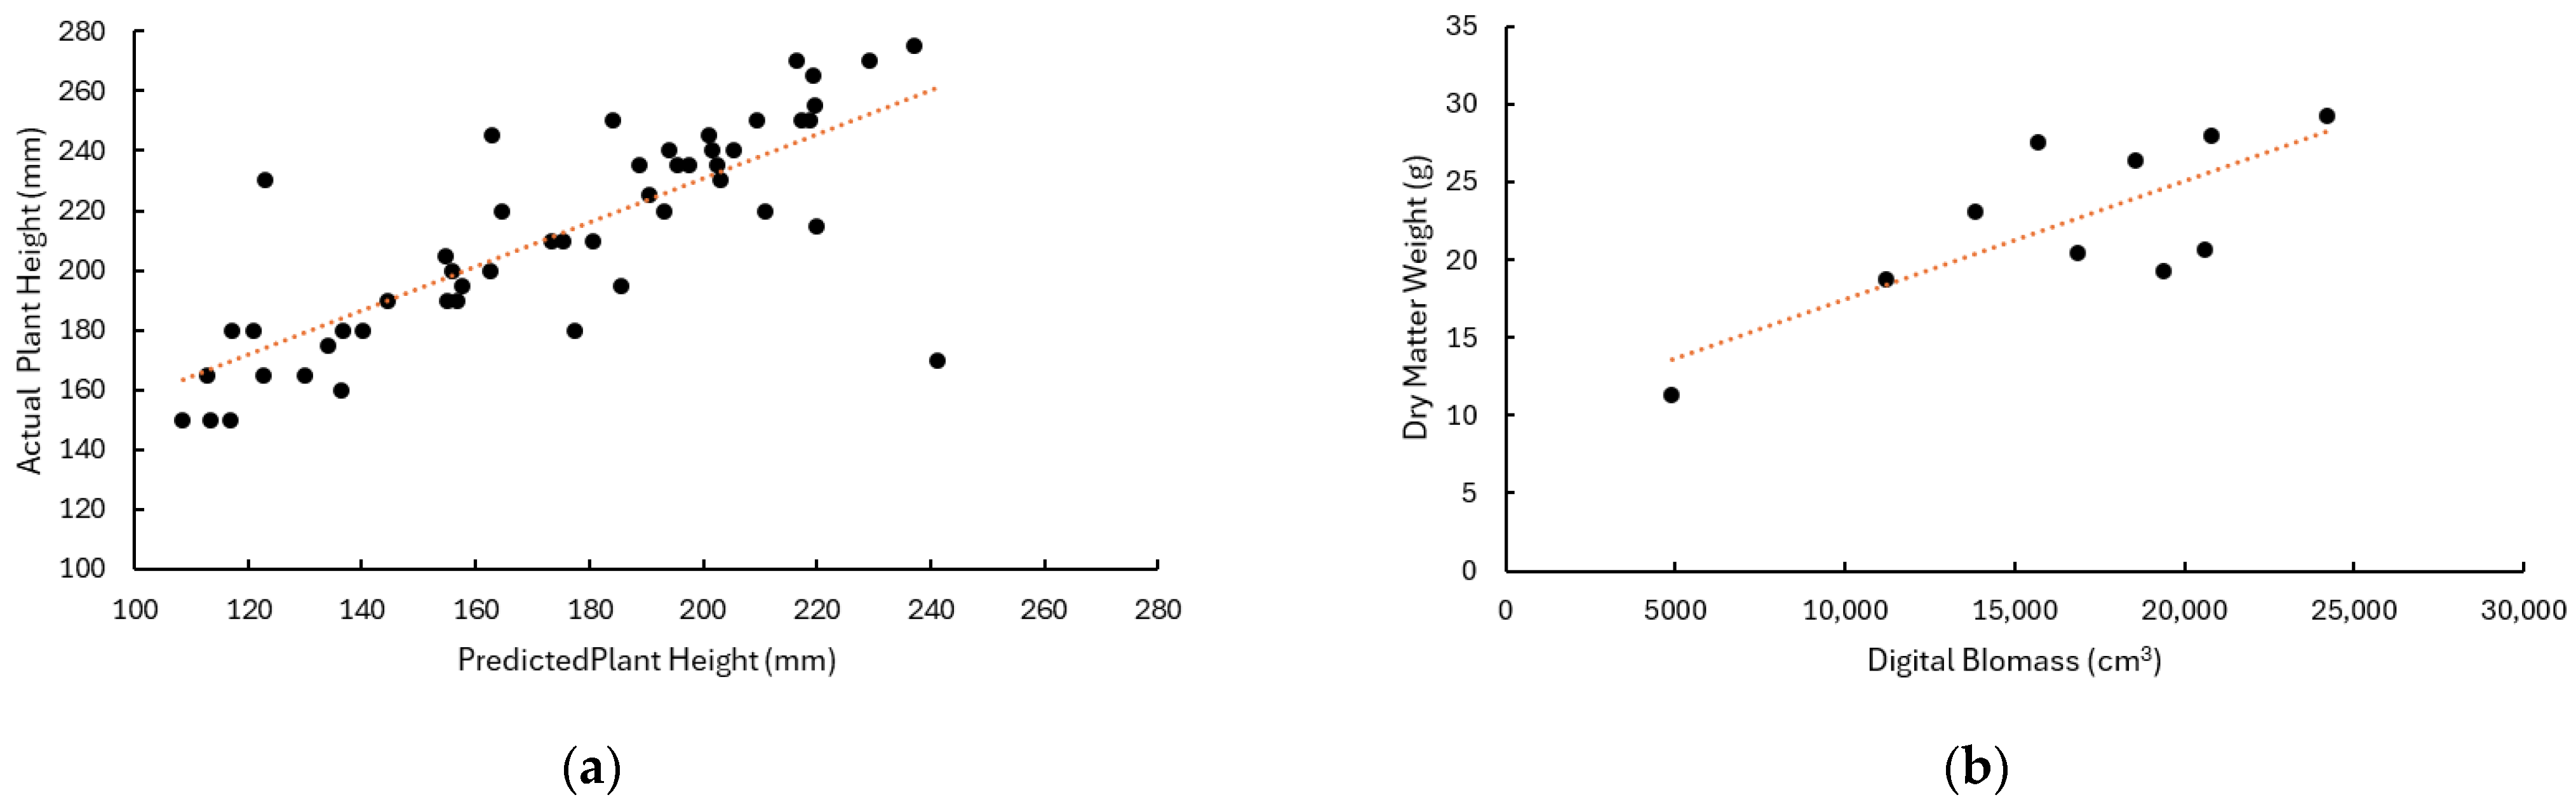
Figure 3 shows the 3D point cloud data of the strawberries acquired in this experiment, whereas Figure 4 shows the comparison results between the plant parameters obtained from actual measurements and those derived from the 3D point cloud data. Figure 3 shows the 3D point cloud data, captured on 14 August 2023, and generated using CloudCompare (v.2.13, [23]), of ‘Sonata’.
The plant height results represent the number of samples obtained on growth survey days during cultivation, whereas the leaf area results represent the number of samples obtained at the end of cultivation. A simple regression analysis was performed to evaluate the relationship between actual plant height measurements and estimated values using 3D point cloud data. The results showed a regression slope of 0.738, intercept of 83.08, coefficient of determination (R2) of 0.628, and RMSE of 21.63 (p < 0.001) The predicted values generally showed a linear relationship with the actual measurements. The 95% prediction interval was calculated to evaluate the prediction accuracy, and results showed that it encompassed 96% of the data points. The relationship between the measured dry weight and digital biomass was evaluated, yielding a regression line slope of 7.59 × 10⁻⁴, an intercept of 9.85, a coefficient of determination (R2) of 0.579, and an RMSE of 3.81 (p = 0.011). As the units of the two variables differed, the Mean Absolute Percentage Error (MAPE) was calculated, yielding an MAPE of 13.86%. As shown above, considering the outliers, plant height yielded high prediction accuracy. MAPE is commonly employed in agricultural modeling studies to assess prediction accuracy. For comparison, previous studies on crop yield and plant biomass prediction have reported prediction errors of a similar magnitude. High-performing models have achieved error levels of approximately 7–12% under controlled or well-managed conditions [24,25,26]. Furthermore, even higher error levels (e.g., around 15–20%) have been considered reasonable or have been associated with substantial improvements in field-level predictive performance when incorporating additional data sources [26]. Therefore, the MAPE obtained in this study falls within the range reported in previous studies and indicates that the predictive performance is acceptable. In contrast, dry matter weight showed moderate prediction accuracy in the linear regression; however, its predictive performance was within the range reported in previous studies and can therefore be considered acceptable. Overall, both variables were predictable.

3.4. Growth Analysis Using 3D Point Cloud Data

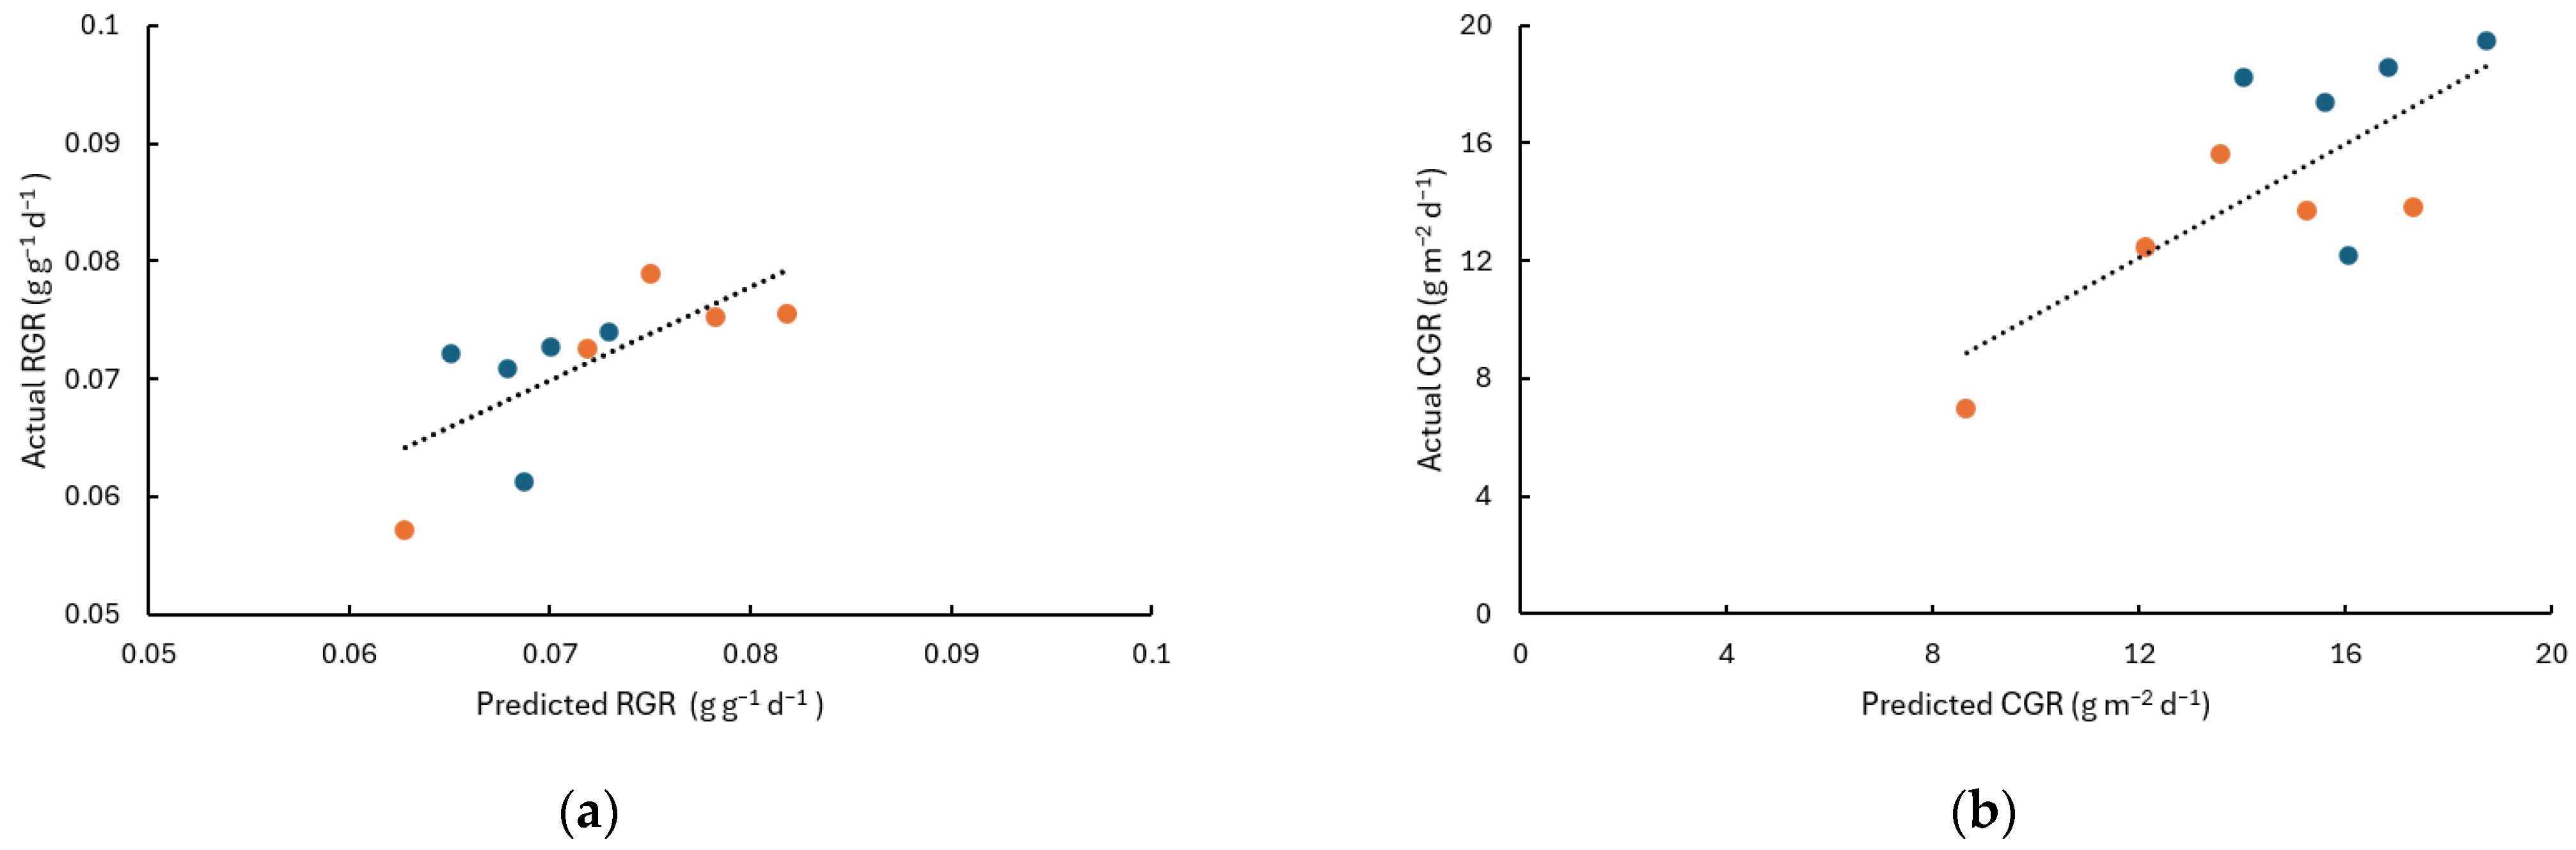
Figure 5 shows a comparison of the growth analysis results obtained from actual measurements and those derived from the 3D point cloud data.
The performance of RGR model was evaluated using linear regression against the observed values. The model showed a coefficient of determination (R2) of 0.486 (p = 0.025). The Pearson correlation coefficient between predicted and actual values was r = 0.697. An RMSE was 0.0047, corresponding to an MAPE of 5.95% relative to the mean actual value (0.071). Similarly, the CGR model showed an R2 of 0.531 (p = 0.017), with a Pearson correlation coefficient of r = 0.729. The RMSE was 2.486, corresponding to an MAPE of 15.5% relative to the mean observed value (14.825). A correlation matrix of actual and predicted values for RGR and CGR is shown in Table 4.
A correlation matrix of observed and predicted values for RGR and CGR is shown in Table 4. The predicted values showed moderate positive correlations with the corresponding observed values (r = 0.697 for RGR and r = 0.729 for CGR). In addition, a moderate correlation was observed between RGR and CGR (r = 0.661), indicating that these indices partly reflect similar growth dynamics despite their different formulations.
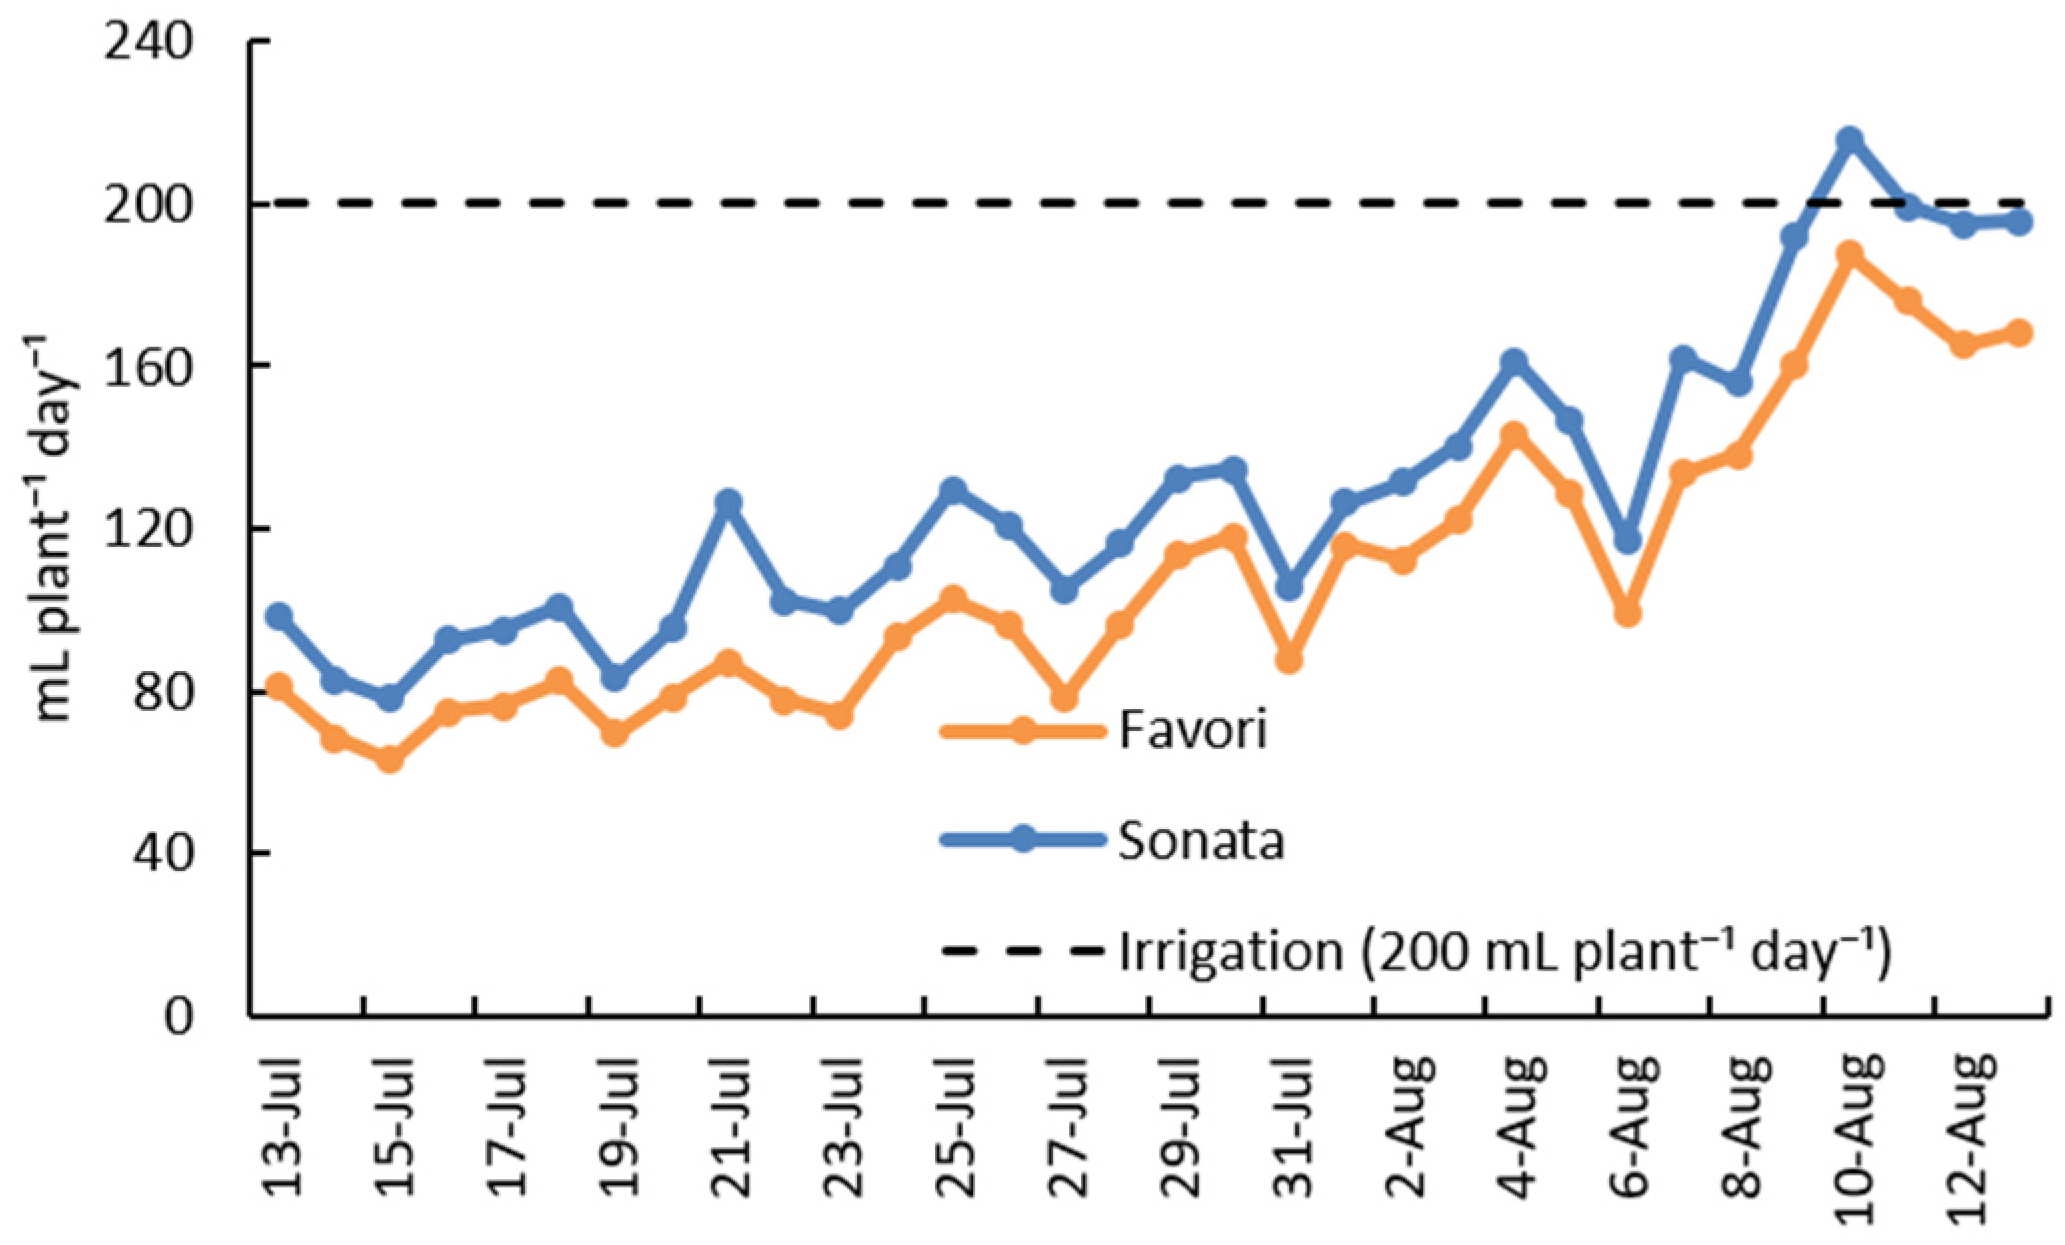
Figure 6 shows the daily transpiration of both cultivars in comparison with the fixed irrigation volume (200 mL plant−1 day−1). Daily transpiration increased over time in both cultivars, with higher values observed in ‘Sonata’. However, transpiration did not consistently exceed the irrigation volume, and exceedance occurred only occasionally on peak days. This indicates that water supply was generally sufficient to meet plant demand throughout the experimental period.
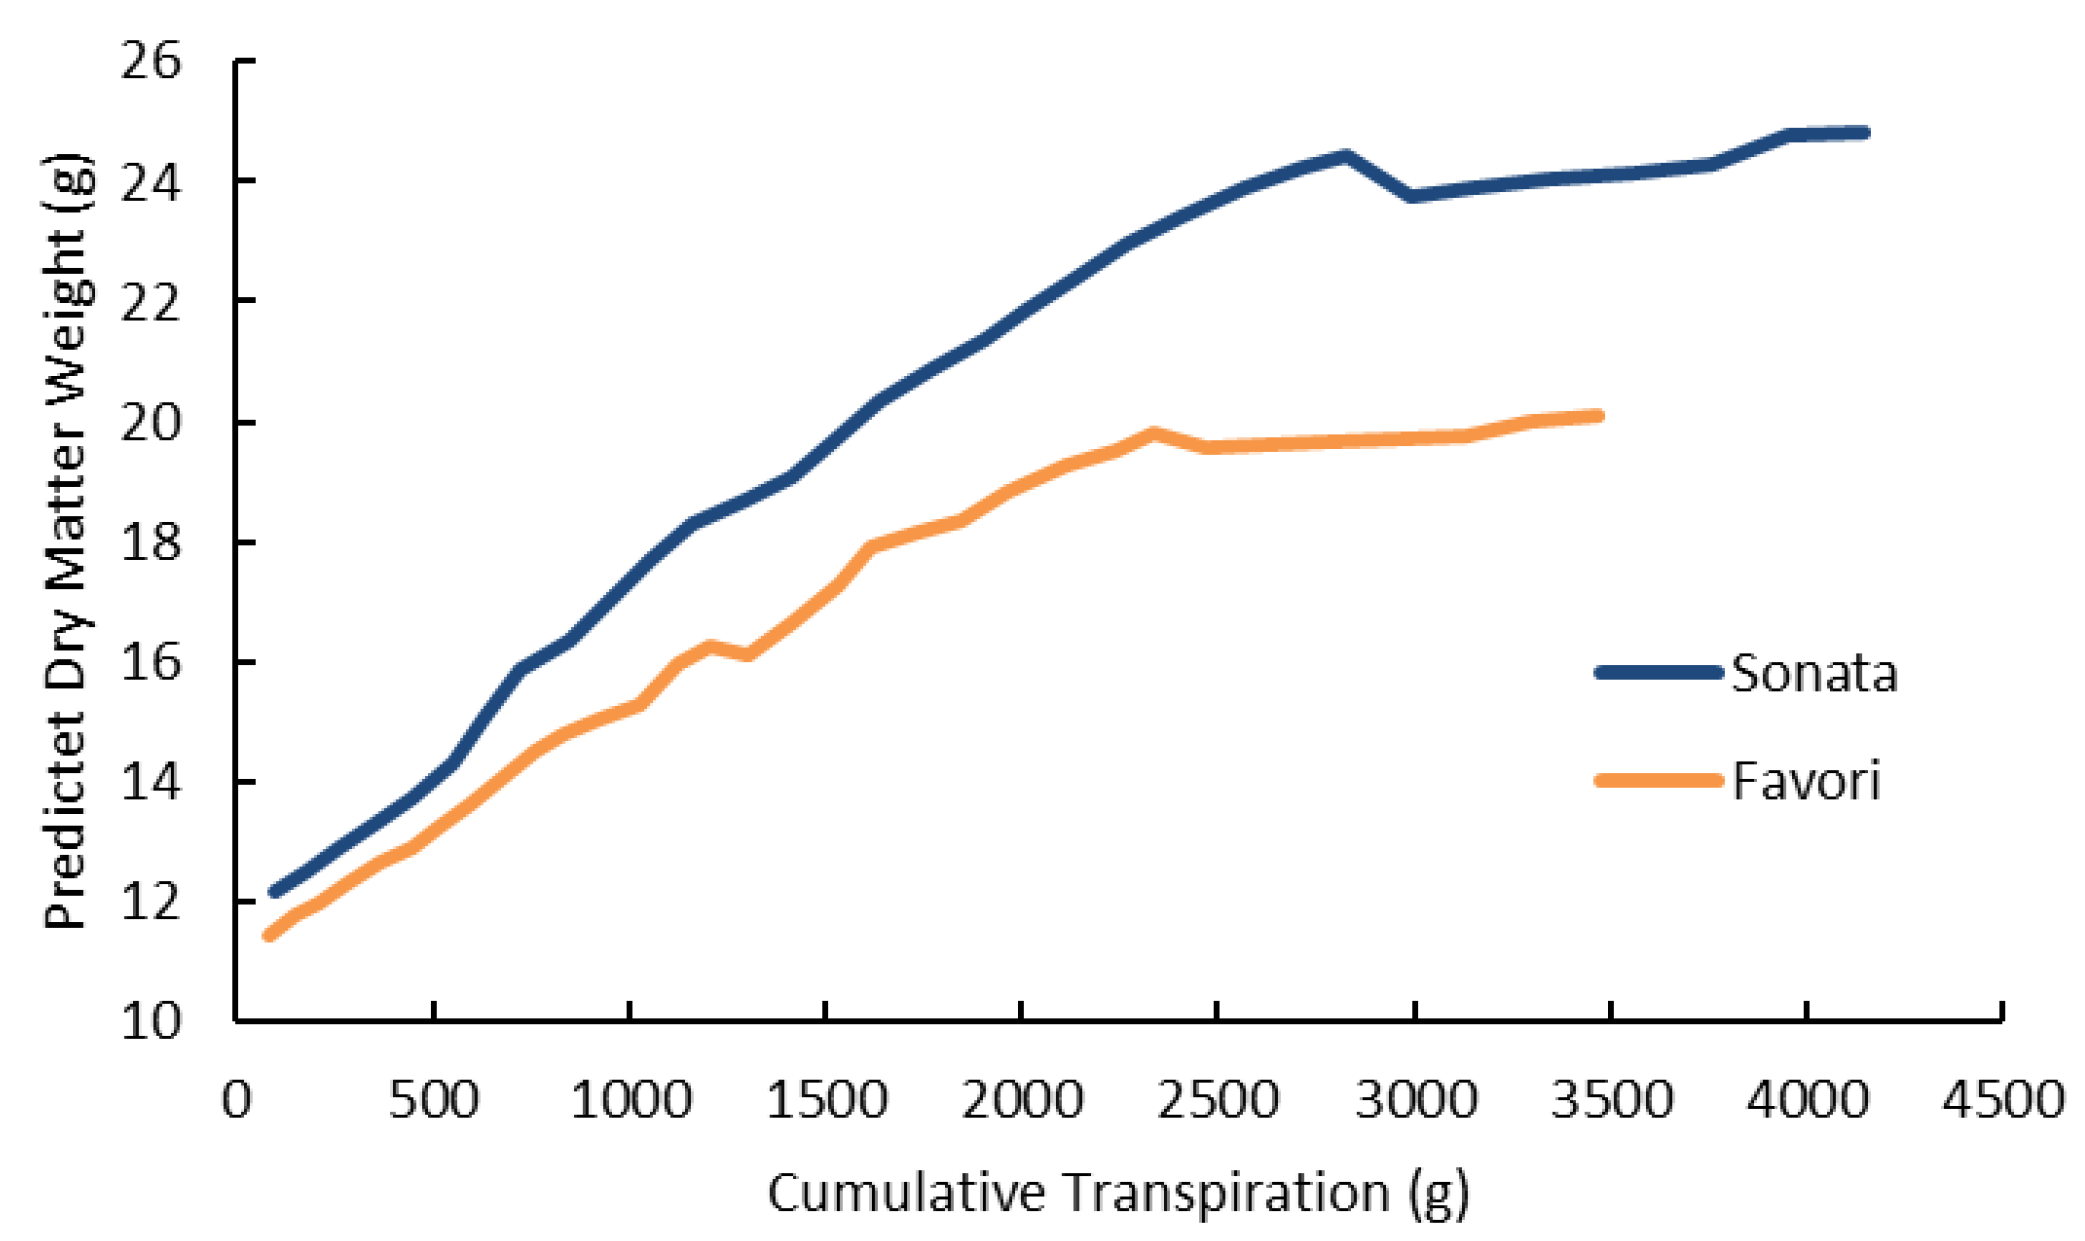
Figure 7 shows the relationship between the predicted dry matter weight and cumulative transpiration for each cultivar.
During the cultivation period (32 days), the dry matter weight of ‘Sonata’ was predicted to increase by 12.7 g, and the cumulative transpiration reached 4146.4 g. The dry matter weight of ‘Favori’ was predicted to increase by 8.6 g, and the cumulative transpiration reached 3467.2 g. The corresponding period-average WUE (Δ dry matter weight/Σ transpiration) was 3.1 mg g−1 for ‘Sonata’ and 2.5 mg g−1 for ‘Favori’, indicating that ‘Sonata’ outperformed ‘Favori’ by 22.7 %. The analysis results of cumulative regression of dry matter weight and cumulative transpiration for each variety are presented in Table 5.
Cumulative regression analysis using only the observed dry matter weight data showed that both cultivars maintained a strong linear association between dry matter and cumulative transpiration. ‘Sonata’ showed an intercept of 13.400, a slope of 0.00343 g g−1 (equivalent to 3.4 mg g−1), and an R2 of 0.899, indicating consistently high season integrated water to biomass conversion. ‘Favori’ exhibited an intercept of 12.2, a slope of 0.00281 g g−1 (2.8 mg g−1), and an R2 of 0.918. These results confirmed that the cultivar ranking observed in the interpolated analysis was preserved: ‘Sonata’ consistently demonstrated higher WUE than ‘Favori’. The average daily RGR was 23.0 mg day−1 for ‘Sonata’ and 18.1 mg day−1 for ‘Favori’, with ‘Sonata’ showing a 27.1% advantage. The average daily CGR was 408.0 mg day−1 for ‘Sonata’ and 278.0 mg day−1 for ‘Favori’.

4. Discussion

‘Sonata’ and ‘Favori’ showed photoperiod-type differences in canopy formation, biomass accumulation, and water use. This result is consistent with reports indicating that flower buds form under long-day conditions in ‘Favori’ [27] and short-day conditions in ‘Sonata’ [28]. Destructive end-point data and 3D-derived estimates jointly indicated a canopy-driven strategy in ‘Sonata’ versus a reproduction-driven strategy in ‘Favori’, which is consistent with the well-established divergence of flowering responses between seasonal-flowering (facultative short-day) and everbearing (quantitative/obligate long-day depending on temperature) strawberries [29,30,31,32]. Under long-day greenhouse conditions (~16 h), ‘Sonata’ expanded leaf area and dry mass, whereas ‘Favori’ invested more in inflorescences. This allocation pattern likely reflects the photoperiodic response of each cultivar. Under 16 h long-day conditions, ‘Sonata’ exhibited a canopy-dominant strategy, whereas ‘Favori’ showed a greater tendency toward reproductive allocation.
Although the two cultivars had similar RGRs, ‘Sonata’ achieved a significantly higher CGR than ‘Favori’. This result can be attributed to the greater stand-level light interception conferred by the larger canopy of ‘Sonata’ (Table 2 and Table 3). Recent 3D phenotyping studies across crops have emphasized that canopy architecture is a first-order driver of the integral of canopy photosynthesis and biomass formation and that predictors such as canopy occupation volume or volumetric proxies closely track canopy photosynthetic performance and yield formation [8,33]. Our finding that a simple digital biomass proxy derived from point clouds aligned with CGR differences is consistent with these reports. A limitation of this study is the relatively small sample size (n = 5), which may constrain the statistical power of the analysis. In phenotyping studies of strawberries, where biological variability can be substantial, this limitation may reduce the sensitivity to detect subtle differences and increase the risk of Type II errors. Therefore, the observed trends should be interpreted with caution. However, the physiological mechanisms underlying these contrasting growth strategies were not directly quantified in the present study. Leaf photosynthetic capacity is closely associated with leaf nitrogen content because a substantial proportion of nitrogen is invested in photosynthetic proteins, including Rubisco and components of the electron transport system [34]. In addition, stomatal conductance regulates CO2 diffusion into leaves and thus directly influences photosynthesis, transpiration, and biomass production [35]. These findings suggest that differences in photosynthetic rate, stomatal conductance, and nitrogen status may contribute to the observed divergence in biomass accumulation and resource allocation between ‘Sonata’ and ‘Favori’. Therefore, the canopy-driven and reproduction-driven growth patterns identified in this study should be interpreted as hypothesis-based explanations rather than mechanistically validated conclusions. Future research incorporating direct measurements of gas exchange, stomatal conductance, and leaf nitrogen content will be essential to elucidate the physiological basis of these growth strategies.
Regarding measurement validity, daily top-view laser scanning (PlantEye) yielded plant height with moderate agreement (R2 = 0.63) but showed limited predictive accuracy for biomass (R2 = 0.58) compared to manual/destructive measurements. This limited performance, particularly for biomass, indicates that the current high-throughput approach is highly applicable during early-to-mid growth stages before severe canopy closure, but faces challenges as leaf area index (LAI) increases. This is in line with the broader literature highlighting that advanced 3D sensing accuracy significantly varies with canopy closure, LAI, and growth stage [36,37].
The cumulative relationship between predicted dry matter increases and cumulative transpiration was strikingly linear in both cultivars (R2 = 0.90–0.92), and the period-average WUE was ~22.7% higher in ‘Sonata’ than in ‘Favori’ (Figure 6). The dry matter–transpiration proportionality observed here is in accordance with the canonical framework of (normalized) biomass water productivity being near-conservative across environments and with the long-recognized hand-in-hand relationship between crop transpiration and biomass gain [38,39,40]. Moreover, theory and evidence indicate that temporal deployment of transpiration against daily vapor pressure deficit (VPD), rather than static leaf-level gas-exchange ratios, often governs effective WUE at the crop scale [41]. In our context, ‘Sonata’ appears to have leveraged its larger canopy to enhance light capture sufficiently that the incremental assimilation outweighed the concomitant increase in transpiration, thereby improving WUE at the period scale.
However, this study has several limitations that warrant consideration. First, our observation window (~32 days) primarily covered the vegetative phase, and full-season dynamics across flowering and fruit filling were not tracked. Second, although digital-biomass accuracy was acceptable for non-destructive monitoring, organ-resolved dry-mass prediction (leaves, crowns, peduncles, and fruits) remains a target for improvement using time-series point-cloud segmentation and skeleton-based trait extraction [42,43]. Third, a single long-day regime was maintained in this study; future studies should explicitly resolve photoperiod × temperature interactions and light quality effects (e.g., blue- and far-red-mediated signaling) that modulate both vegetative and reproductive development [44,45,46]. Finally, a methodological limitation in the estimation of WUE should be noted. Gravimetric weight loss represents total evapotranspiration, which includes both plant transpiration and soil evaporation [47]. In this study, soil evaporation was not physically prevented. As a result, the measured water loss likely contained a non-negligible evaporative component from the soil surface, potentially leading to a slight overestimation of water use and a corresponding underestimation of intrinsic transpiration-based WUE, as soil evaporation can influence canopy-scale WUE estimates [15]. However, the relative humidity during the experimental period was relatively high (71.0 ± 2.9%), which likely reduced the vapor pressure gradient at the soil surface and thereby suppressed soil evaporation to some extent. Nevertheless, soil evaporation cannot be fully excluded, particularly in pot experiments where total evapotranspiration may deviate from actual crop transpiration [48]. Importantly, because both cultivars were evaluated under identical conditions, the relative differences in WUE between cultivars are expected to remain robust.
The integrated 3D phenotyping × continuous gravimetry pipeline enables day-resolved, non-destructive tracking of canopy structure and whole-plant water balance under controlled experimental conditions. By employing high-throughput functional phenotyping systems, such as 3D scanners (e.g., PlantEye) and gravimetric measurement units (e.g., PlantArray), researchers can achieve precise pot-scale mass balance and automated feedback irrigation. However, these approaches rely on high-cost, specialized equipment and tightly controlled environmental conditions, which may limit their applicability in field settings and large-scale commercial production.
This level of control facilitates the quantification of VPD/radiation responses and season-integrated WUE under both controlled and stress scenarios. In controlled environment production, categorizing cultivars based on their biomass allocation strategies, particularly between canopy architecture development and reproductive sink strength, may contribute to the optimization of cultivar-specific set points for resource management and WUE-based selection. However, one limitation of this study is that only two cultivars were examined. These cultivars were selected to represent contrasting photoperiodic responses (long-day and short-day), enabling evaluation under clearly different physiological conditions. Nevertheless, future studies including a larger number of cultivars would be valuable to further validate and extend the present results. In addition, further validation under field conditions is required to confirm the practical applicability of these approaches.

5. Conclusions

This study demonstrated that integrating daily non-destructive 3D point cloud phenotyping with continuous gravimetric monitoring can determine cultivar-specific growth strategies in strawberry under identical environments. The short-day cultivar ‘Sonata’ displayed a canopy driven strategy with greater leaf area, higher CGR, and superior period average WUE, whereas the long-day cultivar ‘Favori’ allocated more to reproductive structures and exhibited lower canopy scale water to biomass conversion. The dry matter–transpiration relationship was strongly linear in both cultivars, supporting the use of cumulative, whole-plant indicators to benchmark WUE. Practically, these results may allow for cultivar-tailored environmental control (irrigation, fertigation, and lighting) in the future and highlight the value of gravimetry integration for high-resolution, non-destructive phenotyping. Future work should extend to full-season monitoring across flowering and fruiting, refine organ level biomass estimation from point clouds, and resolve photoperiod × temperature × light quality interactions to generalize recommendations across production settings.

Author Contributions

H.U.: Conceptualization, Investigation, Formal analysis, Visualization, Writing—original draft; T.A.: Investigation, Formal analysis; R.v.d.Z.: Resources, Project Administration, Writing—Review & Editing; S.H.: Supervision, Writing—review & editing. All authors have read and agreed to the published version of the manuscript.

Funding

This research was supported by Nihon University research grant for 2023 Overseas Researchers.

Data Availability Statement

Data is contained within the article.

Conflicts of Interest

Author Takahiro Asai was employed by the company Kubota Co., Ltd. The remaining authors declare that the research was conducted in the absence of any commercial or financial relationships that could be construed as a potential conflict of interest.

Abbreviations

The following abbreviations are used in this manuscript:
WUEWater Use Efficiency
RGRRelative Growth Rate
CGRCrop Growth Rate
VPDVapor Pressure Deficit

References

  1. Guttridge, C.G. Photoperiodism and the growth habit of strawberry. Sci. Hortic. 1969, 21, 127–131. [Google Scholar]
  2. Osnato, M.; Cota, I.C.; Nebhnani, P.N.; Cereijo, U.; Pelaz, S. Photoperiod control of plant growth: Flowering time genes beyond flowering. Front. Plant Sci. 2021, 12, 805635. [Google Scholar] [CrossRef] [PubMed]
  3. Andrés, F.; Coupland, G. The genetic basis of flowering responses to seasonal cues. Nat. Rev. Genet. 2012, 13, 627–639. [Google Scholar] [CrossRef] [PubMed]
  4. Sidhu, V.; Bernier-English, V.; Lamontagne-Drolet, M.; Gravel, V. Effect of light quality and extended photoperiod on flower bud induction during transplant production of day-neutral strawberry cultivars. Can. J. Plant Sci. 2022, 102, 356–367. [Google Scholar] [CrossRef]
  5. Hytönen, T.; Kurokura, T. Control of flowering and runnering in strawberry. Hortic. J. 2020, 89, 96–107. [Google Scholar] [CrossRef]
  6. Li, Y.; Hu, J.; Wei, H.; Jeong, B.R. A long-day photoperiod promotes runner formation through regulation of carbohydrate metabolism in strawberry. Int. J. Mol. Sci. 2020, 21, 4917. [Google Scholar] [CrossRef] [PubMed]
  7. Saha, K.K.; Tsoulias, N.; Weltzien, C.; Zude-Sasse, M. Estimation of vegetative growth in strawberry plants using mobile LiDAR laser scanner. Horticulturae 2022, 8, 90. [Google Scholar] [CrossRef]
  8. Li, Y.; Liang, Z.; Liu, B.; Yin, L.; Wan, F.; Qian, W.; Qiao, X. Applications of 3D reconstruction techniques in crop canopy phenotyping: A review. Agronomy 2025, 15, 2518. [Google Scholar] [CrossRef]
  9. Omia, E.; Park, E.; Semyalo, D.; Joshi, R.; Cho, B.-K. Advancements in 3D field-crop phenotyping using point clouds: A review. Front. Plant Sci. 2026, 17, 1731852. [Google Scholar] [CrossRef] [PubMed]
  10. He, J.Q.; Harrison, R.J.; Li, B. A novel 3D imaging system for strawberry phenotyping. Plant Methods 2017, 13, 93. [Google Scholar] [CrossRef] [PubMed]
  11. James, K.M.F.; Heiwolt, K.; Sargent, D.J.; Cielniak, G. Lincoln’s annotated spatio-temporal strawberry dataset (LAST-Straw). In Computer Vision—ECCV 2024 Workshops; Del Bue, A., Canton, C., Pont-Tuset, J., Tommasi, T., Eds.; Springer: Cham, Switzerland, 2025; Volume 15625, pp. 46–63. [Google Scholar] [CrossRef]
  12. Conn, A.; Pedmale, U.V.; Chory, J.; Navlakha, S. High-resolution laser scanning reveals plant architectures that reflect universal network design principles. Cell Syst. 2017, 5, 53–62.e3. [Google Scholar] [CrossRef] [PubMed]
  13. Ziamtsov, I.; Navlakha, S. Plant 3D (P3D): A plant phenotyping toolkit for 3D point clouds. Bioinformatics 2020, 36, 3949–3950. [Google Scholar] [CrossRef] [PubMed]
  14. Ryan, A.C.; Dodd, I.C.; Rothwell, S.A.; Jones, R.; Tardieu, F.; Draye, X.; Davies, W.J. Gravimetric phenotyping of whole plant transpiration responses identifies variation in water use efficiency. Plant Sci. 2016, 251, 101–109. [Google Scholar] [CrossRef] [PubMed]
  15. Hatfield, J.L.; Dold, C. Water-use efficiency: Advances and challenges in a changing climate. Front. Plant Sci. 2019, 10, 103. [Google Scholar] [CrossRef] [PubMed]
  16. Vadez, V.; Pilloni, R.; Grondin, A.; Hajjarpoor, A.; Belhouchette, H.; Brouziyne, Y.; Chehbouni, G.; Kharrou, M.H.; Zitouna-Chebbi, R.; Mekki, I.; et al. Water use efficiency across scales: From genes to landscapes. J. Exp. Bot. 2023, 74, 4770–4788. [Google Scholar] [CrossRef] [PubMed]
  17. Wang, T.; Sun, S.; Yin, Y.; Zhao, J.; Tang, Y.; Wang, Y.; Gao, F.; Luan, X. Status of crop water use efficiency evaluation methods: A review. Agric. For. Meteorol. 2024, 349, 109961. [Google Scholar] [CrossRef]
  18. Phenospex. Phenospex FAQ. Available online: https://phenospex.helpdocsite.com/ (accessed on 2 April 2024).
  19. Andújar, D.; Dorado, J.; Fernández-Quintanilla, C.; Ribeiro, A. An approach to the use of depth cameras for weed volume estimation. Sensors 2016, 16, 972. [Google Scholar] [CrossRef]
  20. Junker, A.; Muraya, M.M.; Weigelt-Fischer, K.; Arana-Ceballos, F.; Klukas, C.; Melchinger, A.E.; Meyer, R.C.; Riewe, D.; Altmann, T. Optimizing experimental procedures for quantitative evaluation of crop plant performance in high throughput phenotyping systems. Front. Plant Sci. 2015, 5, 770. [Google Scholar] [CrossRef] [PubMed]
  21. Radford, P.J. Growth analysis formulae—Their use and abuse. Crop Sci. 1967, 7, 171–175. [Google Scholar] [CrossRef]
  22. Watson, D.J. The physiological basis of variation in yield. Adv. Agron. 1952, 4, 101–145. [Google Scholar] [CrossRef]
  23. Girardeau-Montaut, D. CloudCompare—3D Point Cloud and Mesh Processing Software. Available online: https://www.cloudcompare.org/ (accessed on 2 April 2024).
  24. Peng, Y.; Zheng, Y.; Zheng, Z.; He, Y. Evaluation and Optimization of Prediction Models for Crop Yield in Plant Factory. Plants 2025, 14, 2140. [Google Scholar] [CrossRef] [PubMed]
  25. Buxbaum, N.; Lieth, J.H.; Earles, M. Non-Destructive Plant Biomass Monitoring with High Spatio-Temporal Resolution via Proximal RGB-D Imagery and End-to-End Deep Learning. Front. Plant Sci. 2022, 13, 758818. [Google Scholar] [CrossRef] [PubMed]
  26. Pathak, D.; Helber, P.; Siddamsetty, J.; Miranda, M.; Bischke, B.; Arenas, D.; Nuske, M.; Mena, F.; Habelitz, P.; Vollmer, M.; et al. Predicting Crop Yield with Machine Learning: An Extensive Analysis of Input Modalities and Models on a Field and Sub-Field Level. arXiv 2023, arXiv:2308.08948. [Google Scholar] [CrossRef]
  27. Rivero, R.; Remberg, S.F.; Heide, O.M.; Sønsteby, A. Effect of temperature and photoperiod preconditioning on flowering and yield performance of three everbearing strawberry cultivars. Horticulturae 2022, 8, 504. [Google Scholar] [CrossRef]
  28. Sønsteby, A.; Heide, O.M. Dynamics of dormancy regulation in ‘Sonata’ strawberry and its relation to flowering and runnering. CABI Agric. Biosci. 2021, 2, 1. [Google Scholar] [CrossRef]
  29. Darby, E.; Islam, T. Environmental and molecular regulation of flowering in cultivated strawberry (Fragaria × ananassa). Hortic. Res. 2024, 12, uhae309. [Google Scholar] [CrossRef] [PubMed]
  30. Samad, S.; Butare, D.; Marttila, S.; Sønsteby, A.; Khalil, S. Effects of temperature and photoperiod on the flower potential in everbearing strawberry as evaluated by meristem dissection. Horticulturae 2021, 7, 484. [Google Scholar] [CrossRef]
  31. Sønsteby, A.; Heide, O.M. Long-day control of flowering in everbearing strawberries. J. Hortic. Sci. Biotechnol. 2007, 82, 875–884. [Google Scholar] [CrossRef]
  32. Sønsteby, A.; Heide, O.M. Long-day flowering response of everbearing strawberries. Acta Hortic. 2009, 842, 777–780. [Google Scholar] [CrossRef]
  33. Zhu, Y.; Sun, G.; Ding, G.; Zhou, J.; Wen, M.; Jin, S.; Zhao, Q.; Colmer, J.; Ding, Y.; Ober, S.E.; et al. Large-scale field phenotyping using backpack LiDAR and CropQuant-3D to measure structural variation in wheat. Plant Physiol. 2021, 187, 716–738. [Google Scholar] [CrossRef] [PubMed]
  34. Evans, J.R. Photosynthesis and Nitrogen Relationships in Leaves of C3 Plants. Oecologia 1989, 78, 9–19. [Google Scholar] [CrossRef] [PubMed]
  35. Sakoda, K.; Yamori, W.; Shimada, T.; Sugano, S.S.; Hara-Nishimura, I.; Tanaka, Y. Higher Stomatal Density Improves Photosynthetic Induction and Biomass Production in Arabidopsis Under Fluctuating Light. Front. Plant Sci. 2020, 11, 589603. [Google Scholar] [CrossRef] [PubMed]
  36. Zang, J.; Jin, S.; Zhang, S.; Li, Q.; Mu, Y.; Li, Z.; Li, S.; Wang, X.; Su, Y.; Jiang, Y. Field-measured canopy height may not be as accurate and heritable as believed: Evidence from advanced 3D sensing. Plant Methods 2023, 19, 39. [Google Scholar] [CrossRef] [PubMed]
  37. Zieschank, V.; Junker, R.R. Digital whole-community phenotyping: Tracking morphological and physiological responses of plant communities to environmental changes in the field. Front. Plant Sci. 2023, 14, 1141554. [Google Scholar] [CrossRef] [PubMed]
  38. Patil, M.G.; Reddy, M.S.; Patil, S.S.; Ayyangoudar, M.S.; Desai, B.K. Studies on efficient use of water in onion (Allium cepa L.) through drip irrigation under semi-arid conditions. Acta Hortic. 2016, 1112, 135–140. [Google Scholar] [CrossRef]
  39. Steduto, P.; Albrizio, R. Resource use efficiency of field-grown sunflower, sorghum, wheat and chickpea. II. Water use efficiency and canopy stomatal conductance. Agric. For. Meteorol. 2000, 100, 273–281. [Google Scholar] [CrossRef]
  40. Steduto, P.; Hsiao, T.C.; Fereres, E. On the conservative behavior of biomass water productivity. Irrig. Sci. 2007, 25, 189–207. [Google Scholar] [CrossRef]
  41. Sinclair, T.R. Effective water use required for improving crop growth rather than transpiration efficiency. Front. Plant Sci. 2018, 9, 1442. [Google Scholar] [CrossRef] [PubMed]
  42. Frioni, T.; Bertoloni, G.; Squeri, C.; Garavani, A.; Ronney, L.; Poni, S.; Gatti, M. Biodiversity of local Vitis vinifera L. germplasm: A powerful tool toward adaptation to global warming and desired grape composition. Front. Plant Sci. 2020, 11, 608. [Google Scholar] [CrossRef] [PubMed]
  43. Zhang, Z.; Liu, F.; Zhou, Z.; He, Y.; Fang, H. Roughness measurement of leaf surface based on shape from focus. Plant Methods 2021, 17, 75. [Google Scholar] [CrossRef] [PubMed]
  44. David, S.; Ficová, G.; Marcelis, L.F.M.; Verdonk, J.C. Photoperiodic effects on early plant development in everbearing and seasonal flowering strawberry. bioRxiv 2025. [Google Scholar] [CrossRef]
  45. Jiang, N.; Yang, Z.; Zhang, H.; Xu, J.; Li, C. Effect of low temperature on photosynthetic physiological activity of different photoperiod types of strawberry seedlings and stress diagnosis. Agronomy 2023, 13, 1321. [Google Scholar] [CrossRef]
  46. Yang, J.; Song, J.; Jeong, B.R. Flowering and runnering of seasonal strawberry under different photoperiods are affected by intensity of supplemental or night-interrupting blue light. Plants 2024, 13, 375. [Google Scholar] [CrossRef] [PubMed]
  47. Allen, R.G.; Pereira, L.S.; Raes, D.; Smith, M. Crop Evapotranspiration: Guidelines for Computing Crop Water Requirements; FAO Irrigation and Drainage Paper No. 56; Food and Agriculture Organization of the United Nations: Rome, Italy, 1998; ISBN 92-5-104219-5. Available online: https://www.fao.org/4/x0490e/x0490e00.htm (accessed on 8 June 2026).
  48. Lu, Y.; Ma, D.; Chen, X.; Zhang, J. A Simple Method for Estimating Field Crop Evapotranspiration from Pot Experiments. Water 2018, 10, 1823. [Google Scholar] [CrossRef]
Figure 1. Row planting diagram in the experiment.
Horticulturae 12 00752 g001
Figure 2. An overview of the cultivation experiment.
Horticulturae 12 00752 g002
Figure 3. The 3D point cloud images of ‘Sonata’ cultivar acquired in this experiment. (a) Perspective view, (b) side view, (c) height-colored view. In (c), the color represents the Z-axis value, ranging from low (blue) to high (red), illustrating the spatial structure of the plant canopy.
Horticulturae 12 00752 g003
Figure 4. Comparison of plant parameters predicted using 3D point cloud data and those obtained using actual measurements: (a) plant height measured repeatedly over time on the same individuals (n = 50) and (b) dry matter content and digital biomass (n = 10).
Horticulturae 12 00752 g004
Figure 5. Comparison of growth analysis results predicted using 3D point cloud data and those obtained using actual measurements: (a) RGR (n = 10) and (b) CGR (n = 10). The orange plot represents ‘Favori’, and the blue plot represents ‘Sonata’.
Horticulturae 12 00752 g005
Figure 6. Comparison of daily transpiration of each cultivar (‘Favori’ and ‘Sonata’) with the fixed irrigation volume (200 mL plant−1 day−1). Values are expressed in mL assuming a density of 1 g mL−1.
Horticulturae 12 00752 g006
Figure 7. Comparison of the predicted dry matter weight–cumulative transpiration relationship across cultivars.
Horticulturae 12 00752 g007
Table 1. Means (±standard deviation; meteorological data reflect time variability) of temperature, relative humidity, CO2 concentration, and photosynthetically active radiation around the strawberry plants in the greenhouse during the experiment.
Temperature
(°C)
Relative Humidity
(%rh)
CO2 Concentration
(ppm)
PAR
(µmol m−2 s−1)
21.7 ± 0.471.0 ± 2.9501.4 ± 6.8199.7 ± 39.2
Table 2. Means (±standard deviation) of plant height, leaf number, peduncle number, flower number, leaf area, and plant dry weight per plant in strawberry cultivars ‘Favori’ and ‘Sonata’ at the end of the experiment; n = 5.
CultivarPlant
Height (cm)
Leaf NumberPeduncle NumberFlower NumberLeaf
Area (cm2)
Plant Dry Weight (g)
‘Favori’21.3 ± 4.111.0 ± 2.13.6 ± 1.321.4 ± 8.81060.0 ± 306.018.8 ± 4.5
‘Sonata’24.5 ± 2.114.2 ± 3.31.4 ± 1.59.6 ± 11.51520.0 ± 146.626.1 ± 4.0
t-test **
* Parameters marked with an asterisk are significantly (p < 0.05) different according to t-test (two-tailed).
Table 3. Means (±standard deviation) of relative growth rate (RGR) and crop growth rate (CGR) in strawberry cultivars ‘Favori’ and ‘Sonata’; n = 5.
CultivarRGRCGR
‘Favori’0.070 ± 0.00912.49 ± 3.28
‘Sonata’0.068 ± 0.00517.17 ± 2.90
t-test *
* Parameters marked with an asterisk are significantly (p < 0.05) different according to t-test (two-tailed).
Table 4. Pearson correlation matrix of actual and predicted values for relative growth rate (RGR) and crop growth rate (CGR); n = 10.
Actual RGRPredicted RGRActual CGRPredicted CGR
Actual RGR1
Predicted RGR0.6971
Actual CGR0.6610.5001
Predicted CGR0.1440.5170.7291
Table 5. Results of cumulative regression analysis of dry matter weight and cumulative transpiration.
Cultivara (g)b (mg g−1)R2
‘Favori’12.22.80.918
‘Sonata’13.43.40.899
Disclaimer/Publisher’s Note: The statements, opinions and data contained in all publications are solely those of the individual author(s) and contributor(s) and not of MDPI and/or the editor(s). MDPI and/or the editor(s) disclaim responsibility for any injury to people or property resulting from any ideas, methods, instructions or products referred to in the content.