Article

Pre-Apical Leaf Removal and Partial Must Substitution as Strategies to Reduce Ethanol in Tannat Red Wines

by
Diego Piccardo
1,*,
Yamila Celio-Ackermann
1,
Guzmán Favre
1,
Florencia Pereyra-Farina
1,
Alejandro Cammarota
1,
Gustavo González-Neves
1 and
Mercedes Fourment
2
1
Unidad de Tecnología de los Alimentos, Facultad de Agronomía, Universidad de la República, Garzón 780, Montevideo 12900, Uruguay
2
Departamento de Producción Vegetal, Facultad de Agronomía, Universidad de la República, Garzón 780, Montevideo 12900, Uruguay
*
Author to whom correspondence should be addressed.
Horticulturae 2026, 12(6), 674; https://doi.org/10.3390/horticulturae12060674 (registering DOI)
Submission received: 27 April 2026 / Revised: 19 May 2026 / Accepted: 27 May 2026 / Published: 29 May 2026

Abstract

Climate change and evolving consumer preferences are increasing the demand for wines with lower alcohol content and improved compositional balance. This study evaluated the effects of pre-apical leaf removal (LR) and partial substitution of ripe grape must with must or wine from unripe grapes (MS and WS) on ethanol content, acidity, phenolic composition, color, and sensory attributes of Tannat red wines under temperate-humid conditions. A complementary small-scale experiment assessed substitution levels (5–20%). All strategies reduced ethanol content, though with varying effects on wine composition. LR moderately decreased ethanol by limiting carbon assimilation but did not significantly affect acidity and reduced phenolic compounds, particularly anthocyanins. In contrast, MS and WS were more effective, reducing ethanol, lowering pH, and increasing titratable acidity. These treatments largely preserved phenolic composition and color, especially at moderate substitution levels, whereas post-fermentative blending showed a stronger dilution effect. Sensory differences were limited: LR wines showed lower color intensity, while MS and WS maintained visual attributes similar to the control. Results from the complementary exploratory assay suggested that substitution levels around 15% may provide a suitable balance between ethanol reduction, acidity, phenolic preservation, and sensory acceptability. These strategies offer practical tools to produce balanced, lower-alcohol Tannat wines.

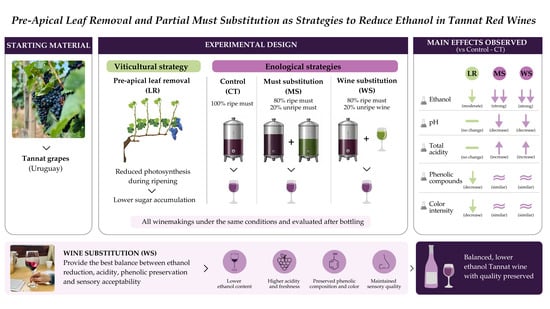
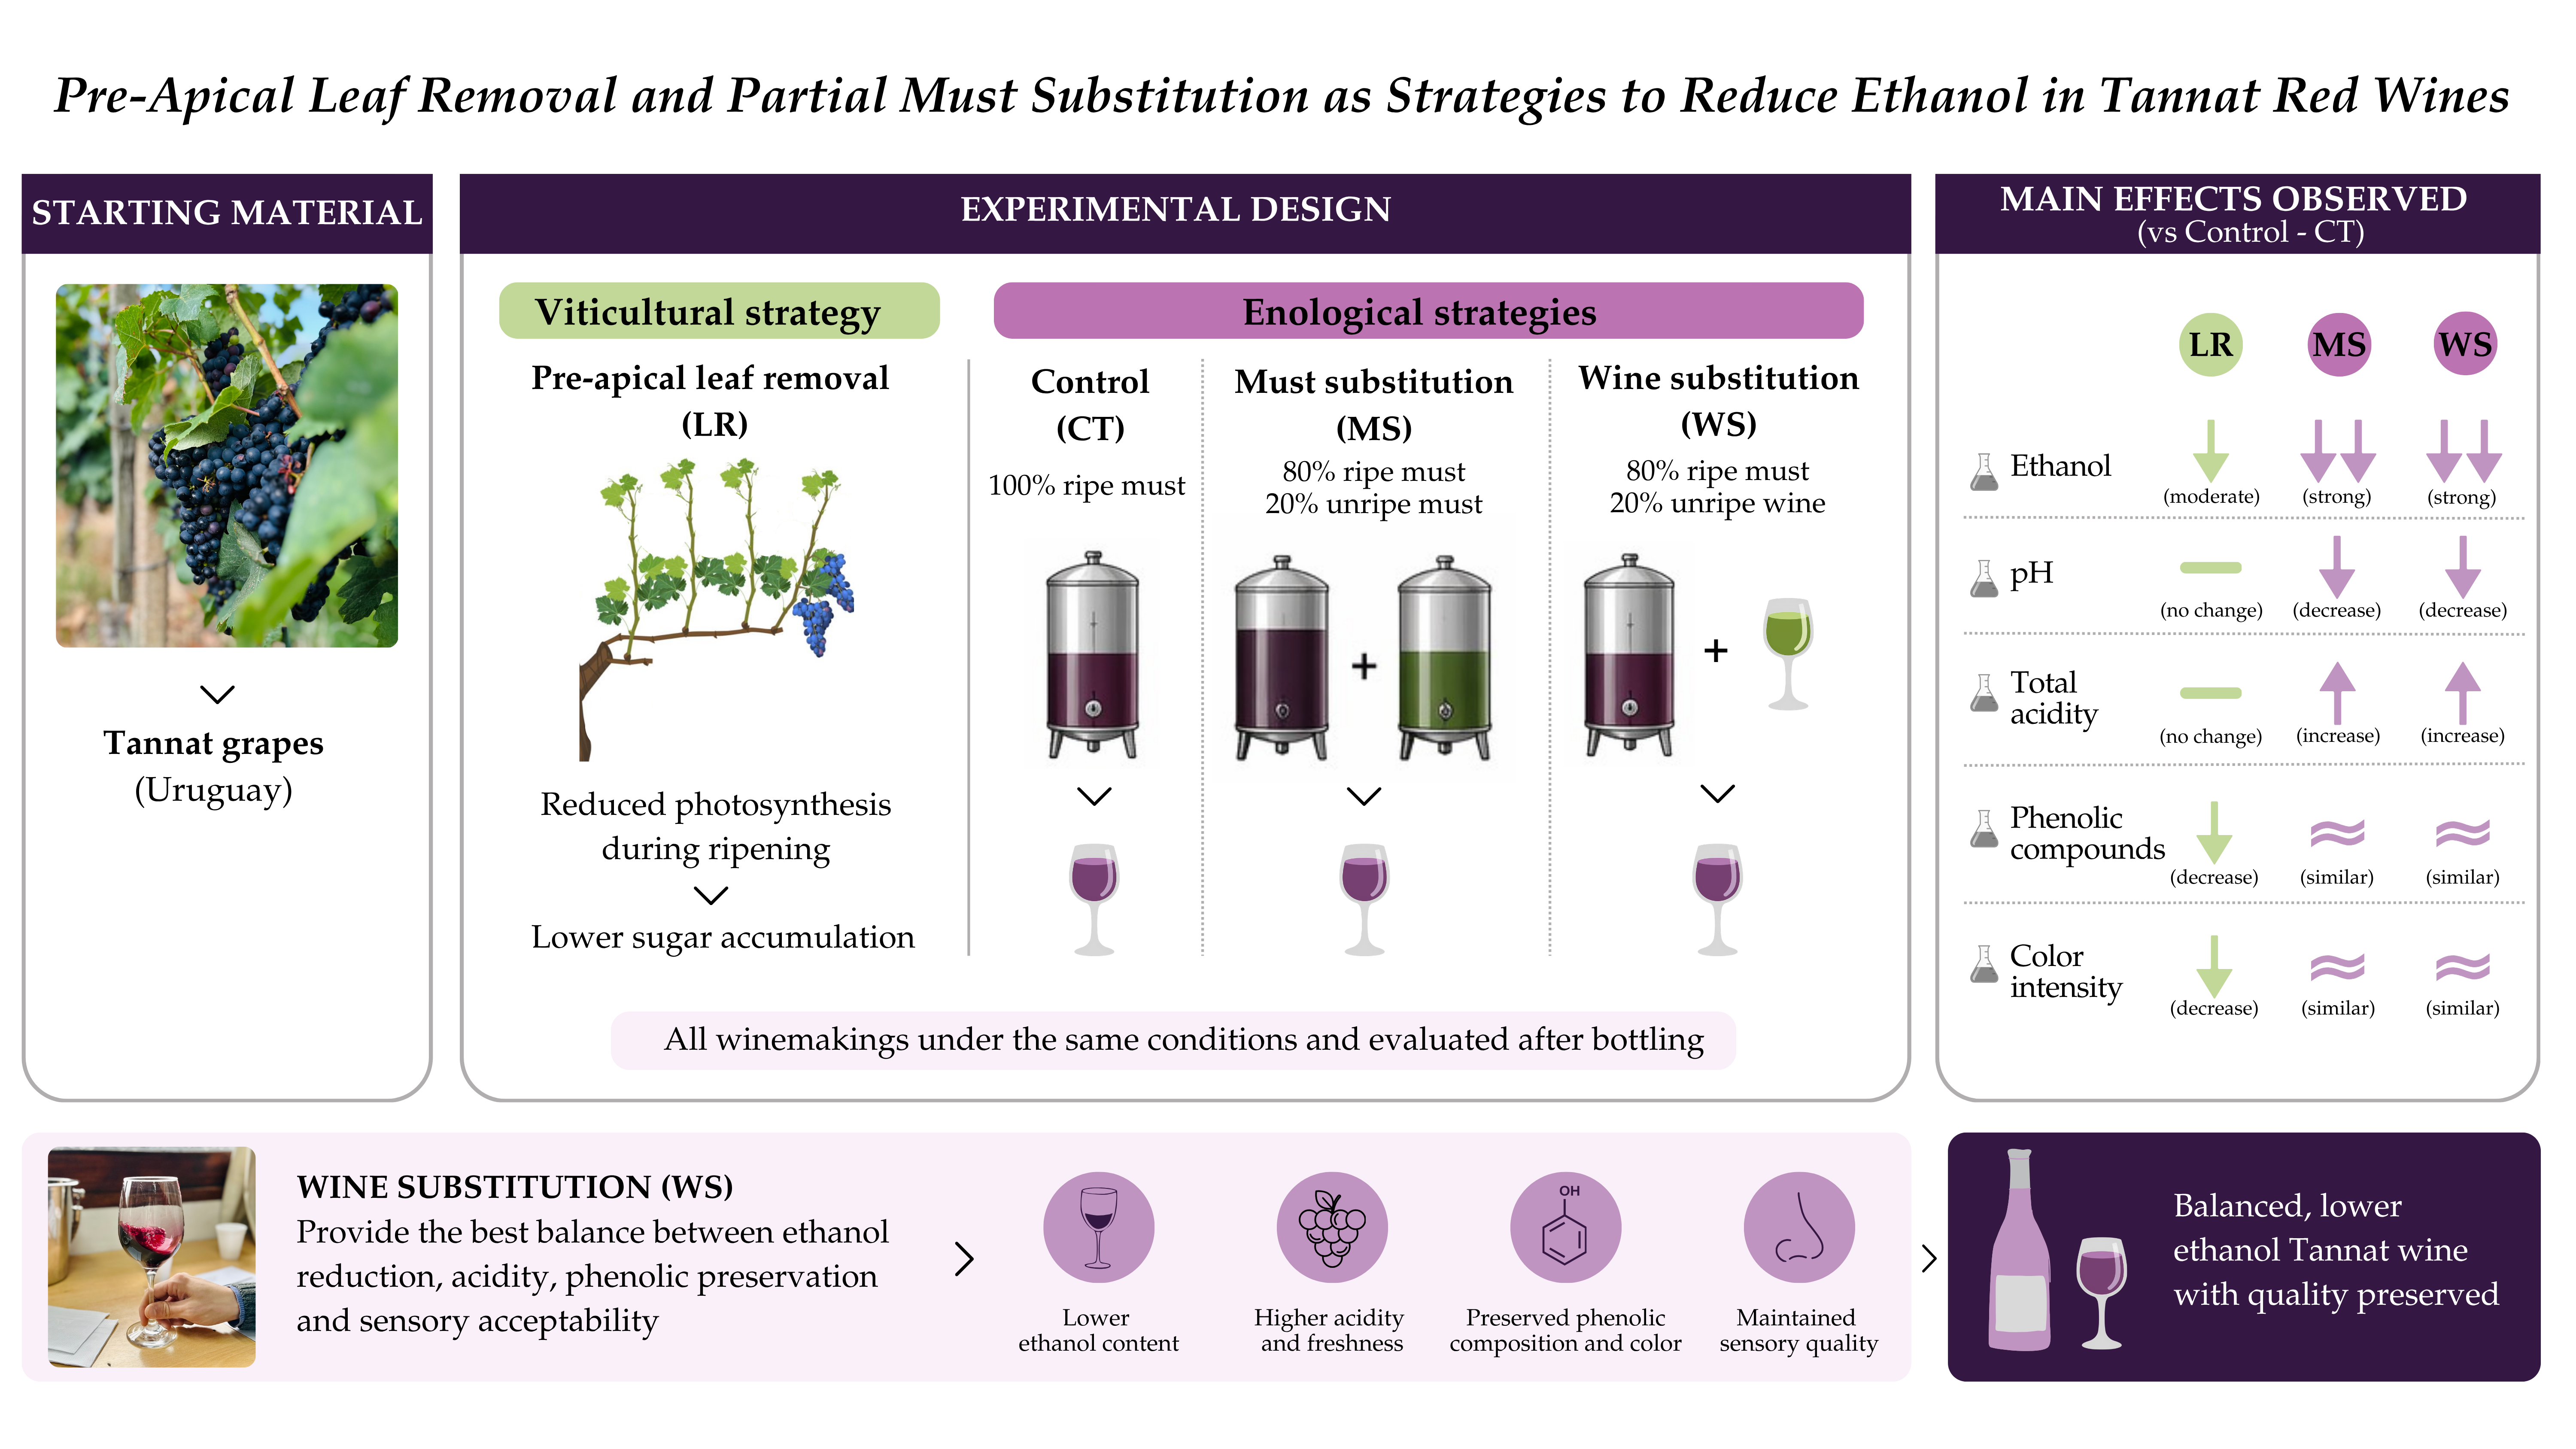
Graphical Abstract

1. Introduction

Current trends in wine consumption are increasingly influenced by health awareness and sustainability concerns, driving demand for lower-alcohol wines [1,2,3,4,5]. A growing segment of consumers prefers wines with moderate ethanol levels and balanced sensory profiles, aligned with moderation-oriented lifestyles. Recent market data further support this trend, reporting sustained expansion in the low- and no-alcohol wine segment, with increasing consumer adoption driven by evolving preferences, product availability, and demographic shifts [6].
At the same time, climate change is intensifying challenges associated with grape ripening and wine balance. In many wine-growing regions, rising temperatures, altered precipitation patterns, and increased frequency of extreme weather events are accelerating grapevine phenology and advancing ripening [7,8,9,10]. Because grapevine development is strongly temperature-dependent, warmer conditions promote excessive sugar accumulation, reduced acidity, and modifications in phenolic composition, ultimately affecting wine balance and typicity [11]. This challenge is particularly critical in red cultivars, where technological maturity often precedes phenolic maturity, leading to delayed harvest and consequently higher ethanol levels [12]. In South America, especially in Uruguay, projected increases in heatwaves and heavy rainfall events may further exacerbate variability in grape composition and wine style, increasing production uncertainty [13,14,15,16].
The convergence of these trends represents a major challenge for modern viticulture and winemaking systems. Wines produced under warmer conditions often exhibit elevated ethanol content and higher pH, which can negatively affect freshness, microbiological stability, color intensity, and the effectiveness of sulfur dioxide [17,18]. These compositional shifts may also increase the risk of fermentation issues and volatile acidity, ultimately compromising wine quality and increasing production costs [18].
Several approaches have been proposed to address this challenge. At the vineyard level, varietal and clonal selection, together with adaptive canopy management practices, have shown potential to modulate sugar accumulation and acid metabolism according to annual climatic conditions [19,20,21,22,23,24,25,26,27]. Among these practices, pre-apical leaf removal reduces photosynthetic capacity during ripening by removing leaves from the middle section of the shoot above the clusters. This intervention can limit sugar accumulation and promote more balanced ripening [28,29]. Although the magnitude of the effect may depend on canopy compensation and the remaining functional leaf area, this intervention can limit sugar accumulation and promote more balanced ripening [30]. In addition, because it is applied in a cluster-free zone, the practice can be fully mechanized using standard leaf-removal equipment.
At the winery level, technological approaches based on partial substitution of ripe grape must with must or wine derived from less mature grapes have emerged as practical alternatives to physical dealcoholization techniques [23,31,32,33,34,35,36,37,38,39,40]. These strategies reduce the initial sugar concentration or final ethanol content by dilution with lower-sugar or lower-alcohol components, while also increasing titratable acidity and lowering wine pH due to the naturally higher organic acid content of unripe grape matrices. However, most studies have evaluated these approaches independently, and comparative assessments within the same production system remain limited.
This gap is particularly relevant for Tannat cultivated under temperate-humid conditions, where high interannual climatic variability may influence the effectiveness of both viticultural and enological strategies. Moreover, limited information is available on how these approaches differentially affect phenolic composition, color expression, and sensory attributes in Tannat wines, a cultivar characterized by high phenolic potential and strong sensitivity to ripening conditions.
Therefore, this study aimed to evaluate and compare the effects of pre-apical leaf removal and the partial substitution of ripe grape must with must or wine obtained from unripe grapes on ethanol content, acidity, phenolic composition, color parameters, and sensory characteristics of Tannat red wines. A complementary small-scale experiment was also conducted to assess the influence of substitution level on wine composition. We hypothesized that pre-apical leaf removal could reduce ethanol concentration by limiting carbon assimilation without markedly modifying acidity, whereas pre-fermentative substitution strategies using must or wine from less mature grapes could reduce ethanol concentration while increasing acidity and lowering pH due to the incorporation of matrices with higher organic acid content. We also expected that these strategies might differentially influence phenolic composition and color stability.

2. Materials and Methods

2.1. Vineyard Site and Plant Material

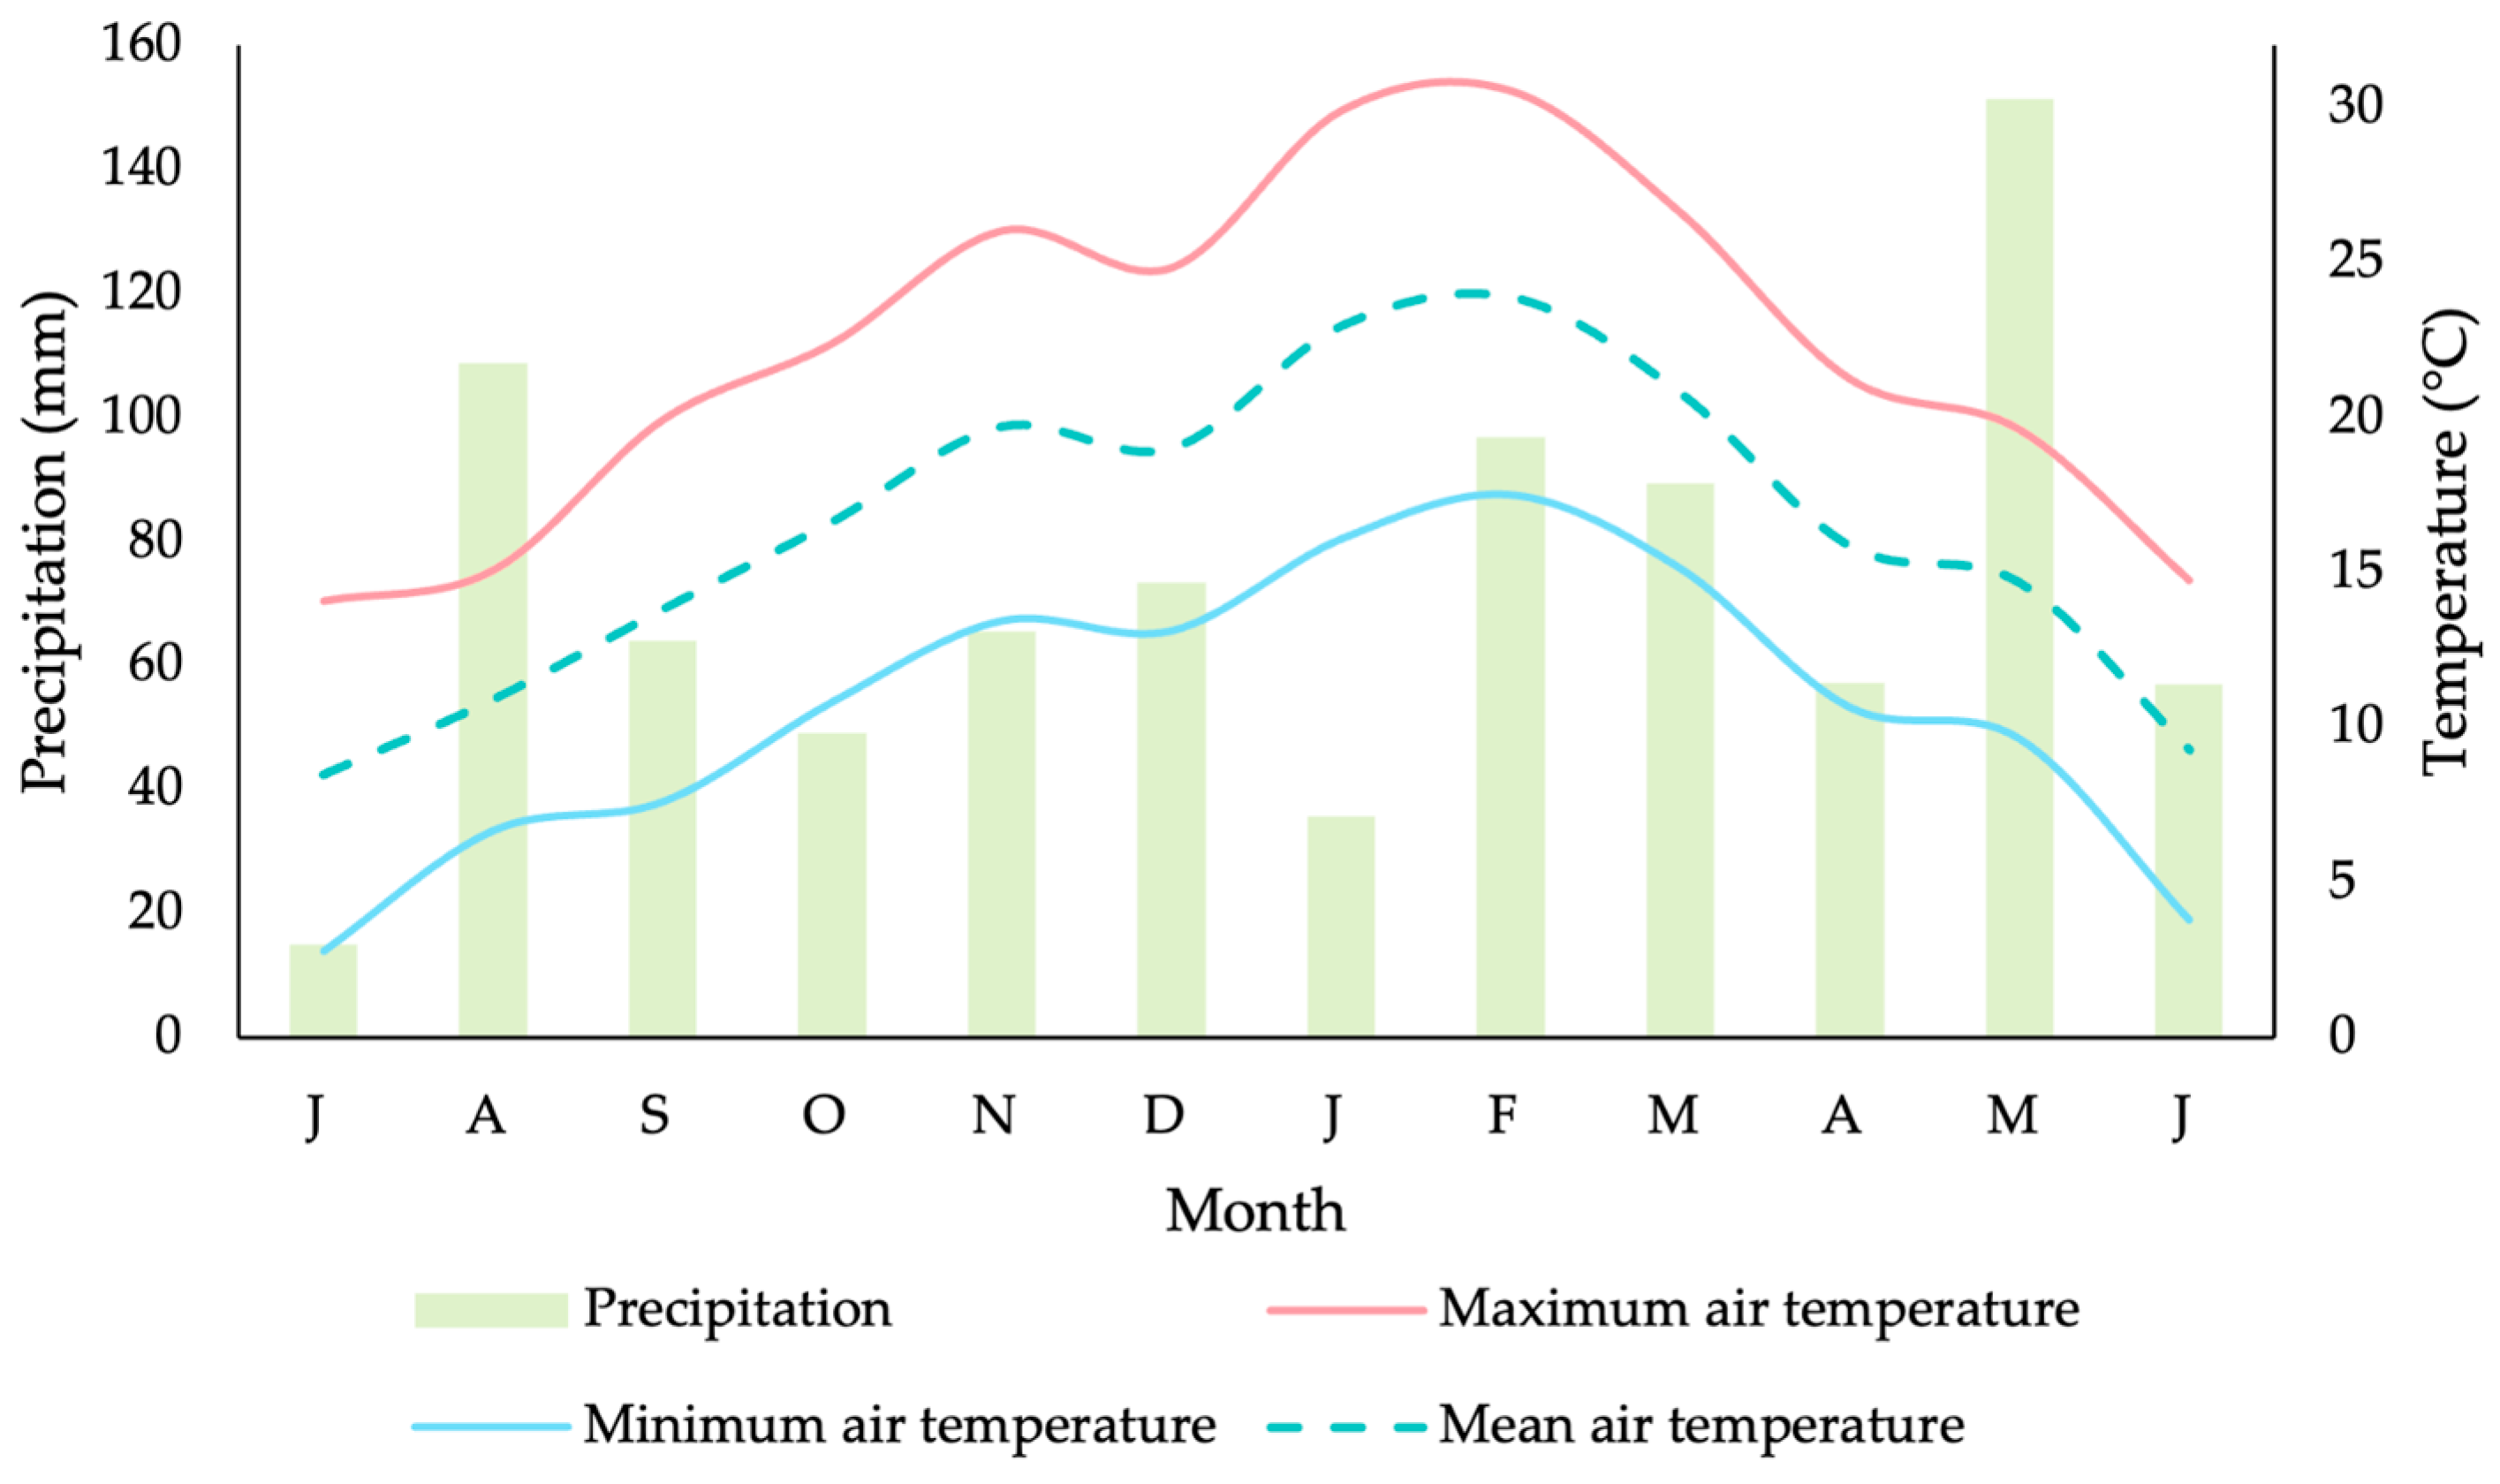
This study was conducted during the 2024–2025 growing season in a commercial vineyard located in Canelón Chico, Canelones, southern Uruguay (34° S). The region has a temperate-humid climate with hot summers and precipitation distributed throughout the year, classified as Cfa according to the Köppen–Geiger system [41]. Agroclimatic data for the growing season (1 July 2024–30 June 2025) were obtained from the Instituto Nacional de Investigación Agropecuaria (INIA), Las Brujas Experimental Station [42], located near the vineyard. Weather conditions are shown in Figure 1. During the grapevine cycle (1 September 2024 to 10 March 2025), total precipitation reached 421 mm, of which 75 mm occurred between budbreak and flowering and 138 mm from veraison to harvest, representing approximately 33% of the vintage rainfall. A total of 38 rainy days were recorded during the 191-day cycle, including 11 days during the ripening period. Mean air temperature over the cycle was 19.3 °C, with mean temperatures ranging from 13.4 to 19.6 °C between budbreak and flowering and from 20.5 to 22.9 °C between veraison and harvest. The highest monthly mean maximum temperature was recorded in February (30.5 °C), and daily maximum temperatures exceeded 30 °C on 38 days during the growing season.
The experiment was carried out in a commercial vineyard using Tannat grapes (Vitis vinifera L.), grafted onto 101-14 Mgt (Vitis riparia × Vitis rupestris), established in 1997. Vines were trained in a vertical trellis system under bilateral Guyot pruning. During the growing season, standard practices for fertilization, pest and disease control, and soil management were implemented. Canopy management interventions were restricted to those defined by the experimental treatments evaluated in this study, and all practices were conducted in accordance with the Sustainable Viticulture Program [43].

2.2. Vineyard Experimental Design

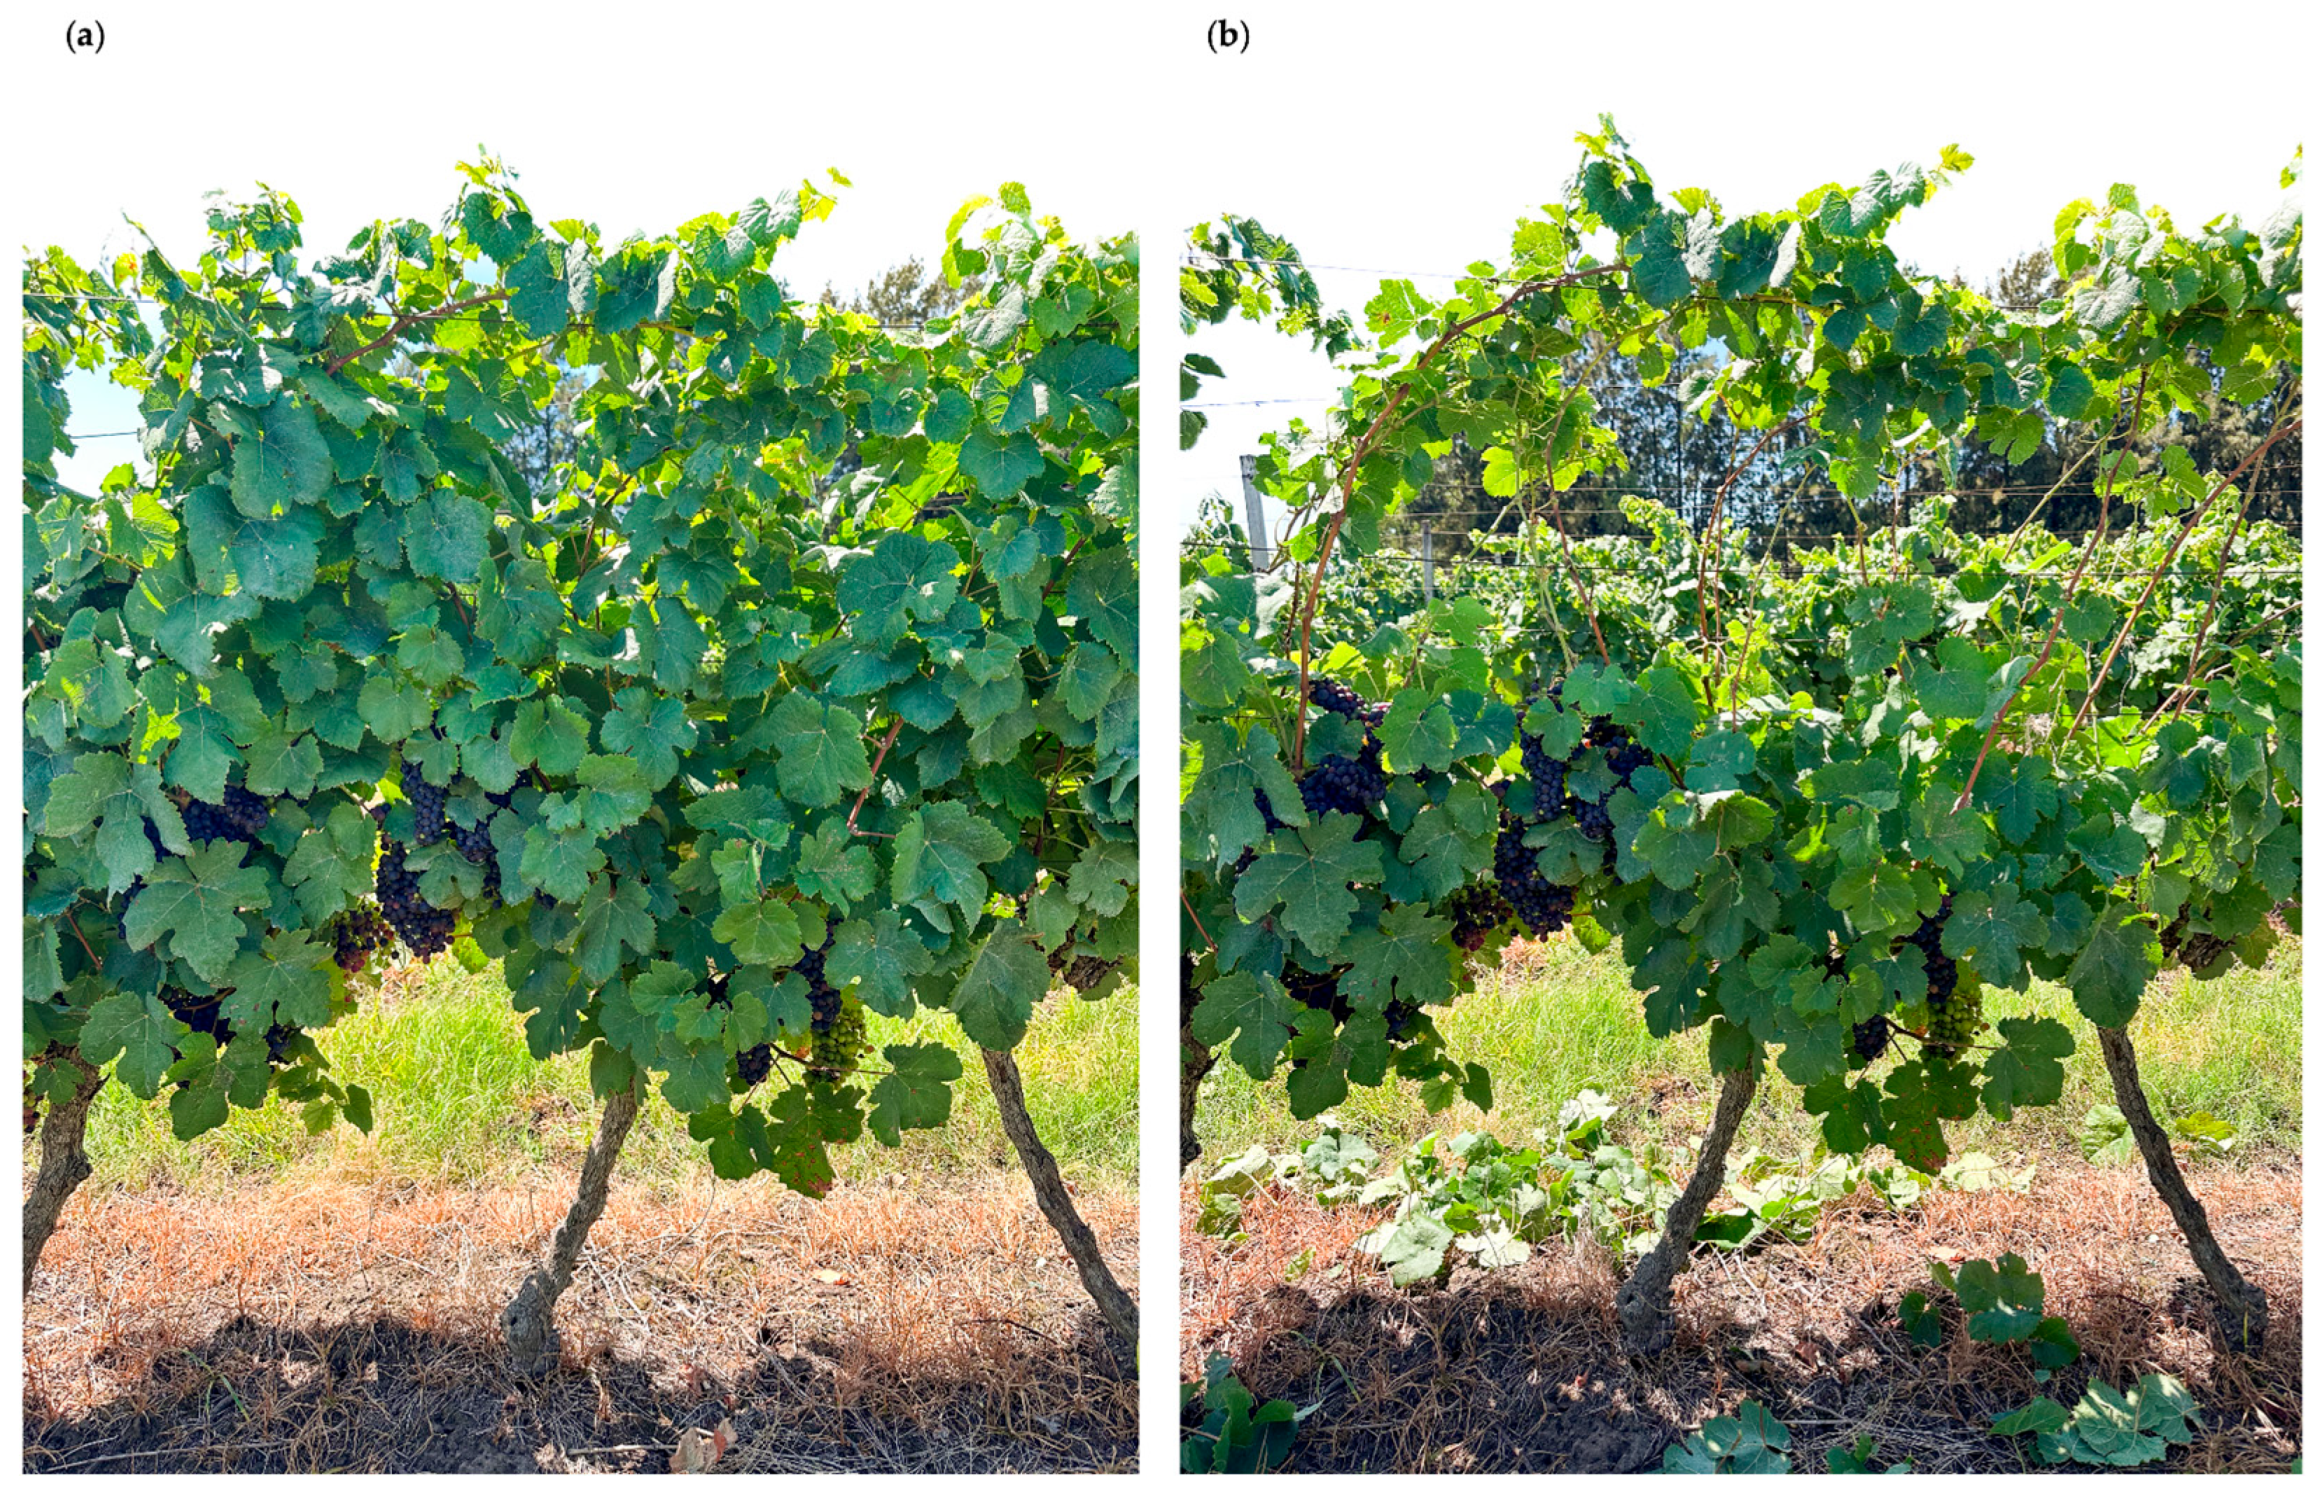
The Tannat grapevines included in this study were subjected to two treatments (Figure 2): pre-apical leaf removal (LR) consisted of the manual removal of primary and lateral leaves from the seven nodes located above the second cluster, at the onset of veraison corresponding to stage 36 of the modified Eichhorn–Lorenz (E-L) scale [44], while control treatment (CT) featured no leaf removal. Three replicates of each treatment were performed, with 10 contiguous plants per replicate, following a completely randomized design.

2.3. Winemaking Experimental Design

Experimental winemaking was conducted at the Experimental Winery of the Facultad de Agronomía of the Universidad de la República (Montevideo, Uruguay) using grapes from the vineyard where the viticultural trial was established. This design enabled the direct comparison of a source-limitation vineyard strategy and pre-fermentative substitution approaches under controlled microvinification conditions. This stage aimed to evaluate and compare the effects of a vineyard intervention (pre-apical leaf removal, LR; LR vs. CT) and an enological strategy based on the partial substitution of ripe grape must with must or wine obtained from unripe grapes. Because substitution treatments were performed exclusively with grapes from the CT, the study was designed as a non-factorial comparative experiment intended to contrast vineyard and winery strategies under comparable ripeness conditions rather than evaluate interactions between them. Consequently, the results do not allow assessment of whether the effects of must or wine substitution would differ when applied to grapes subjected to pre-apical leaf removal, and conclusions should therefore be restricted to the specific treatment combinations evaluated in this study.
At the onset of veraison (E-L 36), 60 kg of Tannat grapes were harvested to obtain must with a lower sugar concentration and higher acidity than that of technologically ripe fruit. Grapes were destemmed and crushed (Alfa 60 R crusher, Italcom, Piazzola Sul Brenta, Italy) and lightly pressed to obtain approximately 30 L of must. The must was sulphited with 100 mg/L of K2S2O5 (Kadifit, Geisenheim, Germany) and cold-settled at 5 °C for 24 h before racking. After clarification, the must was divided into two fractions: one fraction was stored at 4 °C until use (unripe must), and the second fraction was inoculated with 200 mg/L of active dry yeast (Lamothe Abeit—Z.A. Actipolis, Canéjan, France) and fermented at 17–19 °C until completion (17 days) to obtain unripe grape wine.
When grapes reached technological maturity, 100 kg per vineyard treatment (CT and LR) were hand-harvested and processed separately. After destemming and crushing, the must was sulphited with 100 mg/L K2S2O5. The LR grapes were distributed into three 10 L polyethylene vessels (three biological replicates). Grapes from the CT were distributed into nine vessels and randomly assigned to three groups to allow comparison between traditional vinification and substitution treatments.
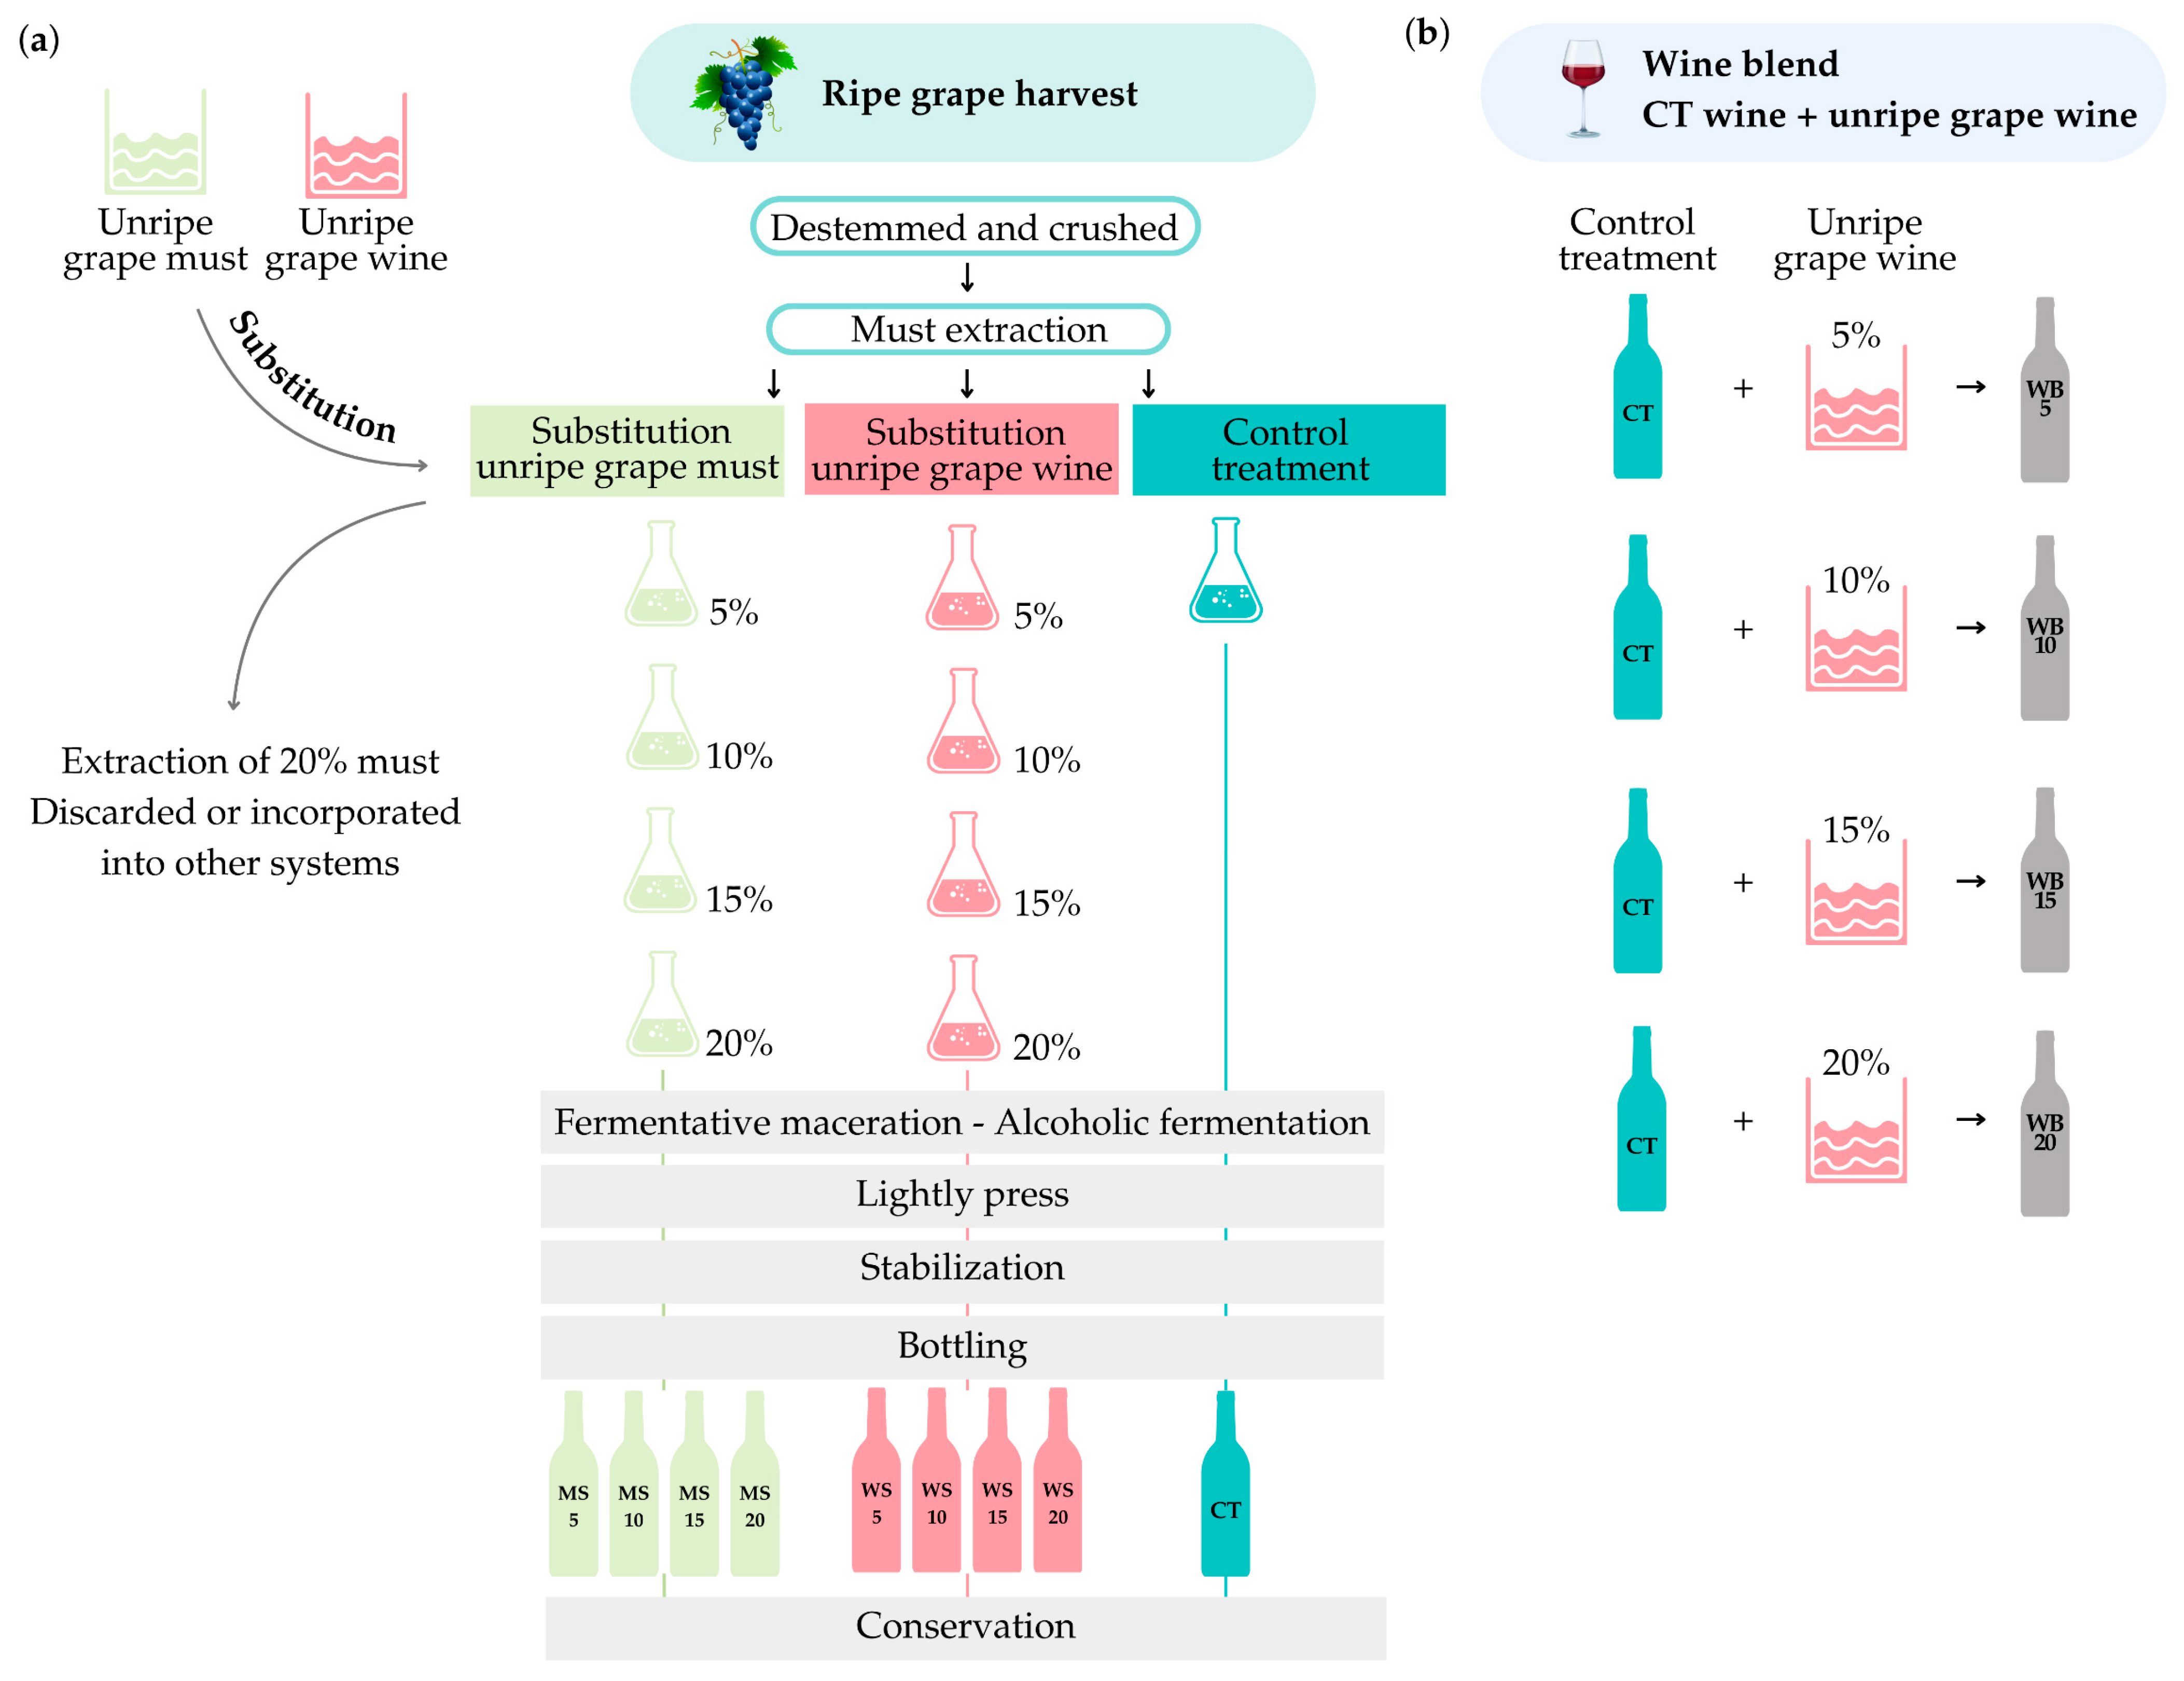
Four treatments were evaluated in triplicate (Figure 3): CT (control, traditional winemaking), LR (pre-apical leaf removal), MS (substitution of 20% of ripe grape must with unripe grape must), and WS (substitution of 20% of ripe grape must with unripe grape wine). The MS and WS treatments were performed using grapes from the CT condition. Each fermentation vessel was considered an independent biological replicate. For MS and WS, the substitution (v/v) was performed before yeast inoculation. All vessels were inoculated with 200 mg/L of active dry yeast (Oenoferm B52 NG, Erbslöh, Zaragoza, Spain) and fermented in contact with skins and seeds.
Fermentation proceeded at 18–25 °C with one manual punch-down per day. After 7 days of maceration, the free-run wine was drained, and the pomace was lightly pressed. Wines from each vessel were recombined and transferred to 5 L containers. Alcoholic fermentation was considered complete when must density was below 998 g/L for three consecutive days. Wines were stabilized with 100 mg/L K2S2O5 and stored in 3 L polyethylene vessels until bottling (375 mL bottles).

2.4. Complementary Small-Scale Experiment

To further evaluate the effect of substitution level on alcohol reduction and compositional parameters, a complementary small-scale experiment was conducted using 1 L fermentation vessels (Figure 4). This assay aimed to assess dose-dependent responses of pre-fermentative substitution and post-fermentative blending strategies.
Substitution levels of 0% (CT), 5%, 10%, 15%, and 20% were tested in duplicate for (i) replacement of ripe grape must with unripe grape must, (ii) replacement with unripe grape wine, and (iii) blending of control wine with unripe grape wine. After substitution, the winemaking protocol followed the same procedure as described above. The ripe grape must used in this complementary assay originated from a separate batch and therefore differed from the must used in the control treatment of pre-apical leaf removal and in the substitution of 20% ripe grape must with unripe grape must or wine. This complementary assay was considered exploratory and intended to identify response trends associated with substitution level.

2.5. Analytical Determinations

2.5.1. Assessment of Vegetative Growth and Yield

Measurements of canopy structure were performed in both treatments. In the LR treatment, measurements were taken both before and after leaf removal. These determinations were carried out using the potential exposed leaf area (SFEp) method proposed by Carbonneau (1995) [45]. Frontal images of the plants were taken with a white background sheet placed behind the canopy, and the height, width, and depth of the foliage were measured on 12 plants, corresponding to two plants per analytical replicate for each treatment.
Yield was evaluated at harvest (10 March 2025; E-L 39 [44]) from CT and LR when grapes reached technological maturity. The production of each vine was weighed individually using a calibrated digital scale and expressed as kg vine−1. Mean yield per treatment (kg grapes per vine and per hectare) was calculated from the 30 vines evaluated per treatment (three replicates of 10 vines each).

2.5.2. Physicochemical Analyses of Grapes, Must, and Wine

The basic composition of the grape at harvest and consequently the must after crushing was determined according to the official methods of the International Organization of Vine and Wine [46]. Analytical data for the substitution treatments were obtained after replacement with unripe grape must or wine. The sugar concentration was determined by refractometry, and the potential alcohol content was estimated based on the conversion that 18 g of sugar produce 1% ethanol, according to Boulton et al. (2002) [47].
After bottling, wines were analyzed for ethanol content (% v/v), pH, titratable acidity, malic acid, lactic acid, and volatile acidity using an infrared analyzer (OenoFoss™, Hillerød, Denmark) and the Foss Integrator software version 154 (Foss Analytical A/S, Hillerød, Denmark), calibrated according to the manufacturer’s instructions and validated with reference standards. Measurements were performed in triplicate.

2.5.3. Spectrophotometric and HPLC Analysis of the Phenolic Composition of Wines

Total phenols, total anthocyanins, and tannins were quantified using spectrophotometric methods described by Singleton and Rossi (1965) [48], Ribéreau-Gayon and Stonestreet (1965) [49], and Sarneckis et al. (2006) [50], respectively. Analyses were adapted for microplate format using a BMG SPECTROstar Nano UV–Vis microplate reader (Ortenberg, Germany), following Mercurio et al. (2007) [51]. Results were expressed as mg L−1 equivalents according to the respective standards.
Individual anthocyanins were separated, identified, and quantified by HPLC UltiMate™ 3000 (Thermo Fisher Scientific, Germering, Germany), equipped with DAD (UltiMate® DAD-3000 Detector; Thermo Fisher Scientific, Germering, Germany), a Quaternary pump (UltiMate® LPG-3400SD; Thermo Fisher Scientific, Germering, Germany), an Autosampler (UltiMate® WPS-3000(T) SD; Thermo Fisher Scientific, Germering, Germany), and a thermostatted column compartment (UltiMate® TCC-3000SD; Thermo Fisher Scientific, Germering, Germany), and coupled to a Thermo Scientific Dionex Chro-meleon 7 Chromatography Data System Version 7.3.1. (Thermo Fisher Scientific, Germering, Germany). Wine samples (10 µL) were injected onto a reversed-phase column (Ascentis Express C18, 2.1 × 150 mm, 2.7 µm; Sigma-Aldrich, Steinheim, Germany), and the column was thermostated at 40 °C. The mobile phases consisted of solvent A (water/formic acid/acetonitrile, 88.5:8.5:3 v/v) and solvent B (41.5:8.5:50.0 v/v). The flow rate was 0.16 mL min−1. Detection was carried out at 520 nm. Compounds were identified based on their retention times and UV–Vis spectra, by comparison with literature data reported by Blanco-Vega et al. (2011) [52]. Quantification was carried out using external calibration curves constructed with malvidin-3-O-glucoside as the standard.

2.5.4. Evaluation of Wine Color

Color measurements were performed directly on wine samples placed in a 1 mm path-length cuvette. The CIELAB coordinates, lightness (L*), chroma (C*ab), hue (hab), and red–greenness (a*), and yellow–blueness (b*) components were determined according to the method described by Ayala et al. (1997) [53], and data processing was performed with MSCV software (version 2001; Grupo de Color, Universidad de La Rioja–Universidad de Zaragoza, Zaragoza, Spain) [54].

2.5.5. Sensory Evaluation of Wines

A descriptive sensory evaluation was conducted four months after bottling (August 2025). The panel consisted of 10 assessors (five women and five men, aged 25–60 years), including oenologists and academic staff from the Facultad de Agronomía, Universidad de la República (Uruguay), all with previous experience in wine sensory evaluation and in the application of descriptive sensory methodologies through professional, academic, and research activities. All assessors voluntarily participated in the study.
Prior to evaluation, a 20 min alignment session was conducted to review the sensory descriptors, discuss evaluation criteria, and harmonize the use of the intensity scale among assessors. During this session, two reference wines were evaluated to facilitate panel alignment. No additional formal calibration sessions were performed.
The evaluation was conducted under controlled laboratory conditions in the Enology Laboratory of the Facultad de Agronomía. Assessors evaluated the wines individually under natural light conditions. Wines were presented under blind conditions and in randomized order. Samples (30 mL) were served to each assessor, and each wine was evaluated once. Sensory data were recorded manually using paper ballots.
Eight sensory attributes were assessed using a continuous 10-point intensity scale corresponding to perceived intensity. The evaluated attributes were color intensity, hue, aromatic intensity, aromatic quality, acidity, ethanol perception, astringency, and bitterness.

2.6. Data Processing and Statistical Analysis

The experimental unit for the main winemaking trial was the individual fermentation vessel, which was considered an independent biological replicate.
Results are expressed as mean ± standard deviation of three biological replicates, except for the small-scale substitution experiment, which was conducted in duplicate as a complementary screening assay.
For the pre-apical leaf removal and 20% must substitution treatments (CT, LR, MS, and WS), data were analyzed using one-way analysis of variance (ANOVA), considering treatment as the fixed factor and the fermentation vessel as the experimental unit.
For the small-scale substitution assay, statistical analyses were performed separately within each substitution strategy to evaluate the effect of substitution proportion (5–20%), using the non-substituted wine (0%) as a common reference control. Differences among strategies (must substitution, wine substitution, and blending) were evaluated independently at each substitution level using one-way ANOVA. Normality and homogeneity of variance assumptions were verified prior to analysis. When significant differences were detected, Tukey’s test was used to separate means at α = 0.05.
Sensory data were analyzed using a mixed-effects ANOVA model, considering treatment as a fixed effect and panelist as a random effect. Mean comparisons were performed using Tukey’s test at α = 0.05. Assessor scores were standardized prior to statistical analysis to reduce inter-individual variability.
Statistical analyses were performed using RStudio v4.3.2 (RStudio, 2 April 2024) [55].

3. Results

3.1. Vegetative Growth and Yield

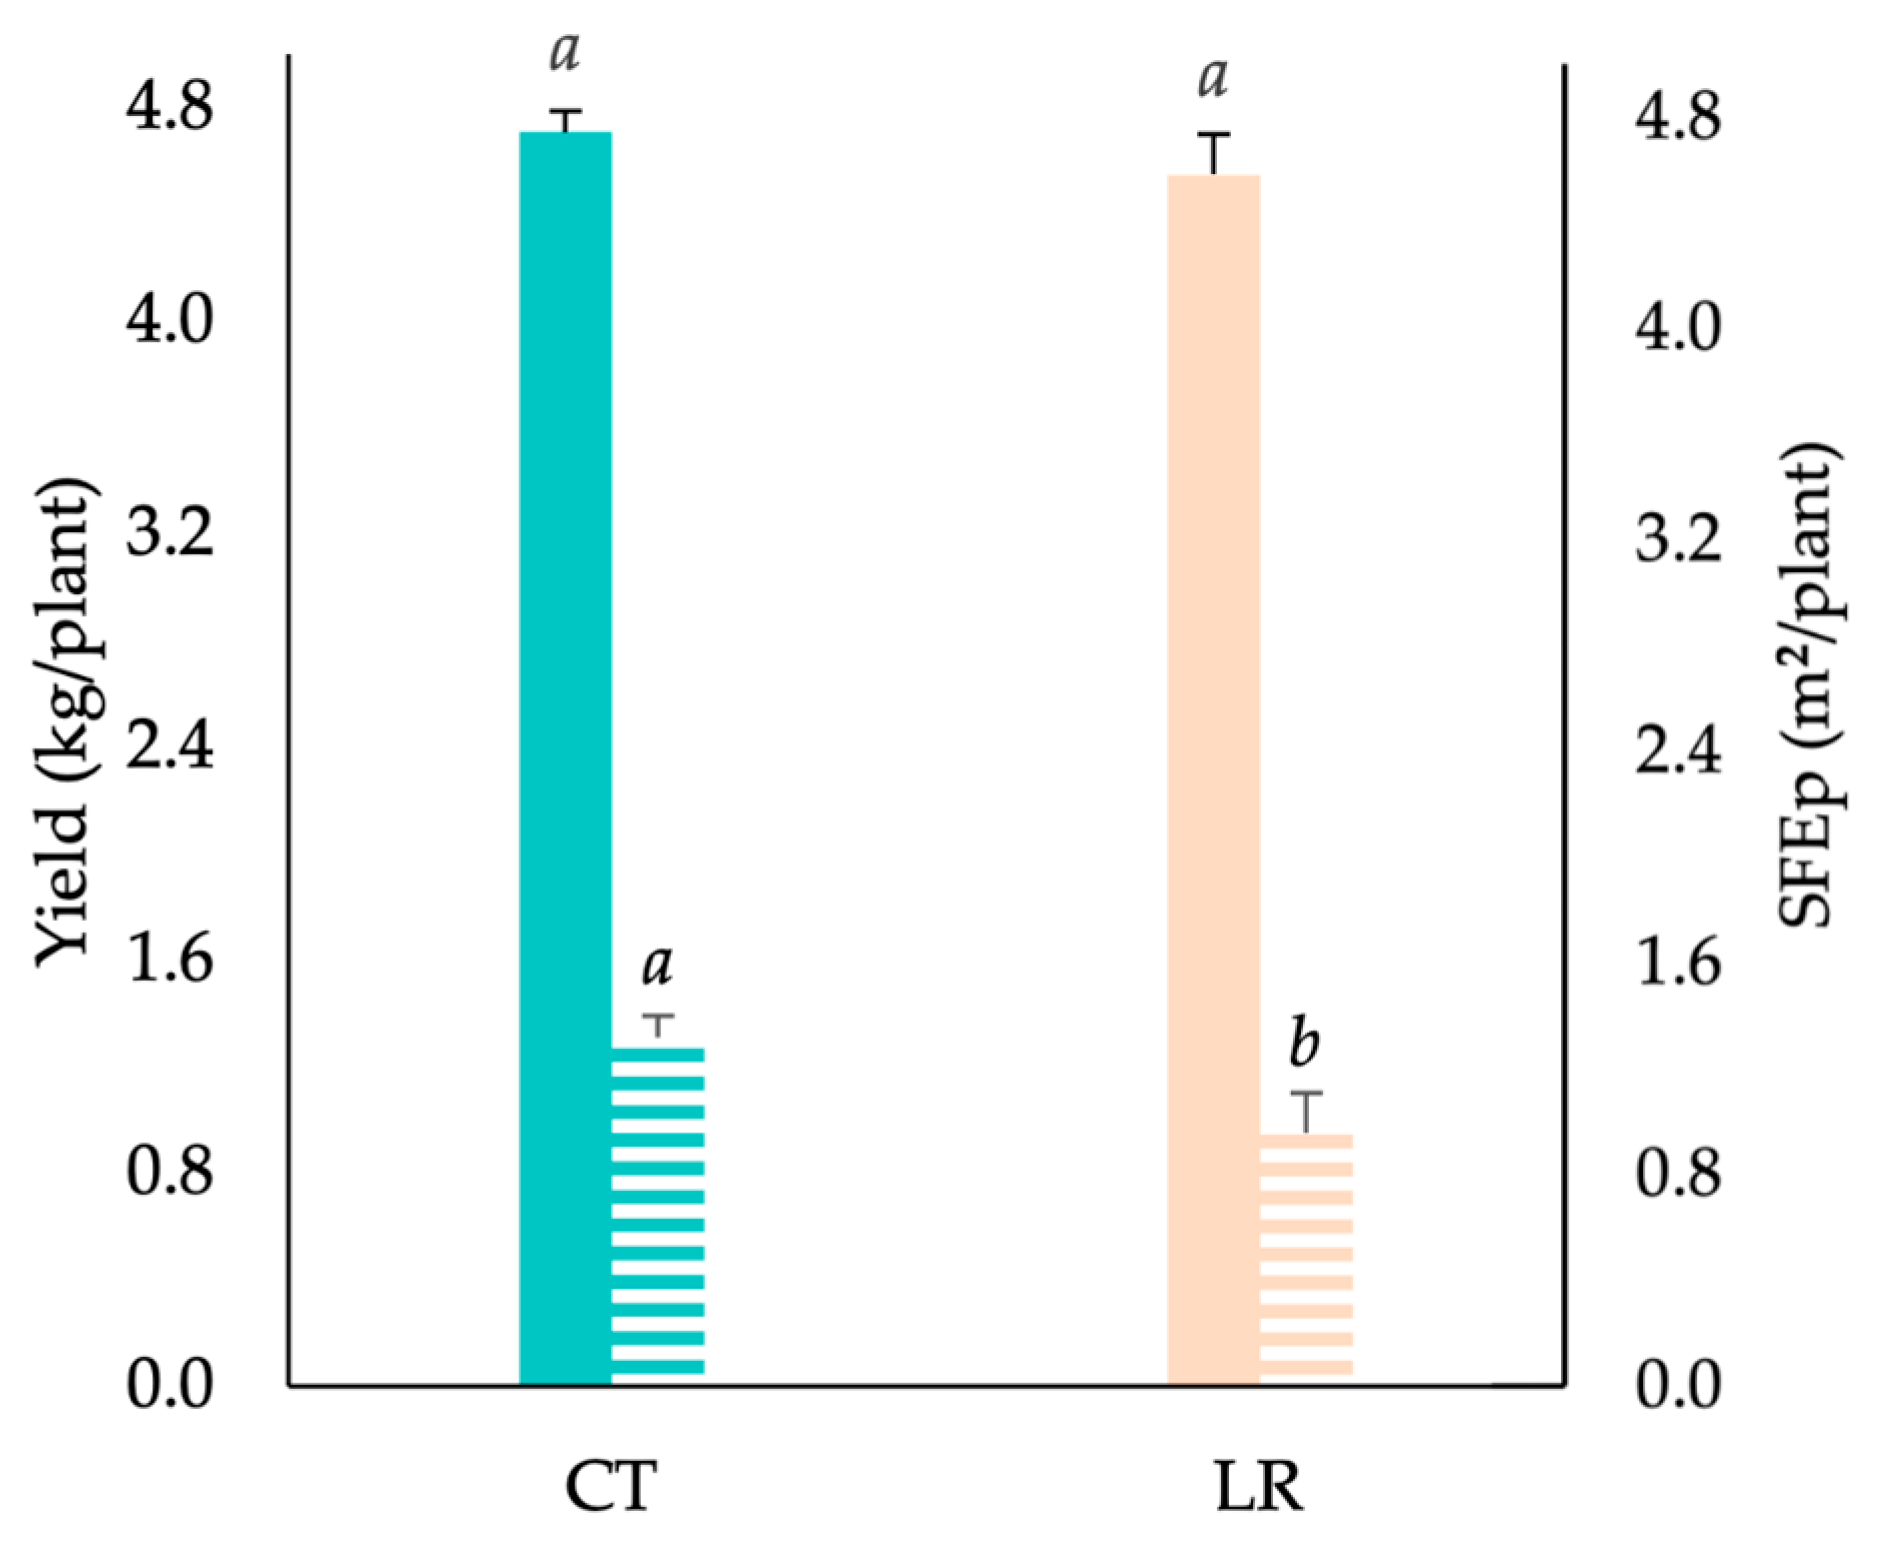
Differences in potential exposed leaf area (SFEp) were observed between treatments (Figure 5). CT vines exhibited an SFEp of 1.31 m2 plant−1 (4695 m2 ha−1) while LR vines showed a significantly lower value (0.95 m2 plant−1 or 3395 m2 ha−1), representing a 28% reduction compared to CT vines. Yield was not significantly affected by the treatment. The CT vines reached 4.71 kg plant−1, whereas LR vines yielded 4.55 kg plant−1, corresponding to 15,713 and 15,162 kg ha−1, respectively, corresponding to a difference of 3.5% between treatments.

3.2. Grape, Must, and Wine Composition

Table 1 shows the composition of unripe grapes, unripe grape must, and unripe grape wine used for substitution. Unripe grapes presented low sugar concentration (171 g/L) and pH (2.89), with high titratable acidity (8.51 g H2SO4/L). Moreover, unripe must showed low sugar content (166 g/L) and high acidity (pH 2.77; 7.65 g H2SO4/L) compared to unripe grape wine, which reached 10.4% (v/v) ethanol, with slightly higher pH (2.85) and titratable acidity (8.43 g H2SO4/L), while volatile acidity remained low. Phenolic composition showed minor changes between unripe grape must and wine, with lower total polyphenols and higher anthocyanins in the wine.
Table 2 shows the basic composition of grapes at technological maturity (CT and LR). At harvest, LR grapes had a lower sugar concentration than CT grapes (−4.2%), with no effect on pH or acidity. Anthocyanin content was lower in LR grapes, whereas tannins and total polyphenols were unaffected by the treatment. Unripe grapes (Table 1), compared with grapes harvested at technological maturity (CT and LR), showed markedly lower sugar concentration and pH, and higher titratable acidity.

3.3. Pre-Apical Leaf Removal and 20% Must Substitution of Ripe Grape Must with Unripe Grape Must or Wine

3.3.1. General Musts and Wine Composition

Table 3 shows the physicochemical composition of musts by treatment. Sugar concentration decreased from CT (236 g/L) to LR (226 g/L), MS (210 g/L), and WS must (150 g/L), with a similar trend for potential alcohol. In addition, substitution treatment must (MS and WS) showed lower pH (3.20–3.17) and higher titratable acidity (5.36–5.62 g H2SO4/L) than CT and LR, which did not differ significantly.
Table 4 shows the physicochemical composition of wines at bottling. Ethanol content was reduced in MS and WS to 12.9% (v/v) (−6% with respect to CT wines, 13.7%), while LR showed a smaller reduction (13.3% v/v; −3% with respect to CT wines).
Wine pH followed the same trend as in musts, with lower values in MS and WS (3.63–3.61, respectively) compared to CT and LR (3.84–3.82, respectively). Titratable acidity was slightly higher in MS (4.45 g H2SO4/L), while the other treatments showed similar values. Moreover, no significant differences were observed in malic acid. Lactic acid was lower in substitution wines, particularly in WS, where it was not detected. Volatile acidity remained low across treatments (0.18–0.32 g acetic acid/L), with the lowest values in WS and the highest in LR.

3.3.2. Phenolic Composition of Wines

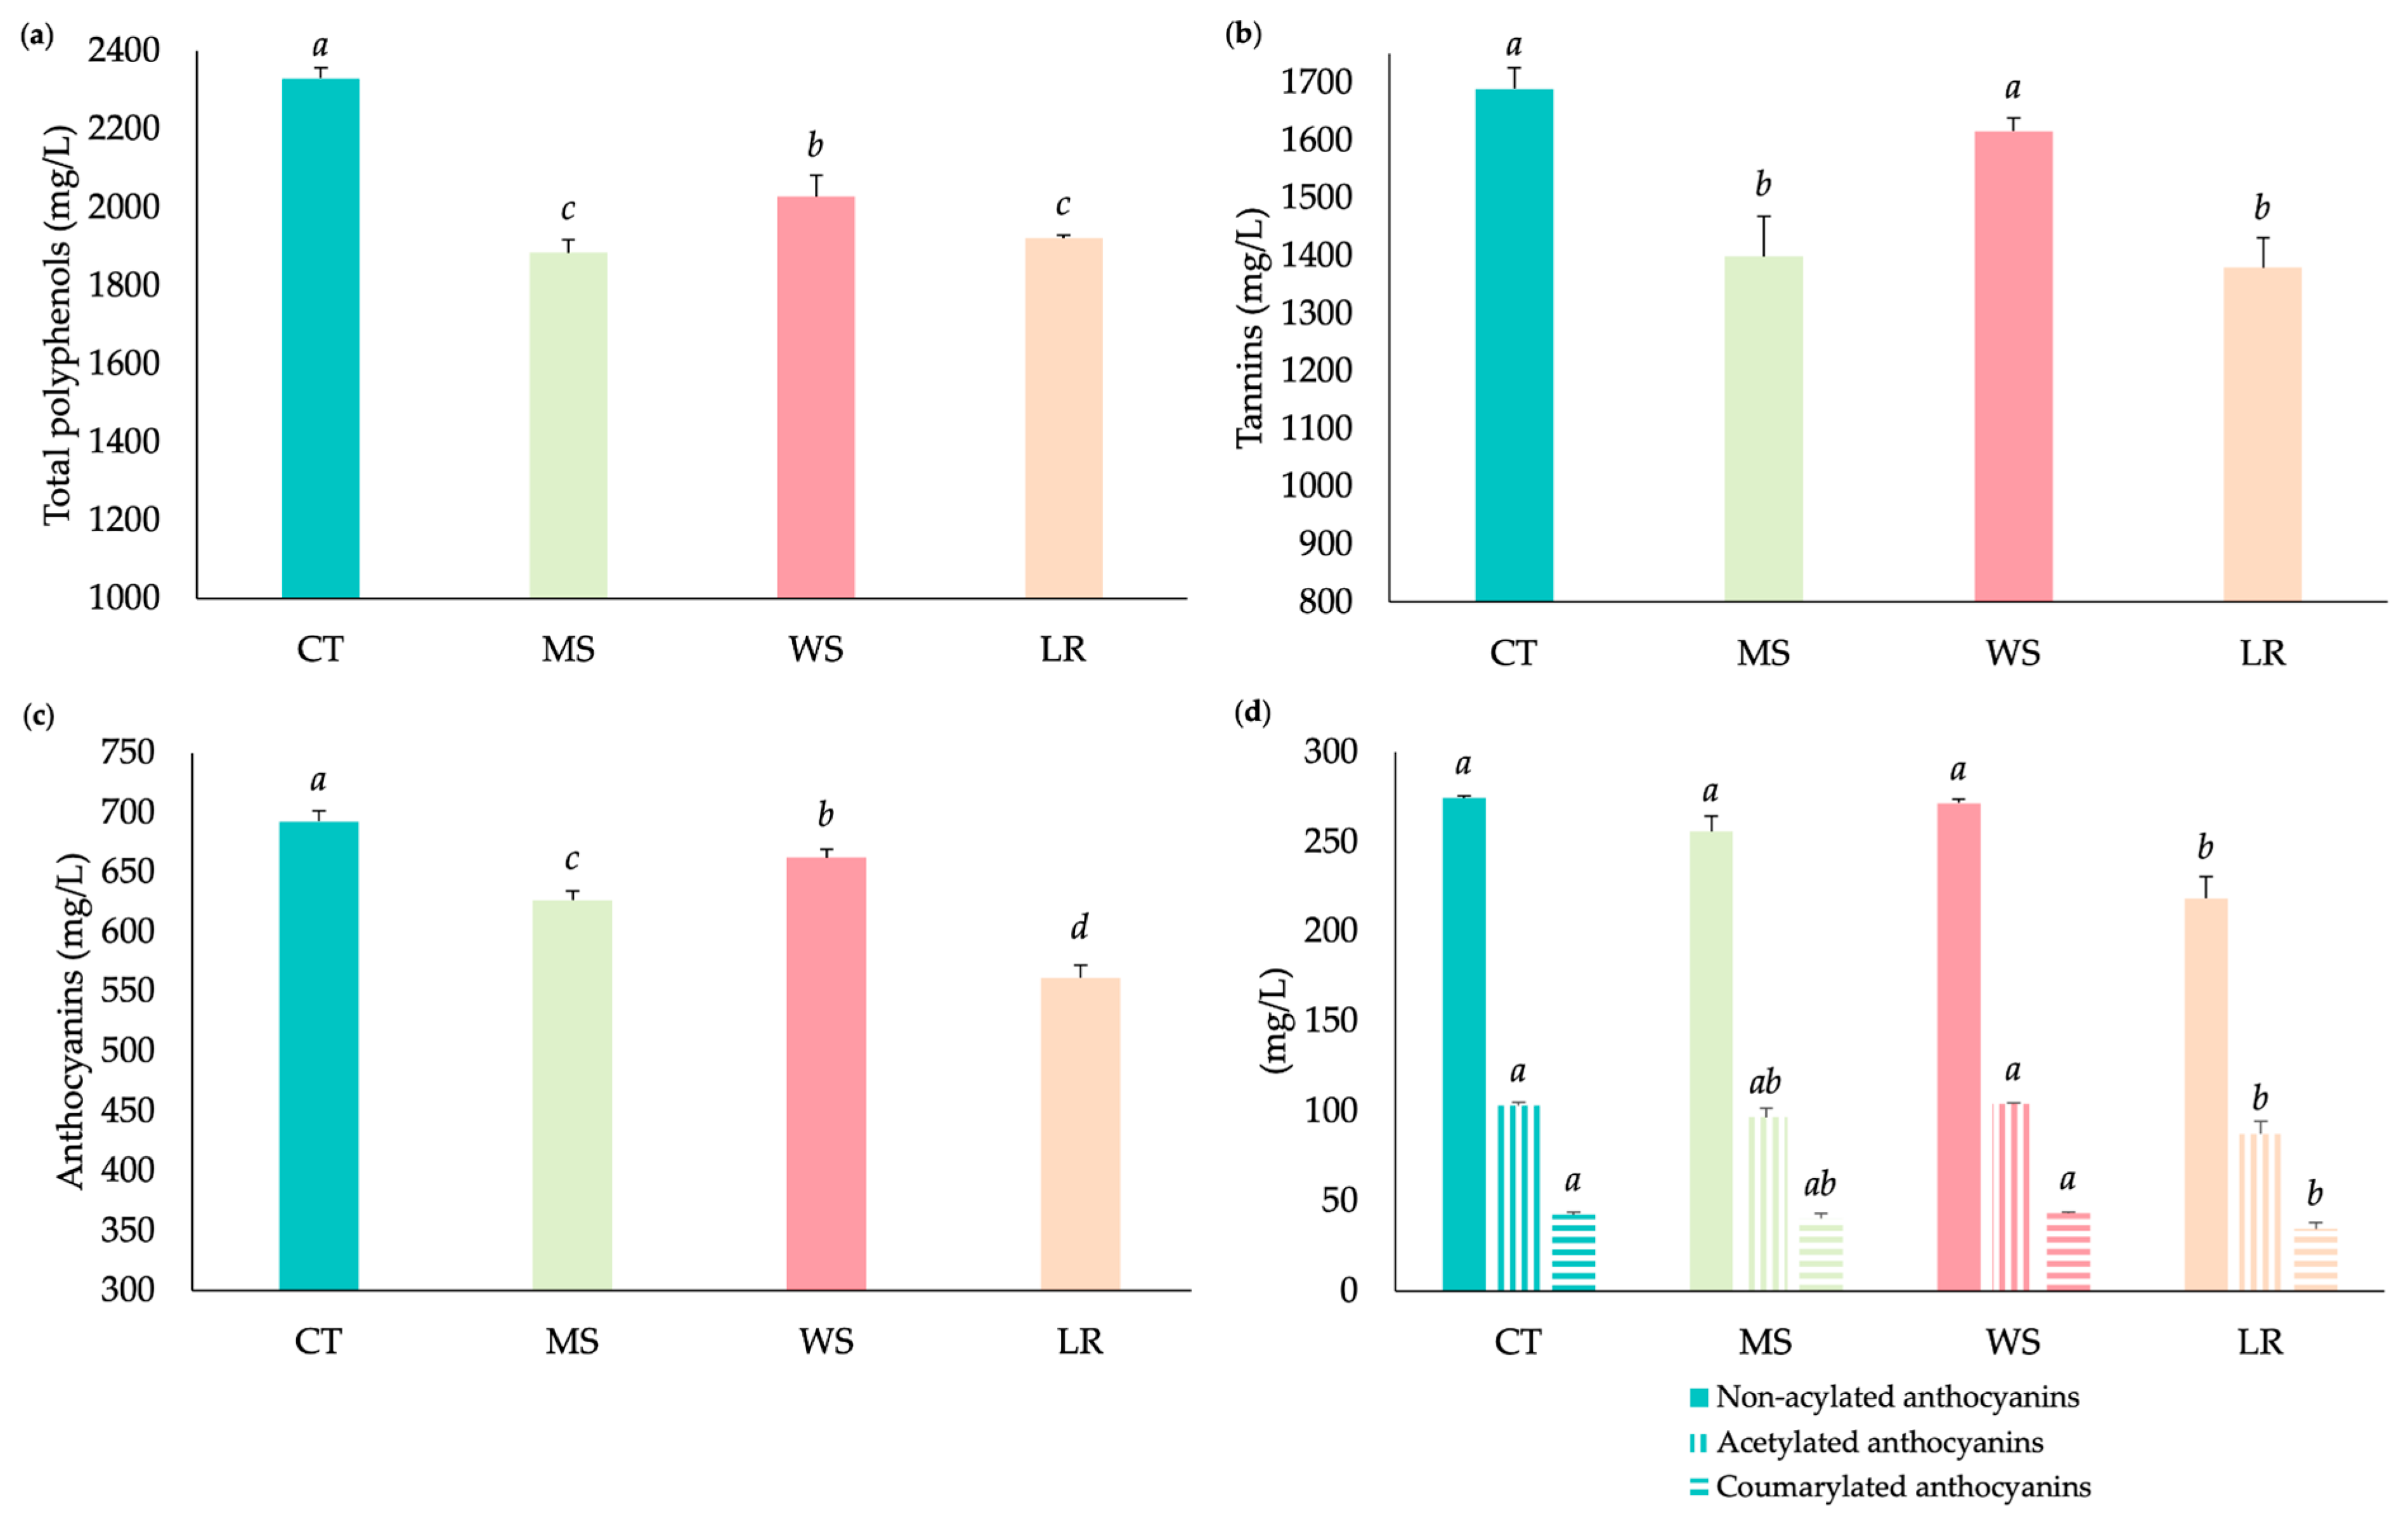
The phenolic composition of wines at bottling is shown in Figure 6. CT wines had the highest total polyphenol concentration, exceeding those of all other treatments by more than 10%. Among the alcohol-reduction strategies, WS showed the highest value (2027 mg/L), followed by LR (1921 mg/L) and MS (1885 mg/L).
A similar trend was observed for tannins. CT and WS wines showed the highest concentrations, with no significant differences between them. In contrast, MS and LR showed significantly lower concentrations, with reductions exceeding 15% relative to CT.
Anthocyanin concentration also differed significantly among treatments, decreasing from CT (692 mg/L) to WS (662 mg/L), MS (626 mg/L), and LR (561 mg/L). The largest reduction was observed in LR (−19%), while WS and MS showed more moderate decreases (−4.3% and −9.5%, respectively). Moreover, CT, WS, and MS showed similar concentrations of non-acylated, acetylated, and coumarylated anthocyanins, whereas LR consistently exhibited the lowest values, approximately 20% lower than CT.

3.3.3. Color Wine Analysis

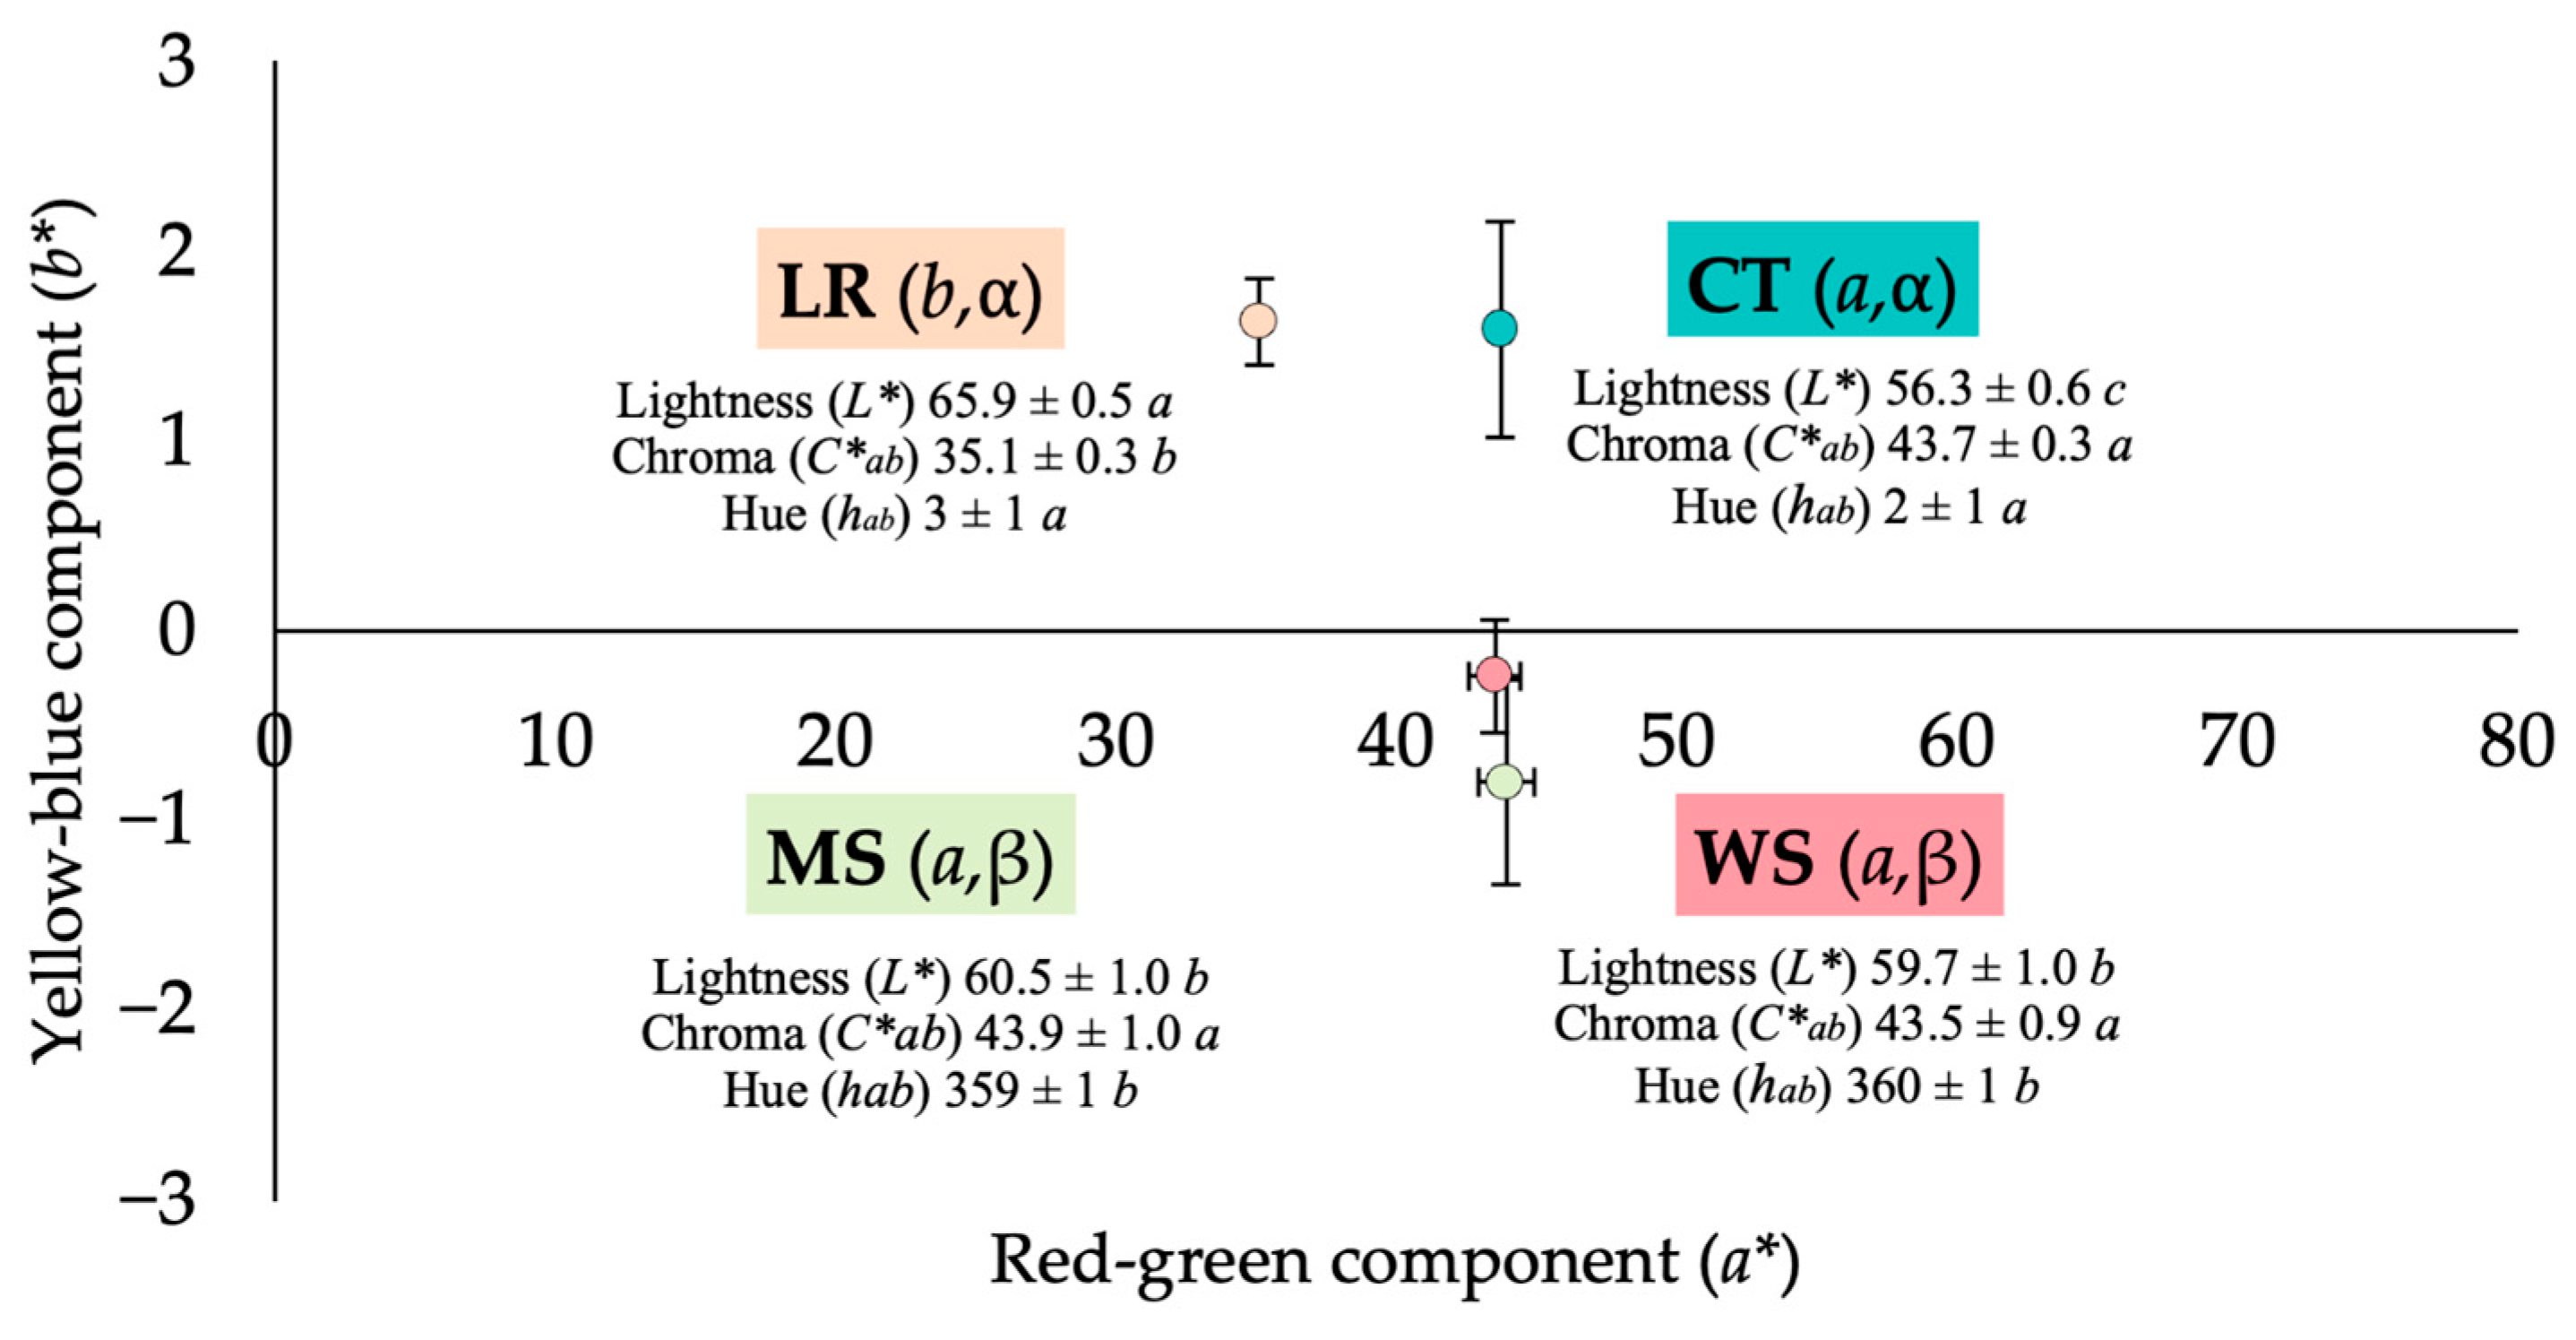
The CIELAB color parameters of wines at bottling are presented in Figure 7. LR wines showed the highest lightness, with L* values approximately 17% higher than CT, whereas CT, MS, and WS showed similar and lower values, indicating darker color expression. Moreover, chroma (C*ab) was similar across CT, MS, and WS (43.5–43.9), whereas LR showed a significantly lower value (35.1), corresponding to about a 20% reduction relative to CT and indicating lower color saturation. Hue angle (hab), which describes the tonal shift in wine color, further differentiated the treatments. CT and LR showed values between 2° and 3°, corresponding to slightly more yellow–red tones, whereas MS and WS showed values close to 360°, which, on the circular CIELAB hue scale, correspond to red–violet hues, commonly associated with greater color stability in red wines.
The a* coordinate was similar in CT, MS, and WS (43.5–43.9), but significantly lower in LR (35.1), reflecting reduced red intensity. In contrast, the b* coordinate was higher in CT and LR and lower in MS and WS, indicating a shift toward bluer–violet tones in substitution treatments.

3.3.4. Sensorial Wine Analysis

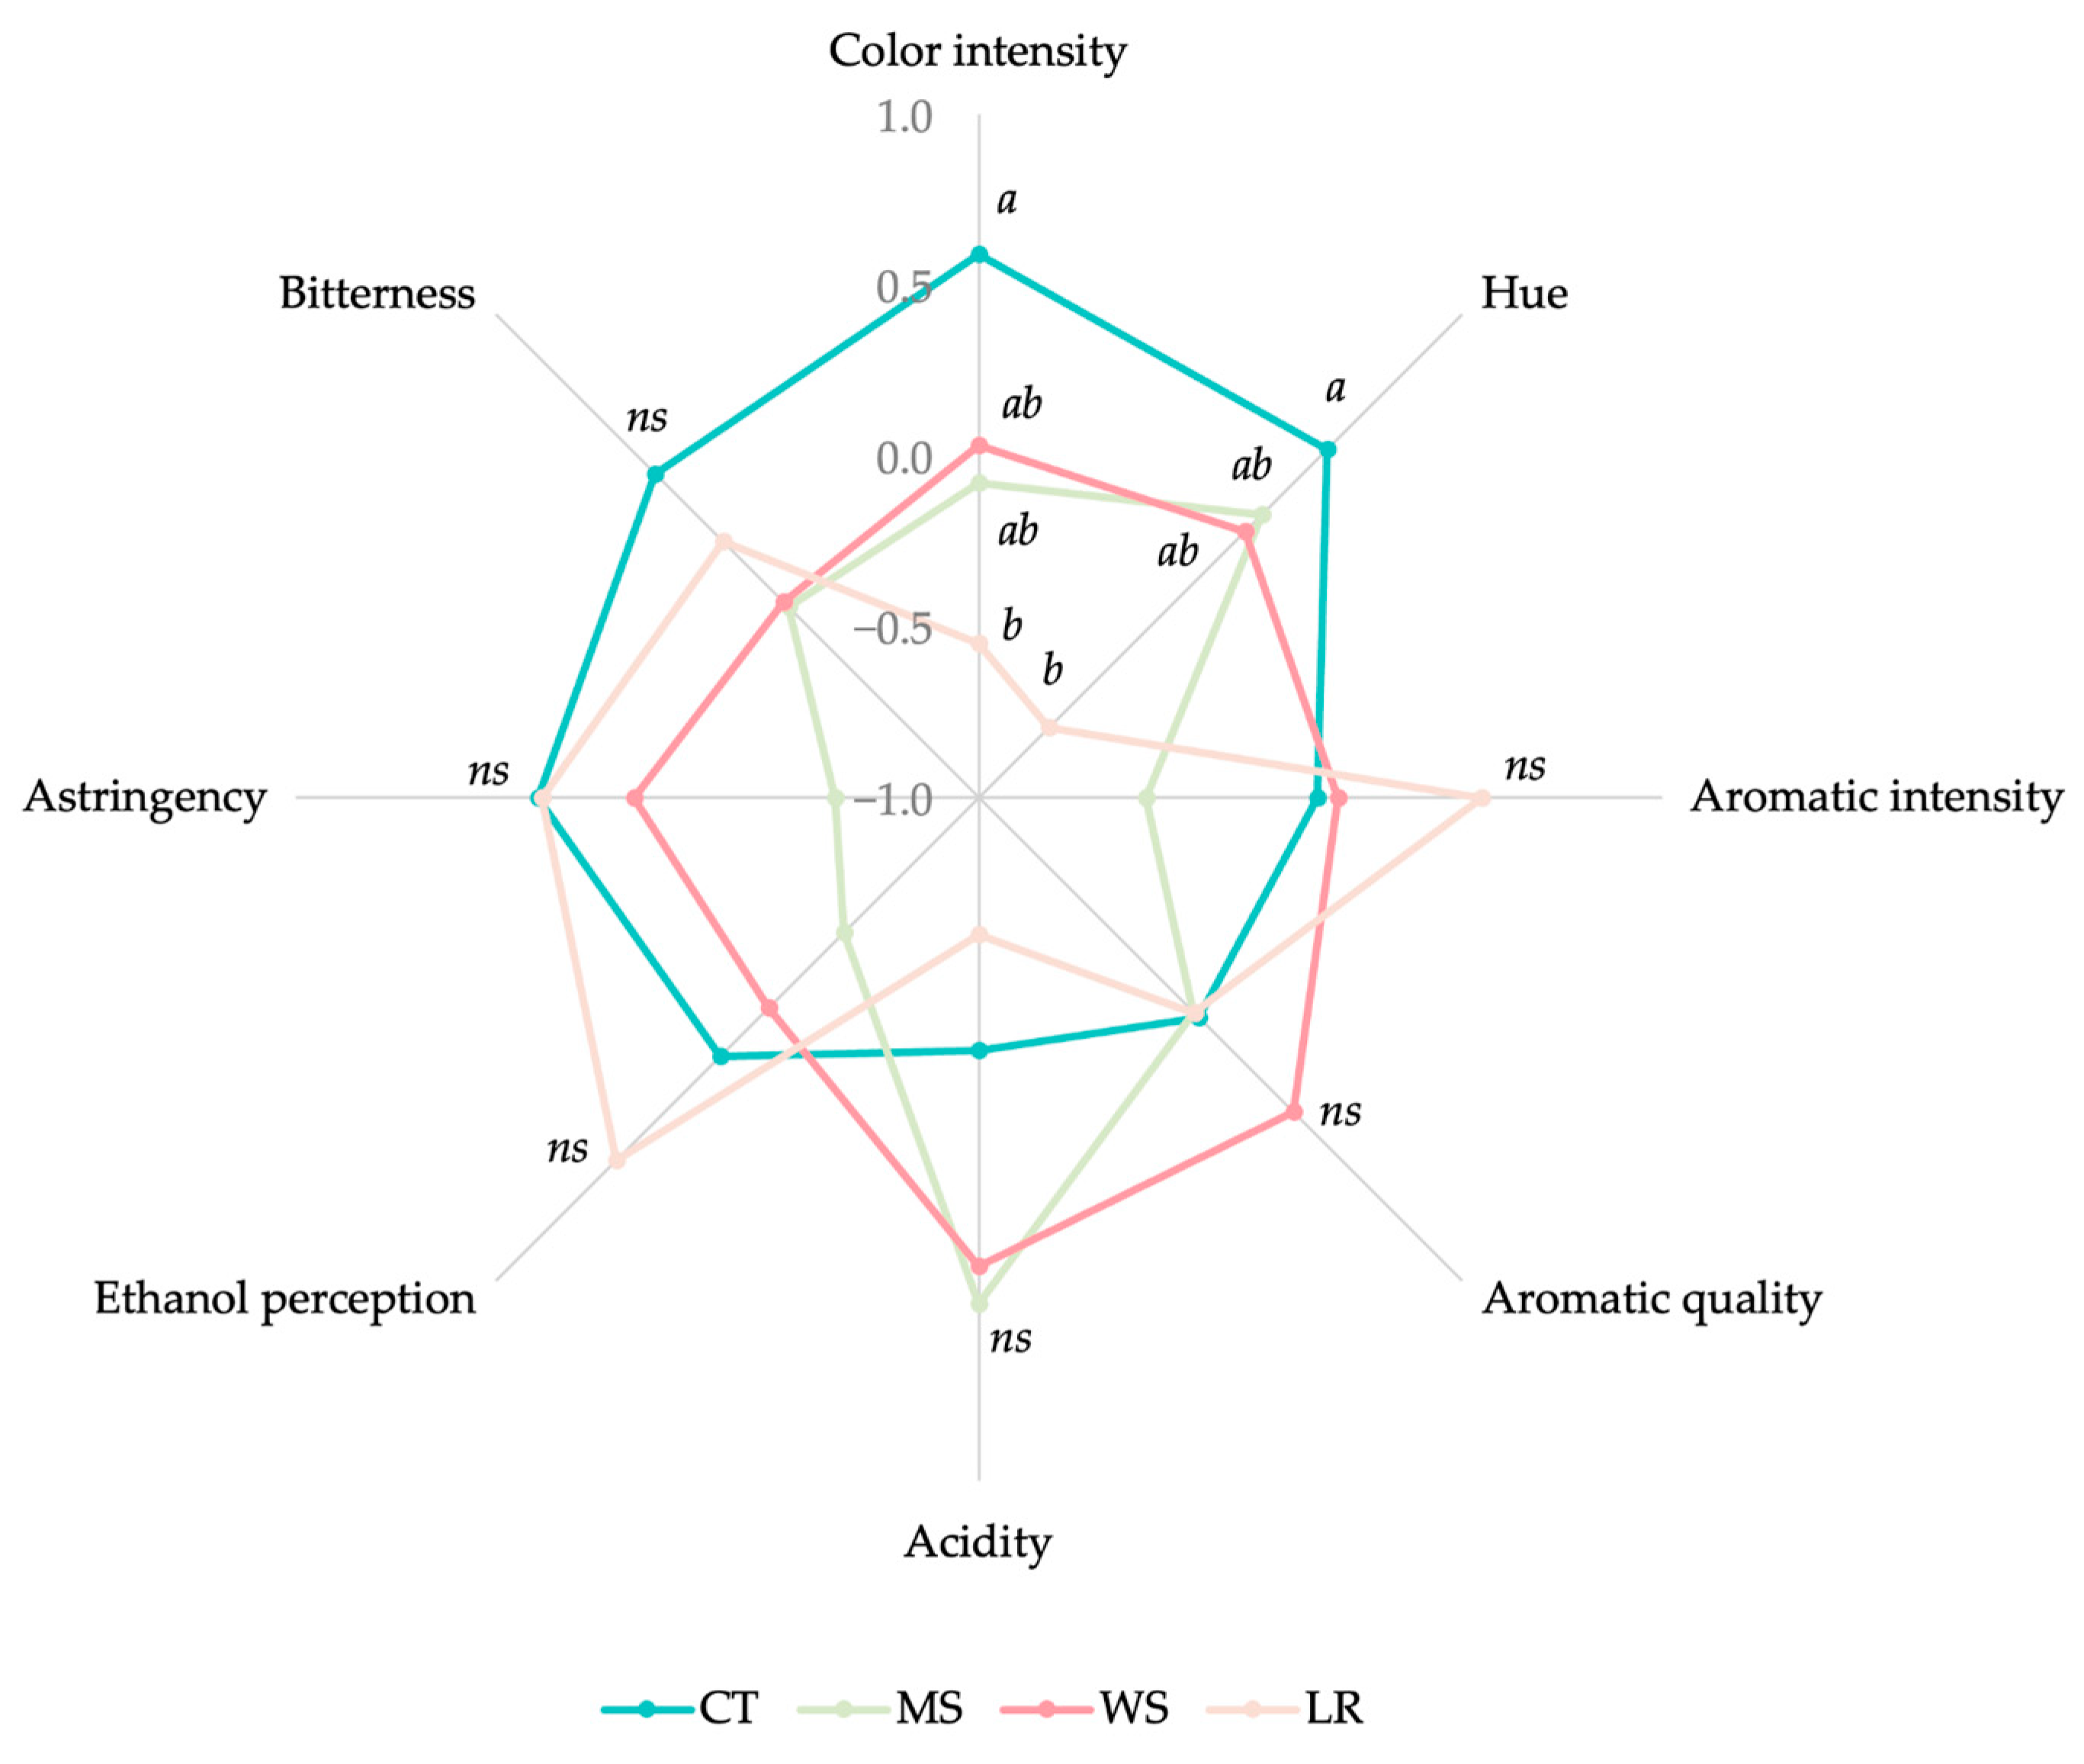
The results of the sensory evaluation are presented in Figure 8. Significant differences were observed in visual attributes, particularly color intensity and hue. LR wines were consistently perceived to have the lowest color intensity and the least desirable hue, consistent with analytical measurements, whereas MS and WS did not differ from CT. No significant differences were observed among treatments for aroma descriptors. Similarly, taste attributes (acidity, ethanol perception, astringency, and bitterness) did not differ significantly among treatments, suggesting that the trained panel did not detect major sensory differences under the conditions of this descriptive evaluation. These results should be interpreted with caution, as the sensory evaluation was conducted by a panel of 10 trained assessors, and each wine was evaluated once.

3.4. Complementary Small-Scale Experiment: Evaluation of Substitution Level on Wine Composition

3.4.1. General Composition of Wines

Table 5 presents the physicochemical composition of wines from the small-scale experiment. Ethanol concentration decreased progressively as the substitution level increased across all winemaking techniques. Significant reductions were observed from 10% onward, reaching −5.1% in MS, −5.9% in WS, and −3.5% in WB at 20%. No significant differences were observed between 15% and 20%, indicating a plateau in ethanol reduction beyond 15%.
Increasing substitution also induced progressive acidification. Wine pH decreased while titratable acidity increased, with the strongest effects observed in WB wines (pH −7.0%; acidity +16.1% at 20%), whereas MS and WS showed more moderate but still significant changes.
Organic acid evolution followed a dose-dependent pattern. Malic acid increased with substitution level, particularly in WS (up to +14.8%) and WB (+11.7%), while lactic acid decreased, most markedly in WB (−65.2% at 15–20%). Despite these changes, absolute lactic acid concentrations remained low (0.33–0.95 g/L).
Volatile acidity remained low across all treatments (0.16–0.28 g acetic acid/L). In MS and WS wines, it decreased with increasing substitution level (up to −40.7% and −25.9%, respectively), whereas WB showed no consistent trend.

3.4.2. Phenolic Composition of Wines from Small-Scale Experiment

The phenolic composition of wines from the small-scale experiment is shown in Table 6. Different responses to substitution level were observed among winemaking treatments, with contrasting patterns between pre-fermentative (MS, WS) and post-fermentative (WB) approaches.
Control wines (0% substitution) showed the highest values of all the parameters. In MS and WS wines, total polyphenols decreased with increasing substitution level, with a more pronounced effect from 10% onwards, reaching near-control values at 15–20% substitution. Concentrations increased from 2058 to 2485 mg/L (MS) and from 2252 to 2543 mg/L (WS) between 5 and 20% of substitution. WS consistently showed higher values than MS across most substitution levels. In contrast, WB wines exhibited a steady decline, reaching an 18% reduction at 20% substitution relative to 0% of substitution.
A similar pattern was observed for tannins. MS and WS wines showed partial recovery at intermediate levels (10–20%), with values stabilizing at higher substitution rates, particularly in WS. WB wines showed a progressive decrease across all levels, reaching reductions of 13–14% at 20% substitution, indicating a dilution effect associated with post-fermentative blending.
Anthocyanins decreased in MS and WS wines across substitution levels, with a greater impact at 5–10% substitution. In both treatments, at a 15–20% substitution level, the anthocyanin concentration was closer to 0% of the substitution level. WB wines showed a marked decline, reaching a 22% reduction at 20%, with the strongest losses occurring from 10% substitution onwards. HPLC data confirmed these trends at the molecular level. In MS and WS wines, non-acylated anthocyanins at 15–20% substitution (373–384 mg/L) were statistically comparable to 0% of substitution level (378 mg/L). Acetylated and coumarylated anthocyanins also remained relatively stable, with deviations generally below 10% and no clear systematic losses. In contrast, WB wines showed consistent decreases across all fractions, with reductions of 20–24% at 20% substitution, confirming a global loss of anthocyanin stability under blending conditions.

3.4.3. Color Wine Analysis from Small-Scale Experiment

The CIELAB color parameters of wines obtained in the small-scale experiment are presented in Table 7. Color responses varied according to the winemaking treatment and level, particularly for lightness (L*), chroma (C*ab), and hue angle (hab).
Lightness (L*) increased in WB wines as the substitution level increased, whereas WS wines showed greater stability. In MS wines, L* increased from 25.9 in 0% of substitution to 30.7–33.4 at 5–20% substitution (19–29% increase). WS wines showed no significant differences among substitution levels despite small numerical fluctuations. WB wines exhibited the highest overall L* values, increasing progressively from 25.9 at 0% substitution to 27.7 at 20% substitution, although the relative changes remained limited (<7%).
Chroma (C*ab) remained relatively stable in WB wines across substitution levels. In MS wines, C*ab increased at higher substitution rates (15–20%), reaching 59.1–59.5 compared with 53.8 at 0% substitution (≈10% increase), indicating enhanced color saturation with higher must substitution. WS wines showed intermediate behavior, with minor non-significant variations.
Hue angle (hab) showed a more variable response. In MS and WS wines, low substitution levels (5–10%) tended to decrease hab relative to 0% of substitution, whereas higher levels (15–20%) resulted in marked increases. At 20% substitution, hab reached 9.8 in MS and 10.7 in WS, corresponding to increases of 34% and 45%, respectively. In contrast, WB wines showed consistently low and stable values (2.1–3.7), with only minor variation across substitution levels.

3.4.4. Sensorial Wine Analysis from Small-Scale Experiment

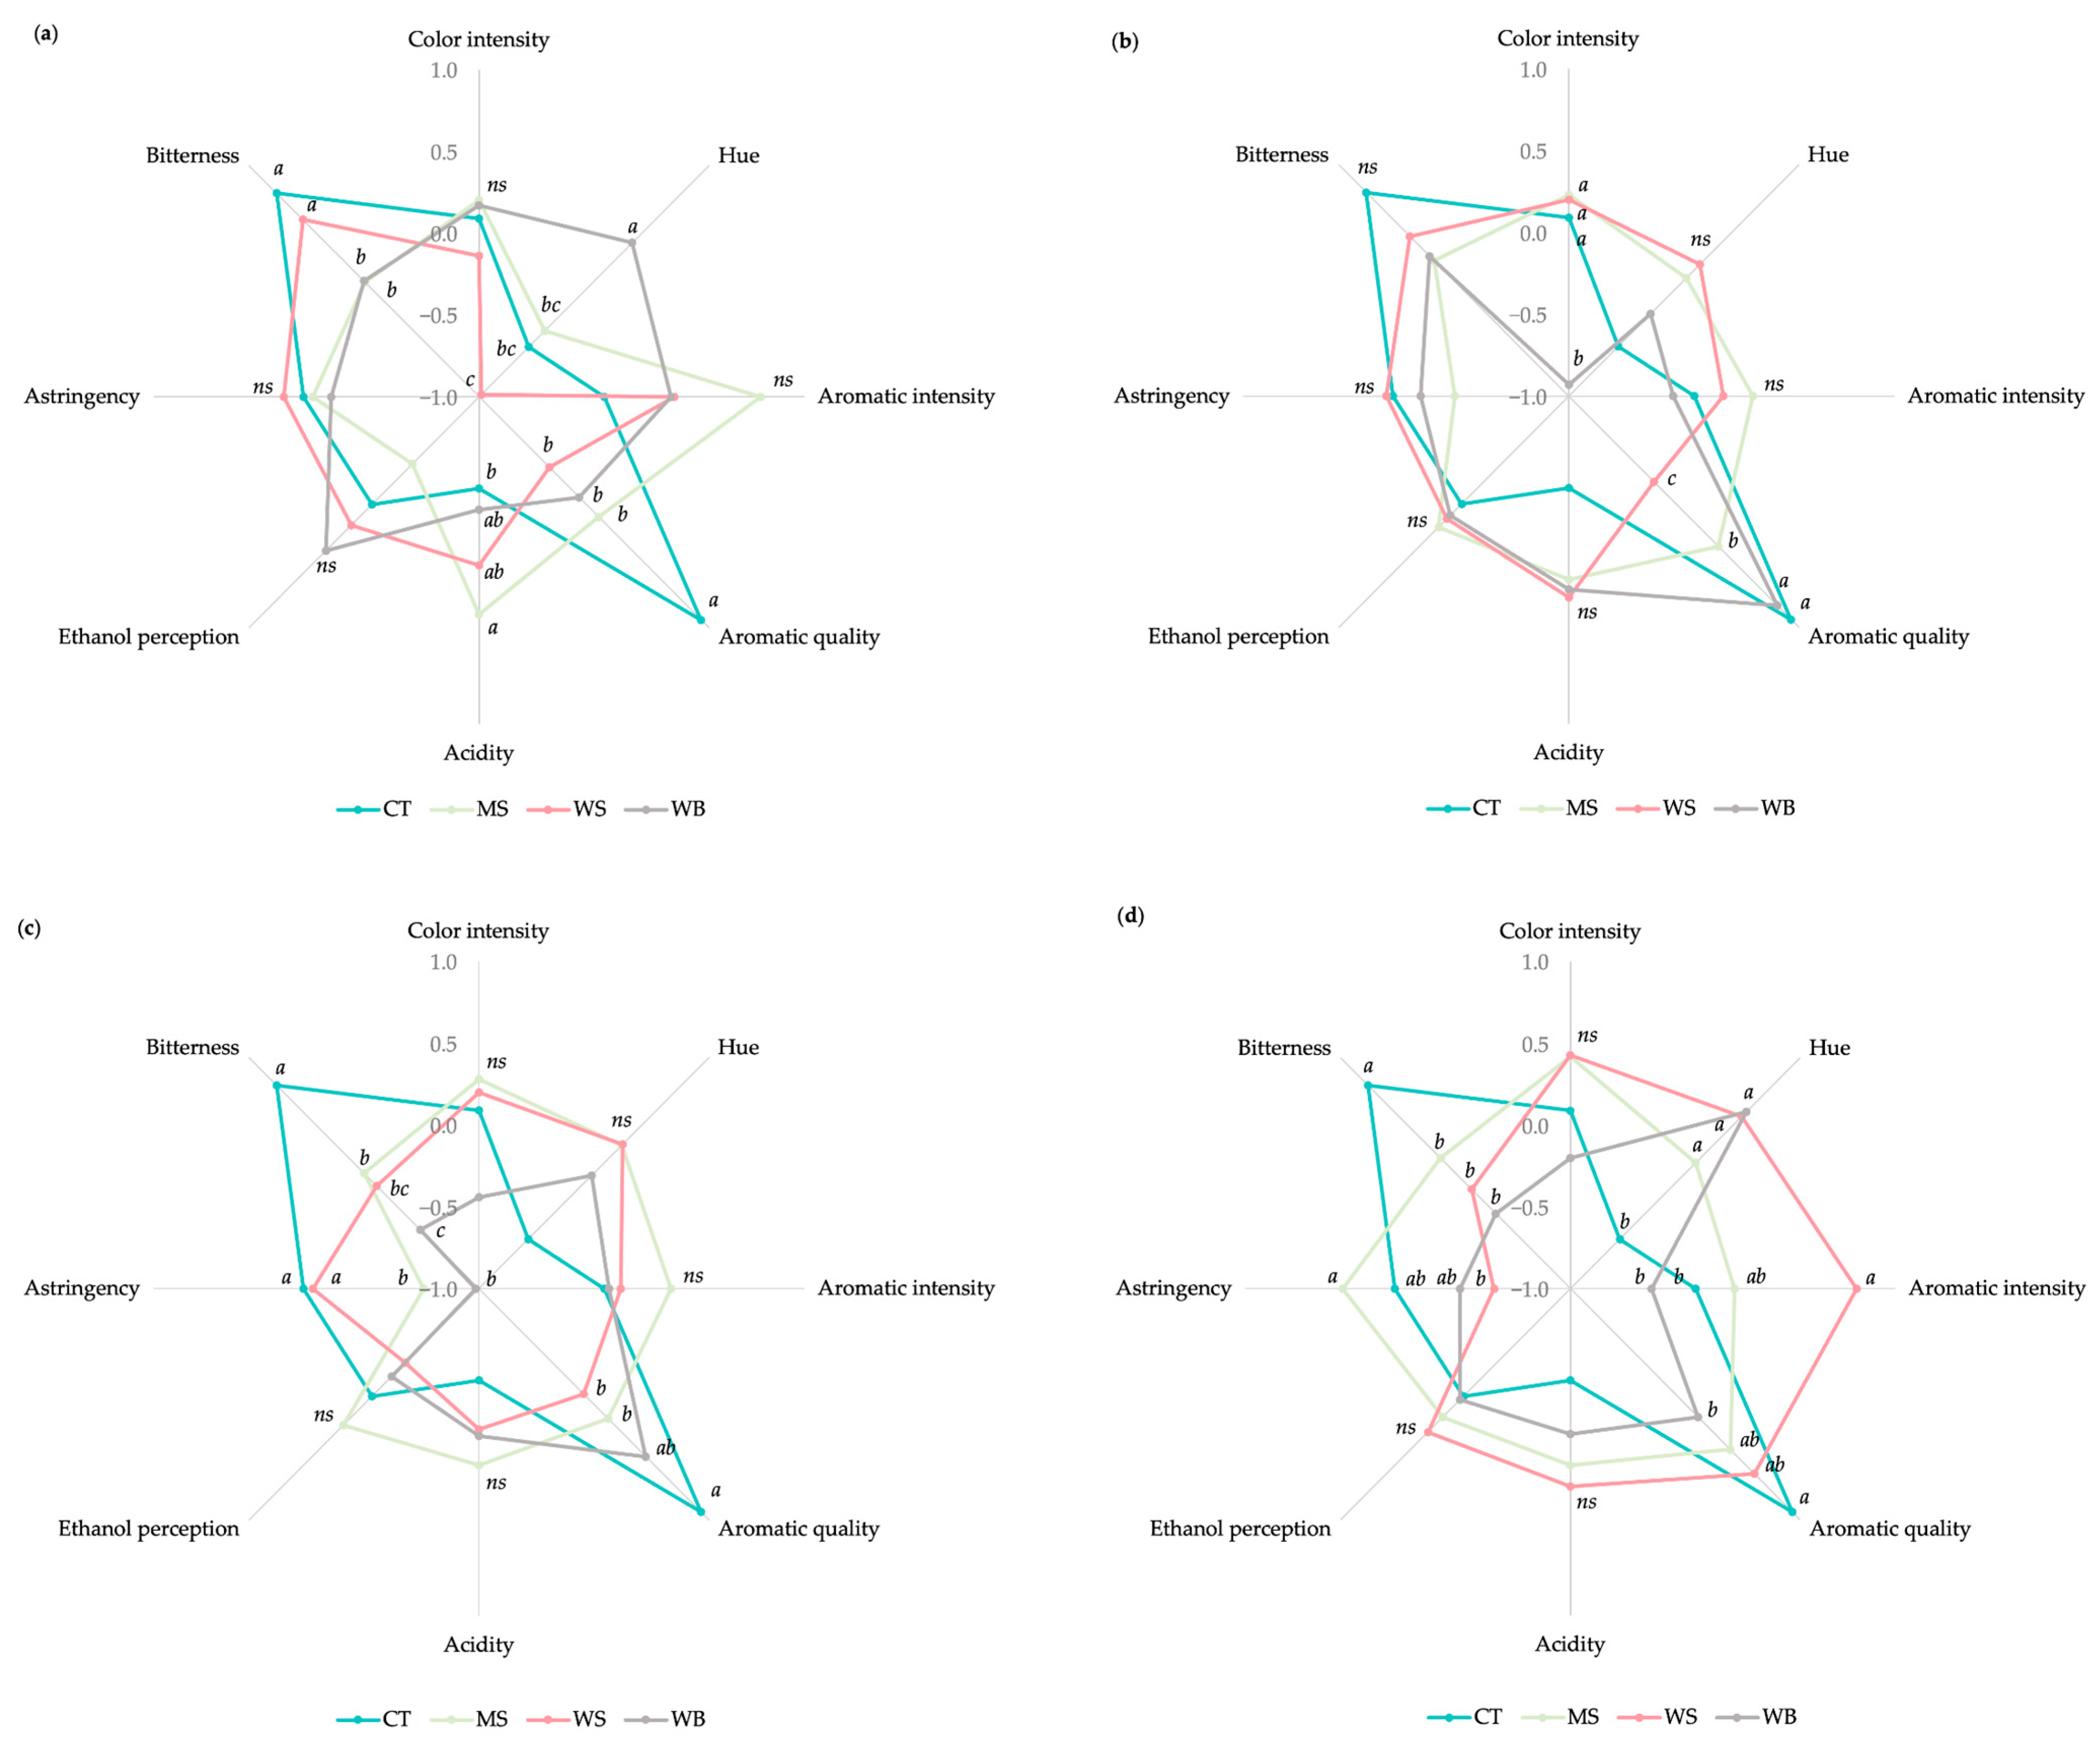
Figure 9 presents the sensory analysis of wines from the small-scale experiment at each substitution level. CT represents the wines without substitution (0%), and it was characterized by the highest aromatic quality and bitterness.
At 5% substitution (Figure 9a), MS wines were characterized by higher aromatic intensity and acidity compared with CT, whereas WS showed lower perceived redness and moderate bitterness similar to CT wines. In contrast, WB wines showed a more pronounced reddish hue and lower bitterness, which were not significantly different from those of MS wine.
At 10% (Figure 9b), color intensity was generally high across treatments, except for WB, which remained lower. WB wines exhibited the highest aromatic quality, while WS showed the lowest and astringency similar to CT wines. No differences were found in the remaining attributes measured.
At 15% (Figure 9c), sensory differences were mainly driven by mouthfeel attributes. WS wines showed the highest astringency, whereas MS and WB presented lower levels. WB maintained a relatively high aromatic quality compared with MS and WS.
At 20% substitution (Figure 9d), all substitution wines exhibited a higher perceived redness than CT wines. WB wines showed the lowest aromatic intensity and quality among treatments. WS wines exhibited the highest aromatic intensity, whereas MS wines showed the highest perceived astringency.
MS and WS wines maintained stronger freshness and aromatic perception at 15–20% substitution, whereas WB wines showed a progressive decline in aromatic expression at the highest substitution level, despite maintaining comparatively stable color perception.

4. Discussion

Despite the relatively unfavorable climatic conditions of the 2024–2025 season, characterized by high rainfall during ripening, all evaluated strategies effectively reduced ethanol content, thereby confirming their applicability beyond warm, dry vintages, which are typically associated with excessive sugar accumulation [30]. This suggests that vineyard or winery interventions can serve as flexible tools to regulate wine composition under variable climatic conditions, as previously indicated by Coppola et al. (2025) [56].
Pre-apical leaf removal (LR) reduced the potential exposed leaf area by 28% compared with control vines, in agreement with previous studies [19,24,27,29]. This level of canopy reduction falls within the threshold reported as necessary to limit sugar accumulation (Table 2) without significantly affecting yield, which remained stable in the present study. The reduction in exposed leaf area led to only a small decrease in sugar accumulation, suggesting that the remaining canopy was sufficient to sustain ripening. This response indicates a compensatory adjustment of the source–sink balance and suggests that the initial leaf area exceeded the minimum required under the evaluated conditions, reflecting a certain degree of canopy plasticity [26,30]. The observed decrease in sugar concentration in LR grapes can be attributed to reduced source capacity following the removal of actively photosynthesizing leaves during veraison, a stage at which carbon assimilation plays a key role in berry sugar loading [30]. Recent studies have also shown that changes in source–sink balance can alter central carbon metabolism in grape berries, affecting sugar catabolism and glycolytic flux, thereby modulating sugar availability for fermentation and final ethanol concentration [57]. Consequently, wines from LR treatments showed a moderate reduction in ethanol content, although the magnitude of the effect was limited, corresponding to an approximate 3% decrease relative to the CT wines (Table 4). However, LR did not significantly affect must or wine acidity, indicating that late canopy interventions primarily influence carbohydrate accumulation rather than organic acid metabolism, consistent with previous reports [27,29,58]. The single vintage in this study precludes assessment of potential remainder effects on carbohydrate reserves and subsequent season yield components, as previously highlighted by Arrillaga et al. (2021) [59].
In contrast, pre-fermentative substitution strategies (MS and WS) produced the most pronounced reductions in ethanol content (Table 4), reflecting the effect of lower sugar or alcohol content of the unripe grape must or wine used. These results are consistent with previous studies demonstrating the effectiveness of these techniques to reduce ethanol levels [31,32,33,38]. The reduction became significant from 10% substitution onward, with limited additional benefit at 15–20%, suggesting an operational threshold beyond which further substitution yields diminishing returns (Table 5). MS reduces the concentration of fermentable sugars before fermentation, while WS introduces a matrix with ethanol but minimal fermentable sugars, resulting in a different must composition during fermentation. In contrast, when blends of wines with different alcohol contents were used (WB), smaller ethanol reductions were produced, confirming that pre-fermentative substitution is more effective than post-fermentative blending [34].
In addition to ethanol reduction, MS and WS consistently decreased pH and increased titratable acidity, reflecting the intrinsic composition of unripe grape matrices (Table 3 and Table 4) [12,31,32,33,38,39]. This was one of the most consistent and pronounced effects observed in the study, highlighting the strong potential of substitution strategies not only for alcohol reduction but also as effective acidification tools. This is particularly relevant under warm conditions and in warm vintages, where reduced acidity and elevated pH frequently compromise wine balance and stability [12,60]. The stronger acidification observed in WS than in MS in the small-scale experiment may be explained by differences in buffering capacity and acid–base equilibria, as well as by precipitation phenomena during fermentation that modify the final wine buffering system [61]. Consequently, WB showed a more pronounced acidification effect than pre-fermentative substitution in equivalent proportions (Table 5). In addition, LR had no significant effect on acidity, reinforcing the concept that canopy manipulation at veraison has limited influence on acid metabolism at this stage [27,29,58].
Volatile acidity remained low across all treatments, indicating that the applied strategies did not compromise fermentation performance. The lower values observed in MS and WS wines may be associated with reduced pH conditions, which are less favorable for the development of acetic acid bacteria [62], whereas post-fermentative blending showed no consistent effect.
Differences in phenolic composition among treatments were closely correlated to ethanol concentration and berry composition. Control wines exhibited the highest phenolic levels, probably due to enhanced extraction at higher ethanol content, which increases solvent capacity during maceration [63]. Among the evaluated strategies, LR had the most pronounced negative impact on phenolic composition, particularly on anthocyanins, consistent with Vercesi et al. (2024) [29], Zhang et al. (2017) [27], and Pallotti et al. (2025) [24]. This effect can be explained by reduced carbon availability, which limits the biosynthesis of phenolic compounds. Therefore, although LR contributed to ethanol reduction, achieving this effect through canopy management also implied a reduction in phenolic composition and, consequently, color intensity. In contrast, MS and WS treatments had a comparatively limited impact on phenolic composition, particularly at substitution levels of 15–20%, where anthocyanin concentrations approached those of control wines (Table 6). This represents an important practical outcome, as these strategies allowed ethanol reduction while largely preserving phenolic composition. This suggests that the lower pH conditions associated with substitution may have improved pigment stability by shifting the equilibrium toward the flavylium cation form, thereby reducing oxidative degradation and color loss [64], while the moderate dilution effect and limited ethanol reduction likely preserved extraction dynamics during fermentation. The preservation of anthocyanin fractions observed in HPLC analysis supports the hypothesis that pre-fermentative substitution with unripe must or wine does not simply dilute phenolic compounds but may also influence their stability and evolution during fermentation. The behavior observed in post-fermentative blending (WB) supports this interpretation, as phenolic compounds decreased progressively with increasing substitution level, consistent with a dilution effect occurring after extraction processes had already taken place [65]. However, these differences may be related not only to the timing of the intervention but also to the distinct physicochemical characteristics of the added matrices, since WB involved fermented wine whereas pre-fermentative substitutions incorporated grape-derived components before fermentation. This highlights the potential advantages of pre-fermentative strategies over post-fermentative approaches for preserving phenolic composition.
These compositional differences were reflected in the color parameters. LR wines showed higher lightness and lower chroma, consistent with reduced anthocyanin content and lower color saturation. In contrast, MS and WS wines maintained color intensity comparable to control wines and exhibited a shift toward more stable red–violet hues, likely associated with lower pH and improved anthocyanin stability [66]. In the small-scale experiment, substitution levels of 15–20% increased chroma in MS and WS wines, further supporting the role of acidification in stabilizing color expression. In addition, WB produced only minor color modifications, except for a slight decrease in hue angle associated with pH-related anthocyanin equilibria.
These compositional differences were reflected in the color parameters. LR wines showed higher lightness and lower chroma, consistent with reduced anthocyanin content and lower color saturation. In contrast, MS and WS wines maintained color intensity comparable to control wines and exhibited a shift toward more stable red–violet hues, likely associated with lower pH, improved anthocyanin stability, and potentially enhanced co-pigmentation effects and formation of more stable polymeric pigments in these Tannat wines, which are characterized by a high tannin–anthocyanin interaction potential. These mechanisms could also contribute to improved color stability during bottle aging [66]. In the small-scale experiment, substitution levels of 15–20% increased chroma in MS and WS wines, further supporting the role of acidification in stabilizing color expression and potentially influencing the formation of more stable pigment structures during bottle aging. In addition, WB produced only minor color modifications, except for a slight decrease in hue angle associated with pH-related anthocyanin equilibria.
Sensory evaluation generally confirmed the analytical results, although not all compositional differences translated into perceptible sensory effects. LR wines were consistently perceived to have lower color intensity, consistent with analytical measurements. In contrast, MS and WS wines maintained visual attributes similar to the control, even at higher substitution levels (Figure 8). Differences in aroma and taste were limited, suggesting that the evaluated strategies mainly affected visual and compositional attributes rather than aroma expression. However, these results should be interpreted with caution, as the exploratory sensory methodology and the lack of replicated evaluations may have limited the analysis’s discriminatory power. This may be partly explained by the relatively moderate ethanol reductions achieved, which were likely insufficient to produce marked sensory changes. In the small-scale experiment (Figure 9), visual differences became more evident at the highest substitution level (20%), where wines exhibited more pronounced reddish hues. This indicates that moderate substitution levels can maintain visual typicity while modulating wine composition. Taste perception partially reflected compositional changes. Differences in acidity and ethanol were not consistently perceived, whereas control wines were identified as the most bitter treatment. Substitution at approximately 15% could provide the best balance among ethanol reduction, acidity, phenolic preservation, and overall sensory acceptability, whereas LR mainly reduced ethanol but adversely affected color perception under the conditions studied.
A limitation of the present study is that substitution treatments were applied exclusively to grapes from the control treatment. Therefore, potential interactions between vineyard and winery strategies could not be evaluated, and the responses observed for must or wine substitution cannot be directly extrapolated to wines produced from leaf-removal grapes. Future studies using fully factorial experimental designs would help clarify whether canopy management modifies the response to substitution strategies.

5. Conclusions

The strategies evaluated in this study provide practical, complementary tools to address the growing need for alcohol reduction and compositional balance in red wines under current and future climatic conditions. Vineyard and winery interventions proved effective in reducing ethanol content, although with distinct impacts on wine composition.
Pre-apical leaf removal applied during one growing season moderately reduced ethanol concentration by limiting carbon assimilation, without significantly affecting acidity. However, this strategy also resulted in a significant decrease in phenolic compounds, particularly anthocyanins, leading to reduced color intensity and potential impacts on overall wine quality. In contrast, pre-fermentative substitution strategies using unripe grape must or wine were more effective in simultaneously reducing ethanol content and improving wine acidity. These approaches led to lower pH and higher titratable acidity, while largely preserving phenolic composition and color characteristics, especially at moderate substitution levels. The timing of the intervention proved critical, as pre-fermentative substitution maintained phenolic composition more effectively than post-fermentative blending.
Among the evaluated treatments, a substitution level of 15% in the exploratory assay appears promising and may warrant further validation. This highlights the potential of substitution strategies as efficient and accessible alternatives to more technologically intensive dealcoholizing methods.
Overall, the results demonstrate that combining viticultural and enological approaches offers a promising strategy for producing balanced, lower-alcohol Tannat wines adapted to changing climatic conditions and consumer demands. Further research across multiple vintages and production scales, including factorial experimental designs, is needed to evaluate potential interactions between vineyard and winery strategies and to validate the consistency of these approaches.

Author Contributions

D.P., M.F. and Y.C.-A. participated in the study’s conceptualization. D.P. and M.F. contributed to the methodological design. The experimental work and laboratory investigations were carried out by D.P., M.F., Y.C.-A., F.P.-F., A.C. and G.F. Data curation was conducted by D.P., M.F. and Y.C.-A. Formal analysis was conducted by D.P., M.F., Y.C.-A., F.P.-F., A.C. and G.F., D.P., M.F., G.G.-N. and Y.C.-A. wrote the original draft. D.P. and G.G.-N. supervised the study and was responsible for funding acquisition. All authors have read and agreed to the published version of the manuscript.

Funding

This work was supported by the Régimen de Dedicación Total program of the Universidad de la República, administered by the Comisión Sectorial de Investigación Científica (CSIC).

Data Availability Statement

The data presented in this study are available on request from the corresponding author because they are part of ongoing research activities and additional analyses associated with future publications derived from the same experimental dataset.

Acknowledgments

The authors gratefully acknowledge the Comisión Sectorial de Investigación Científica (CSIC), Universidad de la República, for financial support through the Régimen de Dedicación Total. The authors also thank Olga Pascual (Bodega Olga Silva) for providing access to the vineyards and grape material used in this study.

Conflicts of Interest

All authors declare that they have no conflicts of interest.

Abbreviations

The following abbreviations are used in this manuscript:
CTControl, traditional winemaking
LRPre-apical leaf removal
MSSubstitution of ripe grape must with must from unripe grapes
WSSubstitution of ripe grape must with wine from unripe grapes
WBWine blend made with control treatment wine (CT) and unripe grape wine

References

  1. Silva, P. Low-Alcohol and Nonalcoholic Wines: From Production to Cardiovascular Health, along with Their Economic Effects. Beverages 2024, 10, 49. [Google Scholar] [CrossRef]
  2. Rui, M.; Blanc, S.; Brun, F.; Massaglia, S. Shifting wine consumption trends (2019–2024): Market dynamics, sustainability, and consumer preferences. In Proceedings of the 46th World Congress of Vine and Wine, Dijon, France, 14–18 July 2025. [Google Scholar] [CrossRef]
  3. Ohana-Levi, N.; Netzer, Y. Long-Term Trends of Global Wine Market. Agriculture 2023, 13, 224. [Google Scholar] [CrossRef]
  4. Deroover, K.; Siegrist, M.; Brain, K.; McIntyre, J.; Bucher, T. A Scoping Review on Consumer Behaviour Related to Wine and Health. Trends Food Sci. Technol. 2021, 112, 559–580. [Google Scholar] [CrossRef]
  5. Bucher, T.; Deroover, K.; Stockley, C. Low-Alcohol Wine: A Narrative Review on Consumer Perception and Behaviour. Beverages 2018, 4, 82. [Google Scholar] [CrossRef]
  6. IWSR. More than Moderation: The Long-Term Rise of No and Low. Available online: https://www.theiwsr.com/insight/more-than-moderation-the-long-term-rise-of-no-and-low/?utm_source=chatgpt.com (accessed on 15 April 2026).
  7. Gerbi, V.; De Paolis, C. The effects of climate change on wine composition and winemaking processes. Ital. J. Food Sci. 2025, 37, 246–260. [Google Scholar] [CrossRef]
  8. Holland, T.; Smit, B. Climate Change and the Wine Industry: Current Research Themes and New Directions. J. Wine Res. 2010, 21, 125–136. [Google Scholar] [CrossRef]
  9. Puga, G.; Anderson, K.; Jones, G.; Doko Tchatoka, F.; Umberger, W. A Climatic Classification of the World’s Wine Regions. OENO One 2022, 56, 165–177. [Google Scholar] [CrossRef]
  10. Candiago, S.; Winkler, K.J.; Giombini, V.; Giupponi, C.; Egarter Vigl, L. An ecosystem service approach to the study of vineyard landscapes in the context of climate change: A review. Sustain. Sci. 2023, 18, 997–1013. [Google Scholar] [CrossRef]
  11. van Leeuwen, C.; Destrac-Irvine, A.; Dubernet, M.; Duchêne, E.; Gowdy, M.; Marguerit, E.; Pieri, P.; Parker, A.; de Rességuier, L.; Ollat, N. An Update on the Impact of Climate Change in Viticulture and Potential Adaptations. Agronomy 2019, 9, 514. [Google Scholar] [CrossRef]
  12. Piccardo, D.; González-Neves, G.; Favre, G.; Pascual, O.; Canals, J.M.; Zamora, F. Impact of Must Replacement and Hot Pre-Fermentative Maceration on the Color of Uruguayan Tannat Red Wines. Fermentation 2019, 5, 80. [Google Scholar] [CrossRef]
  13. Jones, G. Climate, Grapes, and Wine: Structure and Suitability in a Changing Climate. Acta Hortic. 2012, 931, 19–28. [Google Scholar] [CrossRef]
  14. Intergovernmental Panel on Climate Change (IPCC). Climate Change 2023: Synthesis Report. Summary for Policymakers; IPCC: Geneva, Switzerland, 2023; Available online: https://www.ipcc.ch/report/ar6/syr/downloads/report/IPCC_AR6_SYR_SPM.pdf (accessed on 6 March 2026).
  15. Fourment, M.; Gutiérrez-Gamboa, G. Concluding remarks and future directions of Latin American vitiviniculture. In Latin American Viticulture Adaptation to Climate Change; Springer: Cham, Switzerland, 2024; pp. 229–238. [Google Scholar] [CrossRef]
  16. Gutiérrez-Gamboa, G.; Fourment, M. Research and Innovations in Latin American Vitiviniculture: A Review. Horticulturae 2025, 11, 506. [Google Scholar] [CrossRef]
  17. Zamora, F. Elaboración y Crianza del Vino Tinto: Aspectos Científicos y Prácticos; AMV; Mundi-Prensa: Madrid, Spain, 2003; pp. 1–225. [Google Scholar]
  18. Jordão, A.; Vilela, A.; Cosme, F. From sugar of grape to alcohol of wine: Sensorial impact of alcohol in wine. Beverages 2015, 1, 292–310. [Google Scholar] [CrossRef]
  19. Poni, S.; Gatti, M.; Bernizzoni, F.; Civardi, S.; Bobeica, N.; Magnanini, E.; Palliotti, A. Late Leaf Removal Aimed at Delaying Ripening in cv. Sangiovese: Physiological Assessment and Vine Performance. Aust. J. Grape Wine Res. 2013, 19, 378–387. [Google Scholar] [CrossRef]
  20. Ferrer, M.; Echeverría, G.; Pereyra, G.; González-Neves, G.; Pan, D.; Mirás-Avalos, J.M. Mapping Vineyard Vigor Using Airborne Remote Sensing: Relations with Yield, Berry Composition and Sanitary Status under Humid Climate Conditions. Precis. Agric. 2020, 21, 178–197. [Google Scholar] [CrossRef]
  21. Fourment, M.; Tachini, R.; Bonnardot, V.; Collins, C. Assessment of Albariño (Vitis vinifera sp.) Plasticity to Local Climate in the Atlantic Eastern Coastal Terroir of Uruguay. OENO One 2024, 58, 1–15. [Google Scholar] [CrossRef]
  22. Fourment, M.; Ferrer, M.; Barbeau, G.; Quénol, H. Local perceptions, vulnerability and adaptive responses to climate change and variability in a winegrowing region in Uruguay. Environ. Manag. 2020, 66, 737–751. [Google Scholar] [CrossRef]
  23. Listur, B.; Baldivia, G.; Coniberti, A.; Martín, V.; Boido, E.; Medina, K.; Carrau, F.; Dellacassa, E.; Fariña, L. Estrategias Combinadas para la Obtención de un Vino Tannat con un Contenido Moderado de Alcohol. BIO Web Conf. 2023, 68, 02045. [Google Scholar] [CrossRef]
  24. Pallotti, L.; Partida, G.; Laroche-Pinel, E.; Lanari, V.; Pedroza, M.; Brillante, L. Late-Season Source Limitation Practices to Cope with Climate Change: Delaying Ripening and Improving Colour of Cabernet-Sauvignon Grapes and Wine in a Hot and Arid Climate. OENO One 2025, 59. [Google Scholar] [CrossRef]
  25. Prieto, J.A.; Bustos Morgani, M.; Gómez Tournier, M.; Gallo, A.E.; Fanzone, M.; Sari, S.; Galat, E.; Pérez Peña, J.E. Climate change adaptations of Argentine viticulture. In Latin American Viticulture Adaptation to Climate Change; Springer: Cham, Switzerland, 2024; pp. 149–169. [Google Scholar] [CrossRef]
  26. Tosi, V.; Palai, G.; Verosimile, C.M.; Pompeiano, A.; D’Onofrio, C. Vine water status modulates the physiological response to different apical leaf removal treatments in Sangiovese (Vitis vinifera L.) grapevines. Horticulturae 2025, 11, 1524. [Google Scholar] [CrossRef]
  27. Zhang, P.; Wu, X.; Needs, S.; Liu, D.; Fuentes, S.; Howell, K. The Influence of Apical and Basal Defoliation on the Canopy Structure and Biochemical Composition of Vitis vinifera cv. Shiraz Grapes and Wine. Front. Chem. 2017, 5, 48. [Google Scholar] [CrossRef]
  28. Poni, S.; Frioni, T.; Gatti, M. Summer pruning in Mediterranean vineyards: Is climate change affecting its perception, modalities, and effects? Front. Plant Sci. 2023, 14, 1227628. [Google Scholar] [CrossRef]
  29. Vercesi, A.; Gabrielli, M.; Garavani, A.; Poni, S. Effects of Apical, Late-Season Leaf Removal on Vine Performance and Wine Properties in Sangiovese Grapevines (Vitis vinifera L.). Horticulturae 2024, 10, 929. [Google Scholar] [CrossRef]
  30. Poni, S.; Frioni, T. Revised viticulture for low-alcohol wine production: Strategies and limitations. Horticulturae 2025, 11, 932. [Google Scholar] [CrossRef]
  31. Fanzone, M.L.; Sari, S.E.; Mestre, M.V.; Catania, A.A.; Catelén, M.J.; Jofré, V.P.; González-Miret, M.L.; Combina, M.; Vazquez, F.; Maturano, Y.P. Combination of pre-fermentative and fermentative strategies to produce Malbec wines of lower alcohol and pH, with high chemical and sensory quality. OENO One 2020, 54, 4018. [Google Scholar] [CrossRef]
  32. Kontoudakis, N.; Esteruelas, M.; Fort, F.; Canals, J.M.; Zamora, F. Use of Unripe Grapes Harvested during Cluster Thinning as a Method for Reducing Alcohol Content and pH of Wine. Aust. J. Grape Wine Res. 2011, 17, 230–238. [Google Scholar] [CrossRef]
  33. Longo, R.; Blackman, J.W.; Antalick, G.; Torley, P.J.; Rogiers, S.Y.; Schmidtke, L.M. Harvesting and blending options for loweralcohol wines: A sensory and chemical investigation. J. Sci. Food Agric. 2017, 98, 33–42. [Google Scholar] [CrossRef]
  34. Martínez-Moreno, A.; Martínez-Pérez, P.; Bautista-Ortín, A.B.; Gómez-Plaza, E. Use of unripe grape wine as a tool for reducing alcohol content and improving the quality and oenological characteristics of red wines. OENO One 2023, 57, 7226. [Google Scholar] [CrossRef]
  35. Piccardo, D.; Favre, G.; Pascual, O.; Canals, J.M.; Zamora, F.; González-Neves, G. Influence of the Use of Unripe Grapes to Reduce Ethanol Content and pH on the Color, Polyphenol and Polysaccharide Composition of Conventional and Hot Macerated Pinot Noir and Tannat Wines. Eur. Food Res. Technol. 2019, 245, 1321–1335. [Google Scholar] [CrossRef]
  36. Piccardo, D.; Favre, G.; Pascual, O.; Canals, J.M.; Zamora, F.; González-Neves, G. Reducción del Contenido de Alcohol y pH de Vinos Tintos Pinot Noir y Tannat Empleando Uvas con Diferentes Niveles de Maduración. BIO Web Conf. 2019, 12, 02023. [Google Scholar] [CrossRef]
  37. Piccardo, D.; Gombau, J.; Pascual, O.; Vignault, A.; Pons, P.; Canals, J.M.; González-Neves, G.; Zamora, F. Influence of Two Prefermentative Treatments to Reduce the Ethanol Content and pH of Red Wines Obtained from Overripe Grapes. Vitis 2019, 58, 59–67. [Google Scholar] [CrossRef]
  38. Piccardo, D.; González-Neves, G.; Clara, A.; Cazzola, V.; Favre, G.; Fourment, M. Empleo de Mostos Ugni Blanc para Reducir el Contenido de Alcohol y el pH de los Vinos Tannat. BIO Web Conf. 2023, 68, 02032. [Google Scholar] [CrossRef]
  39. Rolle, L.; Englezos, V.; Torchio, F.; Cravero, F.; Río Segade, S.; Rantsiou, K.; Giacosa, S.; Gambuti, A.; Gerbi, V.; Cocolin, L. Alcohol Reduction in Red Wines by Technological and Microbiological Approaches: A Comparative Study. Aust. J. Grape Wine Res. 2018, 24, 62–74. [Google Scholar] [CrossRef]
  40. Teng, B.; Petrie, P.R.; Espinase Nandorfy, D.; Smith, P.; Bindon, K. Pre-Fermentation Water Addition to High-Sugar Shiraz Must: Effects on Wine Composition and Sensory Properties. Foods 2020, 9, 1193. [Google Scholar] [CrossRef] [PubMed]
  41. Peel, M.C.; Finlayson, B.L.; McMahon, T.A. Updated world map of the Köppen–Geiger climate classification. Hydrol. Earth Syst. Sci. 2007, 11, 1633–1644. [Google Scholar] [CrossRef]
  42. Instituto Nacional de Investigación Agropecuaria (INIA). Banco de Datos Agroclimáticos. Available online: http://www.inia.uy/gras/Clima/Banco-datos-agroclimatico (accessed on 15 December 2025).
  43. Programa de Vitivinicultura Sostenible en Uruguay. Available online: https://www.inavi.com.uy/programa-de-viticultura-sostenible/ (accessed on 15 December 2025).
  44. Coombe, B.G. Growth Stages of the Grapevine: Adoption of a System for Identifying Grapevine Growth Stages. Aust. J. Grape Wine Res. 1995, 1, 104–110. [Google Scholar] [CrossRef]
  45. Carbonneau, A. La surface foliaire exposée—Guide pour sa mesure. Le Prog. Agric. Vitic. 1995, 9, 204–212. [Google Scholar]
  46. Organisation Internationale de la Vigne et du Vin (OIV). Recueil des Méthodes Internationales d’Analyse des Vins et des Moûts; OIV: Paris, France, 2021; Available online: https://www.oiv.int/public/medias/8533/methodesdanalysevol1.pdf (accessed on 6 March 2026).
  47. Boulton, R.B.; Singleton, V.L.; Bisson, L.F.; Kunkee, R.E. Principles and Practices of Winemaking; Acribia: Zaragoza, Spain, 2002; 635p. [Google Scholar]
  48. Singleton, V.; Rossi, J. Colorimetry of total phenolics with phosphomolybdic-phosphotungstic acid reagents. Am. J. Enol. Vitic. 1965, 16, 144–158. Available online: https://www.ajevonline.org/content/16/3/144 (accessed on 6 March 2026). [CrossRef]
  49. Ribéreau-Gayon, P.; Stonestreet, E. Determination of Anthocyanins in Red Wine. Bull. Soc. Chim. Fr. 1965, 9, 2649–2652. Available online: https://pubmed.ncbi.nlm.nih.gov/5848688/ (accessed on 6 March 2026).
  50. Sarneckis, C.; Dambergs, R.; Jones, P.; Mercurio, M.; Herderich, M.; Smith, P. Quantification of condensed tannins by precipitation with methyl cellulose: Development and validation of an optimised tool for grape and wine analysis. Aust. J. Grape Wine Res. 2006, 12, 39–49. [Google Scholar] [CrossRef]
  51. Mercurio, M.D.; Dambergs, R.G.; Herderich, M.J.; Smith, P.A. High Throughput Analysis of Red Wine and Grape Phenolics: Adaptation and Validation of the Methyl Cellulose Precipitable Tannin Assay and Modified Somers Color Assay to a Rapid 96-Well Plate Format. J. Agric. Food Chem. 2007, 55, 4651–4657. [Google Scholar] [CrossRef]
  52. Blanco-Vega, D.; López-Bellido, F.J.; Alía-Robledo, J.M.; Hermosín-Gutiérrez, I. HPLC-DAD-ESI-MS/MS Characterization of Pyranoanthocyanin Pigments Formed in Model Wine. J. Agric. Food Chem. 2011, 59, 9523–9531. [Google Scholar] [CrossRef]
  53. Ayala, F.; Echávarri, J.F.; Negueruela, A. A new simplified method for measuring the color of wines. I. Red and Rosé Wines. Am. J. Enol. Vitic. 1997, 48, 357–363. Available online: https://www.ajevonline.org/content/48/3/357 (accessed on 6 March 2026). [CrossRef]
  54. Ayala, F.; Echávarri, J.F.; Negueruela, A.I. MSCV [Software]. Universidad de La Rioja & Universidad de Zaragoza, 2001. Available online: https://www.unirioja.es/dptos/dq/fa/color/color.html (accessed on 12 June 2025).
  55. R Core Team. R: A Language and Environment for Statistical Computing, version 4.3.2; R Foundation for Statistical Computing: Vienna, Austria, 2024. [Google Scholar]
  56. Coppola, F.; Testa, B.; Succi, M.; Paventi, G.; Di Martino, C.; Iorizzo, M. Viticultural and pre-fermentation strategies to reduce alcohol levels in wines. Foods 2025, 14, 2647. [Google Scholar] [CrossRef]
  57. Tong, Q.; Wang, Y.; Feil, R.; Lunn, J.E.; Xu, X.; Wang, Y.; Hilbert-Masson, G.; Kong, J.; Chen, J.; Delrot, S.; et al. Integrated analysis of metabolites and enzyme activities reveals the plasticity of central carbon metabolism in grape (Vitis vinifera cv. Cabernet Sauvignon) berries under carbon limitation. Hortic. Res. 2025, 12, uhae363. [Google Scholar] [CrossRef]
  58. O’Brien, P.; Collins, C.; De Bei, R. Leaf Removal Applied to a Sprawling Canopy to Regulate Fruit Ripening in Cabernet Sauvignon. Plants 2021, 10, 1017. [Google Scholar] [CrossRef]
  59. Arrillaga, L.; Echeverria, G.; Izquierdo, B.; Ferrer, M. Response of Tannat (Vitis vinifera L.) to pre-flowering leaf removal in a humid climate. OENO One 2021, 55, 251–266. [Google Scholar] [CrossRef]
  60. Pereira, C.; Mendes, D.; Martins, N.; Gomes da Silva, M.; Garcia, R.; Cabrita, M.J. A sustainable approach based on the use of unripe grape frozen musts to modulate wine characteristics as a proof of concept. Beverages 2022, 8, 79. [Google Scholar] [CrossRef]
  61. Payan, C.; Gancel, A.-L.; Jourdes, M.; Christmann, M.; Teissedre, P.-L. Wine acidification methods: A review. OENO One 2023, 57, 7476. [Google Scholar] [CrossRef]
  62. Guillamón, J.M.; Mas, A. Acetic Acid Bacteria. In Molecular Wine Microbiology; Carrascosa, A.V., Muñoz, R., González, R., Eds.; Academic Press: London, UK, 2011; pp. 227–255. [Google Scholar] [CrossRef]
  63. Canals, R.; Llaudy, M.; Valls, J.; Canals, J.M.; Zamora, F. Influence of ethanol concentration on the extraction of color and phenolic compounds from the skin and seeds of Tempranillo grapes at different stages of ripening. J. Agric. Food Chem. 2005, 53, 4019–4025. [Google Scholar] [CrossRef] [PubMed]
  64. Rapeanu, G.; Van Loey, A.; Smout, S.; Hendrickx, M. Biochemical characterization and process stability of polyphenoloxidase extracted from Victoria grape (Vitis vinifera ssp. Sativa). Food Chem. 2006, 94, 253–261. [Google Scholar] [CrossRef]
  65. Cáceres-Mella, A.; Peña-Neira, A.; Avilés-Gálvez, P.; Medel-Marabolí, M.; del Barrio-Galán, R.; López-Solís, R.; Canals, J.M. Phenolic composition and mouthfeel characteristics resulting from blending Chilean red wines. J. Sci. Food Agric. 2013, 93, 666–676. [Google Scholar] [CrossRef]
  66. Hermosín Gutiérrez, I. Copigmentació i Piranoantocians: El Paper dels Flavonols i els Àcids Hidroxicinàmics en el Color del vi. ACE Rev. Enol. 2007, 24, 12–20. Available online: https://www.researchgate.net/profile/Isidro-Hermosin-Gutierrez/publication/28156914_Copigmentacion_y_piranoantocianos_El_papel_de_los_flavonoles_y_los_acidos_hidroxicinamicos_en_el_color_del_vino_tinto/links/00463516d75e6b1e48000000/Copigmentacion-y-piranoantocianos-El-papel-de-los-flavonoles-y-los-acidos-hidroxicinamicos-en-el-color-del-vino-tinto.pdf (accessed on 6 March 2026).
Figure 1. Weather conditions from July 2024 to June 2025.
Horticulturae 12 00674 g001
Figure 2. (a) Plants under the control treatment (CT); (b) plants under the pre-apical leaf removal (LR) treatment at E-L 36.
Horticulturae 12 00674 g002
Figure 3. Experimental design integrating vineyard and winery strategies for ethanol modulation in Tannat wine. Unripe grapes harvested at veraison were used to obtain unripe must or wine. At technological maturity, ripe grapes from control (CT) and pre-apical leaf removal (LR) were vinified. In CT wines, 20% (v/v) of ripe must was replaced with unripe must (MS) or unripe wine (WS) before fermentation. Treatments were evaluated in triplicate under identical conditions.
Horticulturae 12 00674 g003
Figure 4. Small-scale substitution and blending experimental design. (a) Pre-fermentative substitution of ripe grape must with unripe grape must (MS) or unripe grape wine (WS) at 5, 10, 15, and 20% (v/v), followed by winemaking under identical conditions. (b) Post-fermentative blending of CT wines with unripe grape wine at the same proportion. CT: Control treatment with 0% of substitution.
Horticulturae 12 00674 g004
Figure 5. Yield (solid bars) and vegetative growth (SFEP, hatched bars). Different letters indicate significant differences (Tukey, p ≤ 0.05). CT: control treatment, LR: pre-apical leaf removal.
Horticulturae 12 00674 g005
Figure 6. Phenolic composition of wines at bottling from the pre-apical leaf removal and 20% must substitution of ripe grape must with unripe grape must or wine. (a) Total polyphenols; (b) tannins; (c) anthocyanins; (d) non-acylated, acetylated and coumarylated anthocyanins. Different letters indicate significant differences (Tukey, p ≤ 0.05) between treatments. CT: control treatment; MS: 20% must substitution; WS: 20% wine substitution; LR: pre-apical leaf removal.
Horticulturae 12 00674 g006
Figure 7. Color wine analysis at bottling from the pre-apical leaf removal and 20% must substitution of ripe grape must with unripe grape must or wine. Mean ± standard deviation (n = 3). Different lowercase letters indicate significant differences (Tukey, p ≤ 0.05) in the red–green component (a*) between treatments. Different Greek letters indicate significant differences (Tukey, p ≤ 0.05) in the yellow–blue component (b*) between treatments. MS: 20% must substitution; WS: 20% wine substitution; LR: pre-apical leaf removal.
Horticulturae 12 00674 g007
Figure 8. Sensorial wine analysis from the pre-apical leaf removal and 20% must substitution of ripe grape must with unripe grape must or wine. Different letters indicate significant differences (Tukey, p ≤ 0.05) between treatments. CT: control treatment; MS: 20% must substitution; WS: 20% wine substitution; LR: pre-apical leaf removal.
Horticulturae 12 00674 g008
Figure 9. Sensorial wine analysis from the small-scale experiment; (a) 5% substitution level; (b) 10% substitution level; (c) 15% substitution level; (d) 20% substitution level. Different letters indicate significant differences (Tukey, p ≤ 0.05) between treatments. CT: control treatment (0% substitution); MS: must substitution; WS: wine substitution; WB: wine blend.
Horticulturae 12 00674 g009
Table 1. Composition of unripe grapes, their corresponding must, and wines used for partial substitution.
Analytical ParameterUnripe GrapeUnripe Grape MustUnripe Grape Wine
Sugar (g/L)171 ± 1166 ± 1-
Potential alcohol (% v/v)9.5 ± 0.19.2 ± 0.1-
Ethanol (% v/v)--10.4 ± 0.0
pH2.89 ± 0.012.77 ± 0.012.85 ± 0.01
Titratable acidity (g H2SO4/L)8.51 ± 0.017.65 ± 0.018.43 ± 0.01
Volatile acidity (g acetic acid/L)--0.37 ± 0.01
Total polyphenols index (A280)-6.5 ± 0.15.5 ± 0.3
Anthocyanins (mg/L)-9.5 ± 3.216.6 ± 0.8
Note: Mean ± standard deviation (n = 3).
Table 2. Composition of grapes from vineyard treatments.
Analytical ParameterViticultural Treatmentp-Value
CTLR
Sugar (g/L)242 ± 5 a235 ± 5 b0.0044
pH3.51 ± 0.05 a3.51 ± 0.03 a0.8058
Titratable acidity (g H2SO4/L)3.40 ± 0.14 a3.34 ± 0.09 a0.5185
Anthocyanins (mg/L)2231 ± 19 a2050 ± 49 b<0.0001
Tannins (mg/L)7256 ± 156 a7480 ± 253 a0.0936
Total polyphenols index (A280)208 ± 6 a213 ± 11 a0.3463
Note: Mean ± standard deviation (n = 3). Different letters indicate significant differences (Tukey, p ≤ 0.05). CT: control treatment, LR: pre-apical leaf removal.
Table 3. Physicochemical characteristics of musts from the pre-apical leaf removal and 20% must substitution of ripe grape must with unripe grape must or wine.
Analytical ParameterWinemaking Treatmentp-Value
CTMSWSLR
Sugar (g/L)236 ± 2 a210 ± 1 c150 ± 1 d226 ± 2 b<0.0001
Potential alcohol content (% v/v)13.1 ± 0.1 a11.6 ± 0.1 c8.3 ± 0.1 d12.6 ± 0.1 b<0.0001
pH3.58 ± 0.01 a3.20 ± 0.02 b3.17 ± 0.03 b3.59 ± 0.04 a<0.0001
Titratable acidity (g H2SO4/L)3.95 + 0.06 c5.36 ± 0.06 b5.62 ± 0.06 a3.99 ± 0.06 c<0.0001
Note: Mean ± standard deviation (n = 3). Different letters indicate significant differences (Tukey, p ≤ 0.05) between treatments. CT: control treatment; MS: 20% must substitution; WS: 20% wine substitution; LR: pre-apical leaf removal.
Table 4. Physicochemical characteristics of wines at bottling from the pre-apical leaf removal and 20% must substitution of ripe grape must with unripe grape must or wine.
Analytical ParameterWinemaking Treatmentp-Value
CTMSWSLR
Ethanol (% v/v)13.7 ± 0.2 a12.9 ± 0.2 c12.9 ± 0.1 c13.3 ± 0.1 b<0.0001
pH3.84 ± 0.02 a3.63 ± 0.03 b3.61 ± 0.01 b3.82 ± 0.03 a<0.0001
Titratable acidity (g H2SO4/L)4.22 ± 0.08 b4.45 ± 0.05 a4.28 ± 0.08 b4.22 ± 0.08 b<0.0001
Malic acid (g/L)3.65 ± 0.10 b3.77 ± 0.18 b4.05 ± 0.10 a3.80 ± 0.18 b0.0010
Lactic acid (g/L)0.23 ± 0.05 a0.07 ± 0.05 bc0.00 ± 0.00 c0.20 ± 0.18 ab0.0012
Volatile acidity (g acetic acid/L)0.28 ± 0.03 ab0.24 ± 0.07 bc0.18 ± 0.02 c0.32 ± 0.02 a<0.0001
Note: Mean ± standard deviation (n = 3). Different letters indicate significant differences (Tukey, p ≤ 0.05) between treatments. CT: control treatment; MS: 20% must substitution; WS: 20% wine substitution; LR: pre-apical leaf removal.
Table 5. Physicochemical characteristics of wines at bottling from the small-scale experiment.
Analytical
Parameter
Substitution Level (%)Winemaking Treatment
MSWSWB
ContentDifference from CT (%)ContentDifference from CT (%)ContentDifference from CT (%)p-Value *
Ethanol
(% v/v)
013.3 ± 0.1 a α-13.3 ± 0.1 a α-13.3 ± 0.1 a α--
513.3 ± 0.1 a α−1.013.3 ± 0.1 ab α−0.613.2 ± 0.1 ab α−0.60.9412
1013.1 ± 0.1 b α−1.913.1 ± 0.1 b α−2.113.1 ± 0.1 bc α−1.70.2417
1512.8 ± 0.1 c β−3.812.8 ± 0.1 c β−4.413.0 ± 0.1 cd α−2.5<0.0001
2012.7 ± 0.2 c β−5.112.6 ± 0.1 c β−5.912.8 ± 0.1 d α−3.50.0001
p-value<0.0001-<0.0001-<0.0001--
pH03.90 ± 0.01 a α-3.90 ± 0.01 a α-3.90 ± 0.01 a α--
53.77 ± 0.02 b β−3.33.77 ± 0.06 b β−3.33.81 ± 0.01 b α−2.30.0120
103.74 ± 0.01 b β−4.13.75 ± 0.01 b αβ−3.83.76 ± 0.01 c α−3.60.0003
153.76 ± 0.02 b α−3.63.75 ± 0.01 b α−3.83.70 ± 0.01 d β−5.2<0.0001
203.73 ± 0.03 b α−4.43.68 ± 0.02 c β−5.63.63 ± 0.01 e ɣ−7.0<0.0001
p-value<0.0001-<0.0001-<0.0001--
Titratable
acidity
(g H2SO4/L)
04.20 ± 0.01 d α-4.20 ± 0.01 b α-4.20 ± 0.01 e α--
54.40 ± 0.08 c α4.84.22 ± 0.05 b β0.54.36 ± 0.05 d α3.80.0066
104.32 ± 0.05 b c β2.84.22 ± 0.05 b β0.54.53 ± 0.06 c α7.8<0.0001
154.50 ± 0.01 b β7.14.43 ± 0.05 a β5.54.76 ± 0.05 b α13.3<0.0001
204.65 ± 0.06 a β10.74.47 ± 0.05 a ɣ6.44.88 ± 0.01 a α16.1<0.0001
p-value<0.0001-<0.0001-<0.0001--
Malic acid (g/L)02.83 ± 0.10 c α-2.83 ± 0.10 c α-2.83 ± 0.10 d α--
52.88 ± 0.13 bc α1.82.85 ± 0.06 c α0.72.88 ± 0.05 cd α1.90.8122
103.05 ± 0.06 a α7.82.92 ± 0.05 bc β3.22.99 ± 0.06 bc αβ5.5<0.0001
153.10 ± 0.01 a α9.53.00 ± 0.01 b β6.03.10 ± 0.08 ab αβ9.6<0.0001
203.02 ± 0.05 ab β6.73.25 ± 0.06 a α14.83.16 ± 0.10 a αβ11.7<0.0001
p-value0.0006-<0.0001-<0.0001--
Lactic acid (g/L)00.95 ± 0.06 a α-0.95 ± 0.06 a α-0.95 ± 0.06 a α--
50.80 ± 0.08 bc α−15.70.70 ± 0.01 bc β−26.30.83 ± 0.01 a α−13.0<0.0001
100.67 ± 0.05 c α−29.50.72 ± 0.10 bc α−24.20.62 ± 0.06 ab α−34.80.2140
150.83 ± 0.05 ab α−12.60.80 ± 0.01 b α−15.80.33 ± 0.05 b β−65.2<0.0001
200.85 ± 0.06 ab α−10.50.60 ± 0.08 c β−36.80.33 ± 0.06 b ɣ−65.2<0.0001
p-value0.0002-<0.0001-0.0002--
Volatile
acidity
(g acetic acid/L)
00.27 ± 0.01 a α-0.27 ± 0.01 a α-0.27 ± 0.01 a α--
50.22 ± 0.04 ab β−18.50.21 ± 0.03 b β−22.20.28 ± 0.01 a α3.60.0112
100.23 ± 0.01 ab β−14.80.23 ± 0.01 ab β−14.80.28 ± 0.01 a α3.6<0.0001
150.22 ± 0.02 ab β−18.50.21 ± 0.02 b β−22.20.26 ± 0.02 a α−3.60.0061
200.16 ± 0.05 b β−40.70.20 ± 0.01 b β−25.90.28 ± 0.01 a α3.60.0011
p-value0.0065-0.0007-0.3542--
Note: Mean ± standard deviation (n = 3). Different lowercase letters indicate significant differences (Tukey, p ≤ 0.05) among the substitution levels within each treatment. Different Greek letters indicate significant differences (Tukey, p ≤ 0.05) among the evaluated treatments (MS, WS, and WB). p-value * between winemaking treatments. MS: must substitution; WS: wine substitution; WB: wine blend.
Table 6. Phenolic composition of wines at bottling from the small-scale experiment.
Analytical
Parameter
Substitution Level (%)Winemaking Treatment
MSWSWB
ContentDifference from CT (%)ContentDifference from CT (%)ContentDifference from CT (%)p-Value *
Spectrophotometric
Total
polyphenols (mg/L)
02866 ± 62 a α-2866 ± 62 a α-2866 ± 62 a α--
52058 ± 7 d ɣ−282252 ± 148 c β−212579 ± 47 b α−100.0299
102293 ± 61 c ɣ−202461 ± 78 b β−142522 ± 12 b α−12<0.0001
152410 ± 38 b β−162647 ± 30 b α−82407 ± 15 c β−16<0.0001
202485 ± 25 b α−132543 ± 104 b α−112350 ± 19 c β−18<0.0001
p-value<0.0001-<0.0001-<0.0001--
Tannins
(mg/L)
01814 ± 54 a α-1814 ± 54 a α-1814 ± 54 b βα--
51116 ± 70 c β−381216 ± 151 c β−331923 ± 6 a α6<0.0001
101332 ± 78 bc β−271245 ± 132 bc β−311741 ± 33 c α−40.0005
151446 ± 219 b α−201456 ± 109 b α−201560 ± 23 d α−140.9947
201342 ± 126 bc β−261454 ± 46 b β−201578 ± 8 d α−130.0907
p-value<0.0001-<0.0001-<0.0001--
Anthocyanins (mg/L)0878 ± 28 a α-878 ± 28 a α-878 ± 28 a α--
5682 ± 4 d ɣ−22713 ± 29 c β−19817 ± 6 b α−70.0008
10749 ± 16 c α−15773 ± 59 bc α−12781 ± 21 b α−110.3182
15800 ± 18 b β−9846 ± 28 ab α−4720 ± 6 c ɣ−18<0.0001
20820 ± 22 b α−7814 ± 44 ab α−7685 ± 28 c β−22<0.0001
p-value<0.0001-0.0003-<0.0001--
HPLC
Non-acylated anthocyanins (mg/L)0378 ± 8 a α-378 ± 8 a α-378 ± 8 a α--
5325 ± 5 b β−14337 ± 30 a αβ−11352 ± 3 b α−70.0356
10344 ± 5 b α−9344 ± 12 a α−9336 ± 2 c α−110.1185
15374 ± 1 a β−1384 ± 1 a α2321 ± 2 d ɣ−15<0.0001
20373 ± 3 a α−1376 ± 22 a α−1302 ± 3 e β−200.0019
p-value0.0005-0.1346-<0.0001--
Acetylated
anthocyanins (mg/L)
0103 ± 3 a α-103 ± 3 a α-103 ± 2 a α--
589 ± 2 c α−1492 ± 10 a α−1094 ± 2 b α−90.7438
1093 ± 1 bc α−1093 ± 4 a α−1091 ± 2 b α−120.6056
15101 ± 1 a α−2103 ± 1 a α087 ± 2 bc β−160.0029
20100 ± 1 ab α−399 ± 6 a α−481 ± 3 c β−210.0293
p-value0.0023-0.2885-0.0003--
Coumarylated anthocyanins (mg/L)083 ± 5 a α-83 ± 5 a α-83 ± 5 a α--
575 ± 5 a αβ−1085 ± 9 a α273 ± 2 ab β−120.0088
1074 ± 6 a α−1175 ± 1 a α−1071 ± 2 b α−140.0024
1578 ± 5 a α−678 ± 3 a α−667 ± 2 b β−190.0013
2075 ± 2 a α−974 ± 4 a α−1163 ± 2 b β−240.0008
p-value0.3679-0.26-0.0036--
Note: Mean ± standard deviation (n = 3). Different lowercase letters indicate significant differences (Tukey, p ≤ 0.05) among the substitution levels within each treatment. Different Greek letters indicate significant differences (Tukey, p ≤ 0.05) among the evaluated treatments (MS, WS, and WB). p-value * between winemaking treatments. MS: must substitution; WS: wine substitution; WB: wine blend.
Table 7. Color wine analysis at bottling from the small-scale experiment.
Analytical
Parameter
Substitution Level (%)Winemaking Treatment
MSWSWB
ContentDifference from CT (%)ContentDifference from CT (%)ContentDifference from CT (%)p-Value *
L*025.9 ± 3.3 b α-25.9 ± 3.3 a α-25.9 ± 3.3 d α--
533.4 ± 3.1 a α28.933.4 ± 4.4 a α28.926.0 ± 0.1 d β0.5<0.0001
1033.1 ± 0.5 a α27.824.6 ± 7.6 a α5.026.5 ± 0.2 c α2.50.0827
1530.7 ± 0.8 a α18.629.6 ± 0.7 a β14.127.2 ± 0.1 b ɣ4.9<0.0001
2030.9 ± 0.1 a α19.231.1 ± 1.4 a α19.927.7 ± 0.1 a β6.9<0.0001
p-value0.0009-0.0575-<0.0001--
C*ab053.8 ± 2.9 c α-53.8 ± 2.9 ab α-53.8 ± 2.9 b α--
555.7 ± 1.2 bc α3.656.5 ± 2.2 ab α5.154.7 ± 0.1 a α1.7<0.0001
1058.6 ± 0.1 ab α9.150.2 ± 7.9 b β−6.554.8 ± 0.1 a β1.90.0058
1559.1 ± 0.5 a α9.958.6 ± 0.2 ab α9.054.6 ± 0.1 a β1.5<0.0001
2059.5 ± 0.2 a α10.759.4 ± 0.8 a α10.554.4 ± 0.1 a β1.1<0.0001
p-value0.0002-0.0275-<0.0001--
hab07.4 ± 1.1 c α-7.4 ± 1.1 abc α-7.4 ± 1.1 c α--
54.5 ± 1.9 d ɣ−39.34.9 ± 1.1 bc β−33.113.0 ± 0.1 a α76.1<0.0001
107.5 ± 0.4 bc β1.72.5 ± 5.1 c ɣ−65.911.6 ± 0.7 ab α56.90.0824
159.7 ± 0.3 ab ɣ31.910.2 ± 0.9 ab α38.69.9 ± 0.2 bc β33.5<0.0001
209.8 ± 0.6 a α33.710.7 ± 0.5 a α45.48.3 ± 0.2 c β11.5<0.0001
p-value<0.0001-0.0009-0.0001--
Note: Mean ± standard deviation (n = 3). Different lowercase letters indicate significant differences (Tukey, p ≤ 0.05) among the substitution levels within each treatment. Different Greek letters indicate significant differences (Tukey, p ≤ 0.05) among the evaluated treatments (MS, WS and WB). p-value * between winemaking treatments. MS: must substitution; WS: wine substitution; WB: wine blend.
Disclaimer/Publisher’s Note: The statements, opinions and data contained in all publications are solely those of the individual author(s) and contributor(s) and not of MDPI and/or the editor(s). MDPI and/or the editor(s) disclaim responsibility for any injury to people or property resulting from any ideas, methods, instructions or products referred to in the content.