Article

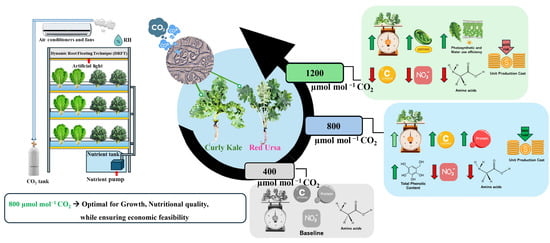
Optimizing Carbon Dioxide Enrichment to Balance Yield, Functional Food Quality, and Economic Feasibility in Plant-Factory-Cultivated Kale

by
Manop Kupia
1,
Weerasin Sonjaroon
1,
Gadewara Matmarurat
2,
Masayoshi Shigyo
3,
Patchareeya Boonkorkaew
1,*,
Nikolaos Tzortzakis
4,* and
Jutiporn Thussagunpanit
1,*
1
Department of Horticulture, Faculty of Agriculture, Kasetsart University, 50 Ladyao, Chatuchak, Bangkok 10900, Thailand
2
Kasetsart Agricultural and Agro-Industrial Product Improvement Institute, Kasetsart University, 50 Ladyao, Chatuchak, Bangkok 10900, Thailand
3
Laboratory of Vegetable Crop Science, College of Agriculture, Graduate School of Sciences and Technology for Innovation, Yamaguchi University, Yamaguchi 753-8511, Japan
4
Department of Agricultural Sciences, Biotechnology and Food Science, Cyprus University of Technology, 3603 Limassol, Cyprus
*
Authors to whom correspondence should be addressed.
Horticulturae 2026, 12(5), 621; https://doi.org/10.3390/horticulturae12050621 (registering DOI)
Submission received: 14 April 2026 / Revised: 4 May 2026 / Accepted: 14 May 2026 / Published: 18 May 2026

Abstract

Kale is widely recognized as a nutritional superfood. This study investigated the impact of carbon dioxide (CO2) concentrations (400, 800, and 1200 µmol mol−1) on the growth, yield, physiological responses, and nutritional contents of two kale cultivars (‘Curly Kale’ and ‘Red Ursa’) grown in a plant factory. A completely randomized design was used to evaluate these parameters. Based on the results, increasing the CO2 concentration to 1200 µmol mol−1 significantly enhanced stem height, shoot, and root fresh weight and dry weight in ‘Curly Kale’ and ‘Red Ursa’, compared to the other CO2 concentrations. Increasing CO2 concentration to 1200 µmol mol−1 significantly enhanced net photosynthesis rate, stomatal conductance, transpiration rate, and water use efficiency in ‘Curly Kale’. In addition, compared to ambient CO2, the increase in the CO2 concentration to 800 µmol mol−1 significantly increased the vitamin C, soluble protein, and total phenolic contents, while reducing the nitrate accumulation in both cultivars. However, further elevation to 1200 µmol mol−1 CO2 markedly decreased the vitamin C content and total amino acids, including both the essential and non-essential amino acids. Among the tested concentration gradients, 800 µmol mol−1 CO2 was identified as the most cost-effective level for maintaining nutrient density, whereas 1200 µmol mol−1 CO2 increased unit production costs for ‘Red Ursa’ due to a lack of significant yield returns. In conclusion, enriching the CO2 concentration to 800 µmol mol−1 provided a balance between improved growth, photosynthetic performance, and optimal nutritional quality, while ensuring economic feasibility and preserving the superfood identity of kale.

Graphical Abstract

1. Introduction

Kale (Brassica oleracea var. acephala) is a high-value leafy vegetable in the Brassicaceae family [1]. It is widely marketed as a superfood because of its dense nutritional profile and diverse bioactive compounds [2]. Kale leaves provide essential vitamins such as A, C, and K that contribute to antioxidant capacity and physiological resilience [3]. They also contain minerals, including calcium, potassium, manganese, iron, sodium, and zinc, that are relevant to human nutrition and health [4]. In addition, kale accumulates carotenoids such as lutein, zeaxanthin, and β-carotene that are linked to photoprotection and visual health [3]. Kale further contains proteins and essential amino acids with putative benefits for immune function and anti-inflammatory responses [5]. The significance of kale in the health sector is evidenced by its inclusion in the Dietary Supplement Label Database of the National Institutes of Health (NIH), which is a part of the US Department of Health and Human Services. This database lists numerous kale-based supplements that claim substantial levels of protein, carbohydrates, vitamins, and minerals [6]. Notably, some of the kale products provide approximately 35% of the daily value for vitamin C (ascorbic acid) per serving [6], equivalent to 31.5 mg per 100 g of fresh kale, based on the reference daily intakes (RDIs) according to the United States Department of Agriculture (USDA) [7]. This highlights kale’s role as a critical source of ascorbic acid, driving growth in consumer demand across fresh produce markets and the functional food sector, creating incentives to improve both yield and nutritional quality in commercial systems [4].
Controlled environment agriculture enables precise regulation of environmental variables that determine plant growth and quality [8]. Plant factories with artificial lighting (PFAL) provide control over light intensity, photoperiod, temperature, relative humidity, and CO2 concentration in closed spaces [9]. Such systems allow year-round production independent of external climate and reduce pest pressure and pesticide dependence [8]. Kale is suited to PFAL cultivation because it tolerates a broad optimal temperature range of approximately 15.5–30 °C [10]. Kale also performs under extended photoperiods that are typical in PFAL operations, designed to increase daily light integral [11]. In addition, beyond environmental control, vegetables produced in PFALs were emphasized for their superior hygiene, enabling plant raw materials to integrate more efficiently into the food industry’s supply chain [12]. However, intensively growth-promoting conditions may accentuate trade-offs between rapid biomass accumulation and the maintenance of nutritional density in edible tissues [13]. This issue is particularly salient for kale, where nutritional density strongly influences market value and consumer acceptance [4].
CO2 enrichment is a standard practice in PFAL and other closed cultivation systems because it increases photosynthetic carbon assimilation in C3 leafy vegetables [14]. In Brassicaceae crops, elevated CO2 has been associated with increased chlorophyll and β-carotene contents that covary with photosynthetic capacity and pigment status [15]. Kale exhibits enhanced net photosynthetic rates at CO2 concentrations up to about 1200 µmol mol−1 under controlled conditions [16]. Nevertheless, responses in nutritional quality under elevated CO2 are not uniform across species and cultivars and may depend on both the magnitude and duration of enrichment [17]. Long-term exposure to high CO2 can lead to carbohydrate accumulation and reduced leaf nitrogen concentration, potentially depressing protein-related traits and shifting the balance among primary and secondary metabolites [13]. These considerations indicate that crop and cultivar-specific CO2 thresholds are needed to balance productivity with nutritional integrity in PFAL operations [8].
In Thailand, commercial PFAL systems frequently maintain elevated CO2 levels (1000–1600 µmol mol−1) to maximize growth rates [18]. While generalized guidelines recommend ranges of 1000–2000 µmol mol−1 [19], such broad targets may not account for cultivar-specific quality trade-offs relevant to kale. This gap is critical not only for market value but also for regulatory compliance. Regional regulatory shifts, such as Thailand’s Herbal Product Act, have broadened the focus from “pharmaceutical active substances” to a comprehensive “active substance” classification [20], reflecting a global trend toward rigorous nutrient quantification. To facilitate international market access, functional vegetables must adhere to standardized labeling criteria. According to the US Food and Drug Administration (FDA), a food product is considered a good source of a specific nutrient if one serving contains 10% to 19% of the Dietary Reference Value (DRV), while the term excellent source is used if it contains 20% or more of the DRV [21]. The importance of maintaining such high nutritional standards is emphasized by the European Food Safety Authority (EFSA), which notes that deficiencies in essential nutrients like vitamin A are associated with ocular diseases and increased infectious morbidity and mortality, particularly in low-income regions [22]. Furthermore, ensuring consumer safety through chemical residue limits is an essential pillar of these global standards. For instance, while the European Union has not yet established specific nitrate residue limits for kale, a maximum limit of 7000 mg kg−1 fresh weight (FW) is strictly regulated for rucola (wild rocket), which belongs to the same Brassicaceae family [23]. This underscores the urgent need to identify operational CO2 targets that sustain growth benefits while fulfilling the nutritional and safety requirements of the global functional food market.
Evidence from other leafy vegetables shows that elevated CO2 can enhance morphological and physiological traits alongside yield [14]. In Chinese kale, previous work has indicated that glucosinolate content can be modified under elevated CO2, suggesting that secondary metabolism may be CO2-responsive in this crop [24]. However, this responsiveness often introduces the challenge of nutrient dilution, a phenomenon that is particularly critical for the functional food industry, where nutritional density is a primary value driver [13]. This gap underscores the urgent need to identify operational CO2 targets that sustain growth benefits while minimizing potential dilution in nutritional density. Despite these regulatory and commercial requirements, two additional knowledge gaps limit the direct transfer of findings from other species to kale. First, cultivar-dependent responses, particularly between morphotypes commonly referred to as kale (B. oleracea var. acephala) and curly kale (B. oleracea var. sabellica), remain insufficiently characterized under commercial-scale PFAL conditions [1]. Second, comprehensive characterization of amino acid profiles, protein-related nutritional attributes, and changes of vitamin C content across graded CO2 levels remains limited for kale, despite their importance to dietary quality [5]. Together, these gaps constrain evidence-based recommendations for CO2 set points that are tailored to kale cultivars and quality goals in controlled environments [8].
Accordingly, this study aims to identify the most suitable CO2 concentration among the tested ranges for kale cultivation by integrating evaluations of biomass accumulation, physiological responses, nutrient content, and economic feasibility in ‘Curly Kale’ and ‘Red Ursa’ across varying CO2 levels. The primary focus is to quantify how these enrichment levels affect the integrity of the active substances—specifically ascorbic acid, soluble protein, and amino acid profiles—to ensure compliance with both nutritional goals and regulatory standards. We hypothesized that CO2 enrichment above ambient levels would improve growth, but that moderate enrichment offers a superior balance of productivity and nutritional density compared to stronger enrichment, and that these metabolic responses are cultivar dependent. The outcomes are expected to identify practical CO2 targets that maximize yield without compromising the mandatory active substance requirements for functional food applications.

2. Materials and Methods

2.1. Plant Materials and Growth Conditions

Seeds of two kale cultivars (‘Curly Kale’ and ‘Red Ursa’) were purchased from Chia Tai Co., Ltd. (Bangkok, Thailand) and Zen Hydroponics (Chiang Mai, Thailand), respectively. Seeds were germinated in a hydrated sponge block with a recorded germination rate of 95.83%. After 14 days, uniform seedlings characterized by the presence of about two true leaves and consistent height were relocated to a dynamic root floating technique system in the PFAL cultivation room with a floor area of 10 m2. The light intensity was controlled at 200 µmol m−2 s−1 using white, blue, and red LED lamps at the ratio 3:2:1 throughout the trial. This spectral composition was verified to provide a red:green:blue (RGB) ratio of 1.3:1:1.7 using a 30 × 150 cm LED panel (Panasonic Co., Ltd.; Bangkok, Thailand) with a 12 h photoperiod (06:00–18:00).
Throughout the experiment, the temperature and relative humidity were controlled at 25 ± 0.4 °C and 60–70%, respectively. Plants were grown under hydroponic conditions by employing the modified Enshi solution [25] based on previous trials or studies [26,27]. The nutrient concentrations in the nutrient solution (NS) were as follows: NO3-N = 14.29, NH4+-N = 0.04, K+ = 8.44, ΡO43−-P = 1.23, Ca2+ = 3.87, Mg2+ = 2.47, SO42−-S = 1.56 and Na+ = 0.09 mmol L−1, respectively; and Β = 27.8, Fe = 64.4, Μn = 7.65, Cu = 1.0, Zn = 3.06, and Μο = 0.51 μmol L−1, respectively. To ensure non-limiting nutrient conditions throughout the growth cycle, the electrical conductivity (EC) and pH of the nutrient solution were monitored and adjusted daily. The EC was maintained within a range of 2.2–2.4 mS cm−1 by replenishing with stock nutrient solution approximately every 5–7 days, or as required based on daily measurements, to sustain the target concentration. The pH was regulated between 5.5 and 6.0 using nitric acid (HNO3) or potassium hydroxide (KOH).
The experiment layout used a completely randomized design with three CO2 concentrations (400, 800, and 1200 µmol mol−1). CO2 enrichment was initiated at germination and maintained consistently throughout the growth cycle, using separate cultivation rooms for each concentration. CO2 was supplied from compressed CO2 cylinders (MESSER (Thailand) Co., Ltd., Bang Pu Mai, Thailand) and delivered into the cultivation chamber through an ARC ARCTECH CO2 regulator with an integrated flow meter (ARC Arctech Company, Shanghai, China), together with a flow-control valve. The air current speed within the cultivation room was maintained at 0.7–0.8 m s−1 to ensure adequate gas exchange. In each treatment, the CO2 level was maintained with an approximate deviation of 400 ± 10, 800 ± 20, and 1200 ± 30 µmol mol−1, respectively. In each treatment, four replications were performed, with each replication consisting of one growing tray containing 12 plants. These 12 plants served as sub-replicates, and the specific number of plants sampled for each physiological or nutritional parameter is detailed in their respective measurement sections.

2.2. Growth and Yield Measurements

Plant morphological measurements, including number of leaves, stem height, and canopy width, were recorded every 7 days, starting at 7 days after transplanting (DAT), for a total of 5 consecutive observations (7, 14, 21, 28, and 35 DAT). The kale plants were harvested at 42 DAT. Each plant was harvested separately, and detailed measurements were recorded. Data was collected from 4 replicates, each consisting of the 3 plants taken from the same growing tray to average for morphological analysis. Leaf greenness index of the fully expanded leaf at the highest point of the canopy was measured using a portable chlorophyll meter (SPAD-502; Minolta Crop.; Kyoto, Japan). Stem diameter was measured before separating the plant shoot from the root at the cotyledon scar, while the fresh weights of the shoot and root were also recorded. In addition, a subsample (3 plants) from each replication was dried in a hot-air oven at 60 °C for 5 days until constant weight. The shoot and root dry weights were measured, and the fresh-to-dry weight ratio was calculated.

2.3. Physiological Responses

Using one plant randomly selected per replicate tray (n = 4), the photosynthetic efficiencies, including leaf gas exchange, photosystem II efficiency, and spectral indices, were measured on the day before harvesting (41 DAT). To ensure data uniformity and minimize physiological variability associated with leaf age, all measurements were performed at the same leaf position on each sampled plant, specifically the first fully expanded leaf from the shoot apex. Data was collected from four replicates per treatment.
Leaf gas exchange parameters, consisting of photosynthetic rate (Pn), stomatal conductance (gs), and transpiration rate (E), were measured using a portable photosynthesis system (LI-6800; Li-Cor; Lincoln, NE, USA). Then, the water use efficiency (WUE) was calculated from the ratio of Pn to E. The measurements were conducted under an artificial red and blue light source at the leaf chamber at the ratio 9:1, which maintained the photosynthetic photon flux density, temperature, relative humidity, and airflow rate at 200 µmol m−2 s−1, 25 °C, 60–70%, and 600 mmol−1, respectively [28]. The CO2 concentrations were controlled at 400, 800, and 1200 µmol mol−1 depending on the treatment.
The photosystem II efficiency measurements, consisting of the maximum quantum yield of PSII (Fv/Fm), quantum efficiency of photosystem II (Y(II)), photochemical quenching (qP), non-photochemical quenching (NPQ), and electron transport rate (ETR), were taken using a portable fluorescence system (MINI-PAM-II; WALZ; Effeltrich, Germany). Each leaf was kept in a dark-adapted state for 30 min before recording the minimal and maximal fluorescence yields. Subsequently, each leaf was illuminated with 1500 µmol m−2 s−1 actinic light for 15 s, and the measurement cycle was repeated. The photosystem II efficiency parameters were calculated according to Maxwell and Johnson [29]. Measurements of spectral indices, consisting of the normalized difference vegetation index (NDVI), normalized difference red edge index (NDRE), normalized phacophytinization index (NPQI), photochemical reflectance index (PRI), and water index (WI), were taken using a handheld spectroradiometer (PolyPen PR410 UVIS and PR410 NIR; Photon Systems Instruments; Drasov, Czech Republic).

2.4. Photosynthetic Pigment Content Evaluation

The same plants as in Section 2.3 were used for the photosynthetic pigment contents. Measurements referred to the total chlorophyll (total Chl), chlorophyll a (Chl a), chlorophyll b (Chl b), and total carotenoids (total Car) contents, as well as the calculation of the Chl a/Chl b ratio and the ratio of total carotenoids to total chlorophyll (total Car/total Chl). These pigments were analyzed on the day of harvest (42 DAT). Approximately 0.1 g of each fresh leaf sample collected from the same leaf position of the first fully expanded leaf as used for physiological measurements was extracted using 10 mL N,N-dimethyl formamide in the dark for 24 h at room temperature, with four replicates using one plant randomly selected per replicate tray in each treatment. Each plant extract was analyzed using a spectrophotometer (PV1; Shanghai Mapada Instruments Co., Ltd.; Shanghai, China). The absorbance of the extract solution was determined at 664, 647, and 480 nm. After that, the data were calculated according to Porra [30] and Wellburn [31].

2.5. Soluble Protein, Phytonutrients, and Nitrate Analysis

Using the same plants as in Section 2.3 above, data were analyzed based on four replications per treatment. After kale harvesting, each sample of fresh kale leaves was analyzed for soluble protein according to Bradford [32] using bovine serum albumin with a solution of Coomassie brilliant blue G-250 as the standard, with absorbance at 595 nm using the spectrophotometer (PV1; Shanghai Mapada Instruments Co., Ltd.; Shanghai, China). In addition, vitamin C and nitrate contents were analyzed using an RQ-flex reflectometer (Merck; Darmstadt, Germany) according to Ağlar and Saraçoğlu [33] and Parks et al. [34], respectively. Freeze-dried samples following methanol extraction [35] were used for the total phenolic content determination according to the Folin–Ciocalteu colorimetric method. The methanolic extracts were determined at 765 nm by using the spectrophotometer and compared to the gallic acid standard solution [36].

2.6. Amino Profile Evaluation

This evaluation was based on four replications per treatment. After harvesting, the fresh kale leaves were freeze-dried and finely ground prior to analysis. Amino acid determination was performed using acid hydrolysis for most amino acids and alkaline hydrolysis for tryptophan; thereafter, chromatographic analysis was conducted. For acid hydrolysis, approximately 0.5 g of freeze-dried kale powder was hydrolyzed with 2.0 mL of 6 M hydrochloric acid (HCl) at 110 °C for 24 h. After cooling to room temperature, the hydrolysates were adjusted with deionized water and analyzed using an amino acid analyzer (LA-8080; Hitachi Ltd., Tokyo, Japan) equipped with a sodium-type cation-exchange resin column. Amino acids were detected using post-column ninhydrin derivatization, with absorbance measured at 570 nm for most amino acids and at 440 nm for proline. For tryptophan determination, alkaline hydrolysis was applied. Freeze-dried samples (about 0.5 g) were digested with 2.0 mL of saturated barium hydroxide (Ba(OH)2) at 110 °C for 24 h using a block heater (Thermo Fisher Scientific Inc., Waltham, MA, USA). After hydrolysis, the samples were neutralized with 0.02 M HCl and analyzed by high-performance liquid chromatography (HPLC; HP 1260, Agilent Technologies, Waldbronn, Germany) equipped with a fluorescence detector. The excitation and emission wavelengths were set at 340 and 450 nm, respectively, and separation was achieved using an AdvanceBio AAA (Agilent Technologies, Santa Clara, CA, USA) column (4.6 × 100 mm, 2.7 μm). Amino acid contents were quantified using external standards and expressed on a dry weight basis.

2.7. Economic Evaluation

The economic feasibility of CO2 enrichment was evaluated by determining the unit production cost (USD kg−1) for each treatment. The calculations were based on a standardized growth room size of 10 m2 with a total capacity of 960 kale plants. Total production costs were calculated as the sum of fixed costs (PFAL infrastructure, climate control systems, and LED lighting) and variable costs (electricity for lighting and cooling, CO2 gas, seeds, nutrient solutions, and labor). The unit production cost was calculated by dividing the total cost per plant by the actual shoot fresh weight yield obtained per plant. All expenses were converted from Thai Baht (THB) to United States Dollars (USD) using the average exchange rate during the experimental period to facilitate standardized comparison (1 THB = 0.031 USD).

2.8. Statistical Analysis

Statistical analysis was carried out using the R software (version 4.4.3; R Core Team, Vienna, Austria, 2025). The significance of the observed differences among the treatments was determined using one-way ANOVA. Means were considered significantly different at p < 0.05 were considered significant using Tukey’s honestly significant difference test. In addition, heat maps were generated to visualize cluster analyses of the measured parameters and CO2 treatments.

3. Results

3.1. Effect of CO2 Concentrations on Growth and Yield of Kale

Changes in the number of leaves, stem height, and canopy width of ‘Curly Kale’ and ‘Red Ursa’ grown under different CO2 concentrations in the PFAL were recorded every 7 DAT. In both cultivars, cultivation under 800 µmol mol−1 CO2 significantly increased the number of leaves compared with the control (400 µmol mol−1 CO2) (Figure 1A,D). As the cultivation period progressed, elevated CO2 up to 1200 µmol mol−1 promoted increases in stem height across all CO2 treatments. The highest stem height was observed in ‘Curly Kale’, which exhibited a significant increase at 35 DAT (Figure 1B), whereas ‘Red Ursa’ showed no significant differences among CO2 levels (Figure 1E). However, both kale cultivars grown under elevated CO2 displayed significantly greater canopy widths compared with the control (Figure 1C,F).

3.2. Effect of CO2 Concentrations on the Yield of Kale Plants

At harvest (42 DAT), the growth response to CO2 enrichment was markedly cultivar dependent. ‘Curly Kale’ plants grown under 800 and 1200 µmol mol−1 CO2 were larger in size than those under 400 µmol mol−1 CO2 (Figure 2A). In contrast, ‘Red Ursa’ displayed relatively consistent shoot growth across all treatments, with no significant increase in plant size among varying CO2 concentrations (Figure 2B). Specifically, ‘Curly Kale’ grown under 1200 µmol mol−1 CO2 achieved the highest fresh weight and dry weight of the shoots and roots that were significantly higher than the control by 163% and 223% for shoot fresh weight and dry weight, respectively (Table 1). However, in ‘Red Ursa’, plants grown under 1200 µmol mol−1 CO2 significantly enhanced only the root biomass—increasing fresh weight by 51% and dry weight by 52%—while the shoot weight showed a nonsignificant increase in shoot weight of only 7.6% compared to the control (Table 1). In addition, under the elevated CO2 at 800 µmol mol−1, a significant increase in stem diameter in ‘Curly Kale’ was observed when compared with both 400 and 1200 µmol mol−1 CO2. By contrast, in ‘Red Ursa’, stem diameter increased when CO2 exceeded the ambient levels (control) (Table 1). Notably, growing ‘Red Ursa’ under 1200 µmol mol−1 CO2, the leaf greenness index was significantly reduced by 29% and 17% compared to under 400 and 800 µmol mol−1 CO2, respectively (Table 1).

3.3. Effect of CO2 Concentrations on Photosynthetic Efficiency of Kale Plants

The photosynthetic efficiencies were measured prior to harvesting. When ‘Curly Kale’ was grown under 1200 µmol mol−1 CO2, increased values of Pn and WUE were observed (Figure 3A,D), whereas plants growing under elevated CO2 had significantly increased values of gs and E (Figure 3B,C) compared to the control. However, ‘Red Ursa’ grown under 1200 µmol mol−1 CO2 significantly increased only in Pn (Figure 3A).
In addition, the assessment of chlorophyll fluorescence was conducted to evaluate the photosystem II efficiency. These results showed that the concentration of CO2 in both kale cultivars did not affect any of the parameters (Fv/Fm, Y(II), qP, NPQ, and ETR) that were related to photosystem II efficiency (Figure 4).
To further clarify the light adaptation ability of each kale cultivar at 1200 µmol mol−1 CO2, photosynthetic and carboxylation parameters were estimated (Figure S1, Table S1). ’Curly Kale’ exhibited a substantially lower light compensation point (30.65 µmol m−2s−1) and a higher maximum photosynthetic rate (Pmax), 55.96 µmol CO2 m−2s−1, compared to ‘Red Ursa’. Additionally, ‘Curly Kale’ showed superior biochemical capacity for carbon fixation, with a maximum carboxylation rate (Vcmax) of 113.28 μmol CO2 m−2s−1 and a maximum electron transport rate (Jmax) of 147.34 μmol m−2s−1. Conversely, ‘Red Ursa’ demonstrated a higher light saturation point (1288.44 µmol m−2s−1).

3.4. Effect of CO2 Concentrations on Spectral Indices of Kale Plants

The leaf spectral indices consisting of the NDVI, NDRE, NPQI, PRI, and WI were measured in both kale cultivars grown under different concentrations of CO2. The results showed that growing ‘Curly Kale’ under different concentrations of CO2 did not significantly alter the NDVI, NDRE, NPQI, and PRI (Figure 5A–C), but when plants were growing under elevated CO2, the WI significantly increased compared to relevant plants grown under the ambient concentrations of CO2 (Figure 5E). In ‘Red Ursa’, NDVI declined when the kale plants were exposed to 800 µmol mol−1 CO2 (Figure 5A). On the other hand, growing ‘Red Ursa’ under 800 µmol mol−1 CO2 significantly increased the PRI, whereas under 1200 µmol mol−1 CO2, the PRI increased (but not significantly) compared to the control (Figure 5D).

3.5. Effect of CO2 Concentrations on Photosynthetic Pigment Accumulation

Photosynthetic pigments were analyzed after harvesting kale plants. Both kale cultivars grown under 1200 µmol mol−1 CO2 had significantly higher values of total chl. However, Chl a significantly increased only in ‘Curly Kale’ when plants were exposed to 800 and 1200 µmol mol−1 CO2. The Chl b increased when ‘Red Ursa’ plants were subjected to 800 µmol mol−1 CO2 (Table 2). ‘Curly Kale’ plants grown under 800 and 1200 µmol mol−1 CO2 had an increased Chl a-to-Chl b ratio, whereas ‘Red Ursa’ had a decreased ratio compared to the control (Table 2). In addition, in both kale cultivars, 800 and 1200 µmol mol−1 CO2 significantly enhanced total carotenoids accumulation (Table 2). Consequently, the total carotenoids-to-chlorophyll ratio was significantly higher under both 800 and 1200 µmol mol−1 CO2 treatments than under 400 µmol mol−1 CO2. In ‘Curly Kale’, the ratio increased from 0.08 in the control to 0.13–0.15 in the enriched treatments, while ‘Red Ursa’ showed a progressive increase, reaching its highest ratio of 0.23 at 1200 µmol mol−1 CO2 (Table 2).

3.6. Effect of CO2 Concentration on Soluble Protein, Phytonutrients, and Nitrate Content

Vitamin C, soluble protein, and total phenolics were analyzed after harvesting kale plants. Growing kale plants under 800 µmol mol−1 CO2 significantly enhanced vitamin C accumulation by 68% and 52% in ‘Curly Kale’ and ‘Red Ursa’, respectively, compared to the control (Figure 6A). However, compared to the control, the increase in CO2 concentration to 1200 µmol mol−1 reduced vitamin C contents in both kale cultivars by about 80% (Figure 6A). In addition, compared to the ambient CO2 concentration, growing kale plants under elevated CO2 showed a significant increase in soluble protein and total phenolic contents in both kales (Figure 6B,C). On the other hand, growing kale plants under elevated CO2 significantly reduced the nitrate accumulation in only ‘Red Ursa’ (Figure 6D).

3.7. Effect of CO2 Concentration on the Amino Profile of Kale Plants

Amino acid profiles in kale plants, including essential and non-essential amino acids, were analyzed. The results demonstrated that ‘Curly Kale’ grown under elevated CO2 concentrations (800 and 1200 µmol mol−1) reduced essential, non-essential, and total amino acids. However, when plants were growing under only 1200 µmol mol−1, a significant reduction was observed in the non-essential and total amino acids in ‘Red Ursa’ compared to ambient CO2 (400 µmol mol−1) (Table 3). Although most of the amino acids decreased after cultivating kale plants under elevated CO2, some amino acids, such as histidine and glycine, remained stable when both cultivars were grown under 800 µmol mol−1 CO2 compared to the control. In addition, not only histidine and glycine but also serine and threonine were stable when cultivated ‘Red Ursa’ under 800 µmol mol−1 CO2 compared to under 400 µmol mol−1 CO2 (Table 3). Interestingly, both kale cultivars grown under 800 µmol mol−1 CO2 exhibited a significant increase in arginine, while only ‘Red Ursa’ showed a significant increase in glutamic acid compared to those grown under other CO2 concentrations (Table 3). Furthermore, the distribution of these amino profiles was assessed through the ratios of essential and non-essential amino acids to the total amino acid pool. The total essential amino acids-to-total amino acids ratio was not significantly affected by CO2 enrichment in either cultivar. However, the total non-essential amino acids-to-total amino acids ratio in ‘Red Ursa’ significantly increased at 800 µmol mol−1 CO2 compared to the 400 and 1200 µmol mol−1 CO2 treatments, whereas no significant differences were observed in ‘Curly Kale’ (Table 3).

3.8. Heat Map Analysis

Heat map analysis using hierarchical clustering revealed distinct responses of kale cultivars to different CO2 concentrations. For growth, physiological, and phytochemical parameters (Figure 7), the dendrograms clearly separated the ambient CO2 treatment (400 µmol mol−1) from the elevated CO2 treatments (800 and 1200 µmol mol−1) in both ‘Curly Kale’ (Figure 7A) and ‘Red Ursa’ (Figure 7B). Generally, elevated CO2 concentrations were associated with higher values for growth, yield, and physiological activities compared to the ambient level. Specifically, plants grown under 400 µmol mol−1 exhibited the lowest averages for yield, gas exchange parameters (Pn, gs, and WUE), and photosynthetic pigments. However, they maintained the high maximum quantum yield of PSII. Notably, the 800 µmol mol−1 CO2 treatment clustered distinctly as optimal for nutritional quality, with the highest relative abundances of vitamin C, soluble protein, and total phenolics, alongside improved growth parameters in both cultivars.
Regarding the amino acid profiles (Figure 8), hierarchical clustering demonstrated a contrasting trend. In both kale cultivars, the 1200 µmol mol−1 CO2 treatment formed a distinct cluster characterized by the lowest overall amino acid accumulation. Conversely, the 400 µmol mol−1 CO2 treatment generally resulted in the highest amino acid concentrations, with glutamic acid and aspartic acid being particularly abundant (Figure 8A,B). The 800 µmol mol−1 CO2 treatment exhibited intermediate levels, maintaining relatively higher concentrations of essential amino acids than the 1200 µmol mol−1 level.

3.9. Economic Analysis

The economic feasibility of cultivating both kale cultivars under varying CO2 concentrations was analyzed. The production cost per plant for both ‘Curly Kale’ and ‘Red Ursa’ increased as CO2 levels escalated, ranging from 1.89 to 2.22 USD plant−1 and 1.93 to 2.26 USD plant−1, respectively. While total expenditure increased with higher gas consumption, the unit production cost per weight revealed distinct cultivar-dependent trends. In ‘Curly Kale’, the unit production cost was reduced from 28.16 USD kg−1 at ambient CO2 (400 µmol mol−1) to 12.53–17.79 USD kg−1 at the elevated CO2 (800–1200 µmol mol−1). Conversely, ‘Red Ursa’ maintained the stable unit production cost among varying CO2 concentrations ranging from 17.36 to 19.83 USD kg−1 (Table 4).

4. Discussion

4.1. Elevated CO2 Concentrations Enhance the Growth and Yield of Kale Plants

The increasing of CO2 during plant growth can improve several plant physiology-related aspects. Elevated CO2 in the plant factory increased the number of leaves, stem height, and canopy width (Figure 1), resulting in larger kale plants in both cultivars compared to ambient CO2 (Figure 2). This finding aligns with previous studies, indicating that elevated CO2 (800–1600 µmol mol−1) could promote plant growth rates, such as the number of leaves, stem height, and stem diameter in vegetables by approximately 10–30% [37] and markedly stimulated vegetative growth, increasing assimilation rate (25–42%), dry-weight growth (29–38%) and yield (34–44%) compared with ambient CO2 [14]. In addition, elevated CO2 at 800 µmol mol−1 also significantly enhanced growth in pak choi, producing taller plants with larger and more numerous leaves, indicating a clear increase in vegetative biomass compared with ambient CO2 [38].
However, our results revealed that kale growth responses were highly cultivar dependent. For example, ‘Curly Kale’ exhibited a robust and continuous response to maximum enrichment, achieving its highest shoot fresh weight and dry weight at 1200 µmol mol−1 CO2 (Table 1). In contrast, ‘Red Ursa’ displayed a more transient response; while CO2 effectiveness was evident early in the growth cycle (up to 7–21 DAT), the differences in stem height and shoot weight became nonsignificant by the end of the experiment (35–42 DAT) (Table 1, Figure 1E). This distinct variation between cultivars is consistent with Wheeler et al. [39], who observed that while the ‘Red Russian’ (Brassica oleracea var. viridis) cultivar showed a significant yield increase under 1000–1200 µmol mol−1 CO2, the ‘Toscano’ (Brassica oleracea var. palmifolia) cultivar showed no significant biomass change.
Beyond biomass, morphological differences also emerged between the two tested cultivars. ‘Red Ursa’ consistently possessed longer petioles than ‘Curly Kale’ (Figure 2). The rapid growth under CO2 enrichment could result in more brittle and fragile petioles due to increased water uptake [40], a trait more pronounced in the structure of ‘Red Ursa’. Despite these morphological differences, the overall yield of kale, including fresh and dry weight, showed a positive relationship with increasing CO2 concentrations (Table 1). These results align with the well-established role of elevated CO2 in enhancing sugar synthesis [41], photosynthesis, and biomass accumulation through increased carbon assimilation [14]. In contrast, the root weight of ‘Curly Kale’ and ‘Red Ursa’ kale significantly increased under 1200 µmol mol−1 CO2 (Table 1). This suggests that both kale cultivars might allocate more assimilates to root growth under elevated CO2, possibly as an adaptive response related to their genetic characteristics [42].

4.2. Elevated CO2 Concentrations Enhance Carbon Assimilation and Pigment Accumulation

CO2 is essential for photosynthesis, promoting food production, growth, and yield in Chinese kale [24]. Growing kale under 1200 µmol mol−1 CO2 enhanced the photosynthesis rate in both cultivars (Figure 3A), which was consistent with Dwivedi [43], who reported an increased photosynthetic rate under elevated CO2, particularly in upper canopy leaves. Lupitu et al. [15] also reported that increased CO2 can enhance photosynthetic rate and water use efficiency in plants of the Brassicaceae family, including kale and cabbage. Higher CO2 enhances Rubisco carboxylation efficiency and reduces photorespiration [44]. On the other hand, higher CO2 concentrations were found to reduce transpiration and the light compensation point, allowing plants to use light and water more efficiently [3]. This is further supported by the light response curve estimated at the 1200 µmol mol−1 CO2, which revealed that ‘Curly Kale’ achieved a lower light compensation point than ‘Red Ursa’ (Table S1). This indicated that under maximum CO2 enrichment, ‘Curly Kale’ possesses a superior physiological adaptation for efficient light utilization in the low-light environment of the PFAL. Furthermore, to characterize the photosynthetic dynamics and assess potential acclimation, leaf gas exchange was also monitored at 20 DAT (Figure S2). The results at this earlier stage revealed a consistent enhancement of Pn and gs that closely mirrored the observations at 41 DAT. This sustained photosynthetic performance suggests that the plants effectively managed the increased carbon supply throughout the cultivation period, avoiding the significant photosynthetic down-regulation often reported in prolonged high-CO2 studies.
In closed PFAL systems, vegetables are commonly cultivated under moderate light intensities of approximately 130–250 µmol m−2s−1 to balance photosynthetic performance and electrical energy efficiency, while a modern PFAL system employs a lower light intensity of about 100–150 µmol m−2s−1 [8]. Although the light intensity in our study (200 µmol m−2s−1) aligns with these standard commercial practices, the results were obtained under the elevated CO2 concentration of 1200 µmol mol−1 CO2, suggesting a shifting threshold for light energy demand. At this high carbon availability, the assimilatory power for ATP and NADPH [45] might be preferentially allocated to rapid biomass expansion, potentially reaching a metabolic trade-off point for secondary metabolite synthesis. This interaction highlights an important equilibrium between carbon supply and light energy for maintaining kale’s functional food quality. Consequently, to fully exploit the benefits of super-elevated CO2 without compromising nutritional density, future PFAL optimizations may necessitate a proportional increase in light intensity to ensure sufficient energy supply for both rapid growth and the biosynthesis of bioactive compounds. Furthermore, the significant increase in Pn despite stable ETR and Y(II) at 1200 µmol mol−1 CO2 (Figure 3 and Figure 4) could be explained by the redirection of the electron sink. Elevated CO2 likely suppressed photorespiration [44], allowing the plant to reallocate light energy more efficiently toward carbon fixation without increasing the total electron transport rate. These findings suggest that future PFAL optimizations could involve fine-tuning the light-to-CO2 ratio to further enhance nutritional density alongside high yields.
Regarding leaf gas exchange, the responses under enrichment revealed more complex dynamics. This study showed that elevated CO2 increased gs and E of kale plants (Figure 3B,C), which was inconsistent with He et al. [3]. The reliability of these measurements was confirmed by the consistency of gs patterns observed at both 20 DAT (Figure S2B) and 41 DAT (Figure 3B), demonstrating a stable physiological response throughout the growth cycle. This discrepancy might be because in high-humidity and well-watered conditions like a PFAL, plants might maintain or increase gs to support transpiration and nutrient uptake, while still benefiting from elevated CO2 [46]. Furthermore, anatomical observations in this study revealed that ‘Curly Kale’ grown under 800 µmol mol−1 CO2 had a higher stomatal density than under 400 µmol mol−1 CO2 (Figure S2C). The increase in stomatal density provides a structural basis for enhanced gas exchange capacity, allowing plants to maintain high stomatal conductance levels [47]. This suggests that elevated CO2 promoted the development of new leaves with inherently higher gas exchange capacity. The increase in Pn and E led to an increase in WUE in kale plants grown under high CO2 concentrations (Figure 3D). Improved water use efficiency under elevated CO2 concentrations might result from the increase in root growth [48], which is consistent with the increase in root biomass in this study (Table 1). In contrast to the gas exchange performance, growing kale under higher CO2 concentrations did not affect the light-use efficiency of the photosystem II (Figure 4), indicating that the increased photosynthesis rate under elevated CO2 is due to physiological changes related to stomata rather than non-stomatal physiological changes [44].
Both kale cultivars showed a significant rise in total chlorophyll under 1200 µmol mol−1 CO2 (Table 2), consistent with studies linking elevated CO2 to enhanced chloroplast development and photosynthetic capacity [49]. Elevated CO2 levels can boost chlorophyll production, improving a plant’s light absorption and energy use efficiency [50]. Several studies have reported that elevated CO2 levels can increase chlorophyll content in vegetables [37]. For example, 800 µmol mol−1 CO2 stimulated chlorophyll synthesis in Chinese cabbage [3], increased photosynthesis and chlorophyll content in tomatoes [51], and enhanced chlorophyll levels in C3 plants such as soybeans [52]. In addition, the Chl a-to-Chl b ratio reflects photosystem composition and adaptation to environmental conditions [53]. Its decrease in kale plants under 800 µmol mol−1 CO2 (Table 2) suggests that elevated CO2 may induce mild stress or trigger plant senescence [54]. Furthermore, both kale cultivars showed a significant increase in carotenoid content and in the carotenoid-to-chlorophyll ratio under elevated CO2 (Table 3). Carotenoids play a crucial role not only in light harvesting but also in photoprotection by quenching reactive oxygen species generated under stress conditions [55]. Carotenoid accumulation under elevated CO2 indicates the enhancement of photoprotection, helping mitigate oxidative damage from increased photosynthetic activity [56].

4.3. Elevated CO2 Concentrations Alter Some Spectral Indices

Leaf reflectance measurements are used to calculate spectral indices, which are used to monitor plant health and growth, reflecting biomass and stress levels. NDVI and NDRE could be used to monitor physiological stress in plants. High NDVI indicates healthy plants with low stress, while low NDRE indicates low stress environments [57]. This study found that elevated CO2 did not affect NDVI or NDRE in ‘Curly Kale’ (Figure 5A,B), indicating that kale plants grown under high CO2 concentration stayed healthy.
In addition, some spectral indices can reflect phytochemical content and photosynthetic pigments in plants. NPQI has been described as an index associated with chlorophyll degradation and vegetation stress responses, capturing changes in pigment stability within leaf tissues [58]. Our results showed that kale plants grown under 800 and 1200 µmol mol−1 CO2 exhibited increased NPQI in both cultivars (Figure 5C), suggesting that elevated CO2 may modulate chlorophyll stability via shifts in pigment turnover. Although not directly quantified in the present study, the antioxidant enzyme system and the expression of related synthesis genes are likely crucial to these physiological shifts. Future investigations into these biochemical mechanisms would further enhance the understanding of how CO2 enrichment preserves the integrity of the photosynthetic apparatus. Similarly, Gamon et al. [59] reported that a high PRI indicates high photosynthetic light-use efficiency, which is associated with enhanced transformation dynamics of carotenoid pigments within leaf tissues at 531 nm. Moreover, PRI is also sensitive to xanthophyll-cycle dynamics and is widely used as an optical indicator of photosynthetic light-use efficiency. Our results showed that PRI increased under elevated CO2 relative to ambient CO2 in the ‘Red Ursa’ cultivar (Figure 5D), indicating enhanced photosynthetic light-use efficiency in this cultivar.
Furthermore, healthy plants with low stress and efficient photosynthesis and water use typically exhibit high WI. The WI is associated with the water-absorption feature near 970 nm and correlates with plant water status [60]. In this experiment, ‘Curly Kale’ under elevated CO2 showed high WI (Figure 5E), indicating efficient water use, consistent with Hou et al. [38], who reported a 1.62% increase in water content in Chinese flowering cabbage grown under 800 µmol mol−1 CO2.

4.4. Elevated CO2 Concentrations Have Both Positive and Negative Effects on Nutritional Values

Growing kale under 800 µmol mol−1 CO2 increased vitamin C content (Figure 6A), consistent with Muthusamy et al. [61], who reported that elevated CO2 enhances vitamin C synthesis in radishes and red radishes. Elevated CO2 influences the expression of genes involved in vitamin C synthesis, enhancing antioxidant properties by increasing superoxide dismutase activity and reducing hydrogen peroxide levels. In addition, high CO2 levels of more than 700 µmol mol−1 stimulated the activity of enzyme-related L-ascorbic acid biosynthesis in Chinese cabbage [61]. However, the drastic reduction in vitamin C content observed at 1200 µmol mol−1 CO2 (Figure 6A) suggested a threshold beyond which excessive carbon availability might suppress ascorbic acid synthesis or enhance its degradation due to an altered redox balance. This is consistent with the findings of Mamatha et al. [62], who reported that an increase in atmospheric CO2 concentration from 550 to 700 µmol mol−1 reduced ascorbic acid accumulation in tomatoes by up to 10%. The decrease in vitamin C in kales grown under 1200 µmol mol−1 CO2 might cause from a metabolic trade-off within the Smirnoff–Wheeler pathway [63]. In addition, GDP-sugars such as GDP-mannose and GDP-L-galactose serve dual roles in both ascorbate synthesis and cell wall construction. Rapid biomass expansion at 1200 µmol mol−1 CO2 prioritized these precursors for structural development, leading to a shortage of vitamin C conversion. Furthermore, elevated CO2 may down-regulate VTC2, which is the rate-limiting step of vitamin C biosynthesis [63].
Growing kale plants under 800 µmol mol−1 resulted in the highest soluble protein and total phenolic content in both kale cultivars (Figure 6B,C). Improved photosynthesis and secondary metabolite accumulation in plants were observed under high CO2 concentration [64]. Elevated CO2 boosts photosynthesis by increasing RubisCO and related enzyme activity, potentially raising soluble protein levels, as RubisCO is the most abundant soluble protein in plants [65]. In the present study, although both 800 and 1200 µmol mol−1 CO2 significantly enhanced soluble protein compared to the ambient control, the slight declining trend observed at 1200 µmol mol−1 (Figure 6B) suggested the initial manifestation of a dilution effect. This observation was consistent with the meta-analysis by Ekele et al. [66] in kale, which indicated that while CO2 enrichment promotes kale biomass, concentrations exceeding 1300 µmol mol−1 could lead to a relative reduction in protein density as the rate of carbon assimilation outpaces nitrogen uptake, effectively diluting the nutritional quality within the expanded biomass.
In addition, the high contents of phenolics under an elevated CO2 concentration in kales were consistent with a report by Goufo et al. [67], who found that increasing CO2 above normal atmospheric levels (550 µmol mol−1) had complex effects on phenolic production in rice. Initially, carbon was used for growth and protein production, but as growth slowed, excess carbon was allocated to phenolic production, affecting nutritional quality and chemical properties. Conversely, increasing CO2 levels above normal atmospheric levels could reduce nitrate accumulation in kales (Figure 6D). The elevated CO2 (e.g., 780 µmol mol−1) could decrease plant nitrate uptake, leading to reduced nitrate accumulation in plants [68]. Dong et al. [37] reported that higher CO2 levels reduced nitrate content in leafy vegetables by about 18%, likely due to accelerated conversion of nitrate to other nitrogen compounds such as proteins or ammonium. High nitrate accumulation is one of the primary health concerns associated with leafy green consumption [69,70]. Although the European Commission has not yet specified a nitrate limit for kale, the levels observed in this study (Figure 6D) largely remained below the 7000 mg kg−1 FW (7 mg g−1 FW) threshold established for rucola. This suggests that kale cultivated under elevated CO2 in PFAL systems remains within acceptable safety limits for international markets, including the European Union [23]. In addition, nitrate content in kale grown in PFAL can be reduced by supplementing 5–15 W m−2 UV-A [28]. Thus, combining elevated CO2 with UV-A exposure may synergistically lower nitrate accumulation.

4.5. Elevated CO2 Concentrations Dramatically Reduced Amino Acids in Kales

This study examined the effect of elevated CO2 on amino acid composition in two kale cultivars and found significant reductions in essential, non-essential, and total amino acids (Table 3). When CO2 concentrations in the atmosphere were excessively high, plants fixed carbon through photosynthesis more efficiently, resulting in the increase in sugar production for plant growth. This is consistent with the findings of Dong et al. [37], who reported that elevated CO2 increased the concentrations of fructose, glucose, and total soluble sugars in leafy vegetables. However, nitrogen uptake might not increase at the same rate, potentially leading to a carbon-to-nitrogen (C/N) imbalance in plants. While nitrogen status and specific enzyme activities were not directly quantified in this study, the observed reductions in amino acid concentrations are consistent with the findings of Pal et al. [71], who observed that elevated CO2 enhanced photosynthesis and growth but did not proportionally increase nitrogen uptake, resulting in a 39% reduction in nitrogen content in wheat tissues compared to a normal atmospheric CO2 level. Furthermore, it is hypothesized that elevated CO2 could reduce the activity of nitrogen uptake-related enzymes such as nitrate reductase, which could lead to decreased amino acid synthesis, as reported in Arabidopsis [72].
Beyond reductions in total amounts, elevated CO2 also induced shifts in amino acid profiles, which were notably cultivar-dependent (Table 3). In ‘Red Ursa’, the 800 µmol mol−1 CO2 treatment resulted in the highest proportion of non-essential amino acids-to-total amino acids, whereas ‘Curly Kale’ maintained a relatively more stable ratio of either essential amino acids or non-essential amino acids-to-total amino acids across treatments. These compositional changes suggest that CO2 enrichment not only affected amino acid levels but also modulated the internal balance among amino acid groups. Although variables such as carbon sink competition were not explicitly measured, these findings align with the reported phenomenon where greater carbon assimilation outpaces nitrogen uptake [66]. In addition, this study found that glycine, threonine, and histidine remained stable in both kale cultivars, whereas serine and glutamic acid increased only in ‘Red Ursa’ under 800 µmol mol−1 CO2. Glycine and serine, linked to photorespiration and one-carbon metabolism, are less suppressed under elevated CO2 [73]. Threonine shares pathways with other amino acids and responds moderately to C/N shifts [74]. Histidine, though costly to synthesize, supports protein stability and stress responses [75]. Glutamic acid, central to nitrogen metabolism and the GABA shunt, helps maintain amino acid homeostasis [76]. These findings suggest that certain amino acids might be more resilient to CO2-induced metabolic shifts due to their central physiological roles.

4.6. Economic Feasibility and the Nutritional Integrity of Kale as a Superfood

The market value of kale as a superfood is fundamentally predicated on its dense nutritional profile and high concentrations of bioactive compounds [2]. While the implementation of CO2 enrichment in PFAL systems is primarily driven by the goal of maximizing commercial output, our findings highlight a critical superfood paradox in which rapid biomass accumulation conflicts with nutritional density. In this study, although the 1200 µmol mol1 CO2 treatment achieved the lowest unit production cost for ‘Curly Kale’ (Table 4), this economic gain was significantly offset by the degradation of the bioactive compound. In contrast, for ‘Red Ursa’, the 1200 µmol mol−1 CO2 resulted in an escalation of unit production costs compared to the 400 and 800 µmol mol1 levels (Table 4). This occurred because the marginal yield gains at elevated CO2 concentrations were insufficient to offset the increased costs of gas consumption, making super-elevated enrichment economically inefficient for this cultivar. From a commercial and regulatory perspective, profitability in the functional food sector must prioritize nutritional integrity and compliance over simple volume [4]. The drastic 80% reduction in vitamin C observed at 1200 µmol mol1 CO2 (Figure 6A) and the decline in amino acid contents in kale grown under elevated CO2 might raise concerns about maintaining high nutrient density, a key attribute for kale’s classification as a superfood in the functional food market. This level provided a substantial reduction in unit production costs compared to ambient conditions while successfully preserving essential active substances such as ascorbic acid, soluble proteins, and phenolics (Table 4, Figure 6). Furthermore, this moderate enrichment level effectively maintains lower nitrate accumulation, addressing a primary health concern for leafy greens [64,65]. By shifting the operational target from maximum quantity to optimal nutritional density at 800 µmol mol1 CO2, PFAL operators could ensure that kale retains its premium superfood status and fulfills consumer demand for functional produce. Future research will focus on refining this response curve with narrower CO2 concentration gradients, particularly within the 600–1000 µmol mol−1 range, to precisely establish the threshold for various kale cultivars and/or other leafy vegetables. This optimized cultivation technology is currently being transferred to the private sector to scale up kale production in larger-scale PFAL for the functional food industry.

5. Conclusions

CO2 enrichment significantly affected the growth, gas exchange rate, and nutritional quality of kale plants grown in the plant factory with artificial lighting. While 1200 µmol mol−1 CO2 enhanced growth and yield, it dramatically reduced important nutrients such as vitamin C and amino acids. In contrast, 800 µmol mol−1 CO2 improved growth, increased phytonutrient and soluble protein content, and reduced nitrate accumulation without compromising overall nutritional value. Therefore, among the tested gradients, 800 µmol mol−1 CO2 is recommended as the most effective level to maximize yields, quality, and economic feasibility for kale production in controlled-environment agriculture.

Supplementary Materials

The following supporting information can be downloaded at: https://www.mdpi.com/article/10.3390/horticulturae12050621/s1, Figure S1: The light response curve of ‘Curly Kale’ and ‘Red Ursa’ grown under 1200 µmol mol−1 CO2; Figure S2. Changes the net photosynthetic rate (Pn) (A) and stomatal conductance (gs) (B) of ‘Curly Kale’ and ‘Red Ursa’ kale grown under different levels of CO2 at 20 days after transplanting (DAT). Representative microscopic images showing stomatal density on the abaxial leaf surface of ‘Curly Kale’ grown under 400 (C) and 800 µmol mol−1 CO2 (D) at 3 DAT. Data are means ± SD, as shown by vertical error bars. Means with the same lowercase letter are not significantly different according to Tukey’s HSD test at p < 0.05. ns means nonsignificant; Table S1: Photosynthetic and carboxylation parameters estimated from light and CO2 response curves for two kale cultivars grown under 1200 µmol mol−1 CO2.

Author Contributions

Conceptualization, M.S. and J.T.; methodology, W.S., N.T. and J.T.; software, M.K.; validation, M.K., W.S., M.S. and J.T.; formal analysis, M.K. and J.T.; investigation, M.K. and G.M.; resources, W.S. and G.M.; data curation, M.K., N.T. and G.M.; writing—original draft preparation, M.K.; writing—review and editing, P.B., N.T. and J.T.; visualization, M.K. and N.T.; supervision, J.T.; project administration, J.T.; funding acquisition, P.B. and J.T. All authors have read and agreed to the published version of the manuscript.

Funding

This research was funded by the Kasetsart University Research and Development Institute (KURDI), Bangkok, Thailand (Project No. FF(S-KU)4.66). This research was funded by Kasetsart University, Bangkok, Thailand, through the Graduate School Fellowship Program. Additional financial support was provided by the Office of the Ministry of Higher Education, Science, Research and Innovation, and the Thailand Science Research and Innovation through the Kasetsart University Reinventing University Program 2024.

Data Availability Statement

The original contributions presented in this study are included in the article/Supplementary Material. Further inquiries can be directed to the corresponding authors.

Conflicts of Interest

The authors declare no conflicts of interest.

References

  1. Cheng, F.; Wu, J.; Cai, C.; Fu, L.; Liang, J.; Borm, T.; Zhuang, M.; Zhang, Y.; Zhang, F.; Bonnema, G.; et al. Genome resequencing and comparative variome analysis in a Brassica rapa and Brassica oleracea collection. Sci. Data 2016, 3, 160119. [Google Scholar] [CrossRef] [PubMed]
  2. Šamec, D.; Urlić, B.; Salopek-Sondi, B. Kale (Brassica oleracea var. acephala) as a superfood: Review of the scientific evidence behind the statement. Crit. Rev. Food Sci. Nutr. 2019, 59, 2411–2422. [Google Scholar] [CrossRef]
  3. He, R.; Zhang, Y.; Song, S.; Su, W.; Hao, Y.; Liu, H. UV-A and FR irradiation improves growth and nutritional properties of lettuce grown in an artificial light plant factory. Food Chem. 2021, 345, 128727. [Google Scholar] [CrossRef] [PubMed]
  4. Khalid, W.; Iqra; Afzal, F.; Rahim, M.A.; Abdul Rehman, A.; Faiz ul Rasul, H.; Arshad, M.S.; Ambreen, S.; Zubair, M.; Safdar, S.; et al. Industrial applications of kale (Brassica oleracea var. sabellica) as a functional ingredient: A review. Int. J. Food Prop. 2023, 26, 489–501. [Google Scholar] [CrossRef]
  5. Ayaz, F.A.; Glew, R.H.; Millson, M.; Huang, H.S.; Chuang, L.T.; Sanz, C.; Hayirlioglu-Ayaz, S. Nutrient contents of kale (Brassica oleraceae L. var. acephala DC.). Food Chem. 2006, 96, 572–579. [Google Scholar] [CrossRef]
  6. National Institutes of Health Office of Dietary Supplements. Dietary Supplement Label Database. 2026. Available online: https://dsld.od.nih.gov/.
  7. Łukaszyk, A.; Kwiecień, I.; Kanik, A.; Blicharska, E.; Tatarczak-Michalewska, M.; Białowąs, W.; Czarnek, K.; Szopa, A. Nutritional, Therapeutic, and Functional Food Perspectives of Kale (Brassica oleracea var. acephala): An Integrative Review. Molecules 2025, 30, 4214. [Google Scholar] [CrossRef]
  8. Kozai, T. Smart Plant Factory: The Next Generation Indoor Vertical Farms; Springer: Singapore, 2018. [Google Scholar]
  9. Mandriota, L.; Blanco, I.; Scarascia-Mugnozza, G. Plant Factory with Artificial Lighting: Innovation Technology for Sustainable Agriculture Production. In Biosystems Engineering Towards the Green Deal; Springer: Cham, Switzerland, 2023; Volume 337, pp. 1163–1172. [Google Scholar]
  10. Terlaje, T.; Tuquero, J. Growing Kale Brassica oleracea. Nativ. Plants Guam 2018, FS016-19, 1–5. [Google Scholar]
  11. Liu, K.; Gao, M.; Jiang, H.; Ou, S.; Li, X.; He, R.; Li, Y.; Liu, H. Light Intensity and Photoperiod Affect Growth and Nutritional Quality of Brassica Microgreens. Molecules 2022, 27, 883. [Google Scholar] [CrossRef]
  12. Huang, L.C. Consumer attitude, concerns, and brand acceptance for the vegetables cultivated with sustainable plant factory production systems. Sustainability 2019, 11, 4862. [Google Scholar] [CrossRef]
  13. Myers, S.S.; Zanobetti, A.; Kloog, I.; Huybers, P.; Leakey, A.D.B.; Bloom, A.J.; Carlisle, E.; Dietterich, L.H.; Fitzgerald, G.; Hasegawa, T.; et al. Rising CO2 threatens human nutrition. Nature 2014, 510, 139–142. [Google Scholar] [CrossRef]
  14. Chen, D.; Mei, Y.; Liu, Q.; Wu, Y.; Yang, Z. Carbon dioxide enrichment promoted the growth, yield, and light-use efficiency of lettuce in a plant factory with artificial lighting. Agron. J. 2021, 113, 5196–5206. [Google Scholar] [CrossRef]
  15. Lupitu, A.; Moisa, C.; Gavrila, S.; Copolovici, D.M.; Copolovici, L.; Dochia, M.; Chambre, D.; Ciutin, V. The Influence of Elevated CO2 on Volatile Emissions, Photosynthetic Characteristics, and Pigment Content in Brassicaceae Plants Species and Varieties. Plants 2022, 11, 973. [Google Scholar] [CrossRef] [PubMed]
  16. Dou, H.; Niu, G.; Gu, M.; Masabni, J.G. Effects of light quality on growth and phytonutrient accumulation of herbs under controlled environments. Horticulturae 2017, 3, 36. [Google Scholar] [CrossRef]
  17. Tomimatsu, H.; Tang, Y. Effects of high CO2 levels on dynamic photosynthesis: Carbon gain, mechanisms, and environmental interactions. J. Plant Res. 2016, 129, 365–377. [Google Scholar] [CrossRef]
  18. Mosaleeyanon, K. Current Situation, Direction, Policy Support, and Challenges of Plant Factories with Artificial lighting (PFAL) in Thailand. FFTC J. Agric. Policy 2022, 3, 46–56. [Google Scholar] [CrossRef]
  19. Kozai, T.; Niu, G. Plant Factory as a Resource-Efficient Closed Plant Production System; Elsevier Inc.: Amsterdam, The Netherlands, 2015. [Google Scholar]
  20. Royal Thai Government Gazette. 2022. Available online: https://www.ratchakitcha.soc.go.th/DATA/PDF/2564/E/031/T_0024.PDF (accessed on 21 March 2026). (In Thai)
  21. Renna, M.; Stellacci, A.M.; Corbo, F.; Santamaria, P. The use of a nutrient quality score is effective to assess the overall nutritional value of three brassica microgreens. Foods 2020, 9, 1226. [Google Scholar] [CrossRef]
  22. EFSA Panel on Dietetic Products, Nutrition, and Allergies (NDA). Scientific Opinion on Dietary Reference Values for vitamin A. EFSA J. 2015, 13, 4028. [CrossRef]
  23. European Commission. Regulation Statement on Possible Public Health Risks for Infants and Young Children from the Presence of Nitrates in Leafy Vegetables; European Commission: Brussels, Belgium, 2011. [Google Scholar]
  24. Chowdhury, M.; Kiraga, S.; Islam, M.N.; Ali, M.; Reza, M.N.; Lee, W.H.; Chung, S.O. Effects of temperature, relative humidity, and carbon dioxide concentration on growth and glucosinolate content of kale grown in a plant factory. Foods 2021, 10, 1524. [Google Scholar] [CrossRef]
  25. Hori, H. Gravel Culture of Vegetable and Ornamental Crops; OCLC No. 673083780; Youkendo Co., Ltd.: Tokyo, Japan, 1966; pp. 60–80. [Google Scholar]
  26. Chrysargyris, A.; Petropoulos, S.A.; Fernandes, Â.; Barros, L.; Tzortzakis, N.; Ferreira, I.C.F.R. Effect of phosphorus application rate on Mentha spicata L. grown in deep flow technique (DFT). Food Chem. 2019, 276, 84–92. [Google Scholar] [CrossRef] [PubMed]
  27. Chrysargyris, A.; Nikolaidou, E.; Stamatakis, A.; Tzortzakis, N. Vegetative, physiological, nutritional and antioxidant behavior of spearmint (Mentha spicata L.) in response to different nitrogen supply in hydroponics. J. Appl. Res. Med. Aromat. Plants 2017, 6, 52–61. [Google Scholar] [CrossRef]
  28. Sonjaroon, W.; Tepkaew, T.; Kupia, M.; Tongkok, P.; Boonkorkaew, P.; Thussagunpanit, J. Pre-Harvest UV-A Supplementation in Plant Factory with Artificial Lighting Improves Growth, Photosynthesis, and Phytonutrients in Kale. Horticulturae 2024, 10, 701. [Google Scholar] [CrossRef]
  29. Maxwell, K.; Johnson, G.N. Chlorophyll Fluorescence—A Practical Guide. J. Exp. Bot. 2000, 51, 659–668. [Google Scholar] [CrossRef]
  30. Porra, R.J.; Thompson, W.A.; Kriedemann, P.E. Determination of accurate extinction coefficients and simultaneous equations for assaying chlorophylls a and b extracted with four different solvents: Verification of the concentration of chlorophyll standards by atomic absorption spectroscopy. BBA—Bioenerg. 1989, 975, 384–394. [Google Scholar] [CrossRef]
  31. Wellburn, A.R. The spectral determination of chlorophylls a and b, as well as total carotenoids, using various solvents with spectrophotometers of different resolution. J. Plant Physiol. 1994, 144, 307–313. [Google Scholar] [CrossRef]
  32. Bradford, M.M. A rapid and sensitive method for the quantitation of microgram quantities of protein utilizing the principle of protein-dye binding. Anal. Biochem. 1976, 72, 248–254. [Google Scholar] [CrossRef]
  33. Ağlar, E.; Saraçoğlu, O. Role of the foliar fertilization treatments on quality attributes of sweet cherry fruits (Prunus avium). Akad. Ziraat Derg. 2018, 7, 131–136. [Google Scholar] [CrossRef]
  34. Parks, S.E.; Irving, D.E.; Milham, P.J. A critical evaluation of on-farm rapid tests for measuring nitrate in leafy vegetables. Sci. Hortic. 2012, 134, 1–6. [Google Scholar] [CrossRef]
  35. Tepe, B.; Sokmen, A. Screening of the antioxidative properties and total phenolic contents of three endemic Tanacetum subspecies from Turkish flora. Bioresour. Technol. 2007, 98, 3076–3079. [Google Scholar] [CrossRef] [PubMed]
  36. Chrysargyris, A.; Papakyriakou, E.; Petropoulos, S.A.; Tzortzakis, N. The combined and single effect of salinity and copper stress on growth and quality of Mentha spicata plants. J. Hazard. Mater. 2019, 368, 584–593. [Google Scholar] [CrossRef]
  37. Dong, J.; Gruda, N.; Lam, S.K.; Li, X.; Duan, Z. Effects of elevated CO2 on nutritional quality of vegetables: A review. Front. Plant Sci. 2018, 9, 924. [Google Scholar] [CrossRef]
  38. Hou, L.; Shang, M.; Chen, Y.; Zhang, J.; Xu, X.; Song, H.; Zheng, S.; Li, M.; Xing, G. Physiological and molecular mechanisms of elevated CO2 in promoting the growth of pak choi (Brassica rapa ssp. chinensis). Sci. Hortic. 2021, 288, 110318. [Google Scholar] [CrossRef]
  39. Wheeler, R.M.; Spencer, L.S.E.; Bhuiyan, R.H.; Mickens, M.A.; Bunchek, J.M.; van Santen, E.; Massa, G.D.; Romeyn, M.W. Effects of elevated and super-elevated carbon dioxide on salad crops for space. J. Plant Interact. 2024, 19, 2292219. [Google Scholar] [CrossRef]
  40. Ferrio, J.P.; Pou, A.; Florez-Sarasa, I.; Gessler, A.; Kodama, N.; Flexas, J.; Ribas-Carbó, M. The Péclet effect on leaf water enrichment correlates with leaf hydraulic conductance and mesophyll conductance for CO2. Plant Cell Environ. 2012, 35, 611–625. [Google Scholar] [CrossRef]
  41. Zheng, Y.; Li, F.; Hao, L.; Yu, J.; Guo, L.; Zhou, H.; Ma, C.; Zhang, X.; Xu, M. Elevated CO2 concentration induces photosynthetic down-regulation with changes in leaf structure, non-structural carbohydrates and nitrogen content of soybean. BMC Plant Biol. 2019, 19, 255. [Google Scholar] [CrossRef] [PubMed]
  42. Sharma, N.; Sinha, P.G.; Bhatnagar, A.K. Effect of elevated [CO2] on cell structure and function in seed plants. Clim. Chang. Environ. Sustain. 2014, 2, 69. [Google Scholar] [CrossRef]
  43. Dwivedi, N. The interactive effect of the elevated CO2 and moisture stress on the photosynthesis in Brassica leaves at different canopy positions. Agronomy 2012, 1, 273–276. [Google Scholar]
  44. Ainsworth, E.A.; Rogers, A. The response of photosynthesis and stomatal conductance to rising [CO2]: Mechanisms and environmental interactions. Plant Cell Environ. 2007, 30, 258–270. [Google Scholar] [CrossRef] [PubMed]
  45. Farquhar, G.; von Caemmerer, S.; Berry, J.A. A Biochemical Model of Photosynthetic CO2 Assimilation in Leaves of C3 Species. Planta 1980, 149, 78–90. [Google Scholar] [CrossRef]
  46. Xu, Z.; Jiang, Y.; Jia, B.; Zhou, G. Elevated-CO2 response of stomata and its dependence on environmental factors. Front. Plant Sci. 2016, 7, 657. [Google Scholar] [CrossRef]
  47. Franks, P.J.; Beerling, D.J. Maximum leaf conductance driven by CO2 effects on stomatal size and density over geologic time. Proc. Natl. Acad. Sci. USA 2009, 106, 10343–10347. [Google Scholar] [CrossRef]
  48. Mishra, R.S.; Abrol, Y.P.; Uprety, D.C. Interactive Effects of Elevated CO2 and Moisture Stress on the Photosynthesis, Water Relation and Growth of Brassica Species. J. Agron. Crop Sci. 1999, 182, 223–229. [Google Scholar] [CrossRef]
  49. Wang, M.; Xie, B.; Fu, Y.; Dong, C.; Hui, L.; Guanghui, L.; Liu, H. Effects of different elevated CO2 concentrations on chlorophyll contents, gas exchange, water use efficiency, and PSII activity on C3 and C4 cereal crops in a closed artificial ecosystem. Photosynth. Res. 2015, 126, 351–362. [Google Scholar] [CrossRef] [PubMed]
  50. Lamichaney, A.; Tewari, K.; Basu, P.S.; Katiyar, P.K.; Singh, N.P. Effect of elevated carbon-dioxide on plant growth, physiology, yield and seed quality of chickpea (Cicer arietinum L.) in Indo-Gangetic plains. Physiol. Mol. Biol. Plants 2021, 27, 251–263. [Google Scholar] [CrossRef] [PubMed]
  51. Zhou, R.; Yu, X.; Wen, J.; Jensen, N.B.; Dos Santos, T.M.; Wu, Z.; Rosenqvist, E.; Ottosen, C.O. Interactive effects of elevated CO2 concentration and combined heat and drought stress on tomato photosynthesis. BMC Plant Biol. 2020, 20, 260. [Google Scholar] [CrossRef] [PubMed]
  52. Greer, D.H. Leaf temperature and CO2 effects on photosynthetic CO2 assimilation and chlorophyll a fluorescence light responses during mid-ripening of Vitis vinifera cv. Shiraz grapevines grown in outdoor conditions. Funct. Plant Biol. 2022, 49, 659–671. [Google Scholar] [CrossRef]
  53. Gjindali, A.; Johnson, G.N. Photosynthetic acclimation to changing environments. Biochem. Soc. Trans. 2023, 51, 473–486. [Google Scholar] [CrossRef]
  54. Agüera, E.; De la Haba, P. Leaf senescence in response to elevated atmospheric CO2 concentration and low nitrogen supply. Biol. Plant. 2018, 62, 401–408. [Google Scholar] [CrossRef]
  55. Swapnil, P.; Meena, M.; Singh, S.K.; Dhuldhaj, U.P.; Harish; Marwal, A. Vital roles of carotenoids in plants and humans to deteriorate stress with its structure, biosynthesis, metabolic engineering and functional aspects. Curr. Plant Biol. 2021, 26, 100203. [Google Scholar] [CrossRef]
  56. Kunyawut, C.; Paopo, I.; Umpuch, C. Enhanced carotenoid accumulation in Chloroccocum humicola under controlled CO2 and light conditions. J. Genet. Eng. Biotechnol. 2025, 23, 100619. [Google Scholar] [CrossRef]
  57. Katsoulas, N.; Elvanidi, A.; Bartzanas, T.; Ferentinos, K.P.; Kittas, C. Sensing crop reflectance for water stress detection in greenhouses. Acta Hortic. 2018, 1197, 117–126. [Google Scholar] [CrossRef]
  58. Jiang, H.; Liu, Z.; Wang, J.; Yang, P.; Zhang, R.; Zhang, X.; Zheng, P. Combining Chlorophyll Fluorescence and Vegetation Reflectance Indices to Estimate Non-Photochemical Quenching (NPQ) of Rice at the Leaf Scale. Remote Sens. 2023, 15, 4222. [Google Scholar] [CrossRef]
  59. Gamon, J.A.; Peñuelas, J.; Field, C.B. A narrow-waveband spectral index that tracks diurnal changes in photosynthetic efficiency. Remote Sens. Environ. 1992, 41, 35–44. [Google Scholar] [CrossRef]
  60. Jiao, Q.; Liu, L.; Liu, J.; Zhang, H.; Zhang, B. Atmospherically resistant vegetation water indices using the 970-nm water absorption feature. J. Appl. Remote Sens. 2020, 14, 034504. [Google Scholar] [CrossRef]
  61. Muthusamy, M.; Hwang, J.E.; Kim, S.H.; Kim, J.A.; Jeong, M.J.; Park, H.C.; Lee, S.I. Elevated carbon dioxide significantly improves ascorbic acid content, antioxidative properties and restricted biomass production in cruciferous vegetable seedlings. Plant Biotechnol. Rep. 2019, 13, 293–304. [Google Scholar] [CrossRef]
  62. Mamatha, H.; Srinivasa Rao, N.K.; Laxman, R.H.; Shivashankara, K.S.; Bhatt, R.M.; Pavithra, K.C. Impact of elevated CO2 on growth, physiology, yield, and quality of tomato (Lycopersicon esculentum Mill) cv. Arka Ashish. Photosynthetica 2014, 52, 519–528. [Google Scholar] [CrossRef]
  63. Smirnoff, N.; Wheeler, G.L. The ascorbate biosynthesis pathway in plants is known, but there is a way to go with understanding control and functions. J. Exp. Bot. 2024, 75, 2604–2630. [Google Scholar] [CrossRef]
  64. Singh, A.; Agrawal, M. Effects of ambient and elevated CO2 on growth, chlorophyll fluorescence, photosynthetic pigments, antioxidants, and secondary metabolites of Catharanthus roseus (L.) G Don. grown under three different soil N levels. Environ. Sci. Pollut. Res. 2015, 22, 3936–3946. [Google Scholar] [CrossRef]
  65. Salesse-Smith, C.E.; Wang, Y.; Long, S.P. Increasing Rubisco as a simple means to enhance photosynthesis and productivity now without lowering nitrogen use efficiency. New Phytol. 2025, 245, 951–965. [Google Scholar] [CrossRef]
  66. Ekele, J.U.; Obaje, J.O.; Zajitschek, S.R.K.; Webster, R.J.; Perez de Heredia, F.; Lane, K.E.; Fadel, A.; Symonds, R.C. Effects of Elevated CO2 on Yield and Nutritional Quality of Kale and Spinach: A Meta-Analysis. Biology 2026, 15, 152. [Google Scholar] [CrossRef]
  67. Goufo, P.; Pereira, J.; Moutinho-Pereira, J.; Correia, C.M.; Figueiredo, N.; Carranca, C.; Rosa, E.A.S.; Trindade, H. Rice (Oryza sativa L.) phenolic compounds under elevated carbon dioxide (CO2) concentration. Environ. Exp. Bot. 2014, 99, 28–37. [Google Scholar] [CrossRef]
  68. Takatani, N.; Ito, T.; Kiba, T.; Mori, M.; Miyamoto, T.; Maeda, S.I.; Omata, T. Effects of high CO2 on growth and metabolism of Arabidopsis seedlings during growth with a constantly limited supply of nitrogen. Plant Cell Physiol. 2014, 55, 281–292. [Google Scholar] [CrossRef]
  69. Bian, Z.; Wang, Y.; Zhang, X.; Li, T.; Grundy, S.; Yang, Q.; Cheng, R. A Review of Environment Effects on Nitrate Accumulation in Leafy Vegetables Grown in Controlled Environments. Foods 2020, 9, 732. [Google Scholar] [CrossRef]
  70. Chrysargyris, A.; Tzortzakis, N. Optimising fertigation of hydroponically grown sowthistle (Sonchus oleraceus L.): The impact of the nitrogen source and supply concentration. Agric. Water Manag. 2023, 289, 108528. [Google Scholar] [CrossRef]
  71. Pal, M.; Rao, L.S.; Jain, V.; Srivastava, A.C.; Pandey, R.; Raj, A.; Singh, K.P. Effects of elevated CO2 and nitrogen on wheat growth and photosynthesis. Biol. Plant. 2005, 49, 467–470. [Google Scholar] [CrossRef]
  72. Du, S.; Zhang, R.; Zhang, P.; Liu, H.; Yan, M.; Chen, N.; Xie, H.; Ke, S. Elevated CO2-induced production of nitric oxide (NO) by NO synthase differentially affects nitrate reductase activity in Arabidopsis plants under different nitrate supplies. J. Exp. Bot. 2016, 67, 893–904. [Google Scholar] [CrossRef] [PubMed]
  73. Rosa-Téllez, S.; Alcántara-Enguídanos, A.; Martínez-Seidel, F.; Casatejada-Anchel, R.; Saeheng, S.; Bailes, C.L.; Erban, A.; Barbosa-Medeiros, D.; Alepúz, P.; Matus, J.T.; et al. The serine–glycine–one-carbon metabolic network orchestrates changes in nitrogen and sulfur metabolism and shapes plant development. Plant Cell 2024, 36, 404–426. [Google Scholar] [CrossRef]
  74. Zhang, Z.; Wu, Z. CO2 enhances low-nitrogen adaption by promoting amino acid metabolism in Brassica napus. Plant Physiol. Biochem. 2023, 201, 107864. [Google Scholar] [CrossRef] [PubMed]
  75. Stepansky, A.; Leustek, T. Histidine biosynthesis in plants. Amino Acids 2006, 30, 127–142. [Google Scholar] [CrossRef]
  76. Liao, H.S.; Chung, Y.H.; Hsieh, M.H. Glutamate: A multifunctional amino acid in plants. Plant Sci. 2022, 318, 111238. [Google Scholar] [CrossRef]
Figure 1. Changes in number of leaves, stem height, and canopy width of kale ‘Curly Kale’ (AC) and kale ‘Red Ursa’ (DF) grown under different levels of CO2 concentration at 7, 14, 21, 28 and 35 days after transplanting. Data are means ± SD, as shown by vertical error bars. Means with the same lowercase letter are not significantly different according to Tukey’s HSD test at p < 0.05.
Horticulturae 12 00621 g001
Figure 2. Characteristics at harvest grown under different levels of CO2 of the ‘Curly Kale’ (A) and ‘Red Ursa’ (B).
Horticulturae 12 00621 g002
Figure 3. Changes in the net photosynthetic rate (Pn) (A), stomatal conductance (gs) (B), transpiration rate (E) (C), and water use efficiency (WUE) (D) of ‘Curly Kale’ and ‘Red Ursa’ kale grown under different levels of CO2. Data are means ± SD, as shown by vertical error bars. Means with the same lowercase letter are not significantly different according to Tukey’s HSD test at p < 0.05. ns means nonsignificant.
Horticulturae 12 00621 g003
Figure 4. Changes in the maximum quantum yield of PSII (Fv/Fm) (A), the quantum efficiency of PSII (Y(II)) (B), the photochemical quenching (qP) (C), the non-photochemical quenching (NPQ) (D), and the electron transport rate (ETR) (E) of ‘Curly Kale’ and ‘Red Ursa’ kale. Data are means ± SD, as shown by vertical error bars. Data were analyzed according to Tukey’s HSD test at p < 0.05. ns means nonsignificant.
Horticulturae 12 00621 g004
Figure 5. Changes in the normalized difference vegetation index (NDVI) (A), the normalized difference red edge index (NDRE) (B), the normalized phaeophytinization index (NPQI) (C), the photochemical reflectance index (PRI) (D), and the water index (WI) (E) of ‘Curly Kale’ and ‘Red Ursa’ kale grown under different levels of CO2. Data are means ± SD, as shown by vertical error bars. Means with the same lowercase letter are not significantly different according to Tukey’s HSD test at p < 0.05. ns means nonsignificant.
Horticulturae 12 00621 g005
Figure 6. Vitamin C (A), soluble protein (B), total phenolics (C), and nitrate (D) contents in ‘Curly Kale’ and ‘Red Ursa’ kale grown under different levels of CO2. Data are means ± SD, as shown by vertical error bars. Means with the same lowercase letter are not significantly different according to Tukey’s HSD test at p < 0.05. ns means nonsignificant.
Horticulturae 12 00621 g006
Figure 7. Heat map analysis of yield, physiological responses, soluble protein, phytonutrient, and nitrate accumulation of the kale ‘Curly Kale’ (A) and ‘Red Ursa’ (B) grown under different levels of CO2 (400, 800, and 1200 µmol mol−1).
Horticulturae 12 00621 g007
Figure 8. Heat map analysis of amino acid accumulation in ‘Curly Kale’ (A) and ‘Red Ursa’ kale (B) grown under different levels of CO2 (400, 800, and 1200 µmol mol−1). The amino acids typed in italics and normal characters represent essential and non-essential amino acids, respectively.
Horticulturae 12 00621 g008
Table 1. Yield of the ‘Curly Kale’ and ‘Red Ursa’ kale grown under different levels of CO2.
CultivarCO2
(µmol mol−1)
Shoot
Fresh Weight (g)
Root Fresh Weight (g)Shoot Dry Weight (g)Root Dry Weight (g)Fresh:Dry Weight RatioStem Diameter (mm)Leaf Greenness Index
(SPAD Unit)
40067.25 ± 8.56 b15.21 ± 4.68 b4.70 ± 0.59 c0.87 ± 0.01 b14.75 ± 0.86 a7.75 ± 0.77 b42.55 ± 1.80 a
Curly Kale800111.00 ± 12.43 b11.12 ± 1.75 b8.08 ± 0.75 b0.55 ± 0.08 c14.15 ± 0.97 a15.09 ± 1.01 a44.73 ± 8.18 a
1200176.87 ± 49.07 a22.05 ± 0.12 a15.19 ± 1.43 a1.10 ± 0.00 a12.23 ± 2.89 a8.00 ± 2.42 b41.45 ± 8.01 a
F-test**********ns***ns
Red Ursa400111.28 ± 19.67 a10.95 ± 3.10 b7.78 ± 1.37 a0.54 ± 0.15 b14.65 ± 0.05 b8.25 ± 0.89 b46.17 ± 1.50 a
800113.25 ± 7.41 a11.00 ± 0.81 b7.92 ± 0.51 a0.55 ± 0.04 b14.65 ± 0.01 b15.81 ± 3.97 a40.22 ± 3.25 a
1200113.75 ± 31.71 a16.57 ± 3.73 a7.96 ± 2.07 a0.82 ± 0.18 a14.83 ± 0.06 a 14.5 ± 1.42 a33.32 ± 5.77 b
F-testns*ns******
Data are means ± SD. Means with the same lowercase letter are not significantly different according to Tukey’s HSD test. Asterisk (*) indicates the level of significance (ns, nonsignificant; * p < 0.05; *** p < 0.001).
Table 2. Photosynthetic pigments of kale grown under different levels of CO2.
CultivarCO2
(µmol mol−1)
Total Chl
(mg g−1 FW)
Chl a
(mg g−1 FW)
Chl b
(mg g−1 FW)
Chl a/Chl b RatioTotal Car
(mg g−1 FW)
Total Car/Total Chl Ratio
Curly Kale4008.24 ± 0.83 b5.82 ± 0.54 b2.42 ± 0.31 a2.42 ± 0.12 b0.66 ± 0.14 b 0.08 ± 0.17 b
8009.17 ± 0.72 b7.11 ± 1.66 ab2.81 ± 0.53 a2.52 ± 0.15 ab1.35 ± 0.23 a0.15 ± 0.32 a
120011.53 ± 1.52 a8.46 ± 1.19 a3.07 ± 0.35 a2.75 ± 0.12 a1.49 ± 0.13 a0.13 ± 0.09 a
F-test***ns******
Red Ursa4008.38 ± 0.69 b6.15 ± 0.46 a2.23 ± 0.23 b2.77 ± 0.09 a0.98 ± 0.11 b0.12 ± 0.16 b
8009.98 ± 0.99 b8.63 ± 1.19 a3.39 ± 0.46 a2.55 ± 0.02 b1.83 ± 0.25 a0.18 ± 0.25 a
120011.00 ± 0.73 a7.00 ± 2.02 a2.64 ± 0.76 ab2.67 ± 0.15 ab2.53 ± 0.51 a0.23 ± 0.70 a
F-test**ns*******
FW = fresh weight. Data are means ± SD. Means with the same lowercase letter are not significantly different according to Tukey’s HSD test. Asterisk (*) indicates the level of significance (ns, nonsignificant; * p < 0.05; ** p < 0.01; *** p < 0.001).
Table 3. Amino acid composition in kale leaves grown under different levels of CO2.
Amino Acid (mg/100 g DW)Curly KaleRed Ursa
400 µmol mol−1800 µmol mol−11200 µmol mol−1F-Test400 µmol mol−1800 µmol mol−11200 µmol mol−1F-Test
Aspartic acid2807 ± 40.82 a2148 ± 54.31 b2108 ± 55.43 b***2540 ± 38.38 a2436 ± 40.82 b1924 ± 32.66 c***
Glutamic acid3721.33 ± 30.64 a3042 ± 52.26 b2964 ± 40.82 b***3395 ± 48.99 b3694 ± 57.15 a2853 ± 53.89 c***
Serine1274 ± 124.16 a878.77 ± 53.49 b837.04 ± 57.81 b***1004 ± 41.64 a1032 ± 33.48 a733.05 ± 41.64 b***
Histidine566.75 ± 14.70 a538.29 ± 40.56 a462.15 ± 23.14 b**560.77 ± 28.58 a532.82 ± 14.70 a471.38 ± 13.88 b***
Glycine1513 ± 28.58 a1433.16 ± 41.31 a1186.75 ± 132.24 b**1469 ± 40.01 a1364 ± 124.16 ab1227 ± 28.58 b**
Threonine1123 ± 33.48 a742.605 ± 66.13 b680.56 ± 74.73 b***938.72 ± 14.70 a914.81 ± 28.58 a590.18 ± 13.80 b***
Arginine1536 ± 40.01 b1709 ± 42.25 a1486 ± 28.58 b***1565 ± 124.16 b2073 ± 41.64 a1570 ± 33.48 b***
Alanine1621 ± 41.64 a1335.50 ± 31.40 b1322.50 ± 35.91 b***1607 ± 40.82 a1594 ± 40.01 a1468 ± 124.16 ans
Tyrosine591.77 ± 12.25 a277.68 ± 18.14 b264.31 ± 19.28 b***386.15 ± 14.70 a295.25 ± 13.94 b177.95 ± 22.86 c***
Cystinendndnd-ndndnd-
Valine1451 ± 28.58 a1210.75 ± 27.55 b1186.25 ± 48.31 b***1412 ± 33.48 a1344 ± 30.12 b1256 ± 8.98 c***
Methionine283.06 ± 12.25 a142.93 ± 14.70 b128.28 ± 13.88 b***183.76 ± 12.75 a134.44 ± 22.86 b121.49 ± 14.70 b**
Phenylalanine1447 ± 24.04 a1185.75 ± 49.36 b1159.25 ± 42.70 b***1521 ± 124.16 a1382 ± 115.95 a1300 ± 120.64 ans
Isoleucine1047 ± 13.88 a846.30 ± 46.46 b814.08 ± 35.41 b***1013 ± 28.58 a931.65 ± 13.88 b892.51 ± 28.58 b***
Leucine2295 ± 40.01 a1733 ± 91.24 b1651 ± 96.37 b***2217 ± 33.48 a1875 ± 28.58 b1821 ± 40.01 b***
Lysine1790 ± 33.48 a1551.25 ± 129.70 b1438.75 ± 47.15 b**1734 ± 41.64 a1653 ± 40.36 b1498 ± 33.48 c***
Tryptophan141.74 ± 14.70 a168.16 ± 13.88 a144.27 ± 22.86 ans135.27 ± 12.25 a143.46 ± 10.44 a144.25 ± 13.80 ans
Proline1287 ± 221.86 a1103.65 ± 31.73 b1060.56 ± 139.82 b**1263 ± 40.01 a1120.50 ± 54.49 b1083.50 ± 43.49 b**
Total essential amino acid (EA)10,145 ± 192.57 a8119 ± 414.79 b7665 ± 385.46 b***9716 ± 323.22 a8911 ± 312.76 b8095 ± 285.44 c***
Total non-essential amino acid (NEA)14,351 ± 327.15 a11,928 ± 219.08 b11,229 ± 484.62 b***13,229 ± 380.53 a13,609 ± 385.54 a11,037 ± 354.19 b***
Total amino acid (TA)24,496 ± 516.21 a20,047 ± 632.47 b18,894 ± 852.41 b***22,945 ± 703.69 a22,520 ± 697.41 a19,131 ± 638.66 b***
EA/TA ratio0.414 ± 0.002 a0.405 ± 0.008 a0.406 ± 0.005 ans0.423 ± 0.001 a0.396 ± 0.004 a0.423 ± 0.005 ans
NEA/TA ratio0.586 ± 0.002 a0.595 ± 0.008 a0.594 ± 0.005 ans0.576 ± 0.001 b0.604 ± 0.001 a0.577 ± 0.001 b***
DW = dry weight, nd = not detected. The amino acids typed in italics and normal characters represent essential and non-essential amino acids, respectively. Data are means ± SD. Means with the same lowercase letter are not significantly different according to Tukey’s HSD test. Asterisk (*) indicates the level of significance (ns, nonsignificant; ** p < 0.01; *** p < 0.001).
Table 4. Economic evaluation of kale production under different levels of CO2.
DescriptionCurly KaleRed Ursa
400
µmol mol−1
800
µmol mol−1
1200
µmol mol−1
400
µmol mol−1
800
µmol mol−1
1200
µmol mol−1
Seeds (960 seeds)9.309.309.3046.5046.5046.50
Growing media (960 sets)29.7629.7629.7629.7629.7629.76
Nutrient solution89.2889.2889.2889.2889.2889.28
Electricity charges496.00496.00496.00496.00496.00496.00
Water charges62.0062.0062.0062.0062.0062.00
CO277.50155.00387.5077.50155.00387.50
Planting and maintenance labor930.00930.00930.00930.00930.00930.00
Depreciation and maintenance124.00124.00124.00124.00124.00124.00
Total Cost per planting cycle (USD)1817.841895.342127.841855.041932.542165.04
Production cost per plant (USD plant−1)1.891.972.221.932.012.26
Shoot fresh weight (g plant−1)67.25111.00176.87111.28113.25113.75
Unit production cost (USD kg−1)28.1617.7912.5317.3617.7819.83
Disclaimer/Publisher’s Note: The statements, opinions and data contained in all publications are solely those of the individual author(s) and contributor(s) and not of MDPI and/or the editor(s). MDPI and/or the editor(s) disclaim responsibility for any injury to people or property resulting from any ideas, methods, instructions or products referred to in the content.

