Article

Identification of a Pale Green Mutant pgm3 in Chinese Cabbage (Brassica rapa L. ssp. pekinensis)


1
College of Life Science, Shenyang Normal University, Shenyang 110034, China
2
College of Horticulture, Shenyang Agricultural University, Shenyang 110866, China
*
Author to whom correspondence should be addressed.
Horticulturae 2026, 12(4), 506; https://doi.org/10.3390/horticulturae12040506
Submission received: 21 March 2026 / Revised: 16 April 2026 / Accepted: 18 April 2026 / Published: 21 April 2026
(This article belongs to the Section Genetics, Genomics, Breeding, and Biotechnology (G2B2))

Abstract

Chinese cabbage is one of the major vegetable crops in northern Asia. Its leaves are the major organ for photosynthesis and production, and leaf color directly influences its yield and quality. Here, we obtained a pale green mutant pgm3. This mutant line was derived from EMS mutagenesis of Chinese cabbage DH line FT. pgm3 exhibited chlorosis and etiolation, delayed growth, reduced photosynthetic pigment content and net photosynthetic rates, and impaired development of the chloroplast inner membrane system. Genetic analysis revealed that the pale green phenotype was controlled by a single recessive nuclear gene, Brpgm3. Mutmap analysis indicated that Brpgm3 is located on a 13.9 Mb region in A03. Within this region, a single SNP (A03: 7194530) with an SNP-index of 1, located in BraA03g015750.3C (BrClpC1), was identified from 40 differential SNPs. KASP genotyping demonstrated that the SNP co-segregated with the pale green phenotype in the F2 population. Sanger sequencing confirmed a G-to-A SNP in exon 4 of BrClpC1, which resulted in an amino acid substitution from S to G. Furthermore, multiple sequence alignment of homologs from 28 species demonstrated that this mutated residue is highly conserved. BrClpC1 was predominantly expressed in leaves and exhibited the highest transcript abundance among the nine members of the Class I Clp gene family in Brassica rapa. This is the first report identifying ClpC1 in Brassica crops. Our results not only confirmed BrClpC1 as a strong candidate gene for the pale green mutant of Chinese cabbage, but also highlighted BrClpC1 as a target for chloroplast biology research in Brassica crops.

1. Introduction

Chinese cabbage (Brassica campestris L. ssp. pekenensis) is an important vegetable crop belonging to the Brassicaceae family and is the predominant vegetable cultivated in northern China. The leaves constitute the primary edible organ of Chinese cabbage, holding significant economic value and breeding importance; they also serve as the main site of photosynthesis, a process influenced by the content and composition of leaf pigments. Leaf color mutation, a widely existing type of variation in the plant kingdom, has attracted considerable research attention. Yellow-leaf mutants, a common type of leaf color mutation, have been identified in various plant species, such as Arabidopsis [1], maize [2], rice [3,4], cabbage [5], and tomato [6]. Yellowing has become an important material for studying the mechanisms of plant photosynthesis, chlorophyll biosynthesis pathways, chloroplast development and genetic regulation [5,7,8].
Leaf color is a comprehensive manifestation of the content and proportion of various pigments within the leaves. Photosynthetic pigments are concentrated in chloroplasts, where they participate in the absorption, transmission and conversion of light energy, thereby affecting the physiological functions of chloroplasts [9,10]. However, the majority of proteins required for chloroplast development and function depend on the expression of nuclear genes, with only a few proteins encoded by the chloroplast genome. The light-harvesting chlorophyll a/b binding protein, encoded by nuclear gene and localized in chloroplasts, plays a crucial role in capturing and transmitting light energy [11,12]. In Arabidopsis, down-regulation of the lhcb gene causes leaf yellowing and significantly reduces chlorophyll content [13]. Map-based cloning identified YLD7, which encodes a novel ankyrin domain-containing protein localized to the chloroplast, as the causal gene for the yellow-leaf mutant yld7 in rice and plays a significant role in maintaining the structural integrity of chloroplasts and regulating leaf senescence [14]. These proteins are synthesized in the cytosol and translocated into chloroplasts relying on chloroplast protein input mechanisms, including the TOC (translocon at the outer envelope membrane of chloroplasts) and TIC complexes (translocon at the inner envelope membrane of chloroplasts) [15,16]. The TIC complex, located at the inner chloroplast envelope, is essential for translocating nuclear-encoded proteins into the chloroplast stroma, a critical step in chloroplast biogenesis.
In the study of TIC complexes, identifying the component that serves as the molecular motor to provide energy is crucial. Among various candidate proteins, ClpC, an ATP-dependent Clp protease ATP-binding subunit also known as Hsp93, which has been proposed to act as an ATP-driven import motor, is the best-known partner of Tic110 in the TIC complex [17,18]. However, recent studies suggested that ClpC functions as a molecular chaperone of Clp protease machinery, involved in the degradation of denatured proteins in the chloroplast [19,20]. For example, in Arabidopsis, the ClpC1 mutant irm1 exhibits chlorotic leaves and growth retardation, and overexpressing ClpC1 rescues the phenotype, indicating its role in chloroplast development [21]. Additionally, ClpC1 inactivation reduces photosynthetic activity and photosystem content [22]. Despite these findings in model plants, the function of the ClpC1 ortholog in Chinese cabbage in chloroplast development and leaf color formation remains unexplored.
To investigate the molecular basis of the pale green phenotype in Chinese cabbage, we identified the pale green mutant pgm3, which exhibited pale green leaves and delayed growth, from an EMS-mutagenized Chinese cabbage mutant library [23]. In this study, we systematically analyzed its photosynthetic physiological parameters such as photosynthetic pigment content, net photosynthesis and Fv/Fm to characterize the phenotype. We hypothesized that a mutation in key genes involved in chloroplast development or chlorophyll biosynthesis-related gene causes the pale green trait. Through genetic analysis, combining MutMap, KASP genotyping, and Sanger sequencing, we identified BrClpC1 (BraA03g015750.3C) as the candidate gene of Brpgm3. The candidate genes identified in this study facilitate gene function understanding for chloroplast development and provided insights into unraveling the molecular mechanisms underlying leaf color formation in Chinese cabbage.

2. Materials and Methods

2.1. Plant Materials and Construction of Population

The pale green mutant pgm3 was identified from a Chinese cabbage EMS mutant library. The background line used for mutagenesis was the doubled haploid (DH) line ‘FT’, which was derived from microspore culture and served as the wild-type. Using wild-type FT and pgm3 as parents, F1 population was obtained by reciprocal cross between the two materials. F2 population was obtained by self-cross of F1. BC1 populations were generated by separately backcrossing the F1 plants with the wild-type FT, and the mutant pgm3 was obtained by F1 backcross with parents. The leaf color of F1, F2 and BC1 were observed and counted. χ2 test was used to test the population with character segregation and verify the segregation ratio. At the same time, F2 population was also used as the gene mapping population. All the plant materials used above were planted in the vegetable breeding experimental base of Shenyang Agricultural University. Plants were grown under an 8 h light/16 h dark photoperiod with standard watering and fertilizer management.

2.2. Measurement of Heading Index

At the end of the heading stage of Chinese cabbage in open field cultivation, 5 pgm3 mutants and 5 wild-type FT plants with consistent growth were selected to measure the indexes of heading stage, including gross weight, net weight, net weight rate, longitudinal diameter, transverse diameter and shape index. Among them, the ball gross weight refers to the ball weight including the outer leaf; the ball net weight refers to the ball weight of the excluded leaf; the ball net weight ratio refers to the ratio of the ball net weight and the ball gross weight; the ball longitudinal diameter refers to the length of the ball longitudinal diameter of the excluded leaf; the ball shape index refers to the ratio of the longitudinal diameter and the transverse diameter of the excluded leaf.

2.3. Determination of Photosynthetic Pigment Content

Three 6-week-old wild-type and three mutant plants were selected respectively. The fourth true leaf was used for chlorophyll content measurement. After removing the leaf veins, 0.1 g of fresh leaf tissue was accurately weighed, cut into small pieces, and placed in 10 mL of an 80% ethanol–acetone (v/v) solution. The extraction was carried out in the dark for 24 h. With the ethanol–acetone solution as blank control, the absorbance of the samples was measured at three wavelengths (470 nm, 645 nm, 663 nm) using DU-800 ultraviolet spectrophotometer (Beckman Coulter, Brea, CA, USA). Each sample was measured three times. To measure the Chla, Chlb, Chl and car content, we used the method previously reported in Zhao et al. [24].

2.4. Determination of Photosynthetic Parameters

In the morning of the day, under the condition of good and stable light environment, the fourth true leaf of three wild-type and three mutant plants with the same growth were selected to measure photosynthetic parameters by Li-6400 portable photosynthetic apparatus (Li COR Biosciences, Lincoln, NE, USA). Using the LED red and blue light source of the photosynthetic apparatus, the light intensity is constant at 1000 μ mol m−2 s−1, the temperature is set at 30 °C, the CO2 concentration is set at 400 μ mol m−2 s−1, and the gas flow rate is 500 μ mol m−2 s−1. We measured net photosynthetic rate (Pn), stomatal conductance (Gs), intercellular CO2 concentration (Ci), and transpiration rate (Ts). Three independent technical measurements were taken for each plant.

2.5. Determination of Chlorophyll Fluorescence Parameters

The intact mature functional leaves of wild-type and mutant plants were selected to measure the chlorophyll fluorescence kinetics parameters by the modulation fluorescence imaging system MINI-IMAGING-PAM (Walz, Eichstätt, Germany). After 20 min of dark adaptation, the fourth leaves of 6-week-old plants were put into the sample table for determination. Measurement parameters include origin fluorescence (Fo), maximum fluorescence (Fm), variable fluorescence (Fv), primary photochemical efficiency of PS II (Fv/Fm), actual photochemical efficiency of PSII (Fv’/Fm’) and non-photochemical quenching (NPQ). Three biological replicates (individual plants) were selected for both the wild-type and mutant lines, and three replicates were performed for each plant. The measurement method was slightly modified according to the method of Zhao et al. [25] (mainly by measuring intact fourth leaves in vivo instead of excised fifth leaves).

2.6. Ultrastructural Observation of Chloroplast

The fourth true leaf was selected to observe the chloroplast ultrastructure in both wild-type and mutant plants. The leaf tissue was cut into small pieces (approximately 3 mm × 1 mm) and immersed in a centrifuge tube containing a glutaraldehyde solution for pre-fixation at 4 °C for 4 h. After washing with 1% phosphoric acid buffer several times, 1% osmium acid solution was used for post fixation, and then it was treated at 4 °C for 4 h. After that, the samples were cleaned with phosphoric acid buffer and subsequently dehydrated through a gradient series of ethanol or acetone (50%, 70%, 80%, and 90%), ending with 100% acetone to ensure complete dehydration. The dehydrated samples were soaked in EPON-812 and polymerized at 35 °C, 45 °C and 60 °C respectively for 24 h respectively. Finally, EMUC7 ultrathin slicer (Leica, Wetzlar, Germany) was used to slice the material, and then the sample was double stained with uranium acetate and lead citrate. Transmission electron microscopy Hitachi H-7650 (Hitachi, Tokyo, Japan) was used for observation.

2.7. DNA, RNA Extracted and cDNA Synthesized

The plant DNA was extracted from fresh leaf using the CTAB method and total RNA was extracted using TRIzol reagent (Invitrogen, Waltham, MA, USA). The quality and concentration of DNA and RNA were detected by 1% agarose gel electrophoresis and microplate reader. The cDNA was synthesized using the FastQuant First-Strand cDNA Synthesis Kit (Tiangen, Beijing, China).

2.8. Mutmap Sequencing and Analysis

For MutMap analysis, genomic DNA was isolated from the parental lines (FT and pgm3) and from 50 individuals displaying the pale green phenotype within the F2 segregating population. These were used to construct two parental libraries and one offspring DNA pool library. The paired end sequencing of these libraries (insert fragment was 400 bp) was carried out based on IlluminaHiSeq sequencing platform. FastQC was used (http://www.bioinformatics.babraham.ac.uk/projects/fastqc (accessed on 27 January 2025)) to control the data quality. The base content distribution, GC content distribution and sequence base quality were used to detect the quality of sequencing data. By removing the pollution of the joint, quality filtering and length filtering, raw data was filtered to generate high-quality data. BWAMEM (0.7.12-r1039) program [26] was used to compare the high-quality data obtained after filtering to the reference genome. The parameters for comparison were in accordance with the default parameters of BWAMEM. SNP was detected by Gatk 4.4 software [27] and indel mutation information was extracted by using the SelectVariants command of the Unified Genotype program in Genome Analysis TK v3.8 software package. Common SNPs were filtered as follows: SNPs with a sequencing depth greater than 5 were retained, and those consistent with the EMS-induced mutation type (G-A or C-T transitions) were selected. Annovar v2016-02-01 [28] was used to annotate all SNPs and indels. Based on the SNP-index calculation principle of Mutmap, SNP-index were calculated to screen candidate regions associated with trait genes. According to the distribution of SNP-index on chromosomes, there were obvious peaks, and the regions over the 95 percentile threshold line were used as candidate regions for trait correlation. In the MutMap analysis, since the DNA bulk was constructed exclusively from F2 individuals exhibiting the mutant phenotype, the SNP-index for the causal mutation should theoretically be 1.0. Consequently, within the candidate interval, we specifically filtered for SNPs with an index of 1.0 that caused non-synonymous mutations and defined them as candidate variants.

2.9. KASP (Kompetitive Allele-Specific PCR)

KASP is a specific PCR technique that requires three primers: two allele-specific forward primers with distinct fluorescent labels, and one universal reverse primer. Since different primers have distinct fluorescent signals, genotypes can be directly determined by detecting these signals. Based on the reference genome information of Brassica rapa, 150 bp upstream and downstream sequences of candidate SNPs (a total of 301 bp) were extracted for specific primer design. The primer information is shown in Table S1. DNA extraction was described in 2.7. The KASP assay was performed in a 5 µL reaction system containing 2× KASP Master Mix, primer mix, and template DNA. The KASP PCR program was performed as follows: initial denaturation at 94 °C for 15 s (1 cycle); followed by 10 cycles of 94 °C for 20 s and 61–55 °C (decreasing by 0.6 °C per cycle) for 1 min; then 30–40 cycles of 94 °C for 15 s and 55 °C for 1 min; and a final step at 37 °C for 1 min (1 cycle). After amplification, the fluorescence signals were recorded for genotyping analysis.

2.10. Clone Sequencing

According to the sequence information of the Brassica database, primers were designed for the CDS of candidate genes (Table S2). DNA was used as a template to amplify the promoter sequence of the candidate gene, and cDNA was used to amplify the CDS of the candidate gene. PCR products were purified and ligated with pGEM®-T Easy Vector (Promega, Madison, WI, USA). The ligation products were transformed into TOP10 competent cells (CWBIO, Beijing, China) and cultured on LB solid medium adding X-gal and IPTG. Positive colonies were selected for PCR detection and Sanger sequencing. The sequences were analyzed by DNAMAN software (Lynnon LLC, San Ramon, CA, USA).

2.11. Quantitative Real-Time PCR (qRT-PCR)

Total RNA was extracted from different organs (root, stem, leaf, flower, bud, pod) and leaves at different stages (cotyledon stage, seeding stage, rosette stage, heading stage, blotting stage) in pgm3 and FT. Primer sequence is listed in Table S3. ACTIN was used as internal reference. qRT-PCR was performed and analyzed on Bio-Rad IQ5 real-time PCR detection system (Bio-Rad Laboratories, Hercules, CA, USA). The qRT-PCR amplification system and program were as described by Huang et al. [29].

2.12. Bioinformatics Analysis

The full-length and CDS information of BrClpC1 were obtained by cloning sequencing. The gene structure was predicted by the GSDS 2.0 (https://gsds.gao-lab.org/Gsds_help.php (accessed on 12 October 2025)). Protein secondary structure of BrClpC1 was calculated through SOPMA (https://npsa.lyon.inserm.fr/cgi-bin/npsa_automat.pl?page=/NPSA/npsa_sopma.html (accessed on 15 October 2025)). Sequence of BrClpC1 homologous proteins among 28 species were downloaded from NCBI. Genome sequence information of Brassica rapa were downloaded from the BRAD (http://www.brassicadb.cn/#/ (accessed on 15 October 2025)). The physicochemical properties and protein subcellular location were calculated using the Expasy Protoparam website (https://web.expasy.org/protparam (accessed on 20 October 2025)) and Cell-PLoc (http://www.csbio.sjtu.edu.cn/bioinf/Cell-PLoc/ (accessed on 20 October 2025)), respectively. Using the amino acid sequences of the Class I Clp gene family members from Oryza sativa, Arabidopsis thaliana, and Brassica rapa, a multiple sequence alignment was conducted and a phylogenetic tree was constructed using MEGA software. The intraspecific collinearity analysis and interspecific collinearity analysis of the Class I Clp genes were analyzed and plotted using TBtools-II v2.450.

2.13. Statistical Analysis

All experimental data are shown as the means ± standard error (SE) from three independent biological replicates. Differences between FT and pgm3 were analyzed using a two-tailed Student’s *t*-test. Comparisons among multiple groups were performed using one-way analysis of variance (ANOVA) followed by Tukey’s honestly significant difference (HSD) post hoc test for multiple comparison corrections. All statistical analyses were conducted using SPSS software (version 27). A p-value < 0.05 was considered statistically significant.

3. Results

3.1. Phenotypic Features of pgm3 and Genetic Characteristics of Mutated Trait

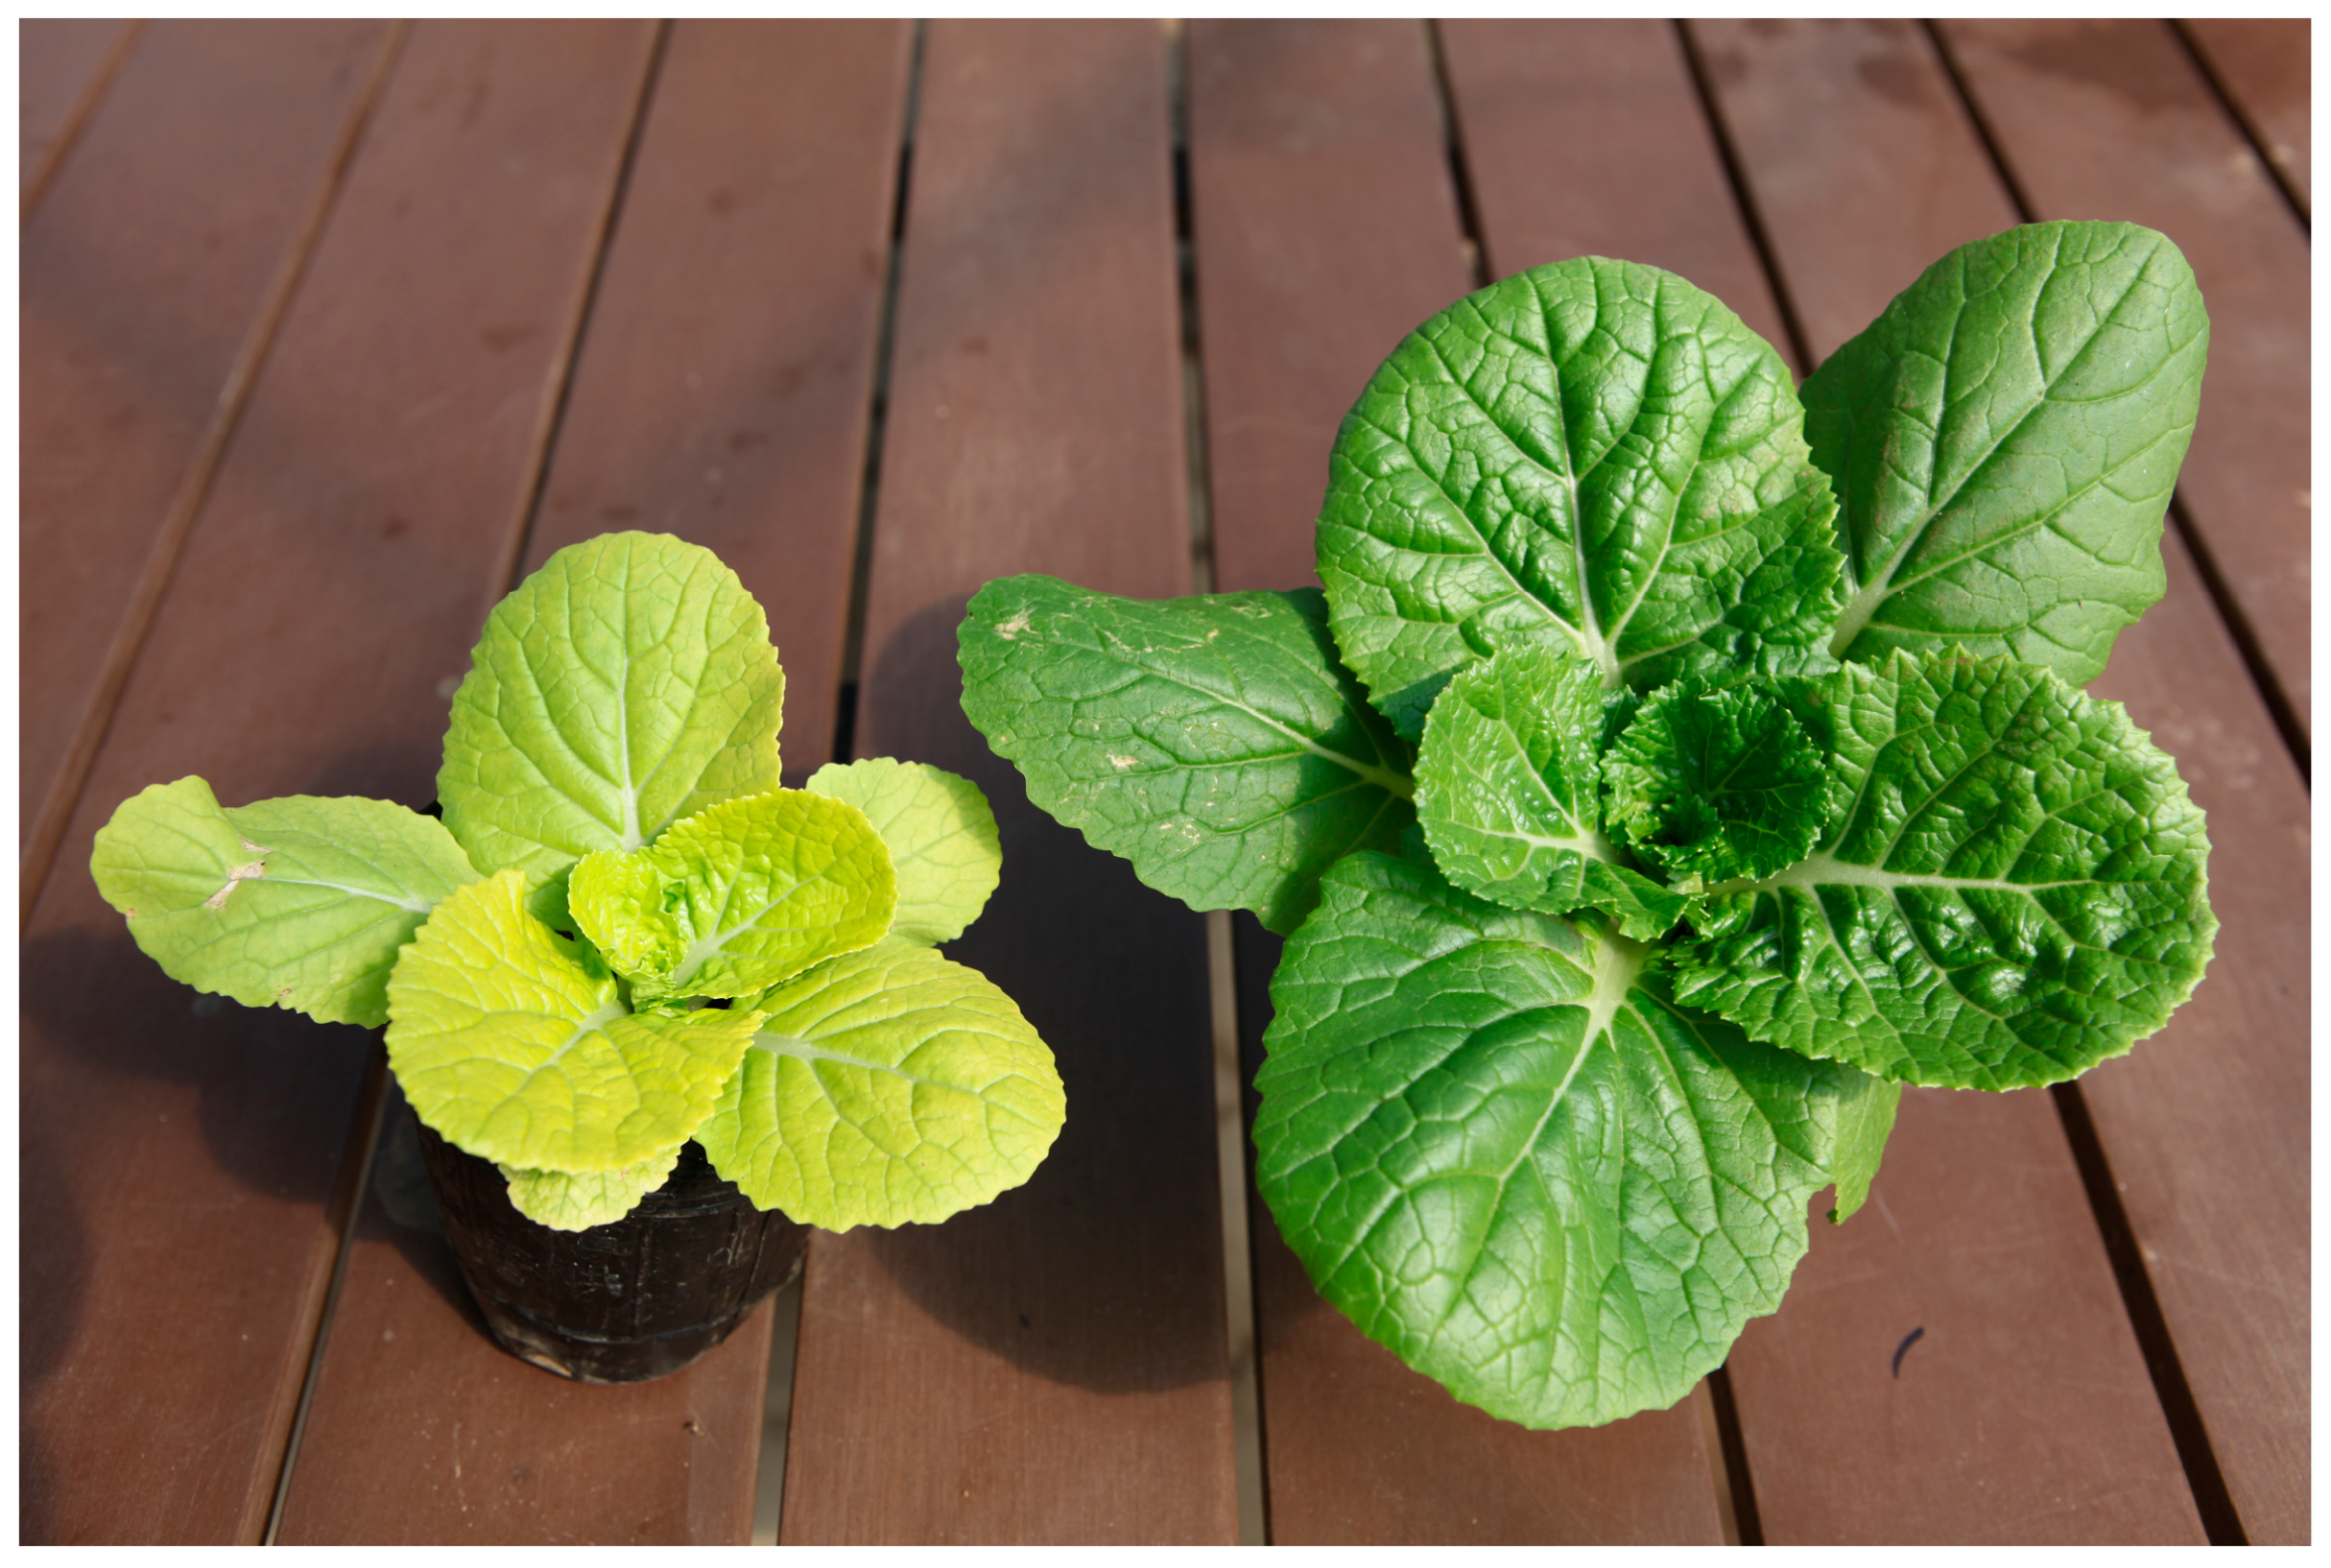
In contrast to the wild-type FT, pgm3 showed a pale green phenotype and delayed growth throughout the growth period (Figure 1 and Figure S1). At the heading stage, the leafy head of pgm3 was smaller than that of FT (Figure S1c,d). Consequently, the gross weight and net weight of pgm3 were reduced by 55.72% and 71.32% compared to FT, respectively (Table 1). Under identical vernalization conditions, the bolting time of pgm3 was delayed compared to the wild-type FT, although seed setting ability remained normal. Additionally, the leaves, stems, buds, and pods of pgm3 all displayed a pale green coloration (Figure S1e).
The results of genetic analysis are listed in Table 2. The F1 plant derived from reciprocal cross between mutant pgm3 and wild-type FT were green, indicating that the pale green phenotype of pgm3 is recessive and controlled by nuclear genes. In the F2 population, the segregation ratio of green plant to pale green plant was 2.89:1, which is consistent with Mendelian inheritance and suggested that the mutant trait is controlled by a single pair of recessive nuclear genes. Furthermore, all BC1 (F1 × FT) plants were green, whereas the BC1 (F1 × pgm3) population segregated with a green plant to pale green plant ratio of 1.30:1. This finding further confirmed that the mutated trait is inherited as a single recessive nuclear gene. Consequently, the gene responsible for the pale green phenotype in pgm3 was named Brpgm3.

3.2. Photosynthetic Physiological Characteristics of pgm3

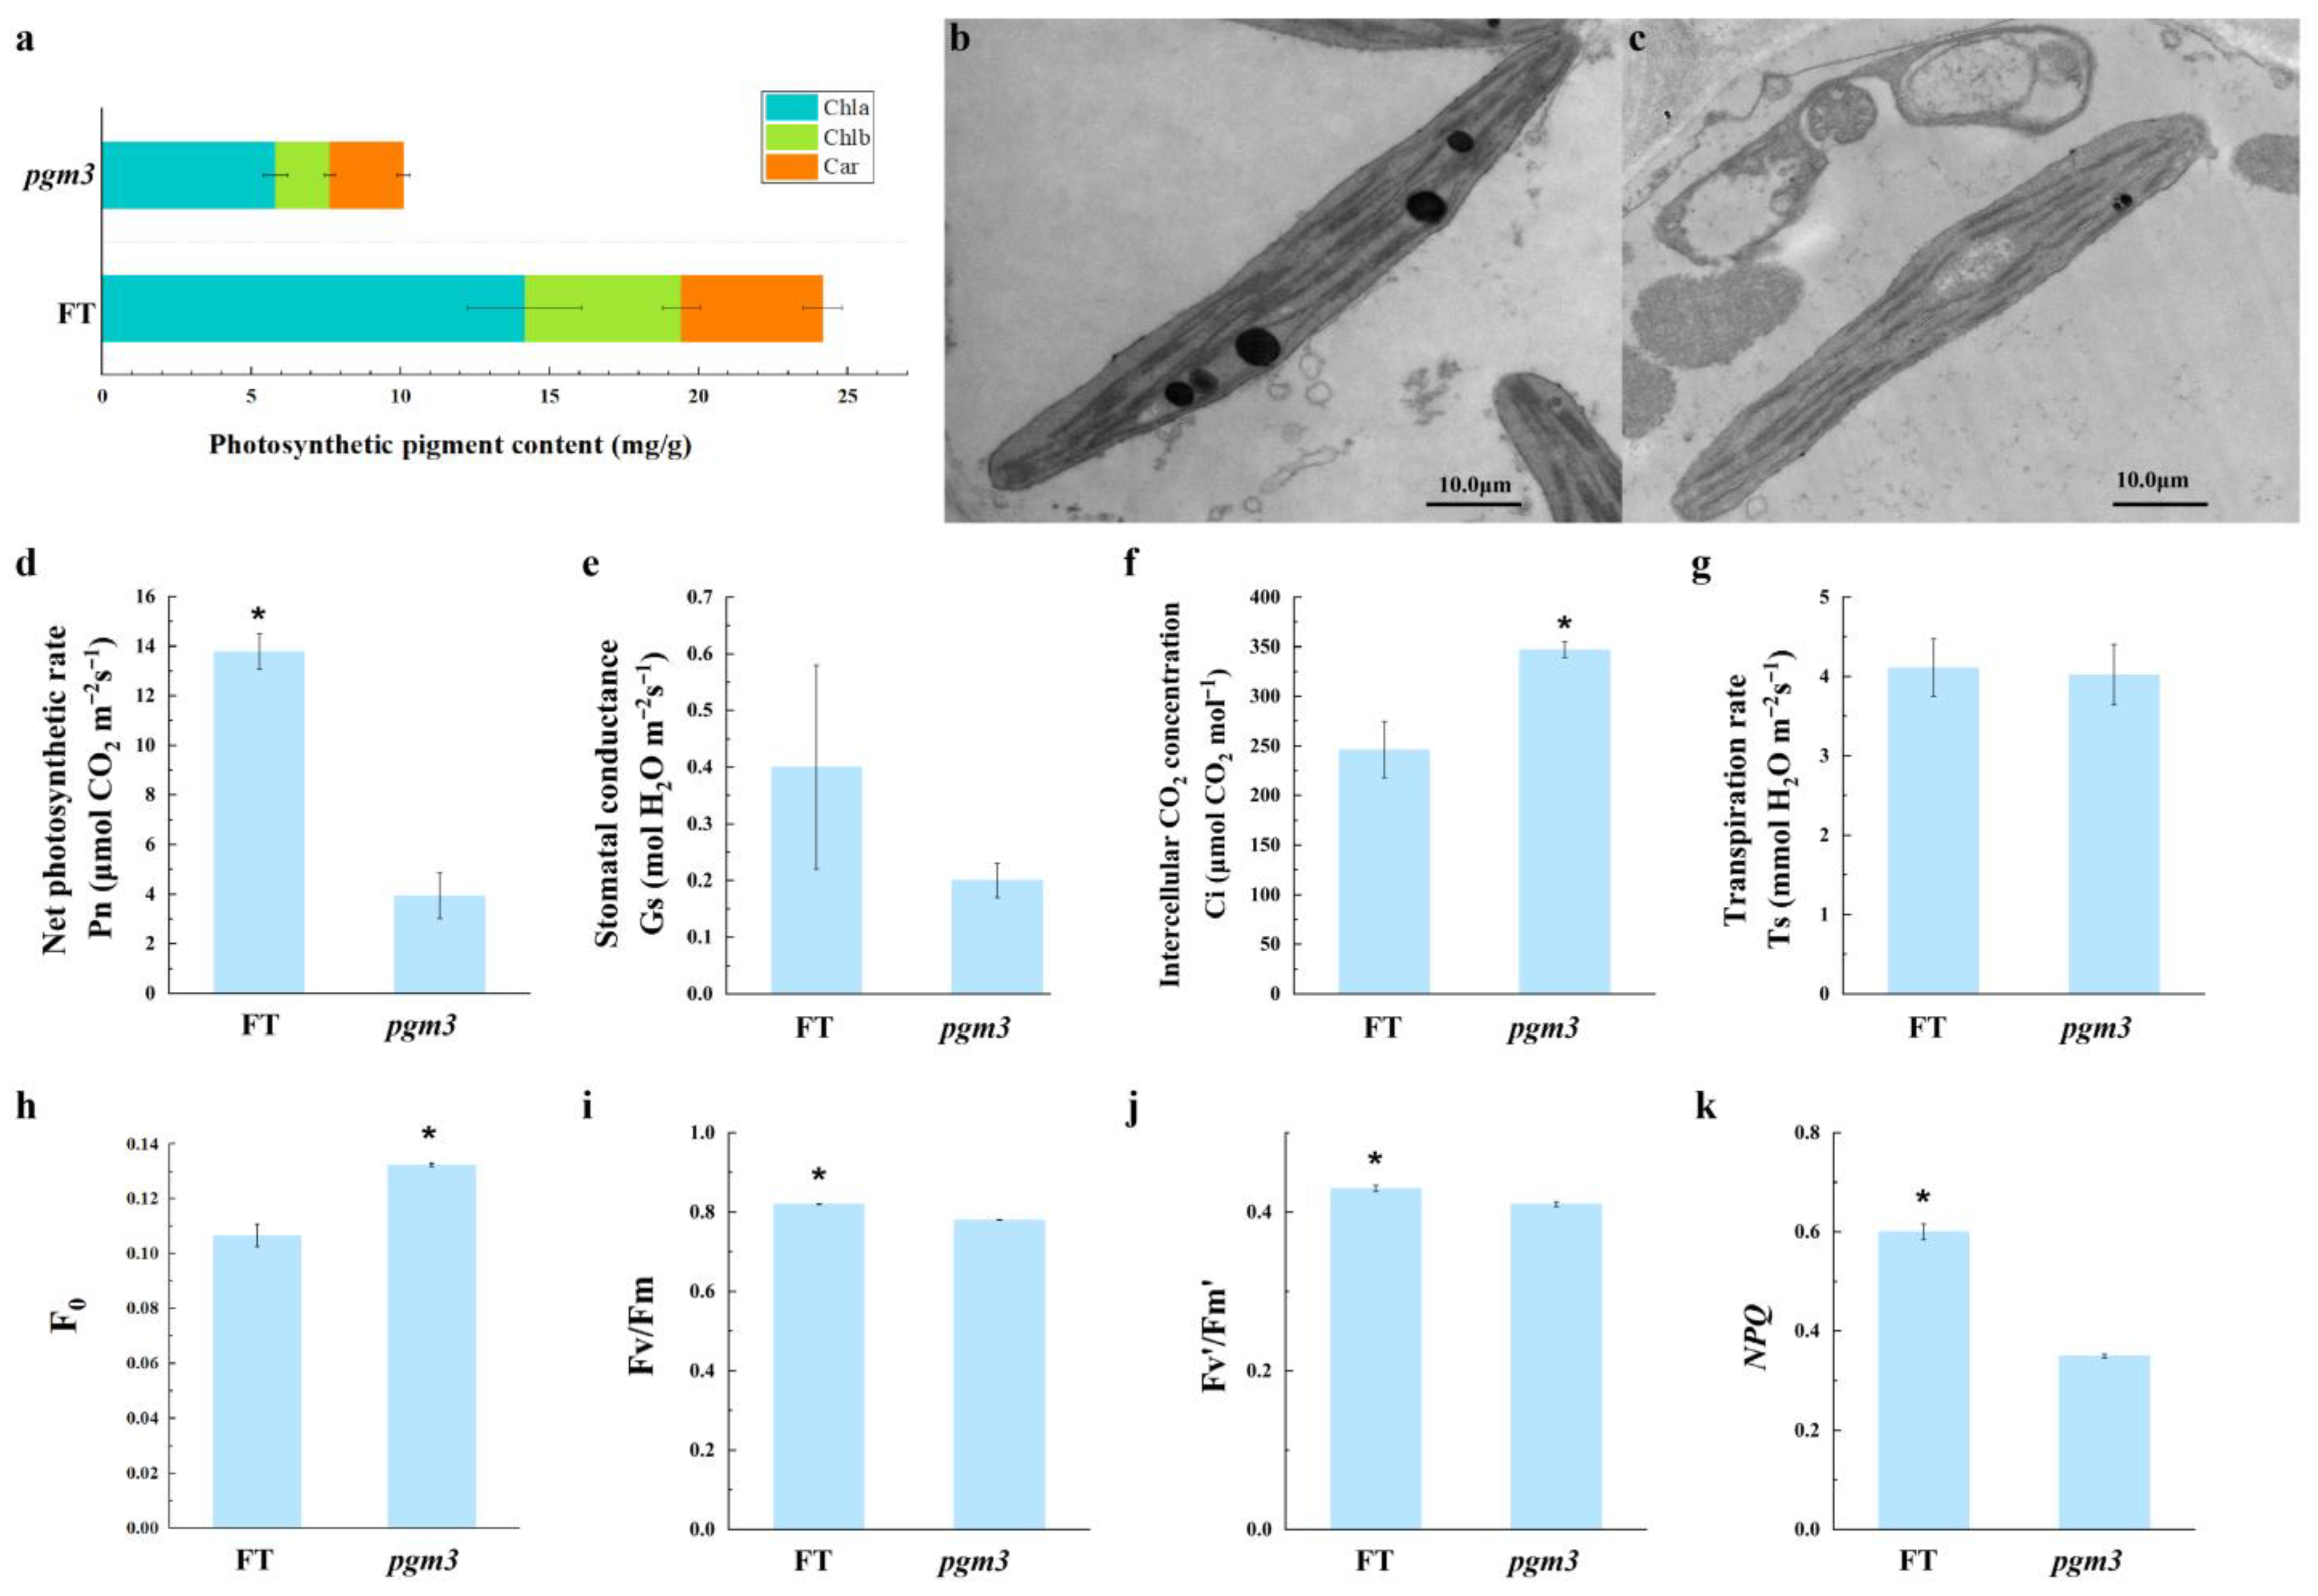
Analysis of photosynthetic pigment content revealed that pgm3 had significantly lower chlorophyll and carotenoid contents compared to wild-type FT (Figure 2a). The contents of Chla, Chlb and Car in pgm3 decreased by 58.97%, 65.59% and 47.68%, respectively. The differential reduction in Chla and Chlb contents resulted in a significantly increased Clha/Chlb ratio in pgm3 (increasing from 2.69 to 3.21). Moreover, the greater reduction in total Chl than that of Car led to a significantly higher Car/Chl ratio in pgm3 (increasing from 0.24 to 0.33). Given that leaf color is a comprehensive manifestation of photosynthetic pigments, these results indicated that the pale green phenotype of pgm3 is attributed to the varying degrees of reduction in photosynthetic pigment content.
Compared with the wild-type FT, the net photosynthetic rate (Pn) of pgm3 was significantly reduced, while the intercellular CO2 concentration (Ci) was significantly increased (Figure 2d,f). This suggested that pgm3 has reduced photosynthetic capacity and lower CO2 utilization efficiency. However, stomatal conductance (Gs) and transpiration rate (Ts) showed no significant changes (Figure 2e,g).
Chlorophyll fluorescence analysis (Figure 2h–k) showed that pgm3 had higher Fo and lower Fv/Fm, indicating impaired PSII reaction center activity, likely due to disorganized thylakoid membranes (observed via TEM), which disrupts electron transport. The higher Fv’/Fm’ in pgm3 reflect partial preservation of PSII function or altered energy distribution, though the overall photosynthetic efficiency remains compromised. Notably, the lower NPQ in pgm3 implies reduced capacity for energy dissipation as heat. This deficiency could be attributed to disrupted thylakoid architecture hindering proton gradient formation or impaired carbon fixation (evidenced by reduced starch granules), leading to inefficient utilization of excess light energy and potential photodamage.
In addition, transmission electron microscopy observations showed that chloroplasts in FT were well developed, containing numerous grana with tight and orderly arrangements, as well as rich stroma lamellae (Figure 2b). Multiple starch granules (black spherical structures) were clearly visible within the stroma. In contrast, chloroplast in pgm3 displayed significantly reduced chloroplast length and starch granule area (Table S4), along with disorganized thylakoid structures and signs of membrane degradation, such as swollen or fragmented thylakoids, that may be the reason of significantly reduced photosynthetic pigment content and net photosynthetic rate in pgm3 (Figure 2c).

3.3. Mapping of the Mutant Gene Brpgm3

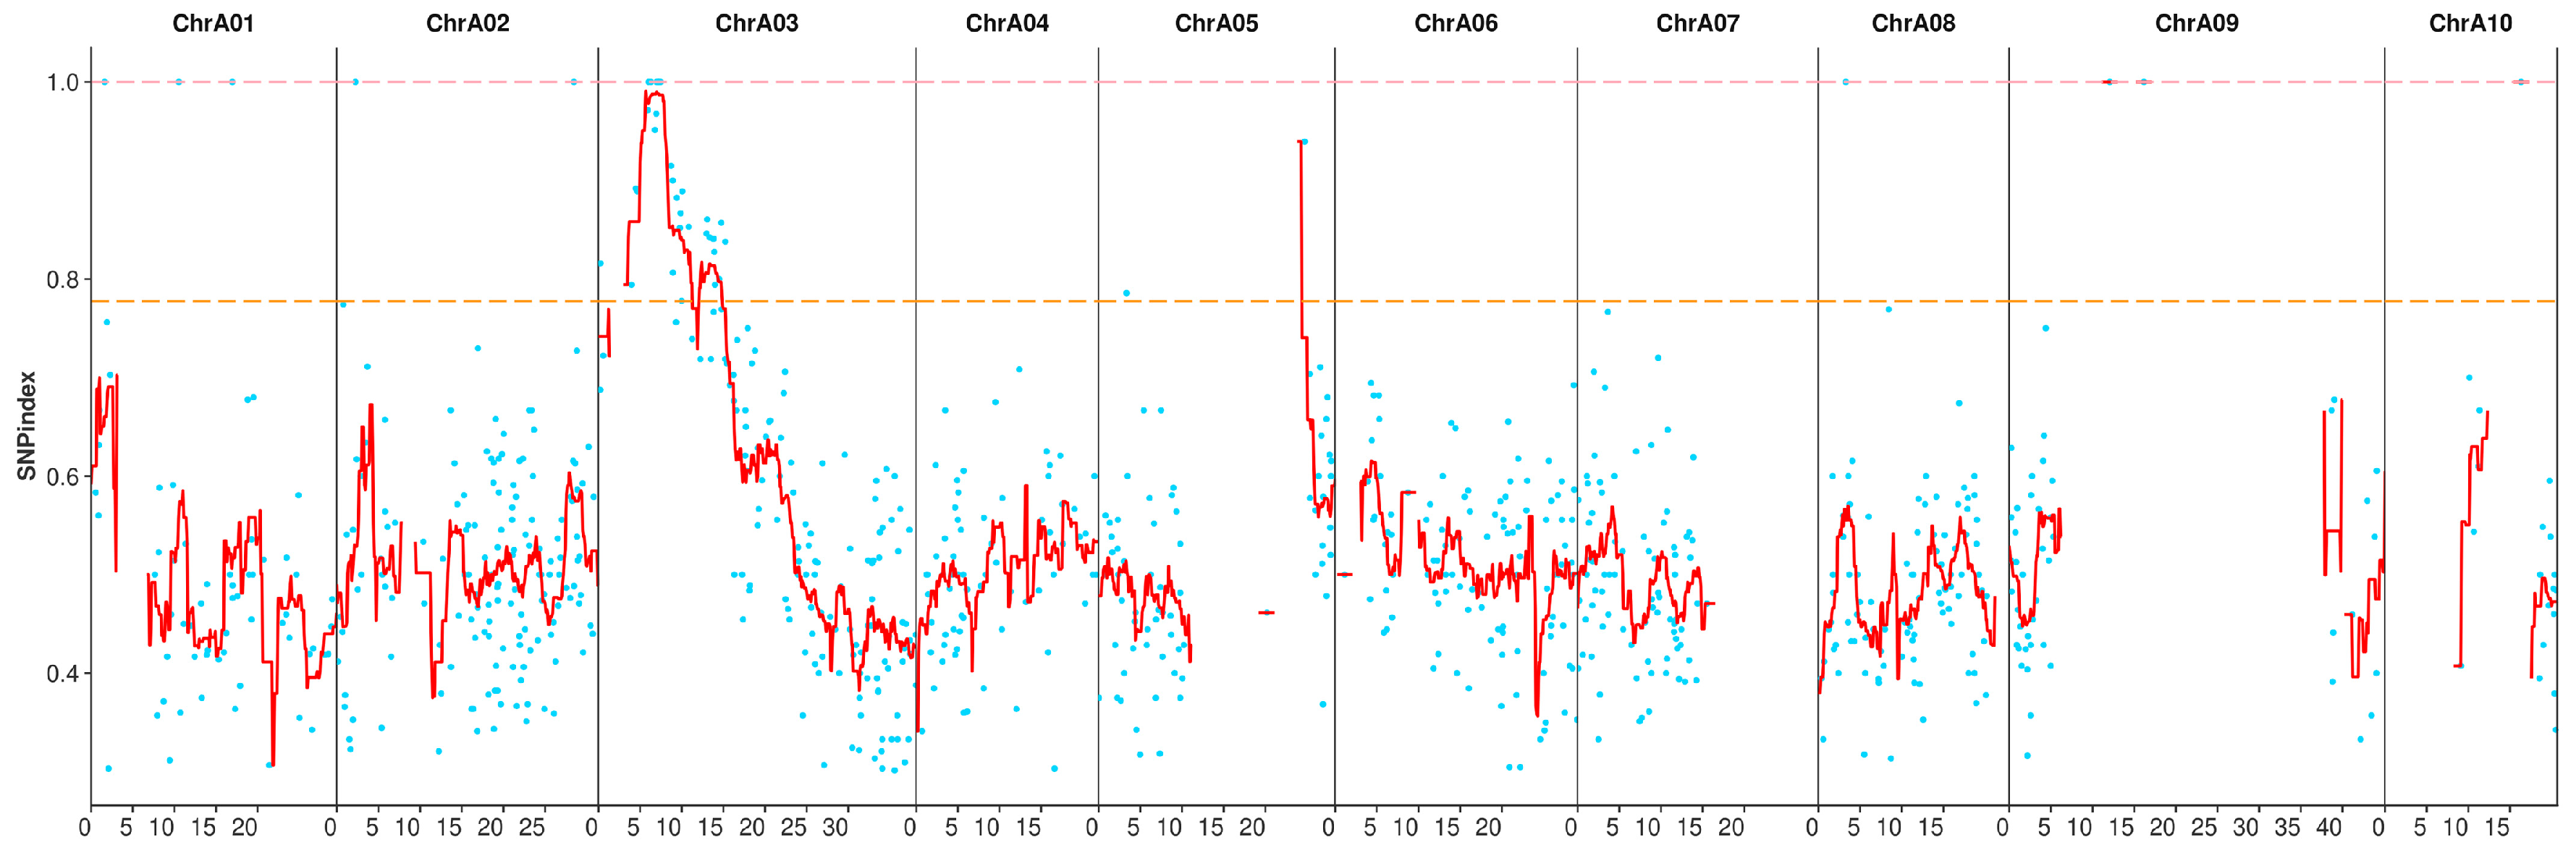
Based on the origin of pgm3, Mutmap analysis was performed for mapping Brpgm3 candidate gene. Genomic DNA from FT, pgm3 and the mixed pool (MP) of F2 mutant phenotype individuals were sequenced, and 94,719,968, 54,888,720 and 137,486,008 clean reads were obtained, respectively. In total, 97.98% of FT, 99.00% of pgm3, 98.94% of MP clean reads were mapped on Chinese cabbage reference genome (Brara_Chiiifu_V3.0). To locate the target trait, common SNPs shared by FT, pgm3 and MP were identified, resulting in a total of 1,113,464 common SNPs. After common SNPs were filtered out, 310,951 SNPs were retained for subsequent analysis. The SNP-index was calculated and its distribution map on chromosomes was illustrated (Figure 3). The regions where the SNP index exceeds the 95 percentile threshold line showed a distinct peak; thus, this region was considered as a candidate interval associated with the traits. The final candidate region was located on chromosome A03 and spanned 13.9 Mb (2,000,000–15,900,000). Within this region, 40 SNPs met the screening conditions, and nine non-synonymous mutation genes were annotated. Based on the SNP-index values, only one SNP had an SNP-index value of 1.0, located at position 7,194,530 on chromosome A03 (Table 3).

3.4. Validation of Candidate Gene by KSAP

To ultimately validate the candidate gene, co-segregation analysis was performed by genotyping F2 individuals through KASP markers targeting the candidate SNP (A03: 7,194,530). Genotyping results showed that the wild-type FT had a G:G genotype, pgm3 had an A:A genotype, and F1 plants were heterozygous (G:A). Crucially, among the F2 individuals, 143 plants with the mutant phenotype possessed the A:A genotype, while 41 plants with the wild-type phenotype possessed either G:G or G:A genotype (Figure S2 and Table S5). This result indicated that the SNP (A03: 7,194,530) genotype was co-segregated with the mutant phenotype, compellingly confirming that BraA03g015750.3C is the candidate gene for Brpgm3.

3.5. Candidate Gene Sequence and Expression Analysis

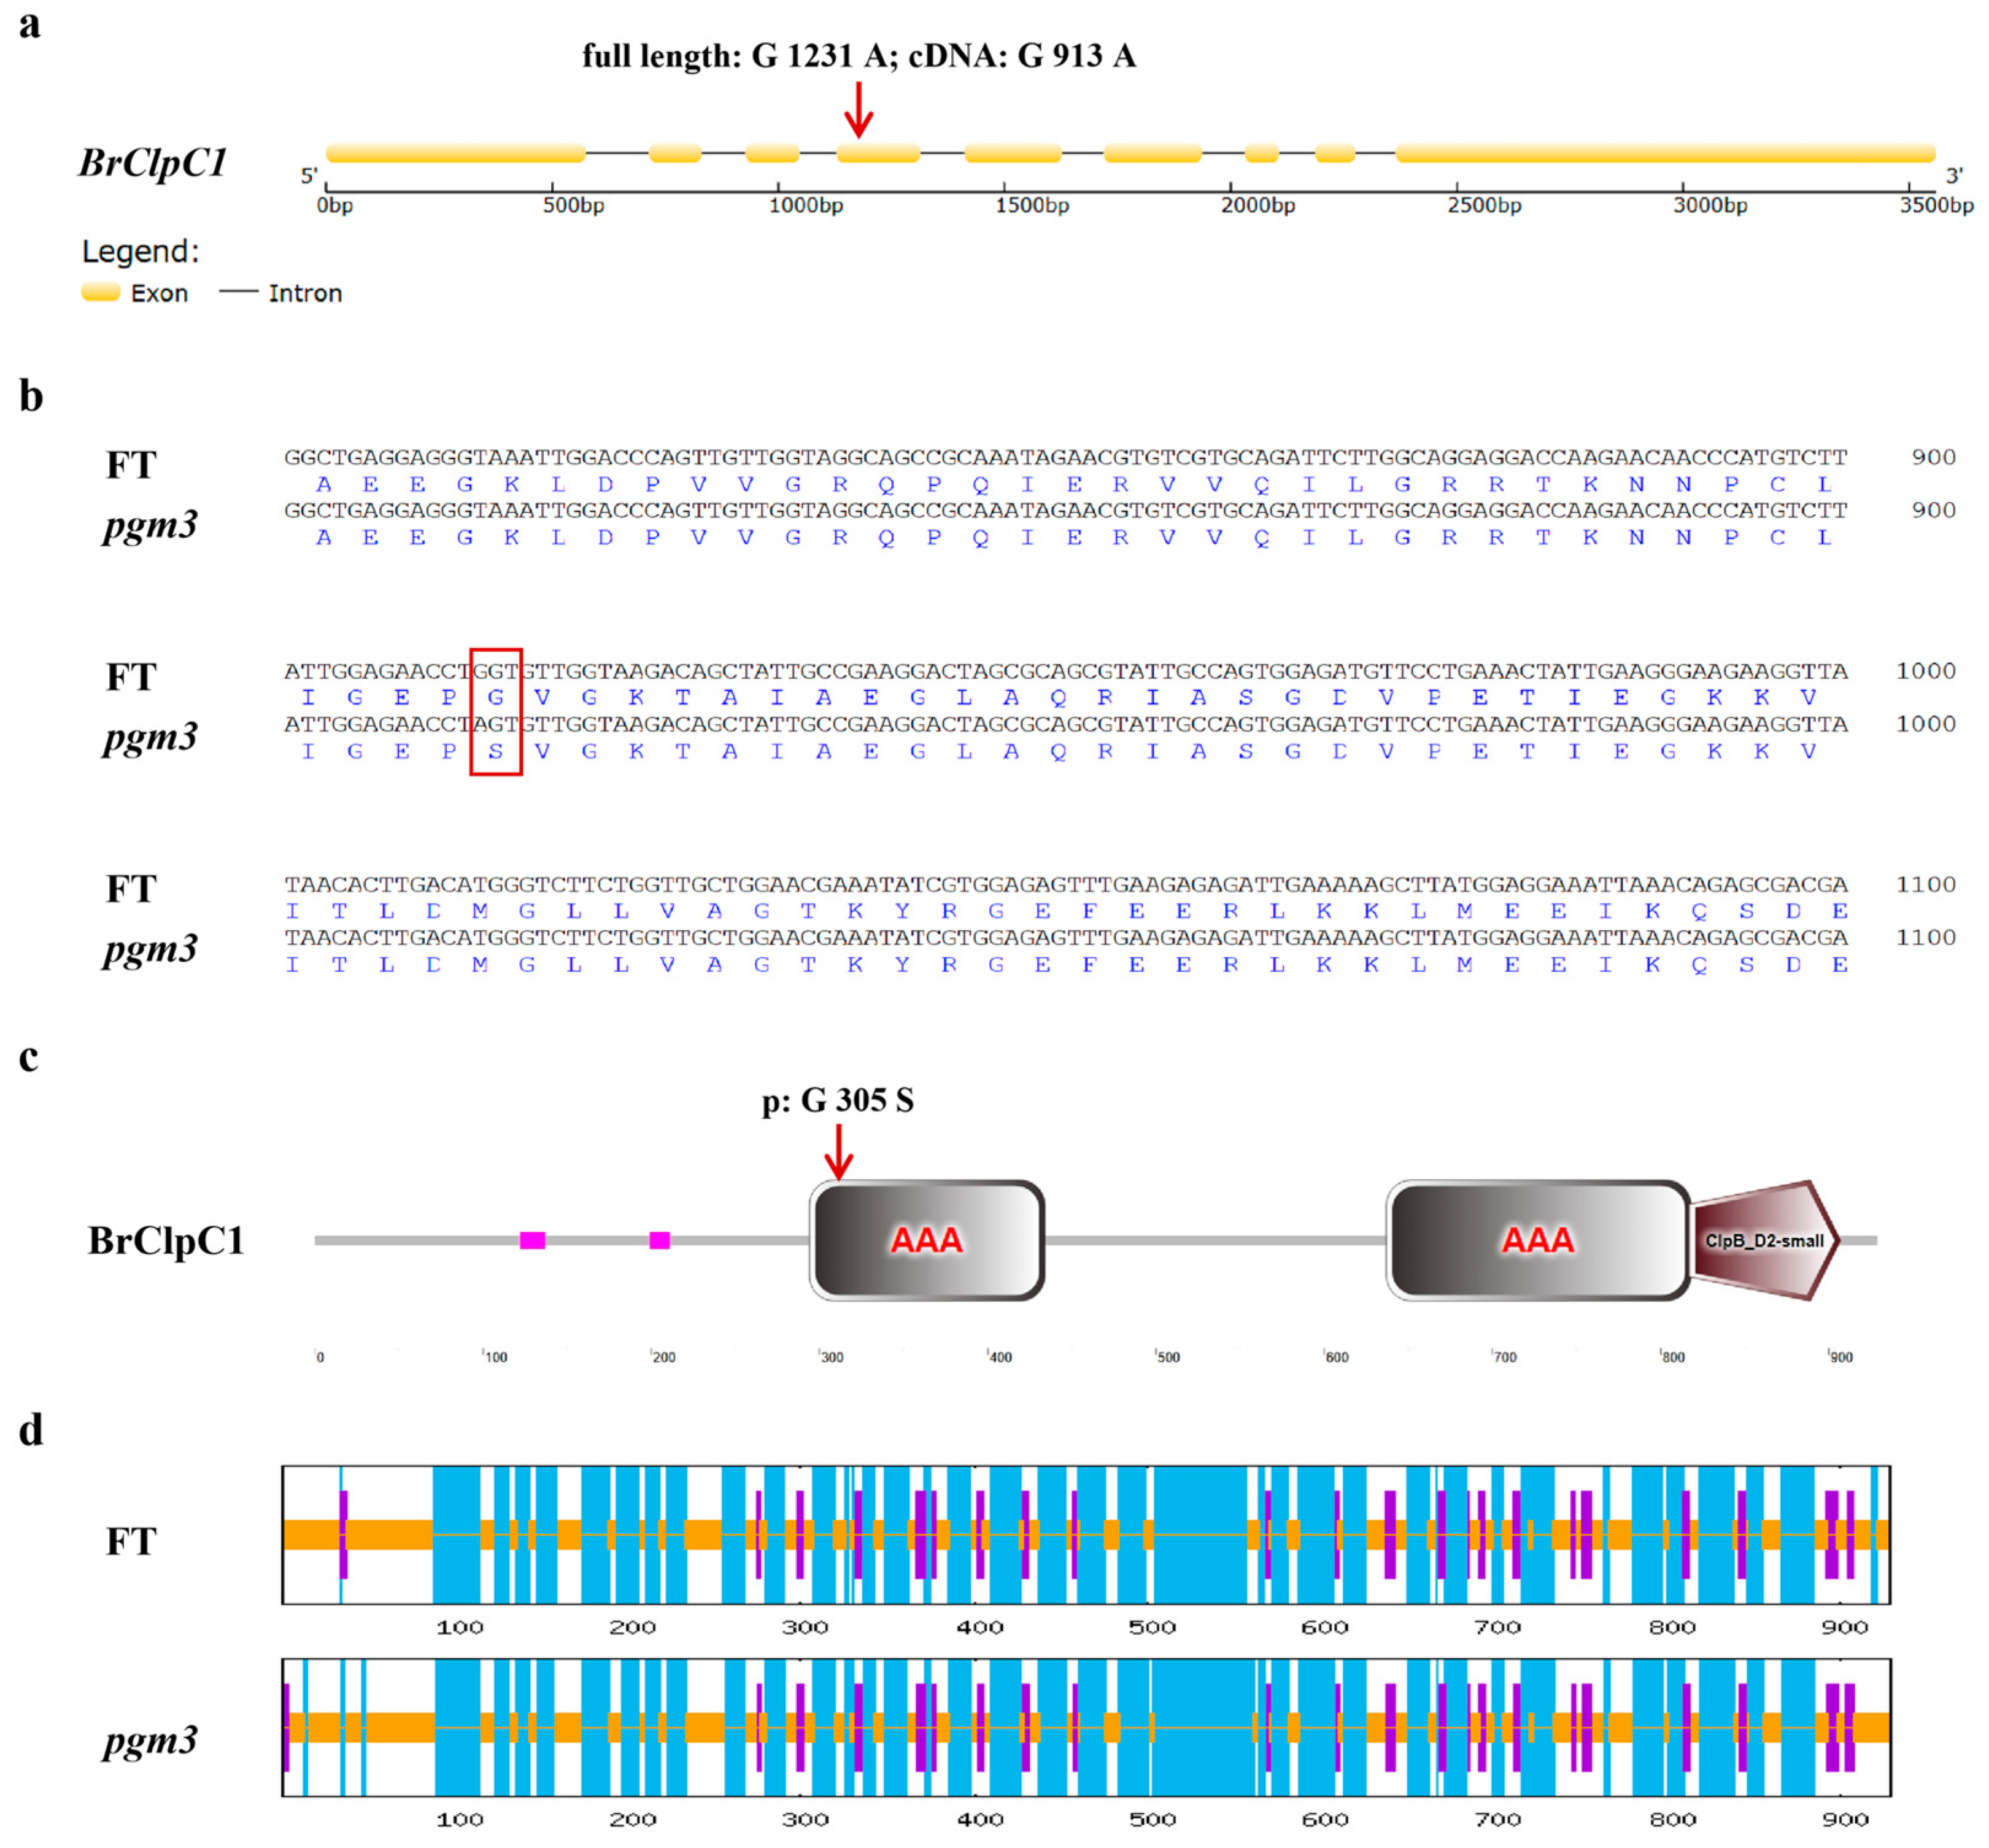
BraA03g015750.3C is located on chromosome A03 and consists of nine exons and eight introns, encoding chaperone protein ClpC1, which is involved in protein import into chloroplast. Here, we named BraA03g015750.3C as BrClpC1. The full-length genomic sequence of BrClpC1 is 3559 bp, with a coding sequence (CDS) of 2790 bp. Sanger sequencing revealed a G-to-A transition at position 1231 of the genomic DNA sequence. The mutation occurred in the fourth exon and led to a G-to-A substitution at position 913 of the CDS, resulting in an amino acid change from Serine (S) to Glycine (G) at position 305 of the protein sequence (Figure 4a,b). The protein sequence variation in pgm3 occurred in the conserved AAA domain and led to changes in its secondary structure (Figure 4c,d). Sequence analysis of homologous proteins revealed that the mutation site is highly conserved across 28 species, including both monocotyledons and dicotyledons (Figure S3).
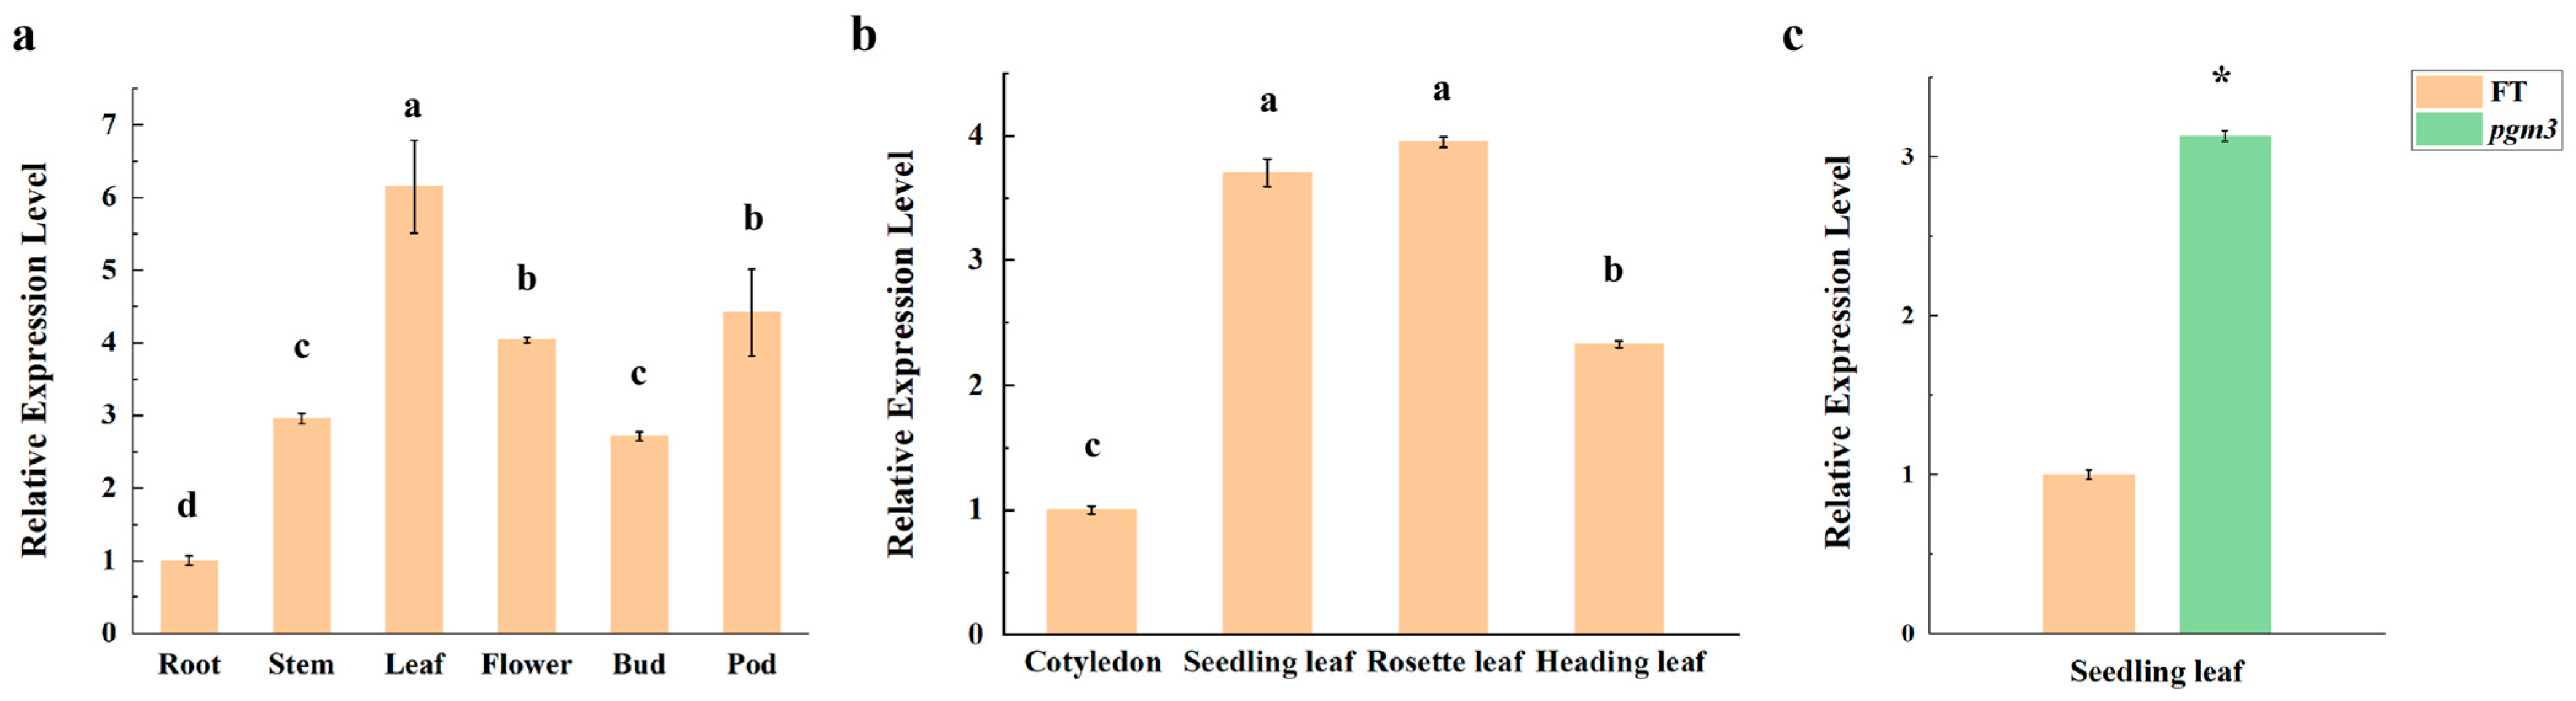
To clear the expression pattern of BrClpC1 in the wild-type FT, we measured its relative expression levels across different organs during the reproductive stage and in leaves at various developmental stages during the vegetative phase. Spatially, BrClpC1 was predominantly expressed in leaves and showed the lowest expression in roots (Figure 5a). Temporally, during the vegetative stage, its expression was significantly higher in seedling and rosette leaves than in cotyledons and heading leaves (Figure 5b). These expression patterns are consistent with the key stages of chloroplast development (seedling leaf and rosette leaf), suggesting a potential role of BrClpC1 in chloroplast biogenesis. Furthermore, compared to the wild-type, the pgm3 mutant exhibited a significantly higher expression level of BrClpC1 in seedling leaves (Figure 5c), that may be associated with the disorganized thylakoid membranes and altered photosynthetic parameters in pgm3.

3.6. Survey of the Class I Clp Family in Brassica rapa

BrClpC1 is a protein of 929 amino acids and belongs to the ClpA/B family (IPR001270), which is part of the AAA+ (ATPase associated with diverse cellular activities) superfamily. Clp (Caseinolytic Protease) system proteins are categorized into two classes based on the number of AAA domains, among which Class I Clp proteins (ClpA, ClpB, ClpC, ClpD) possess two AAA domains [30,31]. Seven Arabidopsis thaliana Class I Clp member sequences were used as the query sequence to identify Brassica rapa Class I Clp family numbers. Consequently, nine Class I Clp family numbers was identified in Brassica rapa. Notably, AtClpB2 (AT4G14670) shares the same two B.rapa homologs (BraA07g028300.3C and BraA07g038220.3C) with AtClpB1 (AT5G15450). However, their sequence identity with AtClpB1 (88.8% and 84.1%) is higher than that with AtClpB2 (77.7% and 74.1%). Therefore, BraA07g028300.3C and BraA07g038220.3C were designated as homologs of AtClpB1.
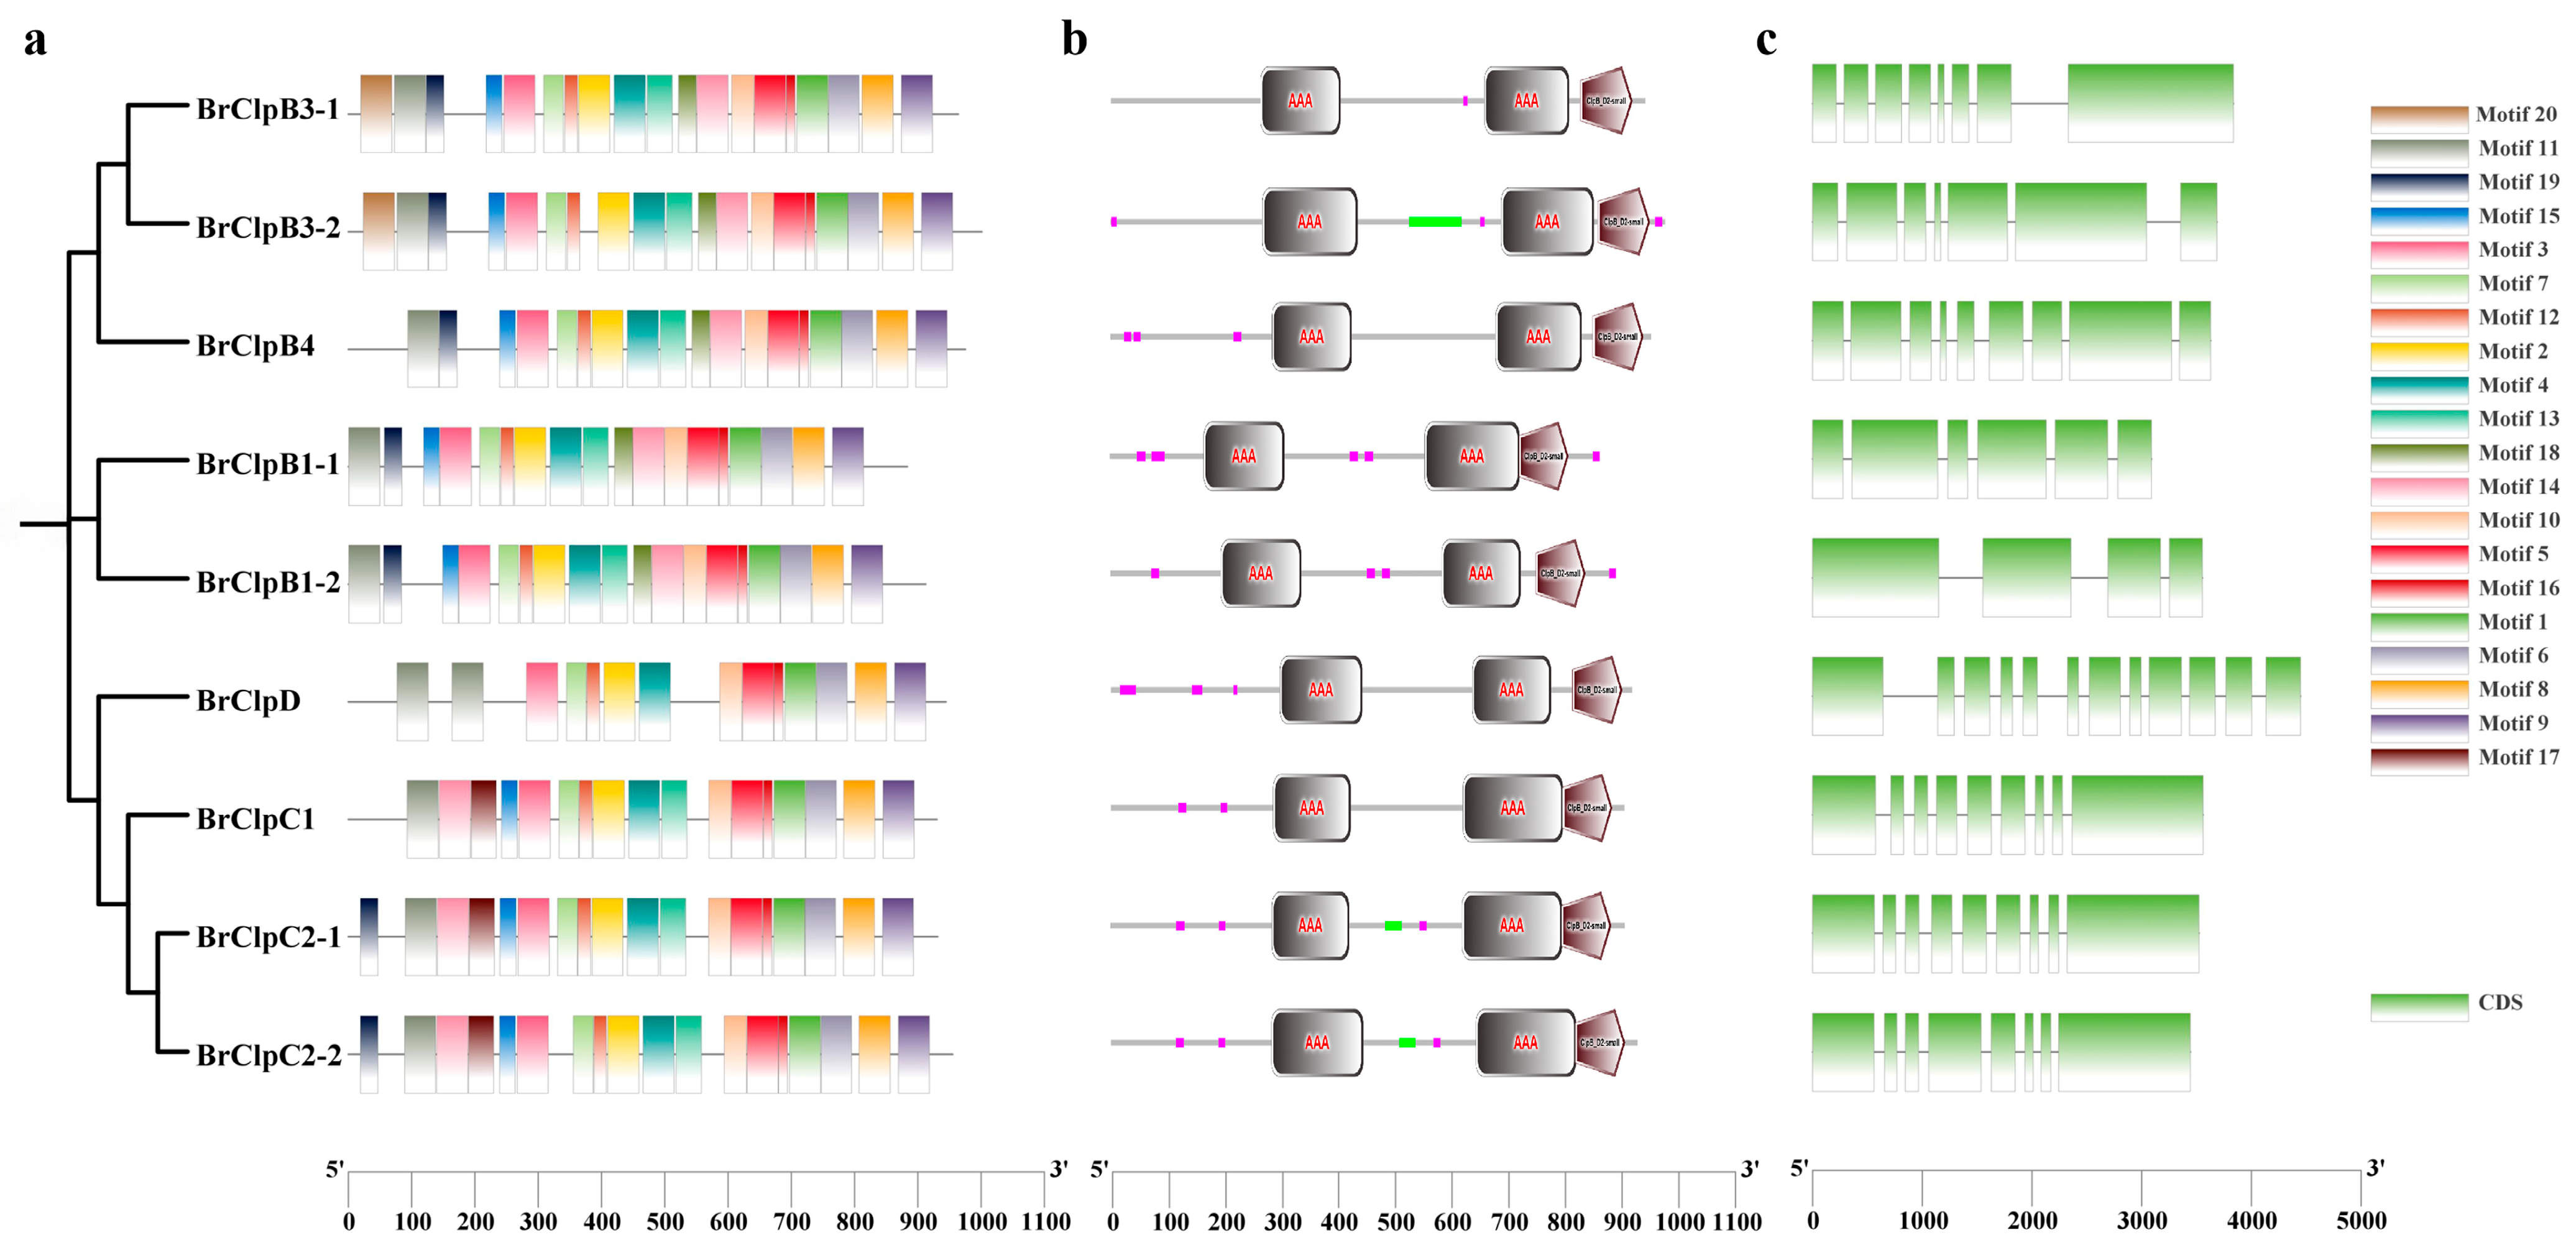
The nine Class I Clp members are distributed across seven chromosomes, and their detailed information is shown in Table 4. In terms of genetic structure, the gene length of Class I BrClp ranged from 3088 to 4,448 bp, with ORF ranged from 2649 to 3003 bp, encoding proteins ranging from 882 to 1000 amino acids. All Class I BrClp protein have acidic pI values (<7). Subcellular localization prediction indicated that all Class I BrClp are located in chloroplast. Conserved domain analysis revealed that all Class I BrClp have two AAA domains (SM000382). Furthermore, motif analysis showed high conservation among the nine members, with 13 shared motifs (motif1-12, motif16) (Figure 6).
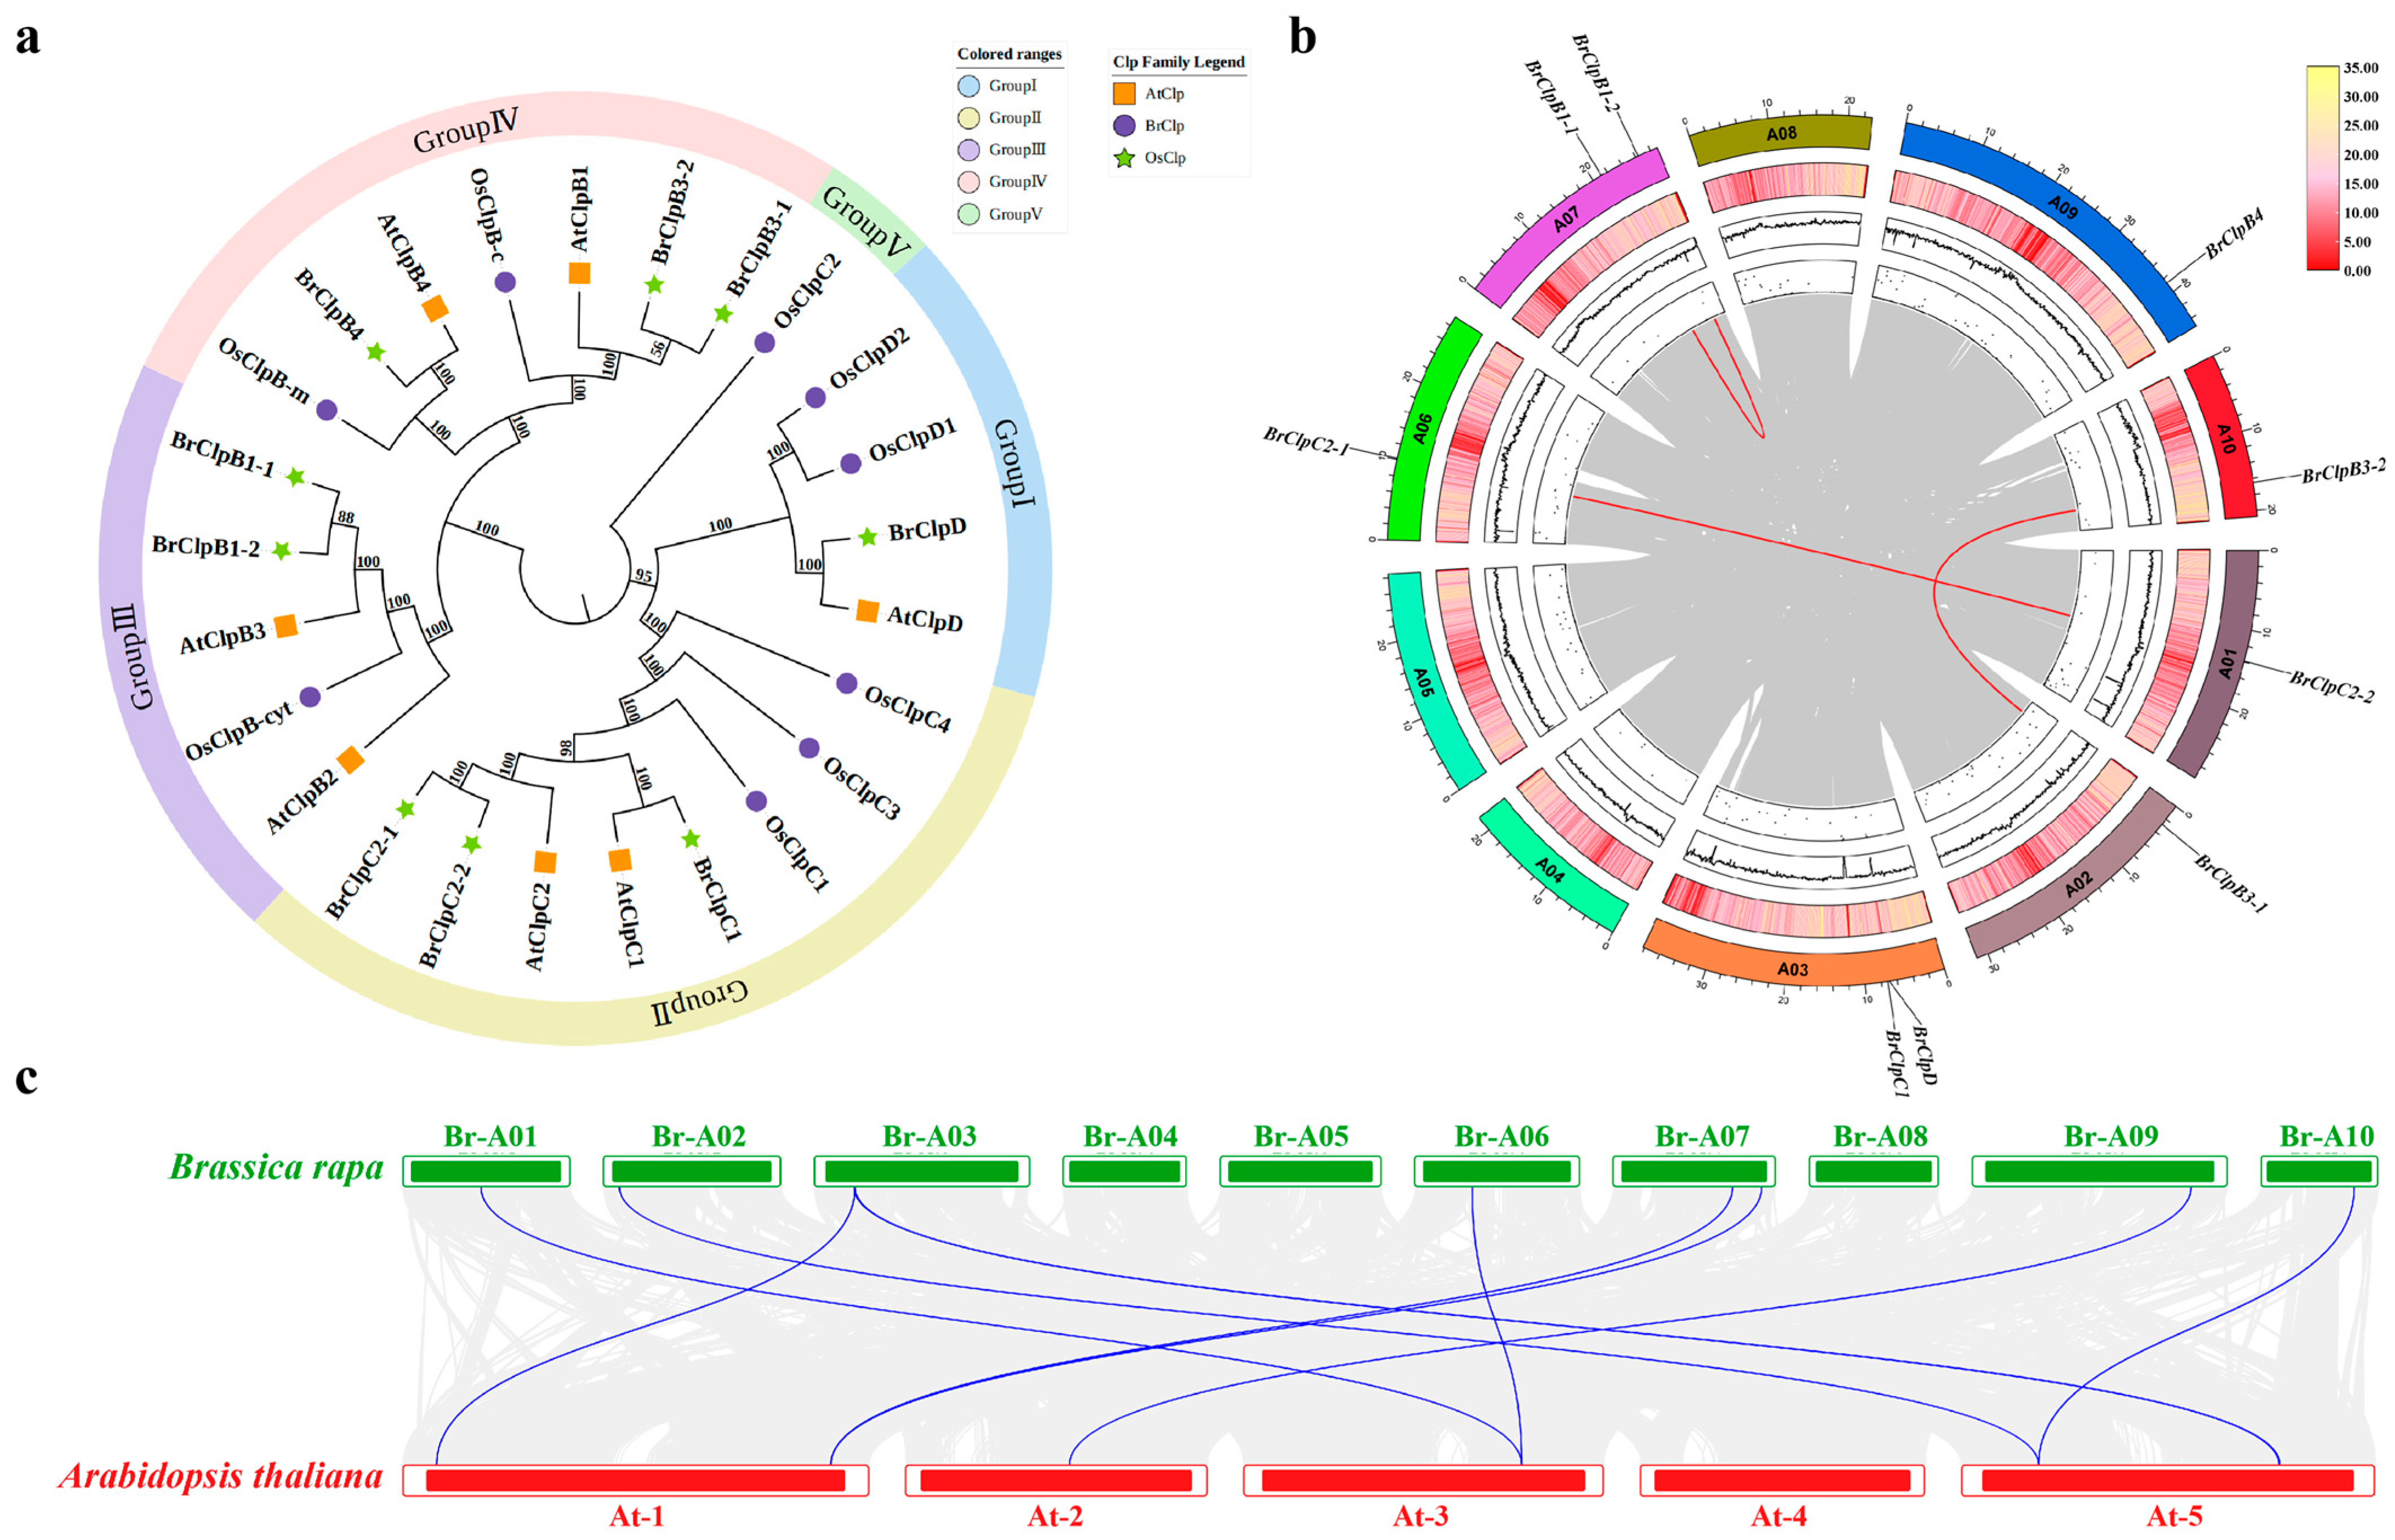
The analysis results of the homologous evolutionary relationship between Brassica rapa, Oryza sativa [32], and Arabidopsis thaliana revealed that the Class I Clp family can be divided into five subfamilies: ClpD, ClpC, two ClpB groups, and a group containing OsClpC2 (Figure 7a). With the exception of subfamily V, which includes only OsClpC2, Class I Clp members from Oryza sativa, Arabidopsis thaliana, and Brassica rapa are distributed across each subfamily. This suggest that the differentiation of Class I Clp family members occurred prior to species differentiation. Furthermore, the evolutionary relationship between Brassica rapa and Arabidopsis thaliana is closer than that between Brassica rapa and Oryza sativa. Intraspecific collinearity analysis of Class I BrClps identified three pairs of segmental duplicated genes: BrClpB1-1 and BrClpB1-2, BrClpB3-1 and BrClpB3-2, BrClpC2-1 and BrClpC2-2 (Figure 7b). Intergenome collinearity analysis of the Class I Clp genes between Arabidopsis thaliana and Brassica rapa revealed the presence of nine pairs of collinear genes between the two species, indicating that Class I Clp genes from Arabidopsis thaliana have undergone expansion in Brassica rapa genome (Figure 7c).
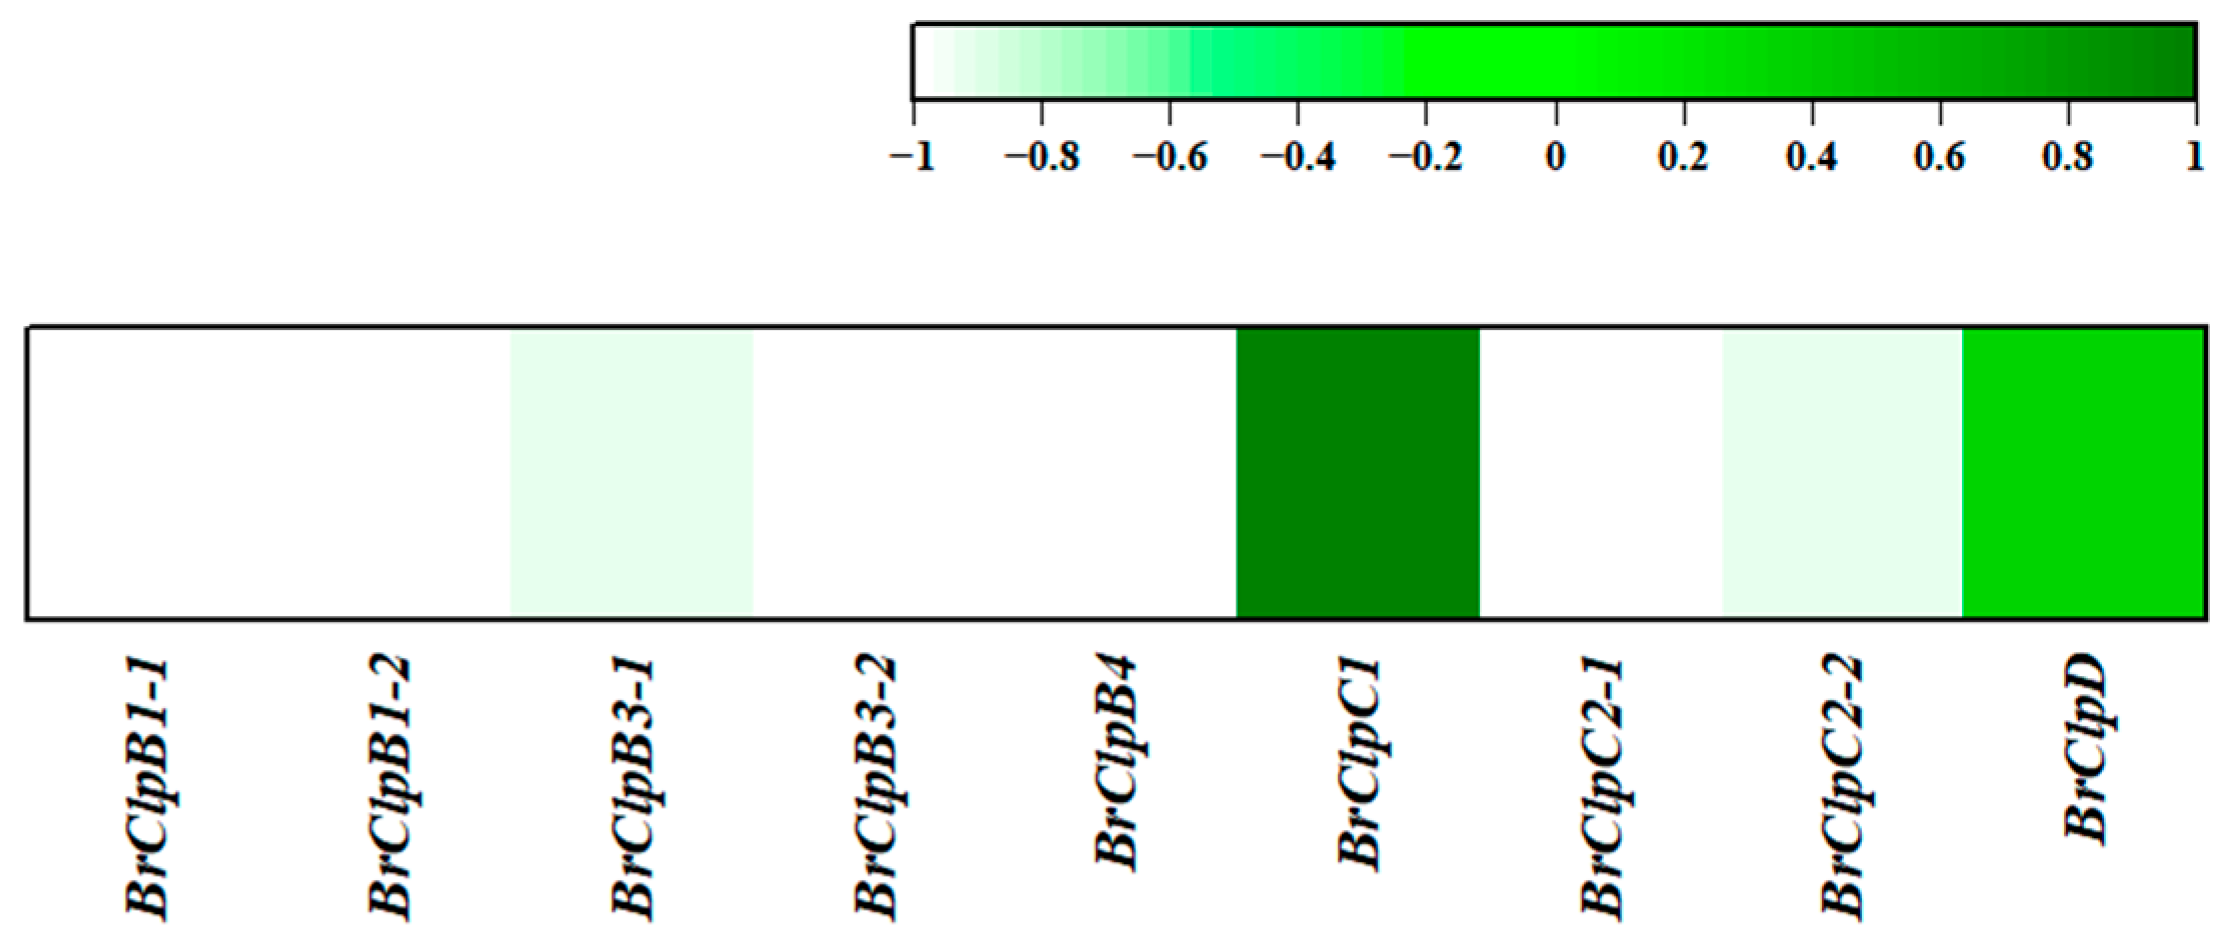
Based on the results described above, the expression pattern of Class I BrClps in leaves were analyzed (Figure 8). The results showed that BrClpC1 exhibited a significantly dominant relative expression level among the family members. The expression level of BrClpB1-1, BrClpB1-2, BrClpB3-2, BrClpB4 and BrClpC2-1 were very low.

4. Discussion

In Chinese cabbage, leaves not only serve as the primary organ for photosynthesis but also as the harvest organ that determines commercial value [33]. In the present study, a pale green mutant, pgm3, with slow growth and reduced chlorophyll content, was identified. Based on the genetic characteristics of the pgm3 mutant trait and whole-genome sequencing results, Mutmap analysis predicted BrClpC1 as the candidate gene of Brpgm3. Genotyping of 184 F2 individuals verified that the SNP A03: 7194530 (located within BrClpC1) was co-segregated with the pale green phenotype. Sequencing results from gene cloning were consistent with the Mutmap analysis and genotyping analysis data, further confirming that BrClpC1 is the gene responsible for the pgm3 pale green phenotype. To our knowledge, this is the first report identifying ClpC1 in Brassica crops. The genetic, phenotypic, physiological characteristics of pgm3, along with the sequence analysis of BrClpC1, will help in understanding the biological function of BrClpC1 and provide a foundation for further underlying the plant pale green trait in Brassica plants.
Chloroplasts are the primary enrichment site for photosynthetic pigments, and their structural integrity is essential for photosynthetic pigment biosynthesis. As we know, chloroplast biogenesis mainly relies on the proteins encoded by nuclear genes, which are imported via the translocon machinery driven by an ATPase motor [34,35]. ClpC, also known as Hsp93, has been considered as an ATP-driven transport motor involved in chloroplast protein import [36]. In this study, sequencing analysis identified BrClpC1 as the candidate gene responsible for the pale green phenotype of pgm3. Compared to the wild-type, the chloroplast inner membrane system of pgm3 is poorly developed, manifested as decreased grana lamellae and grana stacks. This may be due to the loss of BrClpC1 function, which likely hinders the entry of chloroplast proteins encoded by nuclear genes into the chloroplasts. Zhang et al. [37] demonstrated that the abundance of photosynthesis-related proteins in the Atclpc1 mutant markedly decreased, and clpc1 mutation exerted a significant impact on the transcription levels of chloroplast genes. Additionally, the photosynthetic pigment (Chla, Chlb, Car) content of pgm3 decreased, but the Chla/Chlb ratio increased, indicating a greater reduction in Chlb than in Chla. Previous studies have shown that Atclpc1 exhibit a pale green phenotype and that AtClpC1 regulates chlorophyll b biosynthesis [38,39,40]. Li et al. [41] identified a variegation mutant in barley and revealed HvClpC1 is responsible for the mutated trait. Therefore, we propose that BrClpC1 is a strong candidate gene for the pale green phenotype of pgm3.
Gene sequence variation can lead to gene function loss, thereby affecting phenotypes. Wang et al. [42] identified a stay-green gene, BrSGR, in pakchoi, in which a 40 bp insertion in an exon led to the plant maintaining green leaves throughout the whole growth period. In subsequent research, Wang et al. [43] demonstrated that a single nucleotide substitution in BrSGR also brought about green leaf retention. In the present study, Mutmap analysis localized the mutated gene Brpgm3 to a 13.9 Mb region on chromosome A03. After annotation and SNP-index screening (SNP-index value was 1.0), only one SNP was retained, located within BrClpC1. Co-segregation verification results of genotype–phenotype in F2 individuals indicated that this SNP co-segregated with the mutant phenotype, further validating the Mutmap analysis results. Sequence analysis revealed that this SNP caused an amino acid substitution at position 305, located within the conserved AAA domain. The impaired conserved domain likely disrupts the import of essential chloroplast proteins, leading to the accumulation of misfolded or unprocessed proteins in the cytosol or at the chloroplast envelope. Such defects would explain the disorganized thylakoid membranes and reduced starch granules observed in pgm3 chloroplasts, as these structures rely on the proper import and assembly of numerous nuclear-encoded proteins. In Arabidopsis, the clpC1 T-DNA insertion mutants displayed a pale-yellow phenotype with significantly lower chlorophyll content and Fv/Fm [22,44]. And the sequence identity between AtClpC1 and BrClpC1 is as high as 97.20%. However, a SNP located in exon 9 of HvClpC1 is related to leaf variegation (green-yellow striped, completely yellow, and albino) and the plastids in the yellow sectors of the variegated leaves had abnormal development [41] similar to cia2, manifesting as yellowing in Arabidopsis and variegated albostrians in barley [45]. Multiple sequence alignment confirmed that the mutated residue in BrClpC1 is highly conserved across 28 plant species, underscoring its functional importance. However, BrClpC1 exhibits a unique expression pattern in Chinese cabbage, with high expression in young leaves linked to leafy head development, and the mutant phenotype (pale green with smaller leafy heads) is also specific to this species. This suggests that BrClpC1 may have acquired a specialized role in Brassica crops, potentially coordinating chloroplast development with vegetative organ morphology, a trait of significant agronomic relevance for leafy vegetable breeding.
The Clp family belongs to the ATP-dependent protease AAA + superfamily and represents the largest plastid-localized protease family [46,47,48]. Previous studies have demonstrated that members of the Clp protease family contribute to the generation of chloroplasts [49,50]. In the present study, nine members of the Class I Clp family in Brassica rapa were predicted to be localized in chloroplasts. In Arabidopsis, the clpb3 mutant exhibited a pale green color with abnormal chloroplasts development [31,47,50,51,52,53]. Constan et al. [44] isolated two Arabidopsis homologs of Hsp93 (Hsp93-V:AtClpC1 and Hsp93-III:AtClpC2) knockout mutant lines and concluded that AtClpC1 plays a more important role in chloroplast development and function than AtClpC2. This is because Hsp93-V mutant plants are paler with less thylakoid membrane, but Hsp93-III mutant plants display no visible effects. However, overexpression of AtClpC2 in AtclpC1 mutants can complement the functional deficiency of AtClpC1 [53]. The co-gene silencing of NbClpC1/C2 by virus-induced gene silencing resulted in retarded growth, with severely chlorotic leaves [54]. Similar to AtClpC2, the AtClpD knockout mutant was no different with the wild-type [40,55]. These findings suggest that although ClpC/ClpD contains multiple similar structural domains, ClpC1 makes distinct contributions in plant development compared to ClpC2 and ClpD [56,57]. Although significant progress has been made in identifying substrates of Clp protease proteins in the past few years, only ClpC1-dependent substrates have been described so far, indicating that ClpC2 and ClpD are partially redundant [49,58,59]. In the present study, the expression level of BrClpC1 was higher than that of BrClpC2-1 and BrClpC2-2. This differential expression may explain why the mutation in BrClpC1 leads to a visible pale green phenotype, as the lower expression levels of BrClpC2-1 and BrClpC2-2 are likely insufficient to fully compensate for the loss of BrClpC1 function.
While multiple lines of genetic, cytological, and physiological evidence strongly support that BrClpC1 is the candidate gene responsible for the pgm3 phenotype, direct functional validation through genetic transformation is currently lacking. Establishing an efficient genetic transformation system for Chinese cabbage remains a major challenge in the field. Future studies should focus on definitively confirming the biological role of BrClpC1 in chloroplast development and aiming to further elucidate the molecular mechanisms underlying leaf color formation and leafy head formation in Brassica crops.

5. Conclusions

The study identified a pale green mutant pgm3 from an EMS-mutagenized Chinese cabbage mutant library. pgm3 exhibits significantly altered photosynthetic physiological characteristics and forms smaller leafy heads, indicating that disrupted chloroplast development and impaired photosynthetic efficiency affect the yield of Chinese cabbage. Mutmap analysis combined with genotype analysis demonstrated that BrClpC1 was the candidate gene of Brpgm3 responsible for the pale green phenotype. The causal mutation resides in the highly conserved AAA domain, with multiple sequence alignment across 28 plant species highlighting its critical role in chloroplast biogenesis. Furthermore, BrClpC1 had a higher expression level compared to the other eight Class I BrClp members, suggesting its dominant role in chloroplast biogenesis. The specific mutation identified here provides a valuable molecular marker for marker-assisted selection. Collectively, these findings establish BrClpC1 as a promising target to create novel germplasm with tailored photosynthetic efficiency and architectural traits. Furthermore, this study provides an approach to explore the function of BrClpC1 and enhances our understanding of the molecular mechanism underlying the plant pale green trait in Brassica crops.

Supplementary Materials

The following supporting information can be downloaded at: https://www.mdpi.com/article/10.3390/horticulturae12040506/s1, Figure S1: Phenotypic characterization of pgm3 and FT in Chinese cabbage; Figure S2: F2 individuals genotype detecting by KASP (Part of results); Figure S3: Sequence alignment of ClpC1 homologs in 28 species and the protein mutation site of Brclpc1; Table S1: Primer sequence for KASP; Table S2: Primer sequence for gene clone; Table S3: Primer sequence for qRT-PCR; Table S4: Chloroplast features of FT and pgm3 in Chinese cabbage; Table S5: KASP Sequencing results of A03: 7194530.

Author Contributions

Data analysis: Y.Z. and R.L.; drafted the manuscript: Y.Z.; materials creation, and performing the experiments: Y.Z., Z.S., R.Z. and Y.B.; directed the whole study including designing experiments and revising the manuscript: Y.Z., W.F. and H.F. All authors reviewed the results and approved the final version of the manuscript.

Funding

This research was funded by the National Natural Science Foundation of China (32402568), Liaoning Province Natural Science Foundation (2025-BS-0801) and Doctoral Startup Project of Shenyang Normal University (BS202406).

Data Availability Statement

All data generated or analyzed during this study are included in this published article and its Supplementary Information Files.

Conflicts of Interest

The authors declare no conflicts of interest.

References

  1. Carol, P.; Stevenson, D.; Bisanz, C.; Breitenbach, J.; Sandmann, G.; Mache, R.; Coupland, G.; Kuntz, M. Mutations in the Arabidopsis gene IMMUTANS cause a variegated phenotype by inactivating a chloroplast terminal oxidase associated with phytoene desaturation. Plant Cell 1999, 11, 57–68. [Google Scholar] [CrossRef]
  2. Li, X.; Zhang, B.; Du, J.; Chen, S.; Wang, Y.; Li, Q.; Zhuge, S.; Li, X.; Nie, Y.; Li, G.; et al. Maize leaf yellowing gene ZmCAAX modulates growth and drought resistance by regulating abscisic acid contents through interaction with the ABA biosynthetic enzyme ZmNCED3. Plant Biotechnol. J. 2025, 23, 3431–3450. [Google Scholar] [CrossRef]
  3. Jung, K.H.; Hur, J.; Ryu, C.H.; Choi, Y.; Chung, Y.Y.; Miya, A.; Hirochika, H.; An, G. Characterization of a rice chlorophyll-deficient mutant using the T-DNA gene-trap system. Plant Cell Physiol. 2003, 44, 463–472. [Google Scholar] [CrossRef]
  4. Liu, X.; Huang, Q.; Yang, Y.; Tang, J.; Zhao, Y.; Zhang, J. Characterization and Map-Based Cloning of the Novel Rice Yellow Leaf Mutant yl3. J. Plant Biol. 2020, 64, 35–44. [Google Scholar] [CrossRef]
  5. Zhu, L.; Yang, Z.; Zeng, X.; Gao, J.; Liu, J.; Yi, B.; Ma, C.; Shen, J.; Tu, J.; Fu, T.; et al. Heme oxygenase 1 defects lead to reduced chlorophyll in Brassica napus. Plant Mol. Biol. 2017, 93, 579–592. [Google Scholar] [CrossRef] [PubMed]
  6. Song, J.; Guo, L.; Shang, L.; Wang, W.; Yu, C.; Ye, Z.; Zhang, J. VG, encoding a thylakoid formation protein, regulates the formation of variegated leaves in tomato. Hortic. Plant J. 2023, 9, 98–108. [Google Scholar] [CrossRef]
  7. Shalygo, N.; Czarnecki, O.; Peter, E.; Grimm, B. Expression of chlorophyll synthase is also involved in feedback-control of chlorophyll biosynthesis. Plant Mol. Biol. 2009, 71, 425–436. [Google Scholar] [CrossRef] [PubMed]
  8. Zhang, T.; Dong, X.; Yuan, X.; Hong, Y.; Zhang, L.; Zhang, X.; Chen, S. Identification and characterization of CsSRP43, a major gene controlling leaf yellowing in cucumber. Hortic. Res. 2022, 9, uhac212. [Google Scholar] [CrossRef] [PubMed]
  9. Wang, H.; Xia, L.; Chen, J.; Cheng, C. Transcriptome Analysis Reveals the Molecular Mechanism of the Leaf Yellowing in Allotriploid Cucumber. Genes 2024, 15, 825. [Google Scholar] [CrossRef]
  10. Huang, B.; Huang, W.; Liu, Z.; Peng, Y.; Qu, Y.; Zhou, W.; Huang, J.; Shu, H.; Wen, Q. Cytological, Physiological, and Transcriptome Analysis of Leaf-Yellowing Mutant in Camellia chekiangoleosa. Int. J. Mol. Sci. 2025, 26, 132. [Google Scholar] [CrossRef]
  11. Andersson, J.; Wentworth, M.; Walters, R.G.; Howard, C.A.; Ruban, A.V.; Horton, P.; Jansson, S. Absence of the Lhcb1 and Lhcb2 proteins of the light-harvesting complex of photosystem II-Effects on photosynthesis, grana stacking and fitness. Plant J. 2003, 35, 350–361. [Google Scholar]
  12. Wang, J.Y.; Chen, J.D.; Wang, S.L.; Chen, L.; Ma, C.L.; Yao, M.Z. Repressed gene expression of photosynthetic antenna proteins associated with yellow leaf variation as revealed by bulked segregant RNA-seq in tea plant camellia sinensis. Agric. Food Chem. 2020, 68, 8068–8079. [Google Scholar] [CrossRef]
  13. Zhao, S.; Gao, H.; Luo, J.; Wang, H.; Dong, Q.; Wang, Y.; Yang, K.; Mao, K.; Ma, F. Genome-wide analysis of the light-harvesting chlorophyll a/b-binding gene family in apple (Malus domestica) and functional characterization of MdLhcb4.3, which confers tolerance to drought and osmotic stress. Plant Physiol. Biochem. 2020, 154, 517–529. [Google Scholar] [CrossRef]
  14. Cui, Y.; Song, J.; Tang, L.; Wang, J. YELLOW LEAF AND DWARF 7, Encoding a Novel Ankyrin Domain-Containing Protein, Affects Chloroplast Development in Rice. Genes 2024, 15, 1267. [Google Scholar] [CrossRef]
  15. Sun, C.W.; Chen, L.J.; Lin, L.C.; Li, H.M. Leaf-specific upregulation of chloroplast translocon genes by a CCT motif-containing protein, CIA 2. Plant Cell 2001, 13, 2053–2061. [Google Scholar]
  16. Rochaix, J.D. Chloroplast protein import machinery and quality control. FEBS J. 2022, 289, 6908–6918. [Google Scholar] [CrossRef] [PubMed]
  17. Flores-Pérez, Ú.; Jarvis, P. Molecular chaperone involvement in chloroplast protein import. Biochim. Biophys. Acta 2013, 1833, 332–340. [Google Scholar] [CrossRef] [PubMed]
  18. Richardson, L.G.L.; Singhal, R.; Schnell, D.J. The integration of chloroplast protein targeting with plant developmental and stress responses. BMC Biol. 2017, 15, 118. [Google Scholar] [CrossRef] [PubMed]
  19. Sjögren, L.L.E.; Tanabe, N.; Lymperopoulos, P.; Khan, N.Z.; Rodermel, S.R.; Aronsson, H.; Clarke, A.K. Quantitative analysis of the chloroplast molecular chaperone ClpC/Hsp93 in Arabidopsis reveals new insights into its localization, interaction with the Clp proteolytic core, and functional importance. J. Biol. Chem. 2014, 289, 11318–11330. [Google Scholar] [CrossRef]
  20. Flores-Pérez, Ú.; Bédard, J.; Tanabe, N.; Lymperopoulos, P.; Clarke, A.K.; Jarvis, P. Functional Analysis of the Hsp93/ClpC Chaperone at the Chloroplast Envelope. Plant Physiol. 2016, 170, 147–162. [Google Scholar] [CrossRef]
  21. Wu, H.; Ji, Y.; Du, J.; Kong, D.; Liang, H.; Ling, H.Q. ClpC1, an ATP-dependent Clp protease in plastids, is involved in iron homeostasis in Arabidopsis leaves. Ann. Bot. 2010, 105, 823–833. [Google Scholar] [CrossRef] [PubMed]
  22. Sjögren, L.L.; MacDonald, T.M.; Sutinen, S.; Clarke, A.K. Inactivation of the clpC1 gene encoding a chloroplast Hsp100 molecular chaperone causes growth retardation, leaf chlorosis, lower photosynthetic activity, and a specific reduction in photosystem content. Plant Physiol. 2004, 136, 4114–4126. [Google Scholar] [CrossRef]
  23. Gao, Y.; Qu, G.; Huang, S.; Liu, Z.; Zhang, M.; Fu, W.; Ren, J.; Feng, H. Comparison between Germinated Seed and Isolated Microspore EMS Mutagenesis in Chinese Cabbage (Brassica rapa L. ssp. pekinensis). Horticulturae 2022, 8, 232. [Google Scholar] [CrossRef]
  24. Zhao, Y.; Huang, S.; Zhang, M.; Zhang, Y.; Feng, H. Mapping of a pale green mutant gene and its functional verification by allelic mutations in Chinese cabbage (Brassica rapa L. ssp. pekinensis). Front. Plant Sci. 2021, 12, 699308. [Google Scholar] [CrossRef]
  25. Zhao, Y.; Huang, S.; Wang, N.; Zhang, Y.; Ren, J.; Zhao, Y.; Feng, H. Identification of a biomass unaffected pale green mutant gene in Chinese cabbage (Brassica rapa L. ssp. pekinensis). Sci. Rep. 2022, 12, 7731. [Google Scholar] [CrossRef] [PubMed]
  26. Li, H.; Durbin, R. Fast and accurate short read alignment with Burrows-Wheeler transform. Bioinformatics 2009, 25, 1754–1760. [Google Scholar] [CrossRef] [PubMed]
  27. Zhu, P.; He, L.; Li, Y.; Huang, W.; Xi, F.; Lin, L.; Zhi, Q.; Zhang, W.; Tang, Y.T.; Geng, C.; et al. OTG-snpcaller: An optimized pipeline based on TMAP and GATK for SNP calling from ion torrent data. PLoS ONE 2014, 9, e97507. [Google Scholar] [CrossRef]
  28. Wang, K.; Li, M.; Hakonarson, H. ANNOVAR: Functional annotation of genetic variants from next-generation sequencing data. Nucleic Acids Res. 2010, 38, e164. [Google Scholar] [CrossRef]
  29. Huang, S.; Gao, Y.; Xue, M.; Xu, J.; Liao, R.; Shang, S.; Yang, X.; Zhao, Y.; Li, C.; Liu, Z.; et al. BrKAO2 mutations disrupt leafy head formation in Chinese cabbage (Brassica rapa L. ssp. pekinensis). Theor. Appl. Genet. 2022, 135, 2453–2468. [Google Scholar] [CrossRef] [PubMed]
  30. Schirmer, E.C.; Glover, J.R.; Singer, M.A.; Lindquist, S. HSP100/Clp proteins: A common mechanism explains diverse functions. Trends Biochem. Sci. 1996, 21, 289–296. [Google Scholar] [CrossRef]
  31. Kreis, E.; Niemeyer, J.; Merz, M.; Scheuring, D.; Schroda, M. CLPB3 is required for the removal of chloroplast protein aggregates and thermotolerance in Chlamydomonas. J. Exp. Bot. 2023, 74, 3714–3728. [Google Scholar] [CrossRef] [PubMed]
  32. Singh, A.; Singh, U.; Mittal, D.; Grover, A. Genome-wide analysis of rice ClpB/HSP100, ClpC and ClpD genes. BMC Genom. 2010, 11, 95. [Google Scholar] [CrossRef]
  33. Zhang, B.; Su, T.; Xin, X.; Wang, W.; Zhao, X.; Zhang, D.; Yu, Y.; Zhang, F.; Li, P.; Yu, S. Development and application of the SNP14K array to accelerate Brassica rapa genetic research. Agric. Commun. 2025, 3, 100111. [Google Scholar] [CrossRef]
  34. Liang, K.; Jin, Z.; Zhan, X.; Li, Y.; Xu, Q.; Xie, Y.; Yang, Y.; Wang, S.; Wu, J.; Yan, Z. Structural insights into the chloroplast protein import in land plants. Cell 2024, 187, 5651–5664.e18. [Google Scholar] [CrossRef]
  35. Gawroński, P.; Burdiak, P.; Scharff, L.B.; Mielecki, J.; Górecka, M.; Zaborowska, M.; Leister, D.; Waszczak, C.; Karpiński, S. CIA2 and CIA2-LIKE are required for optimal photosynthesis and stress responses in Arabidopsis thaliana. Plant J. 2021, 105, 619–638. [Google Scholar] [CrossRef]
  36. Nakai, M. New Perspectives on Chloroplast Protein Import. Plant Cell Physiol. 2018, 59, 1111–1119. [Google Scholar] [CrossRef] [PubMed]
  37. Zhang, S.; Zhang, H.; Xia, Y.; Xiong, L. The caseinolytic protease complex component CLPC1 in Arabidopsis maintains proteome and RNA homeostasis in chloroplasts. BMC Plant Biol. 2018, 18, 192. [Google Scholar] [CrossRef] [PubMed]
  38. Nakagawara, E.; Sakuraba, Y.; Yamasato, A.; Tanaka, R.; Tanaka, A. Clp protease controls chlorophyll b synthesis by regulating the level of chlorophyllide a oxygenase. Plant J. 2007, 49, 800–809. [Google Scholar] [CrossRef]
  39. Nishimura, K.; Asakura, Y.; Friso, G.; Kim, J.; Oh, S.H.; Rutschow, H.; Ponnala, L.; van Wijk, K.J. ClpS1 is a conserved substrate selector for the chloroplast Clp protease system in Arabidopsis. Plant Cell 2013, 25, 2276–2301. [Google Scholar] [CrossRef]
  40. Rodriguez-Concepcion, M.; D’Andrea, L.; Pulido, P. Control of plastidial metabolism by the Clp protease complex. J. Exp. Bot. 2019, 70, 2049–2058. [Google Scholar] [CrossRef]
  41. Li, M.; Guo, G.; Pidon, H.; Melzer, M.; Prina, A.R.; Börner, T.; Stein, N. ATP-Dependent Clp Protease Subunit C1, HvClpC1, Is a Strong Candidate Gene for Barley Variegation Mutant luteostrians as Revealed by Genetic Mapping and Genomic Re-sequencing. Front. Plant Sci. 2021, 16, 664085. [Google Scholar] [CrossRef]
  42. Wang, N.; Liu, Z.; Zhang, Y.; Li, C.; Feng, H. Identification and fine mapping of a stay-green gene (Brnye1) in pakchoi (Brassica campestris L. ssp. chinensis). Theor. Appl. Genet. 2018, 131, 673–684. [Google Scholar] [CrossRef]
  43. Wang, N.; Zhang, Y.; Huang, S.; Liu, Z.; Li, C.; Feng, H. Defect in Brnym1, a magnesium-dechelatase protein, causes a stay-green phenotype in an EMS-mutagenized Chinese cabbage (Brassica campestris L. ssp. pekinensis) line. Hortic. Res. 2020, 7, 8. [Google Scholar] [CrossRef]
  44. Constan, D.; Froehlich, J.E.; Rangarajan, S.; Keegstra, K. A stromal Hsp100 protein is required for normal chloroplast development and function in Arabidopsis. Plant Physiol. 2004, 136, 3605–3615. [Google Scholar] [CrossRef]
  45. Li, M.; Hensel, G.; Mascher, M.; Melzer, M.; Budhagatapalli, N.; Rutten, T.; Himmelbach, A.; Beier, S.; Korzun, V.; Kumlehn, J.; et al. Leaf Variegation and Impaired Chloroplast Development Caused by a Truncated CCT Domain Gene in albostrians Barley. Plant Cell 2019, 31, 1430–1445. [Google Scholar] [CrossRef] [PubMed]
  46. Peltier, J.B.; Ripoll, D.R.; Friso, G.; Rudella, A.; Cai, Y.; Ytterberg, J.; Giacomelli, L.; Pillardy, J.; van Wijk, K.J. Clp protease complexes from photosynthetic and non-photosynthetic plastids and mitochondria of plants, their predicted three-dimensional structures, and functional implications. J. Biol. Chem. 2004, 279, 4768–4781. [Google Scholar] [CrossRef] [PubMed]
  47. Zybailov, B.; Friso, G.; Kim, J.; Rudella, A.; Rodríguez, V.R.; Asakura, Y.; Sun, Q.; van Wijk, K.J. Large scale comparative proteomics of a chloroplast Clp protease mutant reveals folding stress, altered protein homeostasis, and feedback regulation of metabolism. Mol. Cell. Proteom. 2009, 8, 1789–1810. [Google Scholar] [CrossRef] [PubMed]
  48. Van Wijk, K.J. Protein maturation and proteolysis in plant plastids, mitochondria, and peroxisomes. Annu. Rev. Plant Biol. 2015, 66, 75–111. [Google Scholar] [CrossRef]
  49. Kovacheva, S.; Bédard, J.; Wardle, A.; Patel, R.; Jarvis, P. Further in vivo studies on the role of the molecular chaperone, Hsp93, in plastid protein import. Plant J. 2007, 50, 364–379. [Google Scholar] [CrossRef]
  50. Kim, J.; Rudella, A.; Ramirez Rodriguez, V.; Zybailov, B.; Olinares, P.D.; van Wijk, K.J. Subunits of the plastid ClpPR protease complex have differential contributions to embryogenesis, plastid biogenesis, and plant development in Arabidopsis. Plant Cell 2009, 21, 1669–1692. [Google Scholar] [CrossRef]
  51. Myouga, F.; Motohashi, R.; Kuromori, T.; Nagata, N.; Shinozaki, K. An Arabidopsis chloroplast-targeted Hsp101 homologue, APG6, has an essential role in chloroplast development as well as heat-stress response. Plant J. 2006, 48, 249–260. [Google Scholar] [CrossRef]
  52. Lee, U.; Rioflorido, I.; Hong, S.W.; Larkindale, J.; Waters, E.R.; Vierling, E. The Arabidopsis ClpB/Hsp100 family of proteins: Chaperones for stress and chloroplast development. Plant J. 2007, 49, 115–127. [Google Scholar] [CrossRef] [PubMed]
  53. Welsch, R.; Zhou, X.; Yuan, H.; Álvarez, D.; Sun, T.; Schlossarek, D.; Yang, Y.; Shen, G.; Zhang, H.; Rodriguez-Concepcion, M.; et al. Clp Protease and OR Directly Control the Proteostasis of Phytoene Synthase, the Crucial Enzyme for Carotenoid Biosynthesis in Arabidopsis. Mol. Plant 2018, 11, 149–162. [Google Scholar] [CrossRef] [PubMed]
  54. Ali, M.S.; Baek, K.H. Co-Suppression of NbClpC1 and NbClpC2, Encoding Clp Protease Chaperons, Elicits Significant Changes in the Metabolic Profile of Nicotiana benthamiana. Plants 2020, 9, 259. [Google Scholar] [CrossRef]
  55. Olinares, P.D.; Kim, J.; van Wijk, K.J. The Clp protease system; a central component of the chloroplast protease network. Biochim. Biophys. Acta 2011, 1807, 999–1011. [Google Scholar] [CrossRef]
  56. Nishimura, K.; Apitz, J.; Friso, G.; Kim, J.; Ponnala, L.; Grimm, B.; van Wijk, K.J. Discovery of a unique Clp component, ClpF, in chloroplasts: A proposed binary ClpF-ClpS1 adaptor complex functions in substrate recognition and delivery. Plant Cell 2015, 27, 2677–2691. [Google Scholar] [CrossRef]
  57. Nishimura, K.; Kato, Y.; Sakamoto, W. Chloroplast Proteases: Updates on Proteolysis within and across Suborganellar Compartments. Plant Physiol. 2016, 171, 2280–2293. [Google Scholar] [CrossRef] [PubMed]
  58. Nishimura, K.; van Wijk, K.J. Organization, function and substrates of the essential Clp protease system in plastids. Biochim. Biophys. Acta 2015, 1847, 915–930. [Google Scholar] [CrossRef]
  59. Rei Liao, J.Y.; Friso, G.; Forsythe, E.S.; Michel, E.J.S.; Williams, A.M.; Boguraev, S.S.; Ponnala, L.; Sloan, D.B.; van Wijk, K.J. Proteomics, phylogenetics, and coexpression analyses indicate novel interactions in the plastid CLP chaperone-protease system. J. Biol. Chem. 2022, 298, 101609. [Google Scholar] [CrossRef]
Figure 1. Phenotypic of pgm3 (left) and FT (right) in Chinese cabbage.
Horticulturae 12 00506 g001
Figure 2. Physiological characteristics and ultrastructure of chloroplasts in wild-type FT and pgm3 in Chinese cabbage. (a) Photosynthetic pigment content of leaves in wild-type FT and pgm3. (b) Mesophyll cells of FT visualized with TEM. (c) Mesophyll cells of pgm3 visualized with TEM. Scale is shown at the bottom right. (d) Net photosynthetic rates of pgm3 compared with FT. (e) Stomatal conductance of pgm3 compared with FT. (f) Intercellular CO2 concentrations of pgm3 compared with FT. (g) Transpiration rates of pgm3 compared with FT. (h) F0 of pgm3 compared with FT. (i) Fv/Fm of pgm3 compared with FT. (j) Fv’/Fm’ of pgm3 compared with FT. (k) NPQ of pgm3 compared with FT. The ‘*’ represents statistically significant differences at the 5% level (t-test).
Horticulturae 12 00506 g002
Figure 3. Distribution map of SNP-index on chromosome. Note: The abscissa represents the name and length of each chromosome, and the ordinate represents the SNP index value. The blue dots represent SNP. The red line is the mean value of the SNP index under the window, the pink line is the threshold line corresponding to the 99th percentile (SNP index = 1.0), and the orange line is the threshold line corresponding to the 95th percentile (SNP index = 0.7776).
Horticulturae 12 00506 g003
Figure 4. Sequence analysis of BrClpC1. (a) Gene structure of BrClpC1 and the mutation site of pgm3. (b) Alignments of the nucleotide and amino acid sequences of BrClpC1 between FT and pgm3. The red box indicates the mutation site of pgm3. (c) Conserved domain of BrClpC1 and the mutation site of pgm3. (d) The second structure of BrClpC1 in FT and pgm3. Blue represents the alpha helix, red represents the extended chain, orange represents the random coil, and purple represents the β-sheet.
Horticulturae 12 00506 g004
Figure 5. The expression pattern of BrClpC1. (a) Expression of BrClpC1 in various organs of FT: root, stem, leaf, flower, bud, and pod. (b) Expression of BrClpC1 at different stage leaves between FT: cotyledon, seedling leaf, rosette leaf, and heading leaf. (c) Expression of BrClpC1 in seedling leaf of FT and pgm3. The letters indicate significantly differences under ANOVA analysis. ‘*’ represents statistically significant differences at the 5% level (t-test).
Horticulturae 12 00506 g005
Figure 6. Phylogenetic tree and conserved motif (a), domain (b), gene structure (c) of Class I Clp members in Brassica rapa.
Horticulturae 12 00506 g006
Figure 7. Phylogenetic tree and collinearity analysis of Class I BrClp. (a) Phylogenetic tree of Class I Clp in Oryza sativa, Arabidopsis thaliana and Brassica rapa. (b) Intraspecific collinearity of Class I BrClp members, red lines indicate genomic duplication events. (c) Interspecific collinearity of Class I Clp members in Arabidopsis thaliana and Brassica rapa. Homologous gene pairs are connected by blue lines.
Horticulturae 12 00506 g007
Figure 8. The expression pattern of the Class I BrClps.
Horticulturae 12 00506 g008
Table 1. Heading stage index of pgm3 and FT.
MaterialGross WeightNet WeightNet Weight RateTransverse DiameterLongitudinal DiameterSpheroidal Index
FT405.44 ± 37.52 *260.59 ± 38.70 *0.64 ± 0.04 *7.42 ± 0.43 *10.62 ± 0.36 *1.43 ± 0.09 *
pgm3179.53 ± 17.6374.73 ± 15.850.41 ± 0.064.66 ± 0.849.23 ± 0.412.06 ± 0.48
Note: The ‘*’ represents statistically significant differences at the 5% level (t-test).
Table 2. Genetic analysis of pgm3 about pale green phenotype in Chinese cabbage.
GenerationGreen PlantPale Green PlantTotalSegregation Ratioχ2 Test
P1 (FT)85085
P2 (pgm3)07878
F1 (P1 × P2)27027
F1 (P1 × P2)25025
BC1 (F1 × FT)45045
BC1 (F1 × pgm3)2620461.30:10.783 (1:1)
F25519742.89:10.018 (3:1)
Table 3. Candidate SNP information of Brpem based on Mutmap analysis.
ChromosomePositionSNP-IndexFT Genotypepgm3 GenotypeMutation_TypeGeneID
A037,194,5301.0GAnon-synonymous SNVBraA03g015750.3C
Table 4. Class I Clp members information in Brassica rapa.
Gene NameGene IDGene Length, ORF, IntornsMolecular Weigth, Isoelectric PointPredicted Cellular LocalizationHomologs in Arabidopsis thaliana
BrClpB1-1BraA07g028300.3C3088, 2649, 597,936.91, 5.73ChloroplastAtClpB1:
AT5G15450
BrClpB1-2BraA07g038220.3C3554, 2736, 4101,004.29, 5.86Chloroplast
BrClpB3-1BraA02g006000.3C3837, 2892, 7108,174.21, 5.96ChloroplastAtClpB3:
AT1G74310
BrClpB3-2BraA10g024000.3C3687, 3003, 6112,394.79, 5.87Chloroplast
BrClpB4BraA09g053310.3C3627, 2925, 8109,295.77, 6.29ChloroplastAtClpB4:
AT2G25140
BrClpC1BraA03g015750.3C3559, 2790, 8103,159.15, 6.33ChloroplastAtClpC1:
AT5G50920
BrClpC2-1BraA06g018160.3C3522, 2973, 8103,383.10, 5.99ChloroplastAtClpC2:
AT3G48870
BrClpC2-2BraA01g024020.3C3443, 2865, 7106,224.96, 6.59Chloroplast
BrClpDBraA03g015680.3C4448, 2932, 11103,205.57, 5.76ChloroplastAtClpD:
AT5G51070
Disclaimer/Publisher’s Note: The statements, opinions and data contained in all publications are solely those of the individual author(s) and contributor(s) and not of MDPI and/or the editor(s). MDPI and/or the editor(s) disclaim responsibility for any injury to people or property resulting from any ideas, methods, instructions or products referred to in the content.