Article

Determination of the Genetic Diversity of Avocado (Persea americana Mill.) Germplasm in the Canary Islands (Spain) Using Morphological and ISSR Molecular Markers


by
Lorenzo Rodríguez
1,
José Ignacio Hormaza
2,
Federico Laich
3,*,
Verónica Pérez
4,
María Guacimara Medina-Alonso
1 and
Domingo Ríos
1,5,6,*
1
Unidad de Desarrollo Rural, Servicio Técnico de Agricultura y Desarrollo Rural del Cabildo Insular de Tenerife, C/Alcalde Mandillo Tejera 8, 34007 Santa Cruz de Tenerife, Spain
2
Instituto de Hortofruticultura Subtropical y Mediterránea La Mayora (IHSM-CSIC-UMA), 29750 Algarrobo-Costa, Spain
3
Unidad de Protección Vegetal, Instituto Canario de Investigaciones Agrarias (ICIA), Ctra. El Boquerón s/n, 38270 Valle de Guerra, Spain
4
Jardín de Aclimatación de La Orotava, Instituto Canario de Investigaciones Agrarias (ICIA), C/Retama 2, 38400 Puerto de la Cruz, Spain
5
Centro de Conservación de la Biodiversidad Agrícola de Tenerife, Servicio Técnico de Agricultura y Desarrollo Rural del Cabildo Insular de Tenerife, Calle Retama 2, 38400 Puerto de la Cruz, Spain
6
Departamento de Ingeniería Agraria y del Medio Natural, Universidad de La Laguna, Carretera de Geneto 2, 38071 San Cristóbal de La Laguna, Spain
*
Authors to whom correspondence should be addressed.
Horticulturae 2026, 12(2), 182; https://doi.org/10.3390/horticulturae12020182
Submission received: 12 December 2025 / Revised: 26 January 2026 / Accepted: 29 January 2026 / Published: 31 January 2026

Abstract

In this study, we conducted a comprehensive characterization of avocado accessions from the Canary Islands, focusing on molecular, morphological, phenological, and agronomic traits. A total of 311 trees were initially prospected across Tenerife, La Palma, Gran Canaria, and La Gomera Islands. DNA was extracted from young leaves, and genetic diversity was assessed using 28 microsatelites primers, 14 of which were highly polymorphic, revealing 6937 amplified fragments, 137 of which were polymorphic. The average polymorphism percentage was 85.68%, with an expected heterozygosity of 0.68, indicating high genetic diversity. A dendrogram based on genetic data identified four main groups, two of which are closely related to the most widely cultivated avocado cultivars: ‘Hass’, ‘Fuerte’, and ‘Pinkerton’. Morphological analysis (over three years), using 91 descriptors, revealed a clear differentiation between accessions, with several groups corresponding to specific commercial cultivars. Morphotypes that deviated from the main groupings were specimens obtained through sexual propagation. Principal component analysis revealed that fruit characteristics such as length-to-diameter ratio, seed size, and fruit weight were the most discriminating traits, consistent with findings in the Persea genus. These results highlight the genetic and morphological diversity within the Canary Islands avocado germplasm, providing valuable insights for future breeding and conservation efforts.

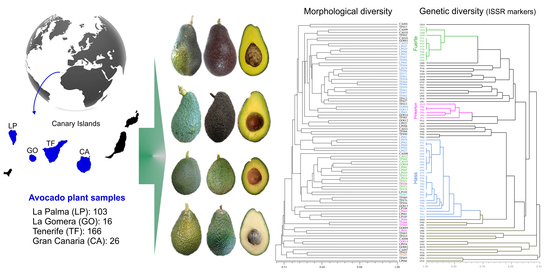
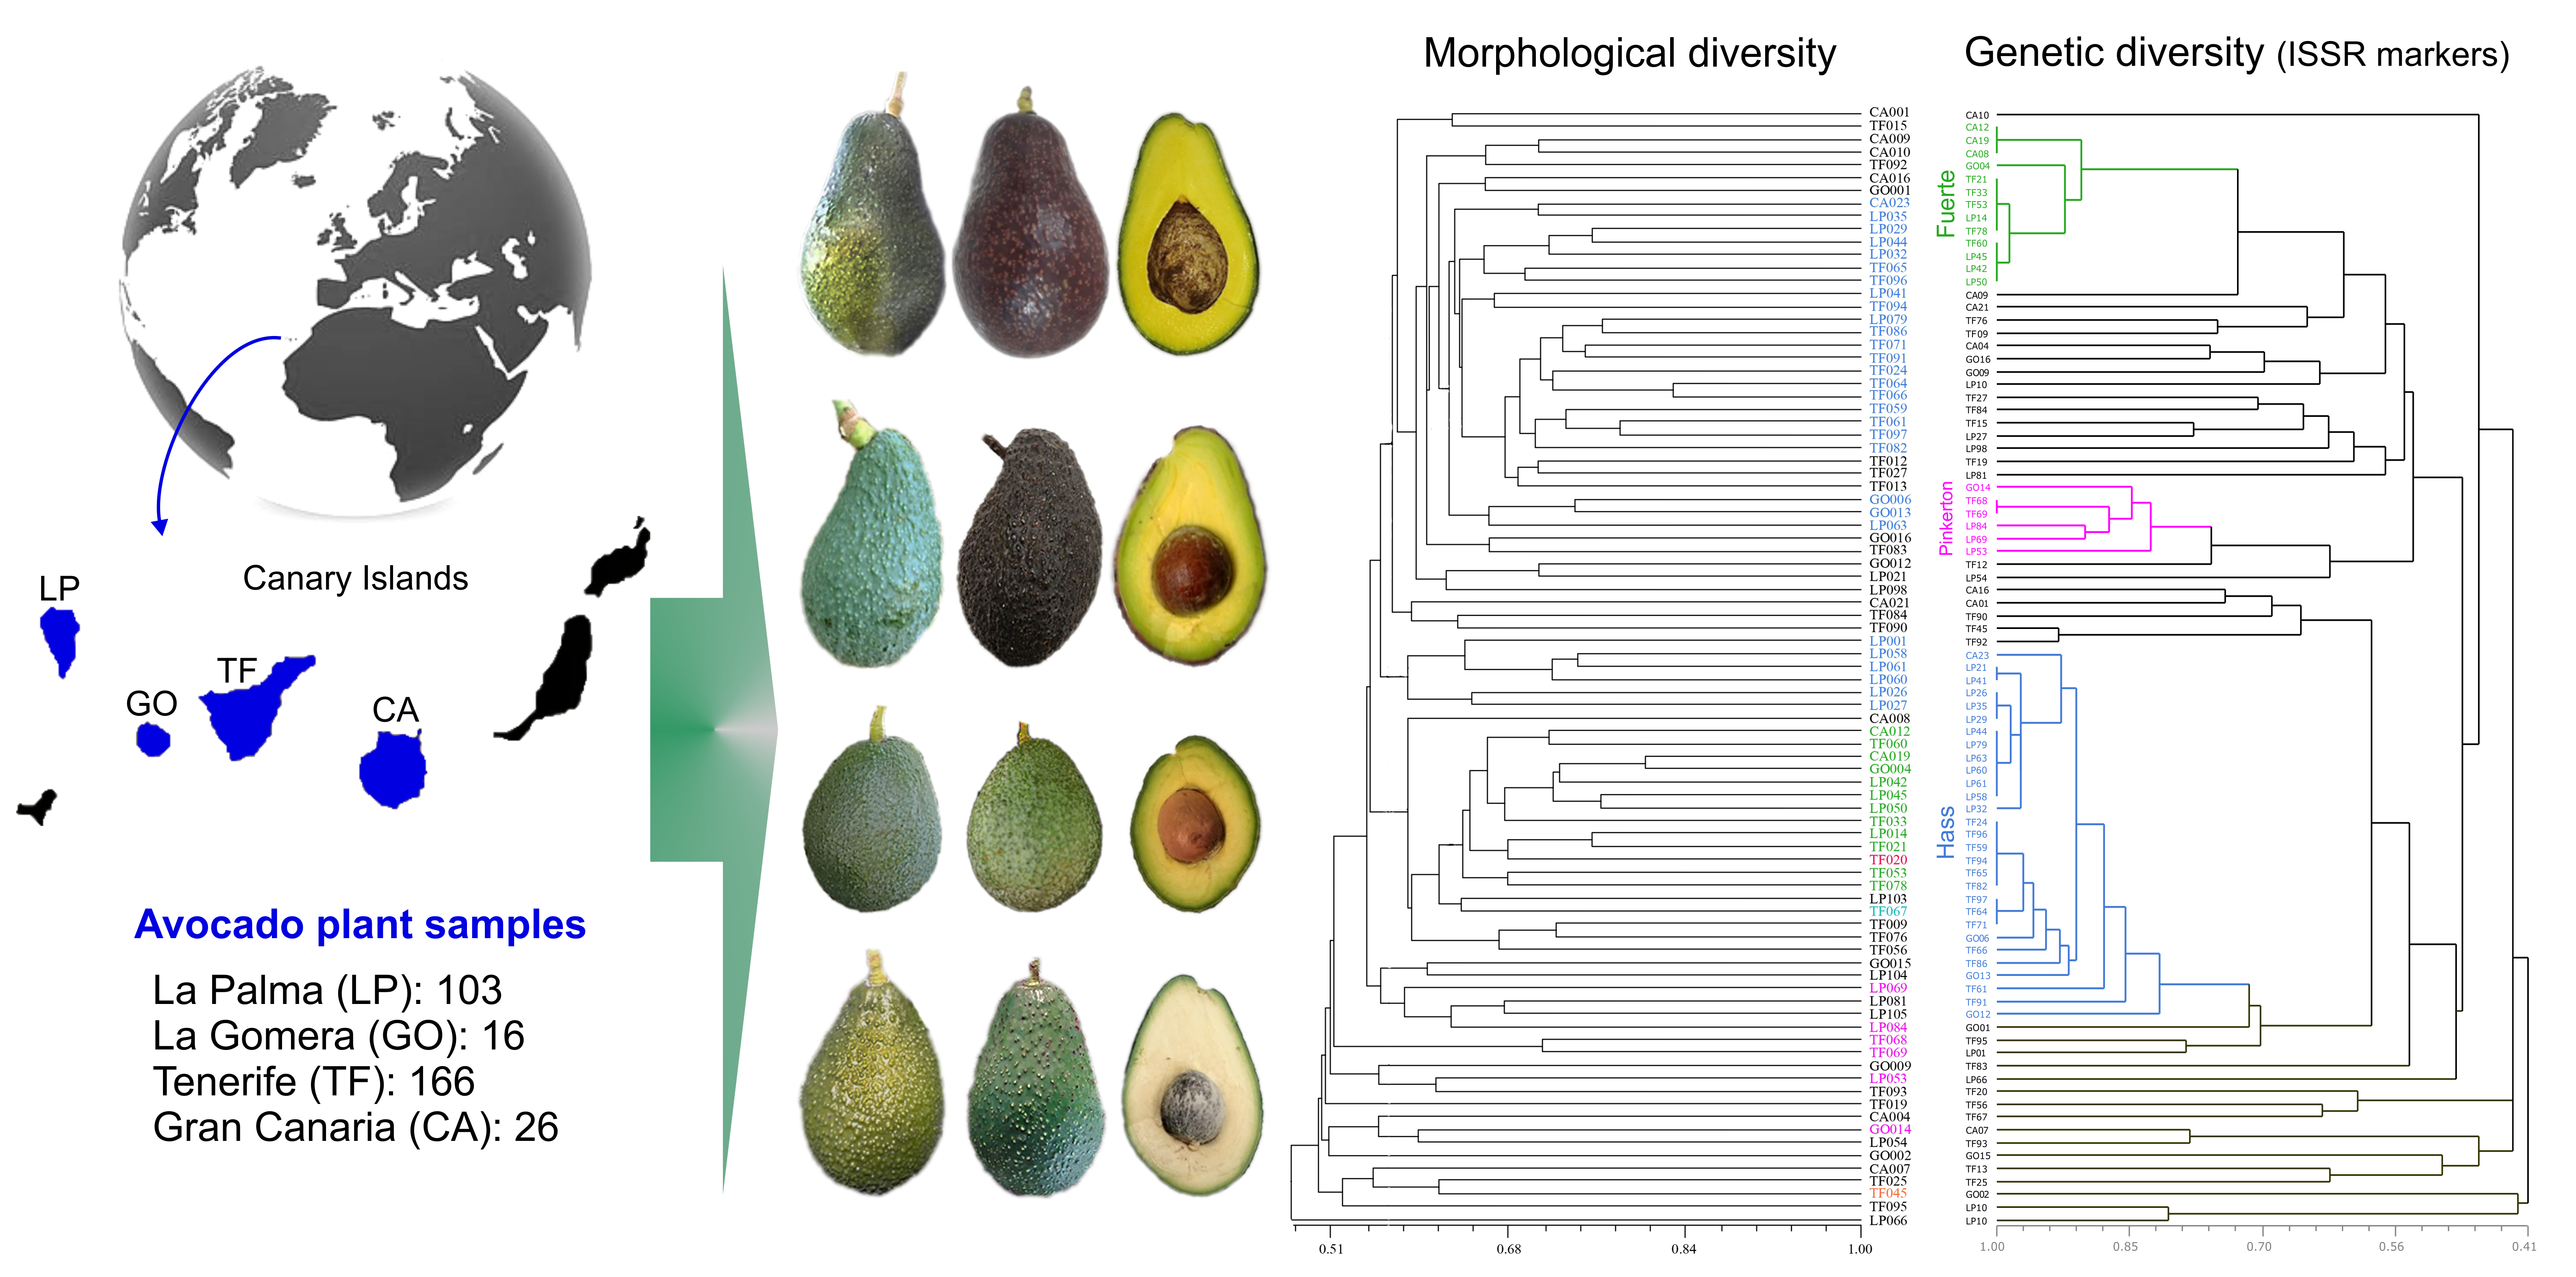
Graphical Abstract

1. Introduction

The avocado (Persea americana Miller) [1] is a subtropical tree belonging to the Persea genus and is one of the most economically important species in the Lauraceae family [2,3].
Avocados were introduced to Spain by sailors and conquistadors, particularly along the south-eastern Mediterranean coast and in the Canary Islands [4]. However, according to Salas and Cáceres [5], they were introduced by Franciscan monks from Valencia between 1564 and 1565. The earliest written reference to the avocado plant appears in Clusius’s 1576 work Rariorum aliquot stirpium per Hispanias observatarum historia, in which he describes how Juan Plaza, the founder of the Valencia Botanical Garden, introduced him to the plant [6]. In his 1601 work Rariorum plantarum historia, Clusius refers to the species within the genus Persea as Persea teophrasti.
The first known reference to the avocado in the Canary Islands was made in 1803 by Bory de Saint Vincent [7], who identified it as Laurus persea. In his catalogue of plants found in Tenerife and classified according to Jussieu’s system, Bory de Saint Vincent cites Laurus nobilis as the laurel, Laurus indica as the viñátigo, and Laurus persea (numbered 160 in his list) as the avocado. This classification follows Linnaeus’s system, as outlined in his 1753 treatise Species Plantarum [2]. Avocados were most likely introduced to the Canary Islands around the same time as to the Iberian Peninsula. In fact, they may have been introduced even earlier, given that the Canary Islands were a port of call between Spain and Americas in the 16th century, and their subtropical location would have allowed for rapid acclimatisation. Therefore, since the 16th century, and particularly during the 20th century, a wide variety of avocado cultivars have been introduced to the Canary Islands, making the archipelago a reservoir of biodiversity for this species.
In the Canary Islands, avocado crop size has increased by an average of 110 hectares per year in recent years. There are approximately 2250 hectares of avocado trees, mainly on the islands of Tenerife, La Palma and Gran Canaria, at altitudes ranging from sea level to 800 m. The main cultivar is ‘Hass’, followed by ‘Fuerte’, ‘Pinkerton’ and ‘Reed’, which have no practical relevance. The average yield is approximately 10 t/ha [8], also some farms exceed this figure. Propagation of the plant is carried out using rootstocks from the ‘Del País’ and ‘Orotava’ cultivars [9,10,11]. Some avocado trees grow isolated on small farms or in gardens without grafting and usually exhibit morphological and agronomic differences. These trees hold significant potential for future breeding initiatives in the Canary Islands.
Genetic diversity is crucial for the conservation and improvement of avocado, as it facilitates the adaptation of cultivars to new environmental conditions and increases resistance to diseases. In the Canary Islands, most avocado crops come from local cultivars or ungrafted trees, which increases genetic variability and provides opportunities for genetic improvement [10]. However, the genetic variability within these populations is still poorly understood, which limits its utilization in breeding and conservation programs.
Studies on the genetic diversity of avocado have greatly benefited from the introduction of molecular markers, which allow for more precise and efficient analysis of genetic differences between accessions. In particular, Inter Simple Sequence Repeat (ISSR) markers have proven to be powerful tools in genetic diversity studies across various species, including avocado. These markers are dominant, do not require prior genomic knowledge, and have enabled effective characterization of avocado germplasm collections [12,13,14]. Despite certain limitations in accurately estimating parameters such as heterozygosity, ISSRs have been successfully used to study genetic diversity in different avocado races, particularly the Mexican race, where high variability has been identified [15,16,17]. Moreover, several authors have demonstrated the ability of ISSRs to obtain a large number of amplified fragments in a single PCR reaction and to effectively characterize avocado germplasm, both in local populations and collections from different regions, supporting their application in this research [15,16,17,18,19,20,21].
In addition to molecular analyses, morphological characterization of avocado remains fundamental for genetic improvement. Morphological traits such as fruit size and shape, the relationship between fruit and seed, and resistance to pests and diseases are crucial for selecting cultivars adapted to local agroclimatic conditions. In the Canary Islands, morphological variability in avocado populations is unique, with individuals exhibiting clearly distinguishable characteristics. These traits represent valuable candidates for future plant breeding. Therefore, alongside the importance of preserving local genetic resources, the search for desirable characteristics in a commercial cultivar is of great economic and agronomic interest: the fruit should be visually appealing and tasty, have thick, non-brittle skin, turn dark in colour when ripe, and be an adequate weight and shape [22,23,24,25]. In this context, numerous studies have been conducted on the morphological characterization of avocado [26,27,28,29,30,31,32,33,34,35]. These characterisations were mainly conducted using avocado (Persea spp.) descriptors from the International Plant Genetic Resources Institute (IPGRI) [36] and the International Union for the Protection of New Varieties of Plants (UPOV) [37]. Several of these authors have also developed new markers.
In light of the growing importance of avocado cultivation in the Canary Islands and considering the notable morphological diversity and agronomic potential observed in local populations, we consider it necessary to analyze this variability as an essential part of efforts to conserve and improve the crop. In this context, the aim of this study is to evaluate genetic diversity using ISSR markers and to morphologically characterize local avocado accessions in the Canary Islands. The combination of these approaches will help identify the main discriminating traits and sources of genetic variability within the local populations, which will contribute to the development of cultivars more adapted to local conditions and with higher yields. The results of this study are expected to serve as the foundation for future genetic improvement programs and the conservation of avocado germplasm with agronomic interest in the region.

2. Materials and Methods

2.1. Prospecting

The prospecting was conducted in 2018 with the aim of identifying avocado trees with distinctive characteristics compared to recognized commercial cultivars in terms of their morphological, phenological, and agronomic traits. Only trees aged six years or older were included, and in a first evaluation, they were selected mainly according to the fruit shape and size, tree structure, harvest season and propagation method. The origin of the sampled trees was diverse, including both seed-propagated individuals and those with different genetic variations. From each tree, ten completely developed young leaves, free of pest and disease symptoms, were collected and transported under refrigeration to the laboratory, where they were stored at −80 °C (New Brunswick Scientific U410 ultra-low-temperature freezer, Hamburg, Germany) until DNA extraction was performed.
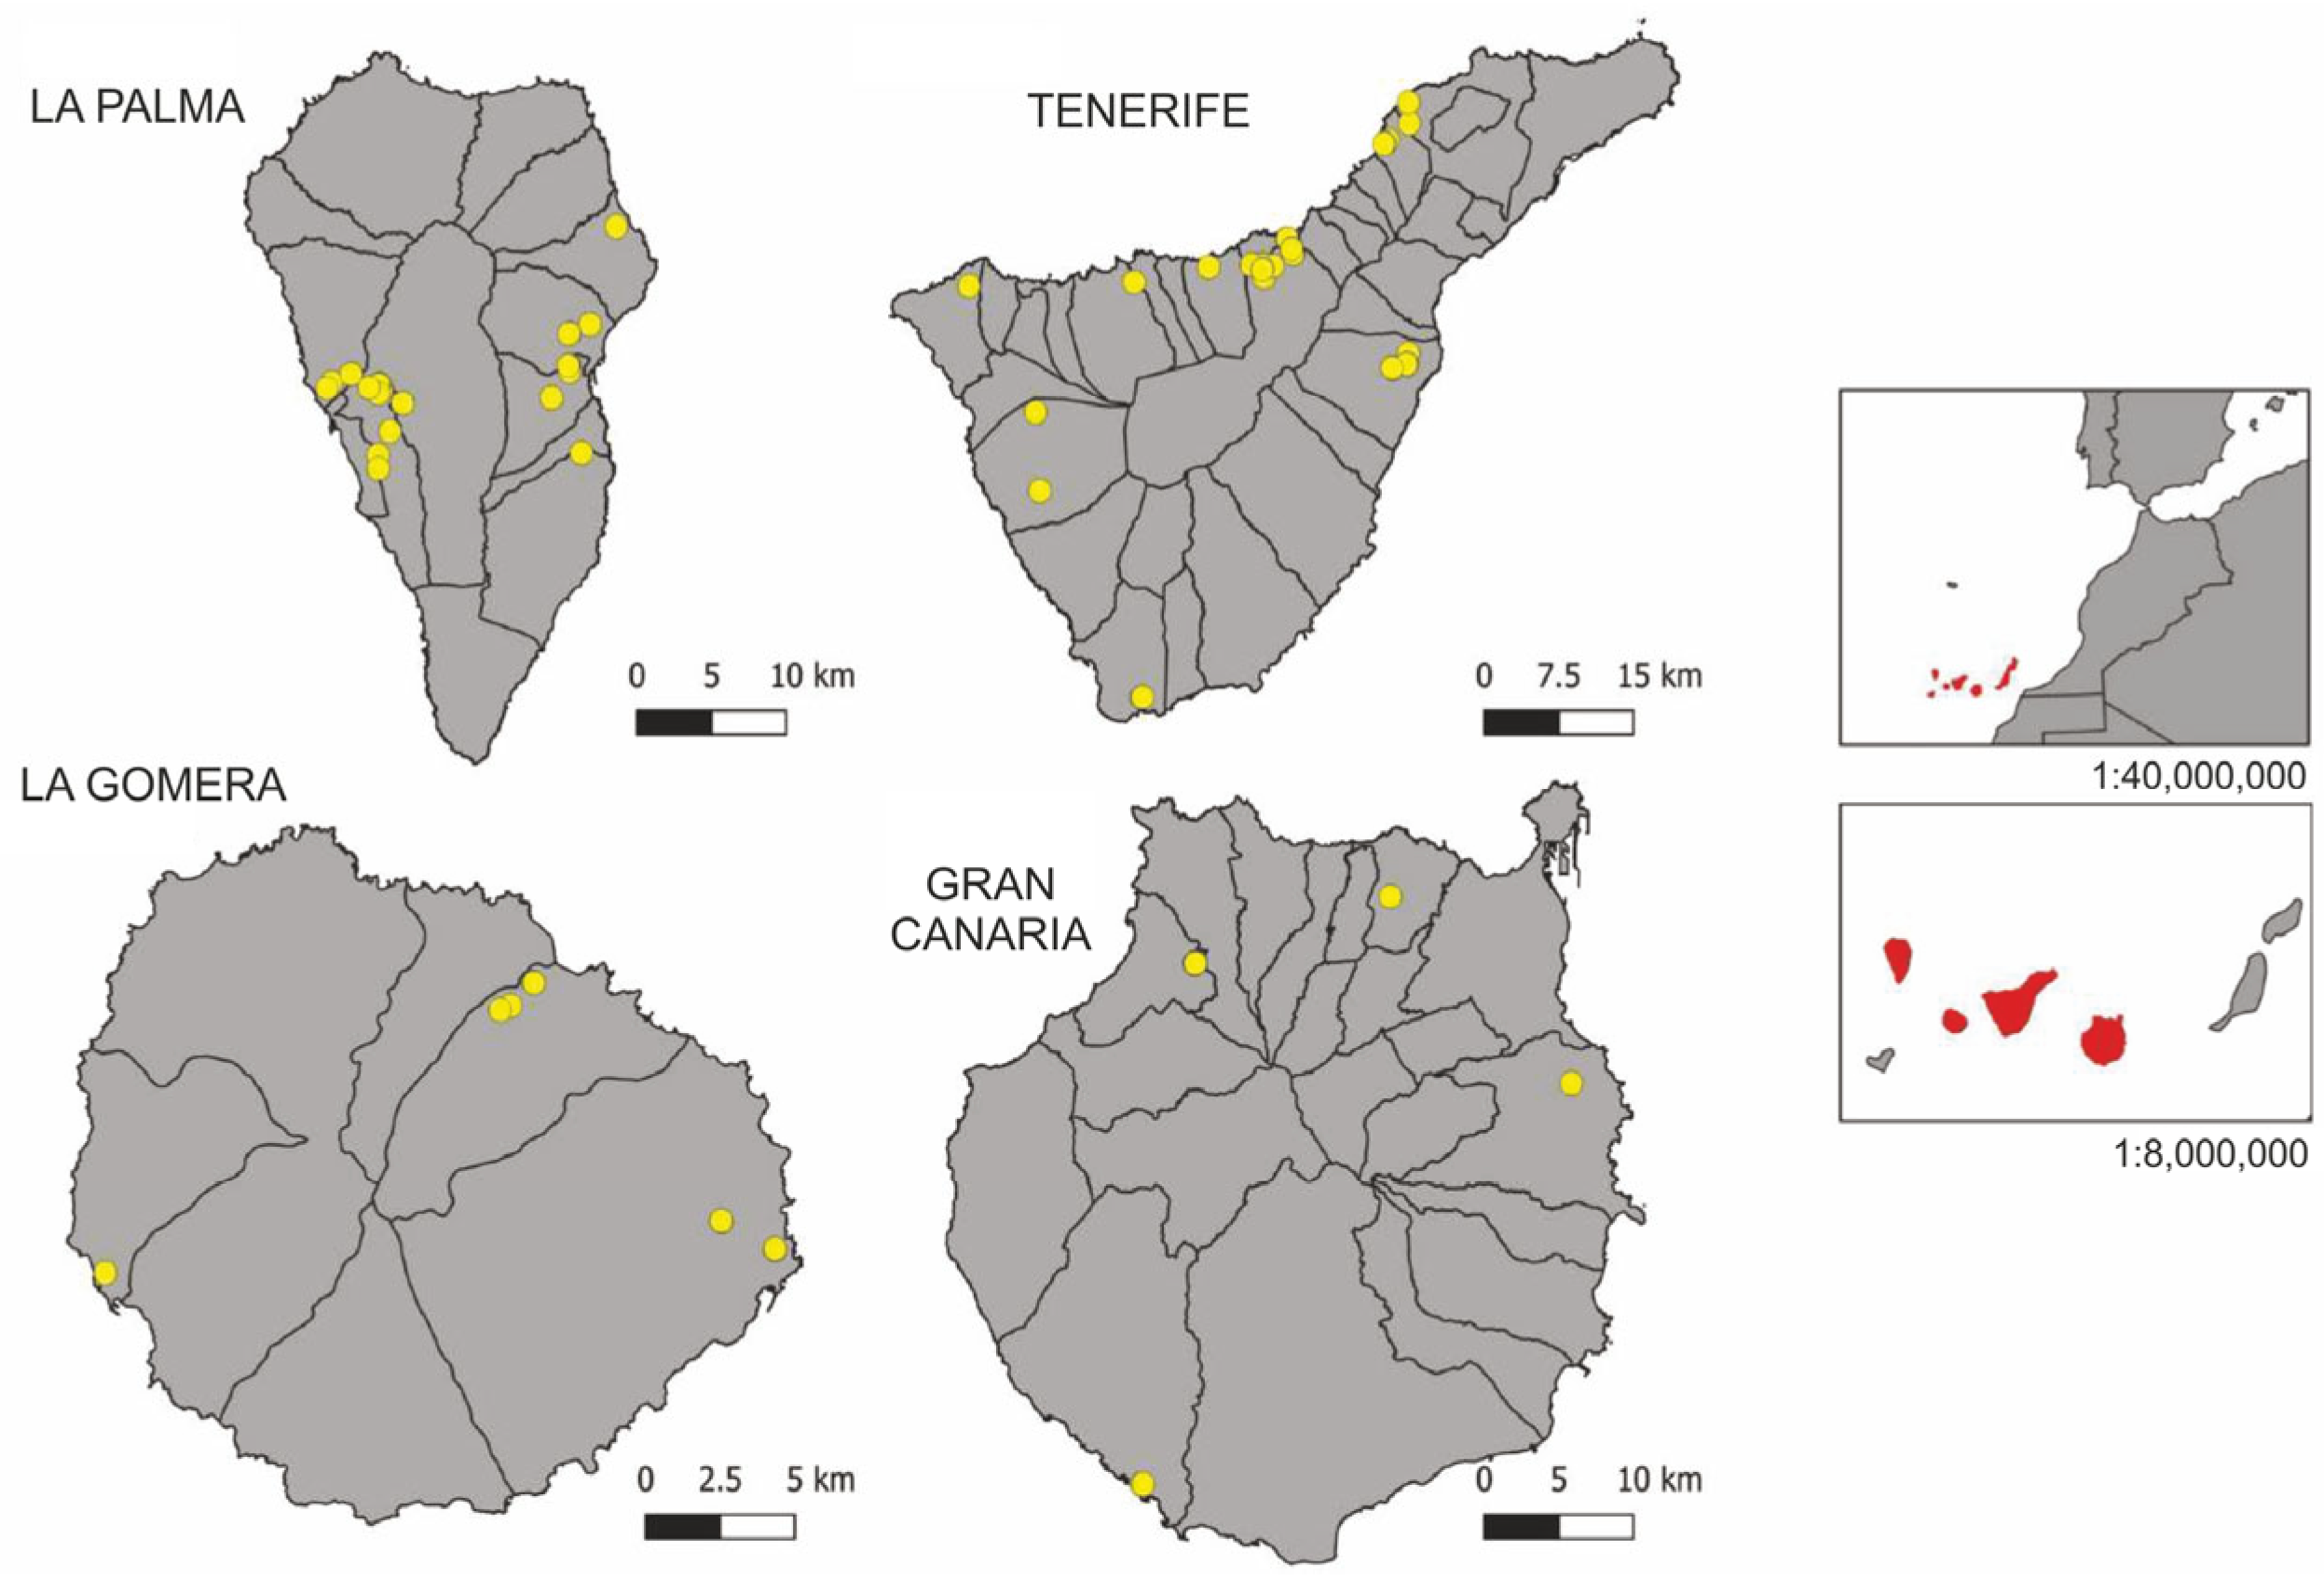
Initially, a total of 311 avocado trees were sampled from four islands: 166 from Tenerife, 103 from La Palma, 26 from Gran Canaria, and 16 from La Gomera. Following this initial prospecting, a second selection process was carried out to facilitate the molecular and morphological characterization of the accessions. For this, four highly polymorphic ISSR markers (primers Hass 1, UBC 807, UBC 825, and PKBT 8; see Section 2.2.2) were employed, alongside a set of quantitative and qualitative morphological traits, to identify trees with promising agronomic, morphological, and commercial attributes relevant for genetic resource conservation. Accessions were preselected if they showed notable differences from the common cultivars ‘Hass,’ ‘Fuerte’, and ‘Pinkerton’, and exhibited characteristics such as a high fruit-to-seed weight ratio; thick, non-adhering, non-brittle skin; minimal fibre in the pulp; a nutty flavour; an overall pleasant flavour; and a creamy texture [24]. Furthermore, accessions that, while resembling the standard cultivars, displayed significant qualitative and quantitative differences were also considered for preselection. Finally, the geographical distribution was taken into account, with the number of accessions selected from each island reflecting the final selection. Based on these criteria, 87 accessions were selected for further analysis: 38 from Tenerife, 28 from La Palma, 11 from Gran Canaria, and 10 from La Gomera (Table 1, Figure 1).

2.2. Molecular Characterization

2.2.1. DNA Extraction

DNA extraction was carried out according to the methodology described by Hormaza [38], with modifications. Briefly, a 120 mg sample of plant tissue, collected from three healthy and pest-free leaves, was ground in a mortar with 1.9 mL of CTAB buffer (2% CTAB; 1% PVP; 100 mM Tris-HCl pH 8; 20 mM EDTA pH 8; 1.4 M NaCl) and sterile river sand. The resulting suspension (750 µL) was subsequently incubated at 65 °C for 45 min, with 0.3 mg/mL of RNAse and 0.2% of beta-mercaptoethanol. Cleaning was performed with CIA (chloroform isoamyl alcohol, 24:1) and the DNA was precipitated with isopropanol at −20 °C for at least three hours. Finally, cleaning with 70% ethanol was done and the DNA obtained was resuspended in 80 µL of sterile DNase/RNase-free miliQ water. Conservation was carried out at −20 °C until use. DNA quantity (ng/µL) and purity (260/280 and 260/230 nm ratio absorbance) were evaluated by spectrophotometry using a NanoDrop® model ND-1000 (Thermo Scientific, Wilmington, DE, USA). When required, genomic DNA samples was further evaluated by horizontal electrophoresis using 0.8% agarose gels in 1X TAE buffer (Tris-acetate EDTA). In this case, the concentration of genomic DNA in the samples was estimated by visual comparison with Lambda phage DNA, both undigested and digested with HindIII.

2.2.2. Preselection of ISSR Primers

In order to optimise the detection of genetic polymorphism in avocado using ISSR markers, a wide set of 28 primers, most of which had been previously reported in avocado [15,16,17,18], was evaluated (Table 2). The 14 most polymorphic primers from them were selected. In addition, PCR conditions were improved by modifying the annealing temperature (using a thermal gradient), the MgCl2 concentration, the primer concentration and the number of cycles.

2.2.3. DNA Amplification

PCR amplification was carried out using a Bio-Rad C1000 Touch thermal cycler (Hercules, CA, USA) in a final reaction volume of 15 µL. Each reaction contained: 1X Buffer (Tris-HCl pH 8.5; (NH4)2SO4; 1% Tween 20); 2.5 mM MgCl2; 0.2 mM dNTP; 0.4 µM Oligonucleotide; 0.05 ud/µL Taq polymerase (VWR, ID733-1313) and 2–5 ng/µL of template DNA. Optimised PCR conditions were as follows: 95 °C 5 min; (94 °C 45 s, 52–58 °C 30 s, 72 °C 1:45 min.) × 30 cycles; 72 °C 7 min.
Final PCR product was analysed by horizontal electrophoresis on a 1.8% agarose gel using a Bio-Rad Sub-Cell GT with 1X TAE buffer (Tris Acetic-EDTA, Sigma-Aldrich, Tulln, Austria). Molecular weight marker (Step Ladder 50pb S7025, Sigma-Aldrich, St. Louis, MO, USA) was included. Gels were treated with Gel Red and washed with distilled water for at least 30 min. Visualization was performed under UV light using a UV GENE FLASH transilluminator (GeneMate-BioExpress, Burlington, NJ, USA) and images were captured with a 5 Mpx digital camera in jpg format.

2.2.4. Binary Data Matrix and Dendrogram

The binary data matrix (for each sample and oligonucleotide) was constructed based on the amplification pattern observed in the gel, where “1” indicates the presence and “0” the absence of each DNA band. Genetic similarity between individuals was calculated with the NTSYS-pc (Numerical Taxonomy and Multivariate Analysis System) software, version 2.1 [43] using Jaccard’s association coefficient [44] in the SIMQUAL module. The cluster analysis was performed with the SAHN (Sequential, Agglomerative, Hierarchical and Nested methods) module, using the UPGMA (Unweighted Pair Group Method with Arithmetic Mean) method [45], TREE module.
Expected heterozygosity was calculated according to Nei [46] as He = 1 − ∑f2, where f is the allelic frequency. The percentage of polymorphism was calculated as the proportion of polymorphic bands over the total number of bands presented by each primer. A polymorphic band is one that is present with a frequency greater than 1% and less than 100% and a monomorphic band being one that is present in all genetic patterns. The Polymorphism Information Content (PIC) of the 14 loci was calculated using the formula: PIC = 2f(1 − f), where f is the frequency of the present bands and (1 − f) is the frequency of the absent bands [47]. For dominant markers—such as ISSR- the PIC value ranges from 0 to 0.5 [48]. Values below 0.15 were considered non-informative; values between 0.15 and 0.25 are considered informative and those greater than 0.25 as highly informative [49]. The resolving power of the primers (Resolving Power, Rp) was evaluated as Rp = Σ BI, where BI = 1 − [2 (0.5 − p)] and p is the proportion of genotypes containing a particular band [50].

2.3. Morphological Characterisation

Morphological characterisation was carried out over three consecutive years (2018–2020) using a combination of descriptors for avocados from the IPGRI [36] and the UPOV [37], as well as three additional descriptors (See Figure S2: Morphological Descriptors).
A total of 89 descriptors were selected for their lower susceptibility to environmental conditions. These included: 74 IPGRI descriptors (60 qualitative and 14 quantitative), 12 UPOV descriptors (11 qualitative and 1 quantitative), and three quantitative descriptors added from other sources (leaf blade width, pedicel diameter, and petiole diameter). The following morphological characters were considered for the selection of accessions for ex situ conservation: qualitative fruit characteristics [25,36,37], including the overall taste of the flesh and pulp texture. A minimum pulp content of 82% (pulp + peel) was also required, corresponding to the lowest value observed among the main commercial cultivars, as reported by the University of California (Table 3), and consistent with previously established criteria [51]. Additionally, accessions exhibiting unique or distinctive traits, as described in the descriptors were also considered.
The analysis was conducted using NTSYS-PC 2.21, a statistical software program for numerical taxonomy and multivariate analysis [43]. The similarity matrix was obtained using the “Simple Matching Coefficient (SMC)” association coefficient, which ranges from 0 to 1; where 1 indicates maximum similarity, and 0 indicates minimum similarity [52]. The dendrogram was obtained using the unweighted pair group method with arithmetic mean (UPGMA) of Sneath and Sokal [45], via the ‘Tree Plot’ option in NTSYS-PC 2.21.
For the principal component analysis (PCA), the most discriminating quantitative characters or relationships were selected. These were: twig length/diameter, twig internode length, leaf blade length/diameter, number of primary veins, left and right primary leaf vein divergence relative to the main vein, petiole length/diameter, fruit length/diameter, fruit weight/seed weight, peduncle length/diameter, pedicel length/diameter, fruit peel thickness, fruit length/seed length, pulp weight/seed weight, and seed length/diameter.
The main component analysis was also performed using the NTSYS-PC 2.21 software. The basic data matrix was initially standardised using 15 quantitative characters and the values obtained from the 87 characterised accessions. The similarity matrix was then determined using the Eigen option in the Ordination module and Pearson’s correlation coefficient.

3. Results

3.1. Molecular Characterisation

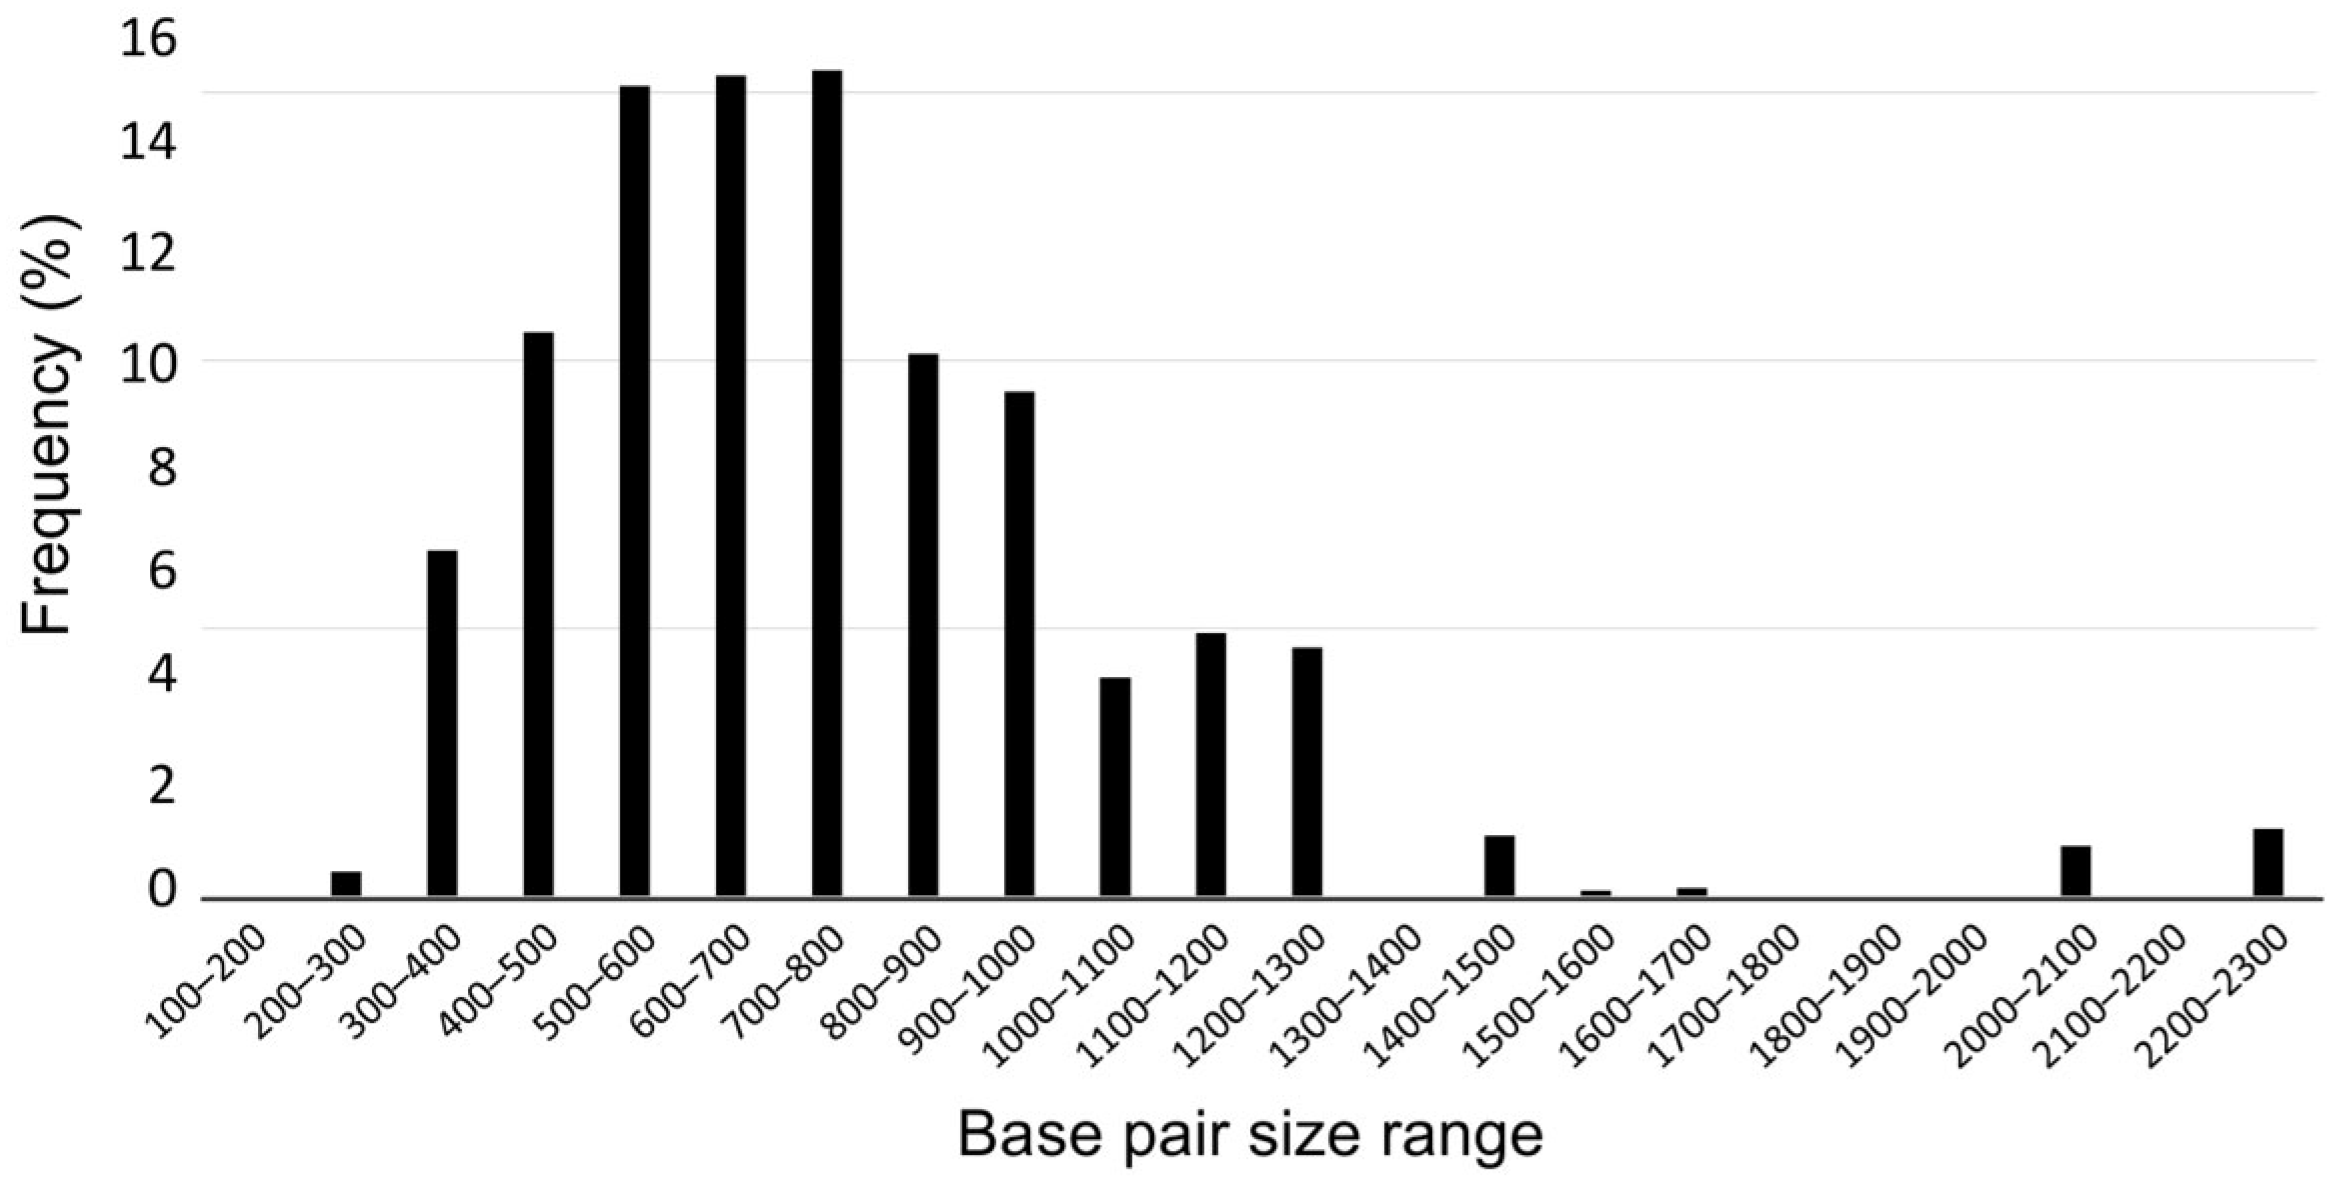
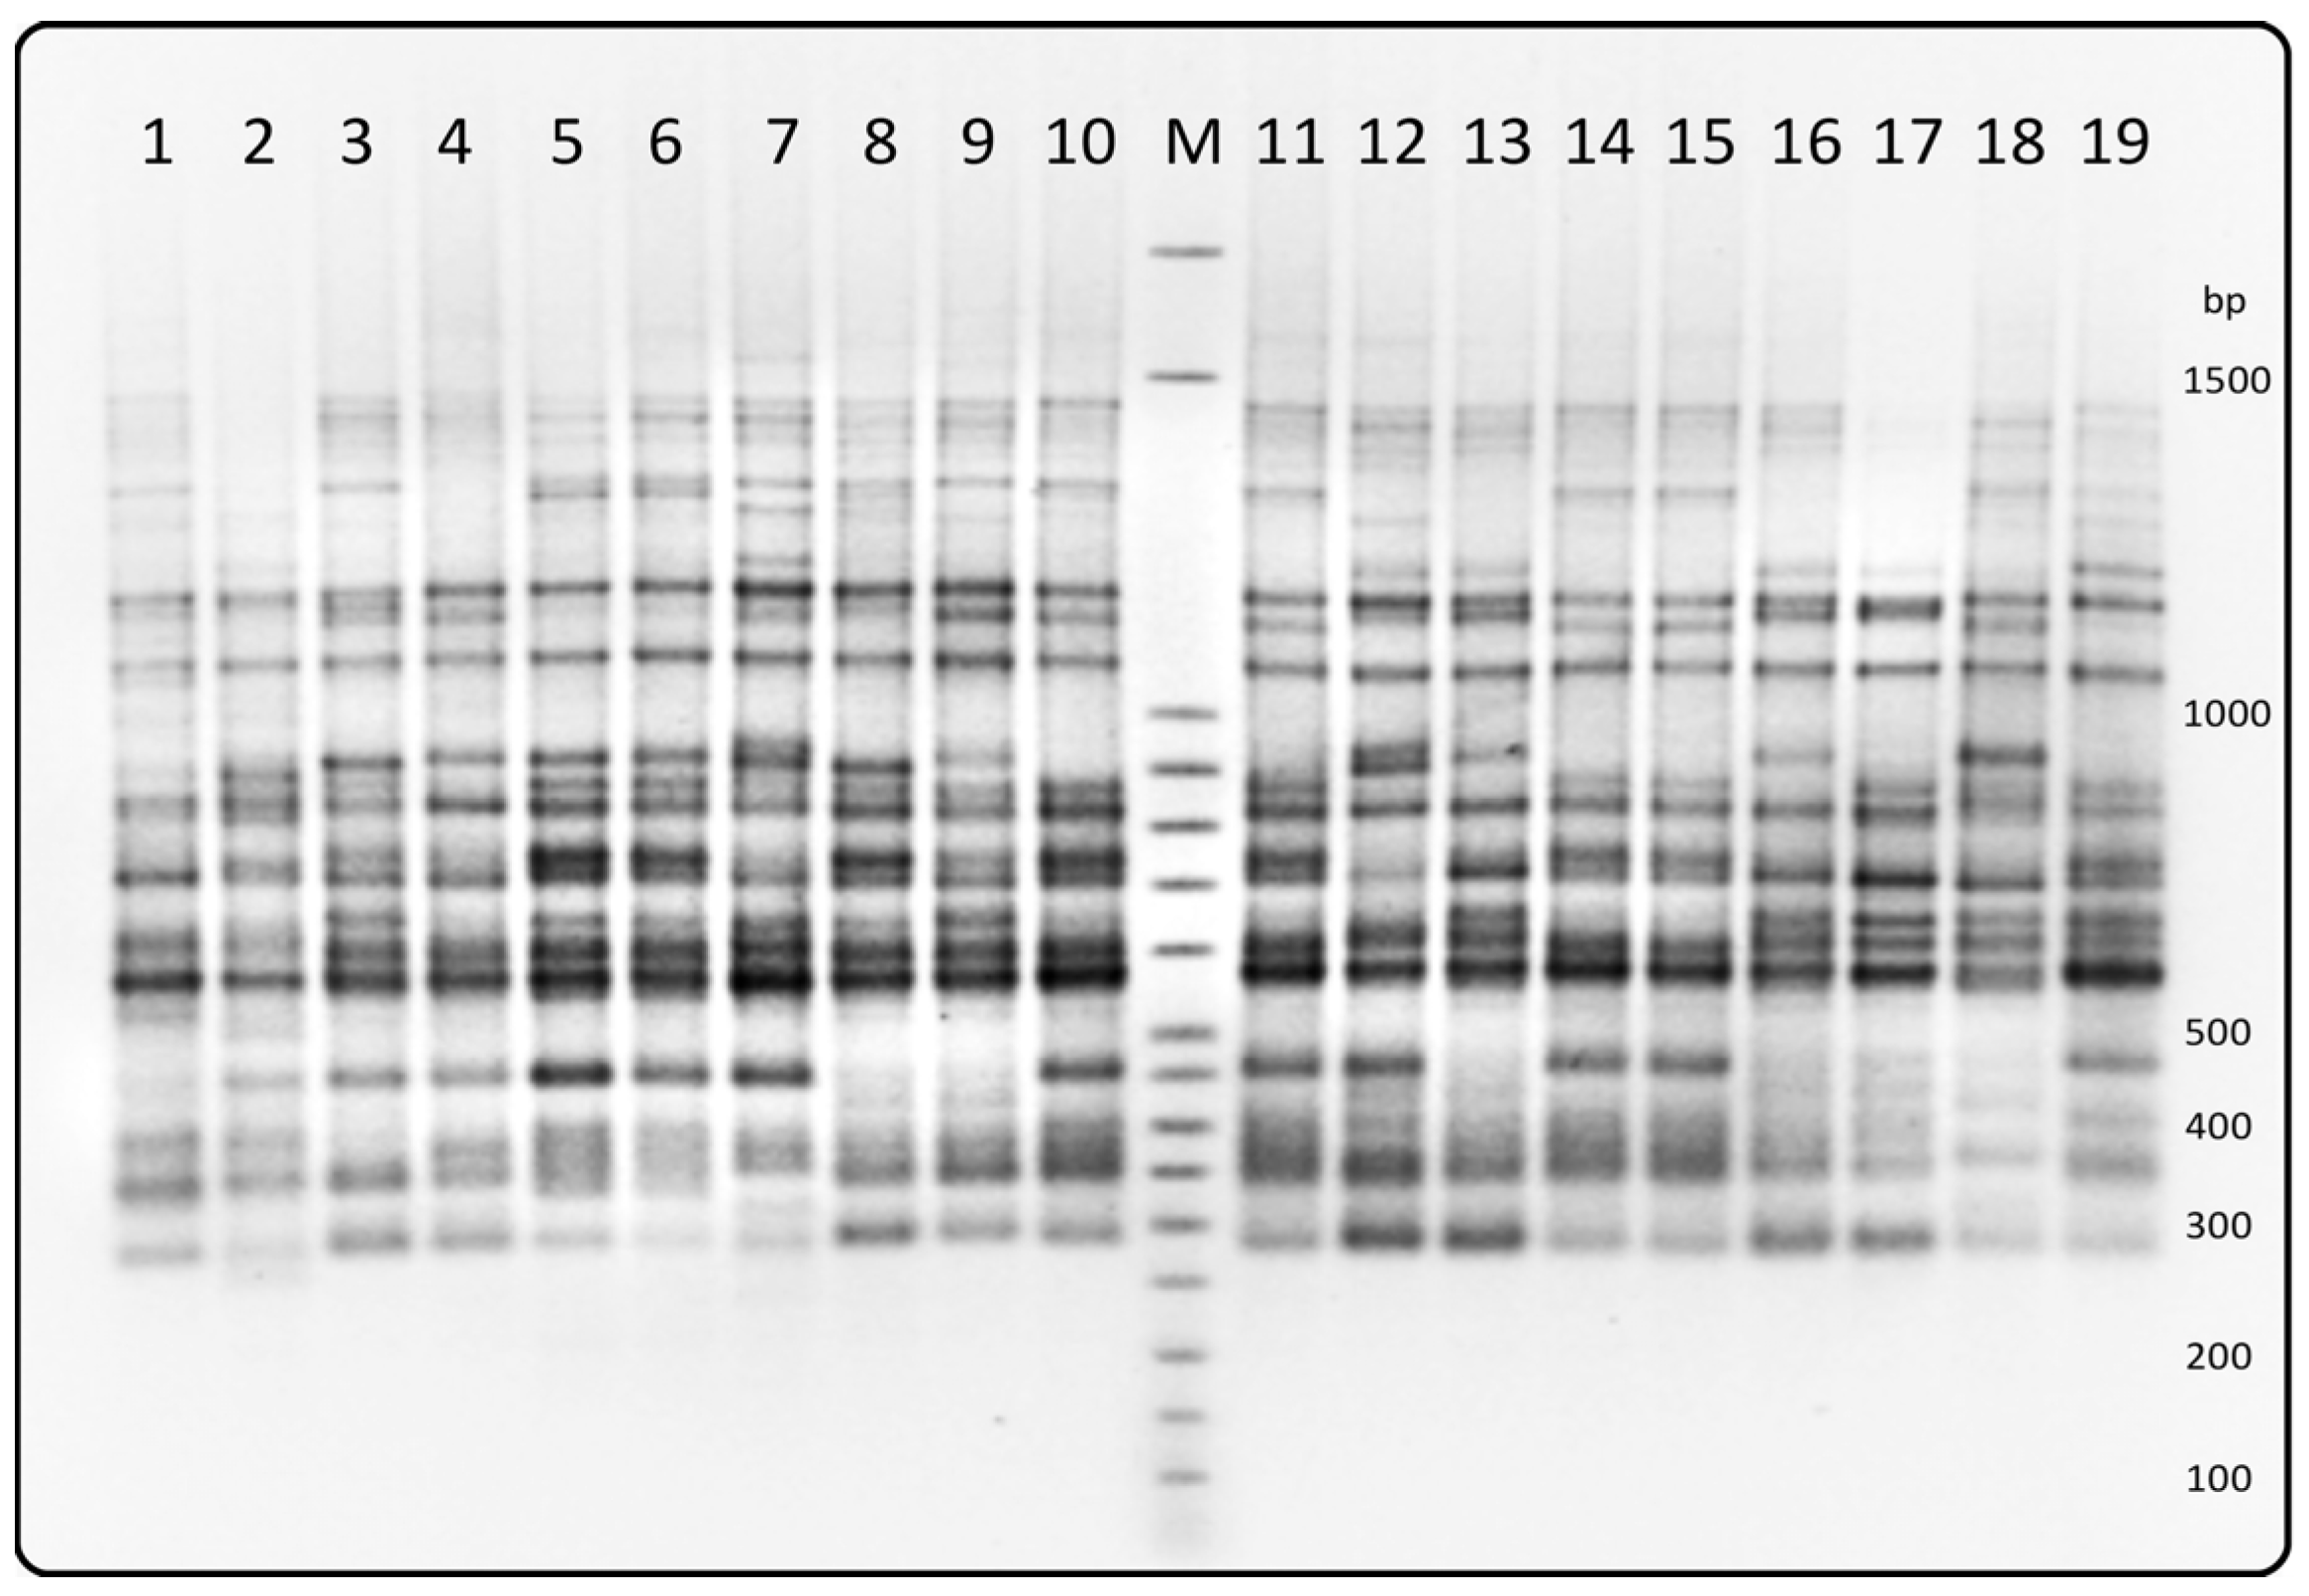
A total of 6937 fragments were amplified, with an average of 495.5 bands per primer. The number of bands ranged from 318 to 753. Of these, 20 were monomorphic, with an average of 1.43 per primer. A total of 137 polymorphic bands were detected, ranging from 250 bp to 2100 bp, with 5 to 20 bands per primer and an average of 9.79. The majority of fragments (46%) fell within the 500–800 bp range, while 66% of the amplified fragments were within the 400–900 bp range (Figure 2 and Figure 3).
The 71.43% to 100, with an average of 85.68%. The expected heterozygosity (He) ranged from 0.34 to 0.90, with an average value of 0.68. The polymorphic information content (PIC) ranged from 0.31 to 0.50, with an average of 0.45. The resolving power (Rp) ranged from 7.31 to 17.31, with an average of 11.39. These values reflect a high degree of polymorphism of the primers (Table 4).
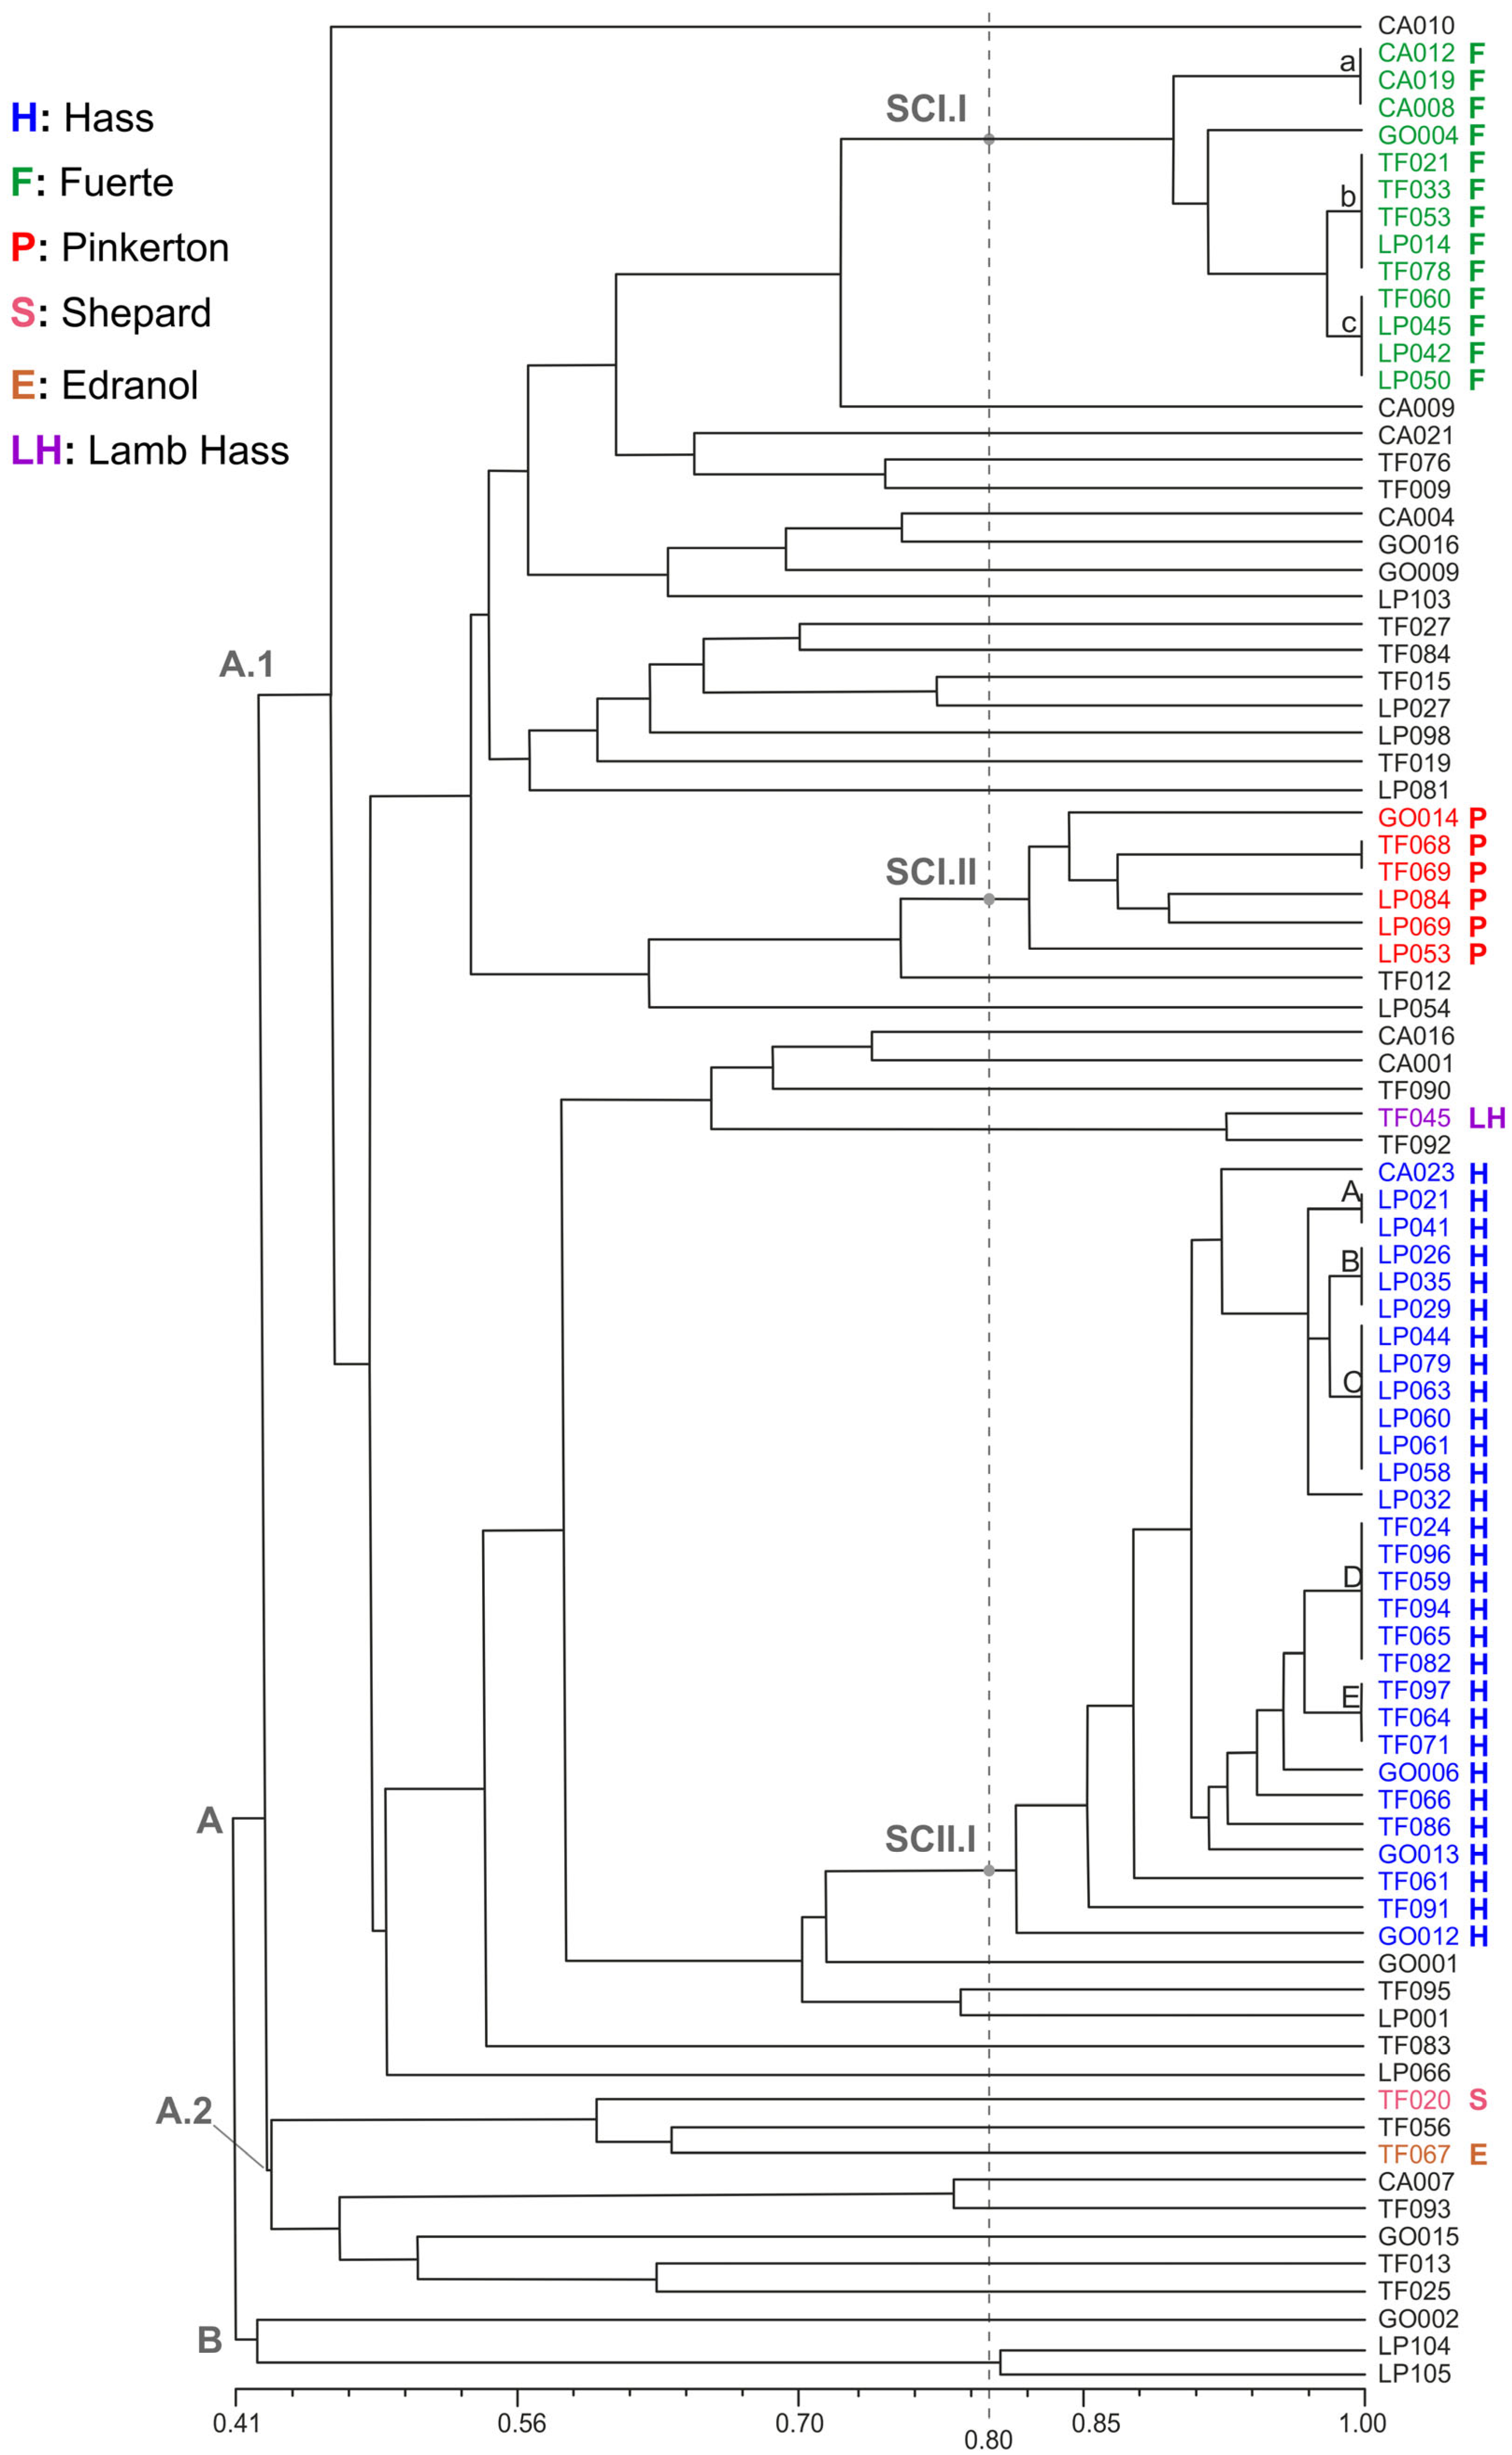
The dendrogram illustrates the degree of similarity among the 87 accessions studied (Figure 4). A total of 62 distinct amplification patterns were identified and grouped into two clusters: Cluster A, consisting of 84 accessions ranging from CA010 to TF025, with an average similarity coefficient of 0.42, and Cluster B, a smaller group comprising accessions LP104 and LP105, which share a similarity coefficient of 0.80, along with accession GO002, which has a similarity coefficient of 0.42.
Cluster A was further divided into two subclusters: A1 and A2. Within subcluster A1, three subgroups were identified: SCI.I, SCI.II and SCII.I, which comprise accessions related to the cultivars ‘Fuerte’, ‘Pinkerton’ and ‘Hass’, respectively. In addition, 36 accessions were associated with sexually derived trees. Furthermore, accessions TF045, TF020 and TF067 correspond to the verified cultivars ‘Lamb Hass’, ‘Shepard’ and ‘Edranol’, respectively.

3.2. Morphological Features

3.2.1. Structure of the Main Phenotypic Groupings

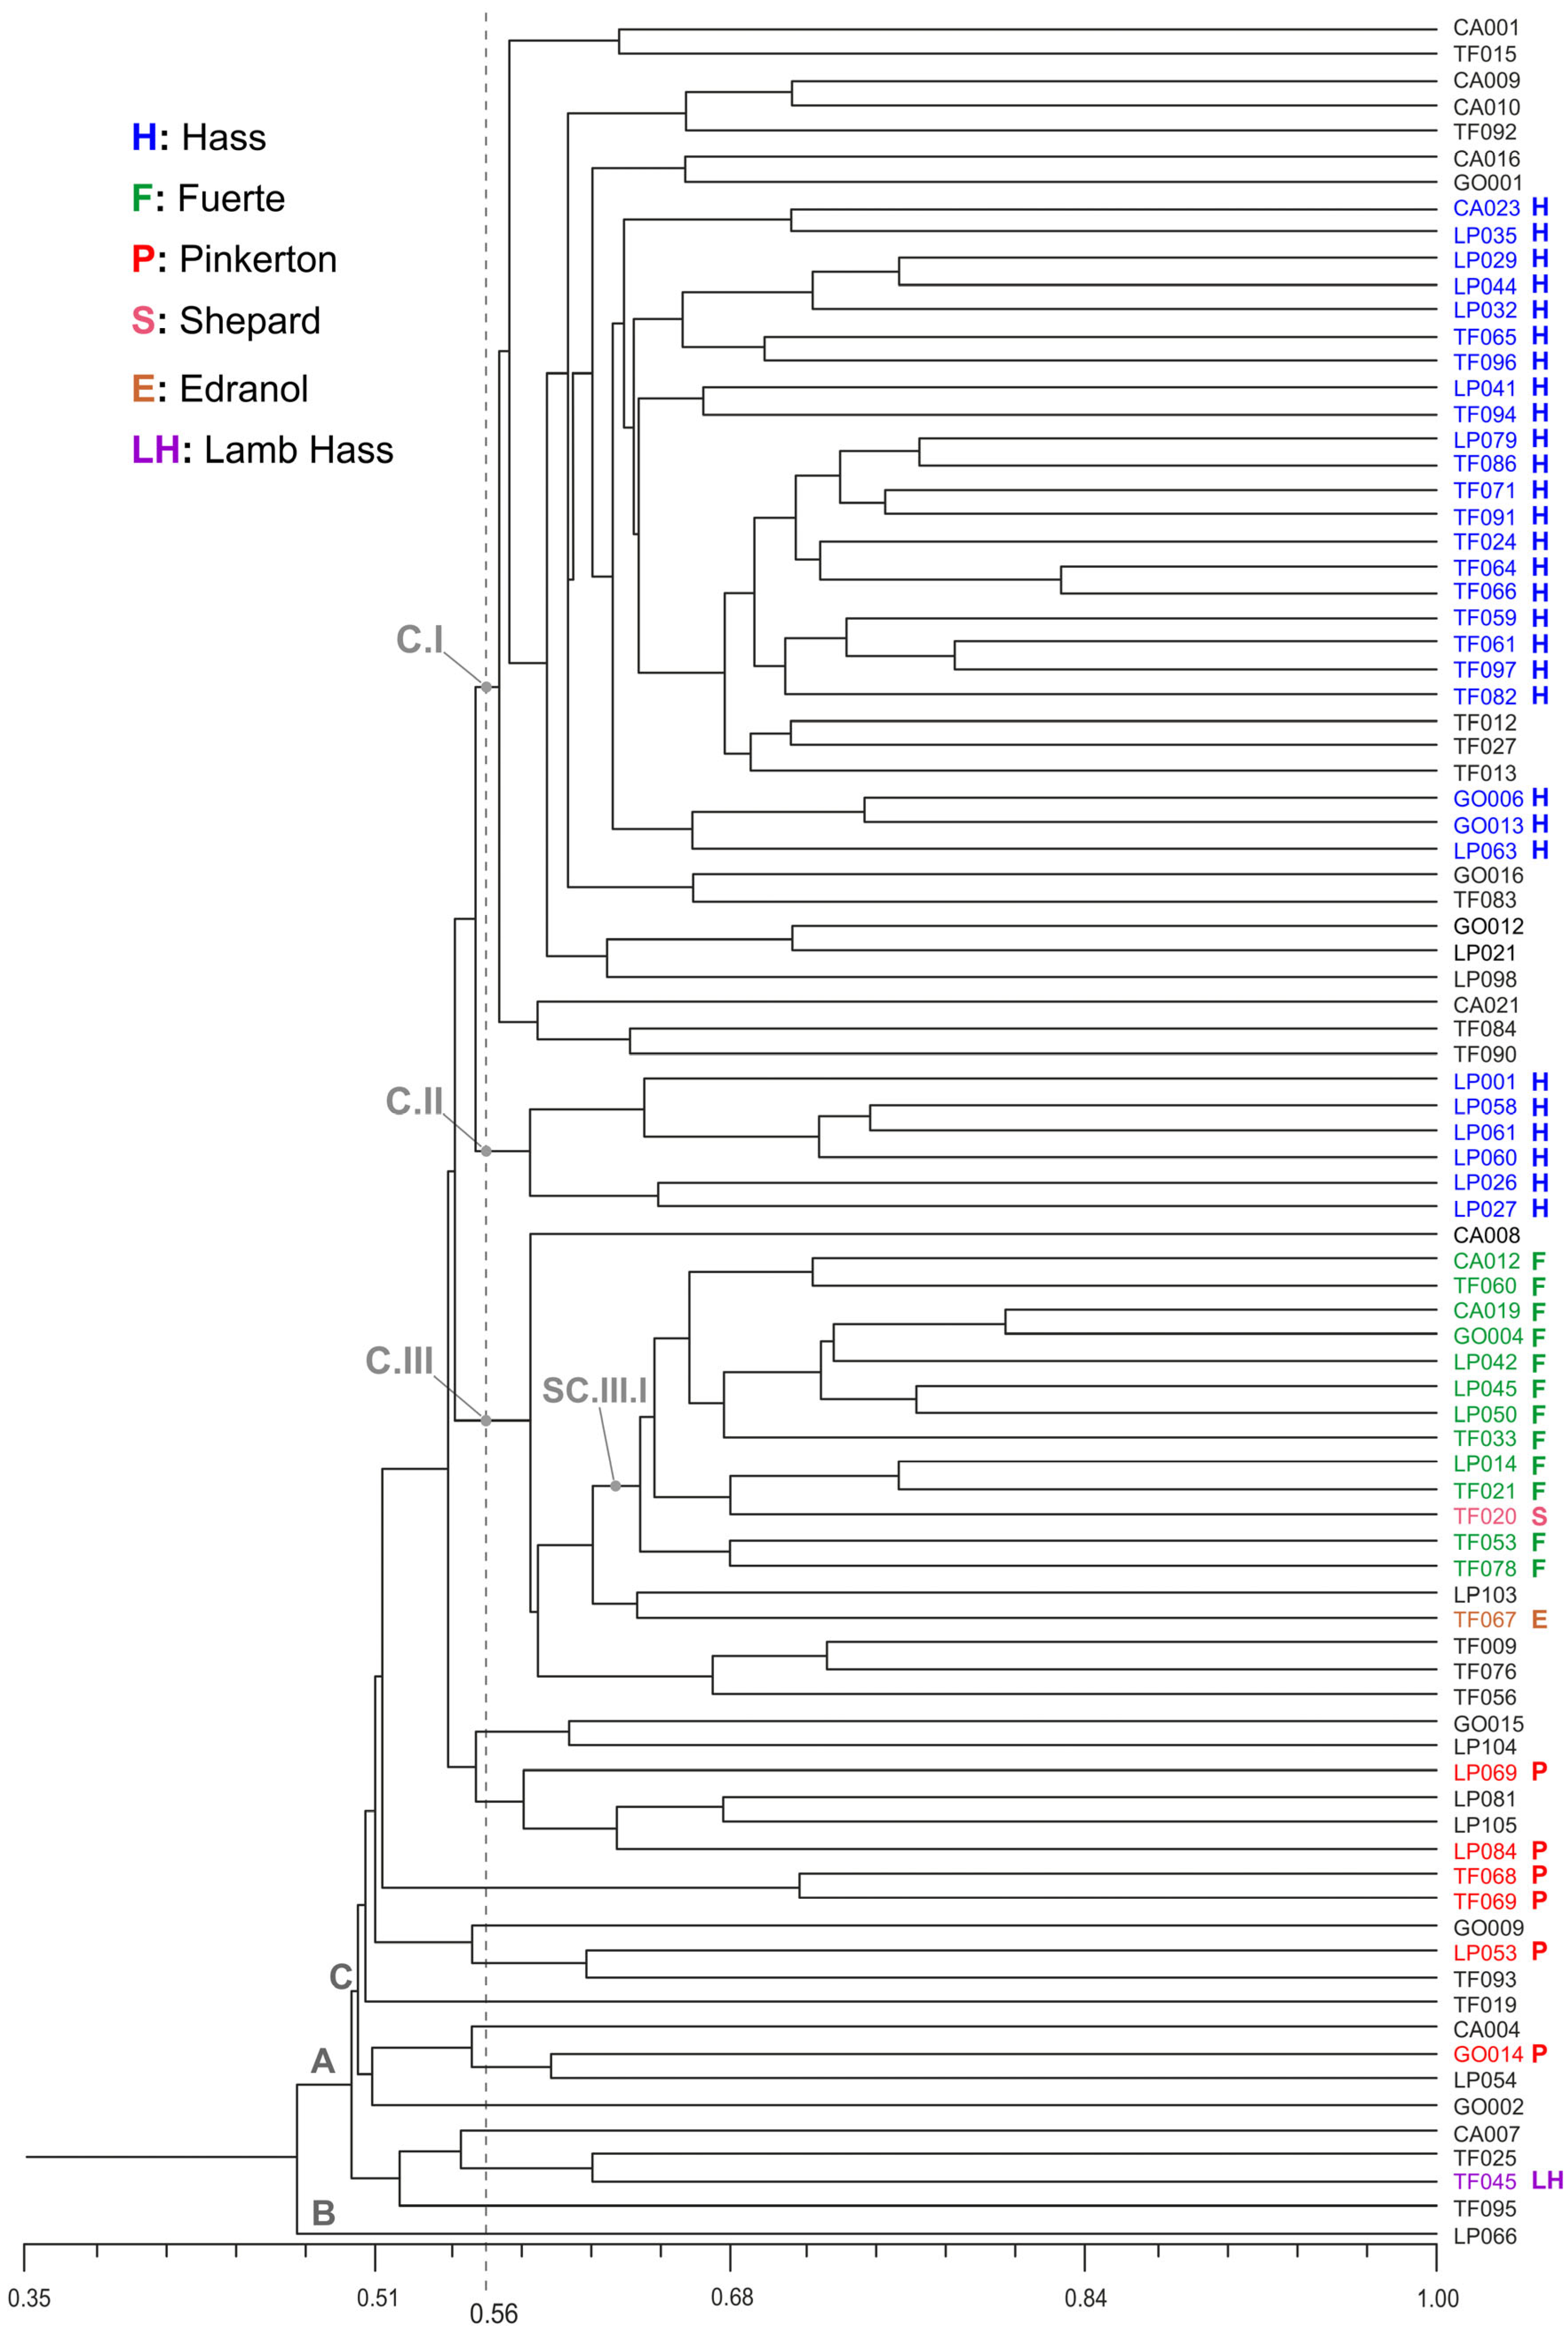
The morphological characterization of the 87 avocado accessions revealed significant phenotypic variation. As shown in Supplementary Figure S1, this variation is particularly evident in the diverse fruit types observed. The similarity matrix of the accessions studied showed SM coefficient values ranging from 0.48 to 0.83. The dendrogram (Figure 5) illustrates the morphological relationships among them. All accessions except LP066 were grouped together in Cluster A, with a similarity coefficient of 0.48. Of these, 86 accessions shared several morphological traits: grooved petioles, acute crotch angles of the leaf petiole, no torsion of the limb throughout its length, and a conspicuous junction between the pedicel and the peduncle. The main branch of this cluster (C), comprising 82 accessions, exhibited an average similarity coefficient of 50.5%. This cluster included accessions closely related to the most commonly cultivated cultivars: ‘Hass’, ‘Fuerte’ and ‘Pinkerton’. In this regard, as shown in Figure 5, Cluster I (C.I) and II (C.II) are also closely related to the ‘Hass’ cultivar. All entries in cluster C.I showed the same expression for eleven of the eighty-six descriptors included in the morphological matrix: crotch angle of the main branches; acute leaf base shape; sparse pubescence on the upper leaf surface; presence of a groove on the petiole; acute crotch angle of the leaf petiole; absence of limb torsion throughout its length; absence of apex torsion; type A flowering behavior; conspicuous pedicel-peduncle junction; absence of aniseed smell in the flesh; and smooth or intermediate cotyledon surface. In cluster C.II, which comprises six accessions from La Palma island (LP001, LP026, LP027, LP058, LP060, and LP061), 33 of the 86 studied descriptors showed the same result. Similarly, Cluster III (C.III) comprised 19 accessions, of which 68.4% (13 out of 19) clustered together in a subcluster (SC.III.I) and were related to the ‘Fuerte’ cultivar, with the exception of accession TF020, which belong to the ‘Shepard’ cultivar. These accessions exhibited the same phenotypic characteristics in the following descriptors: an intensive branching pattern; a glabrous surface on young twigs; sparse pubescence on the upper leaf surface; a grooved petiole; an acute crotch angle on the leaf petiole; an acute leaf apex; absence of limb torsion throughout; absence of nailhead pedicel apex shape; a conspicuous junction between the pedicel and the peduncle; absence of corky lenticels; a narrow layer attached to the skin; absence of aniseed smell in the flesh; attached cotyledons; a smooth or intermediate cotyledon surface; and a circular seed cross-section. Most of these accessions (except CA008, LP103, TF067, TF009, TF076, and TF056) are grouped together in a single subcluster (SC.III.I) (Figure 5), with the exception of TF020, which, although included in this subcluster, is actually a specimen of the ‘Shepard’ cultivar. Finally, several branches, consisting of only one, two, or three accessions, were also observed, showing no morphological similarity to known commercial cultivars. Nevertheless, all of the studied accessions, except for four, differ from the known cultivars and share a common characteristic: sexual propagation. The four exceptions are TF045 (a tree of the ‘Lamb Hass’ cultivar), GO012 and LP021 (grafted trees closely related to the ‘Hass’ cultivar), and CA008 (a tree closely related to the ‘Fuerte’ cultivar).

3.2.2. Principal Component Analysis

The first three principal components explain 54.2% of the total variability observed among the studied accessions. The first principal component alone explains 21.5% of the variability. The characters with the strongest influence on Component 1, with contributions greater than ±0.5, include the fruit length/diameter ratio, primary leaf vein divergence relative to the main vein, fruit skin thickness, fruit length/seed length ratio, right divergence, seed length/diameter ratio, flesh weight/seed weight, and fruit weight/seed weight.
The second principal component accounts for 18.7% of the total variance. The pulp weight/seed weight and fruit weight/seed weight ratios stand out among the characters with the highest weight in this principal component due to their clear total correlation.
Finally, the third principal component accounts for 12.8% of the total variability, with the most significant contributing characters being internode length and the stem and petiole length/diameter ratios.
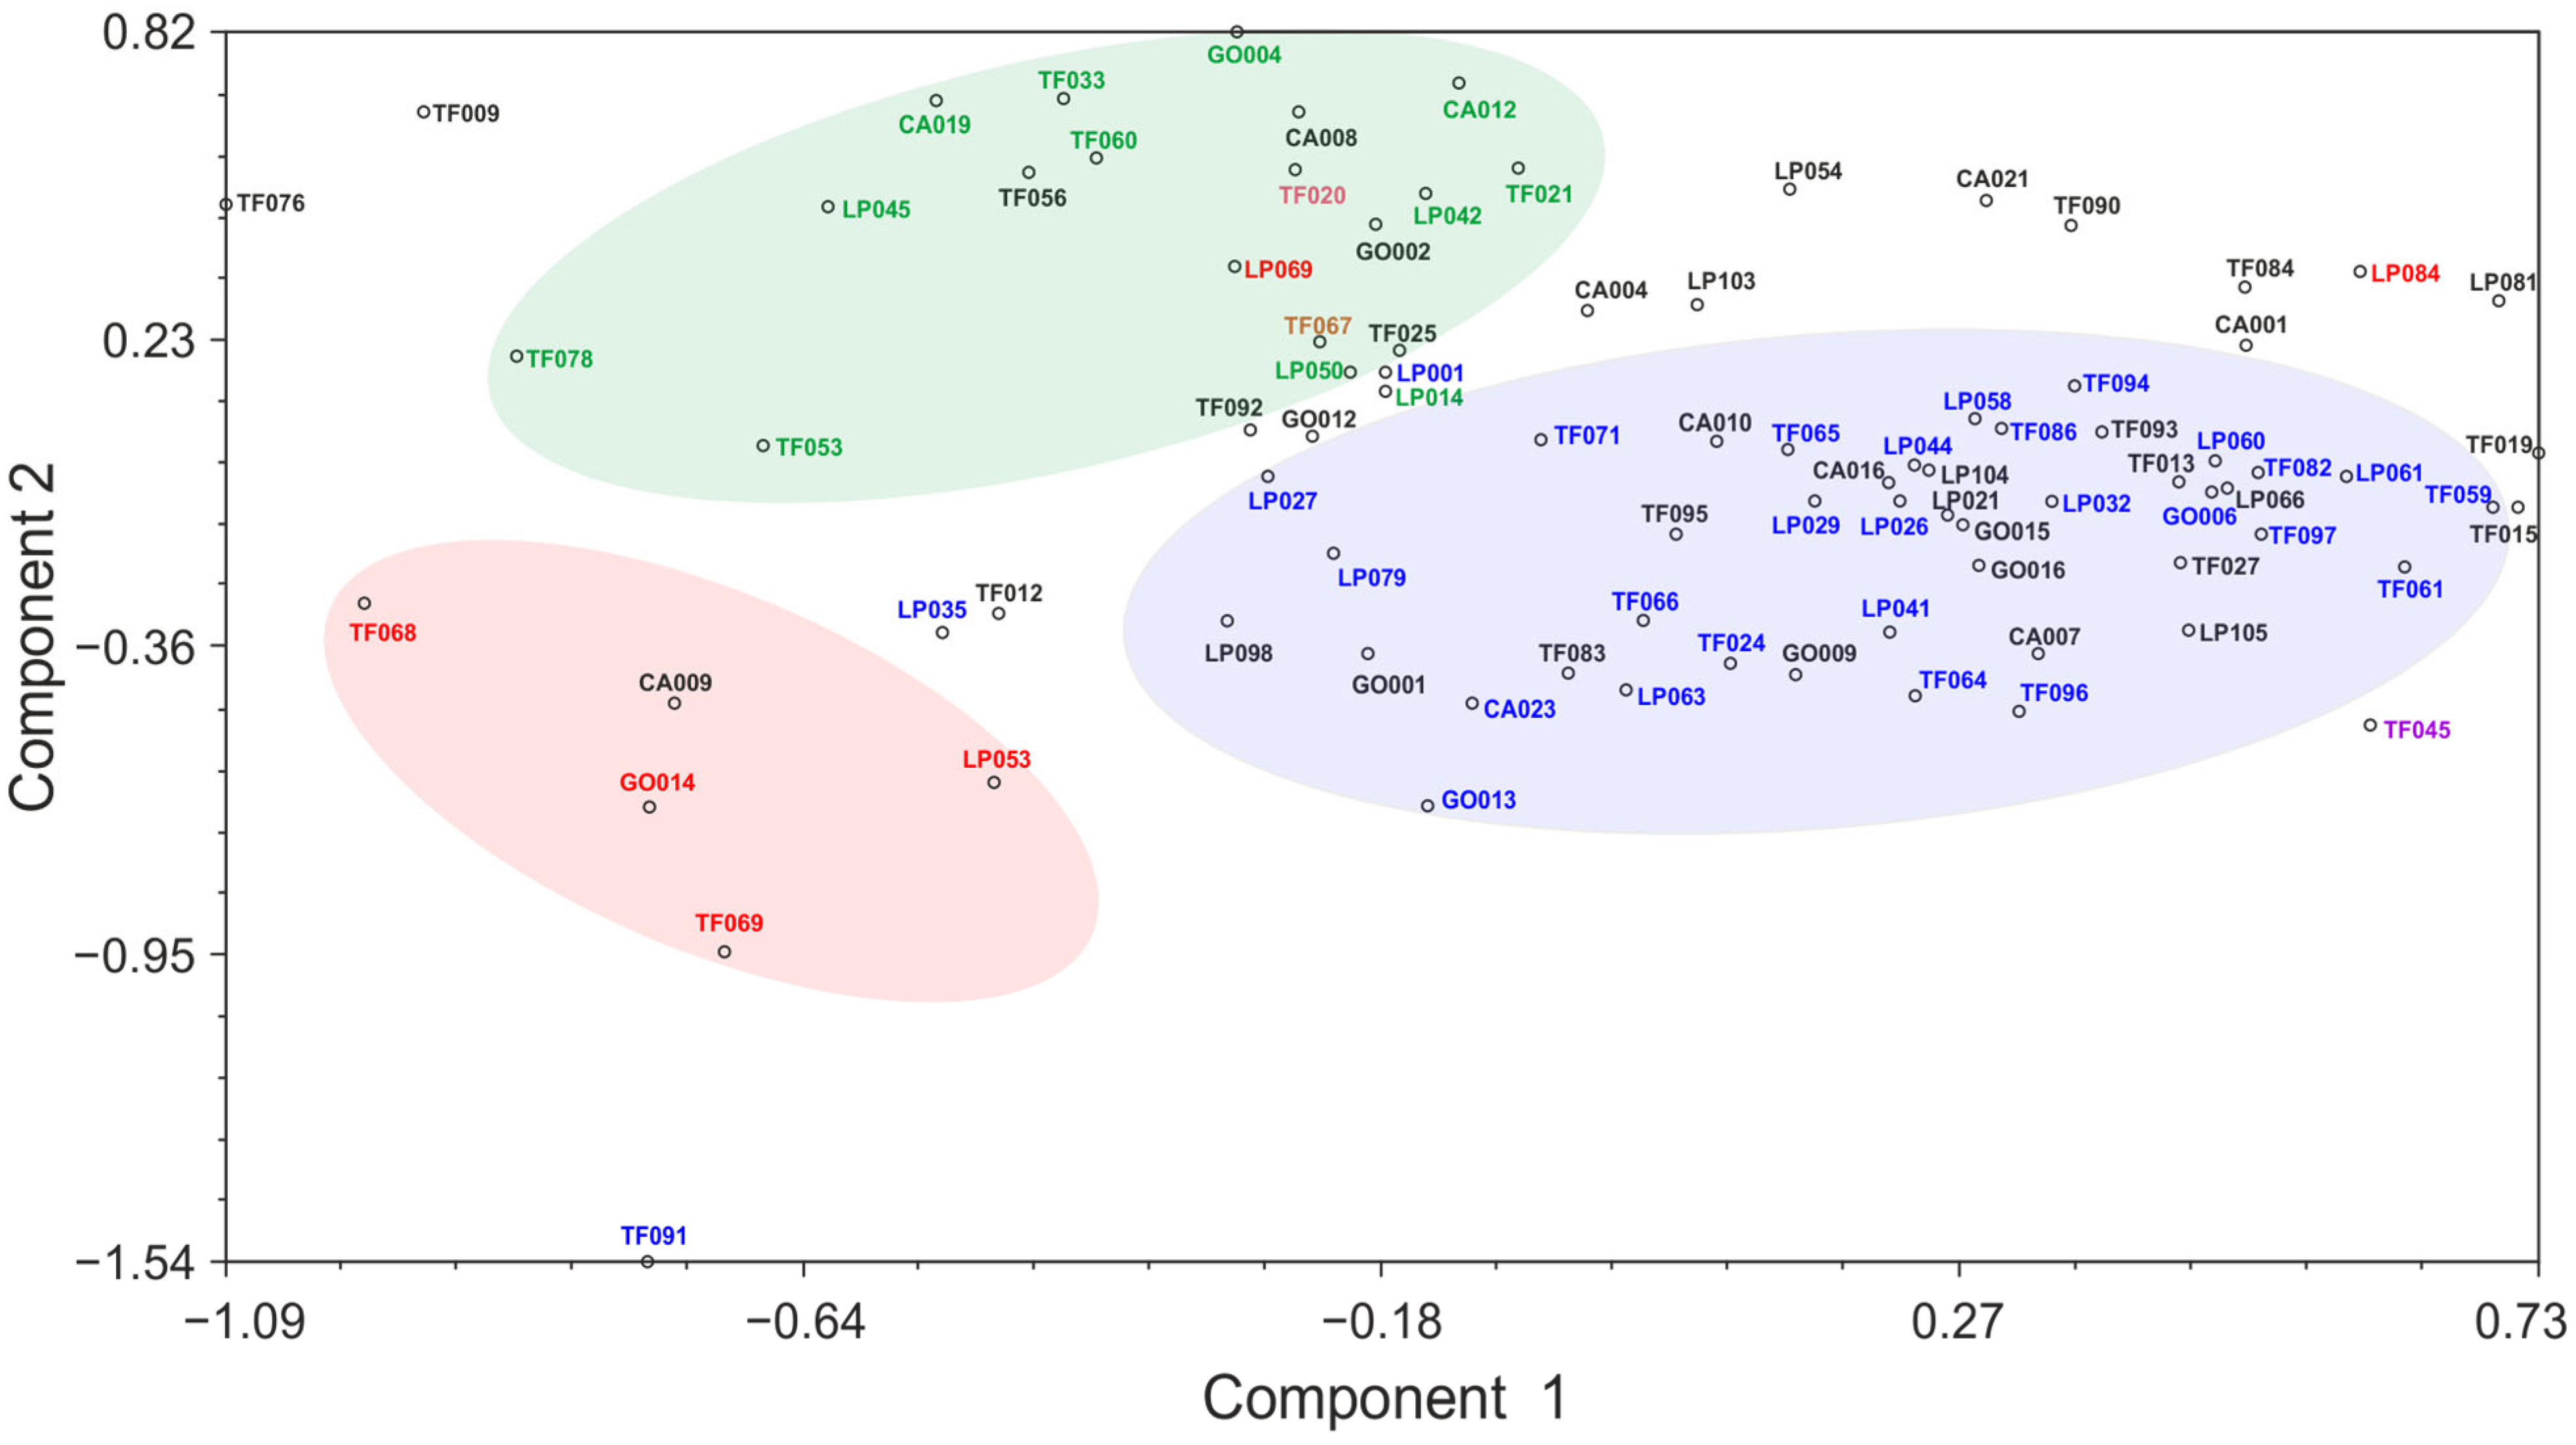
The two-dimensional representation of components 1 and 2 (Figure 6) (40.2% of the total variance) groups the accessions into three clusters centered on the most widely cultivated cultivar in the Canary Islands: ‘Hass’, ‘Fuerte’ and ‘Pinkerton’. Most of the singular accessions are located within the ‘Hass’ and ‘Fuerte’ groups, suggesting that the majority of these trees are descendants of these two commercial cultivars. However, some accessions are positioned further away from these groups. For example, the TF091 accession, which is very similar to ‘Hass’, is located in the most negative part of the plot, probably due to its exceptionally high fruit-to-seed and pulp-to-seed weight ratios compared to the other accessions studied.
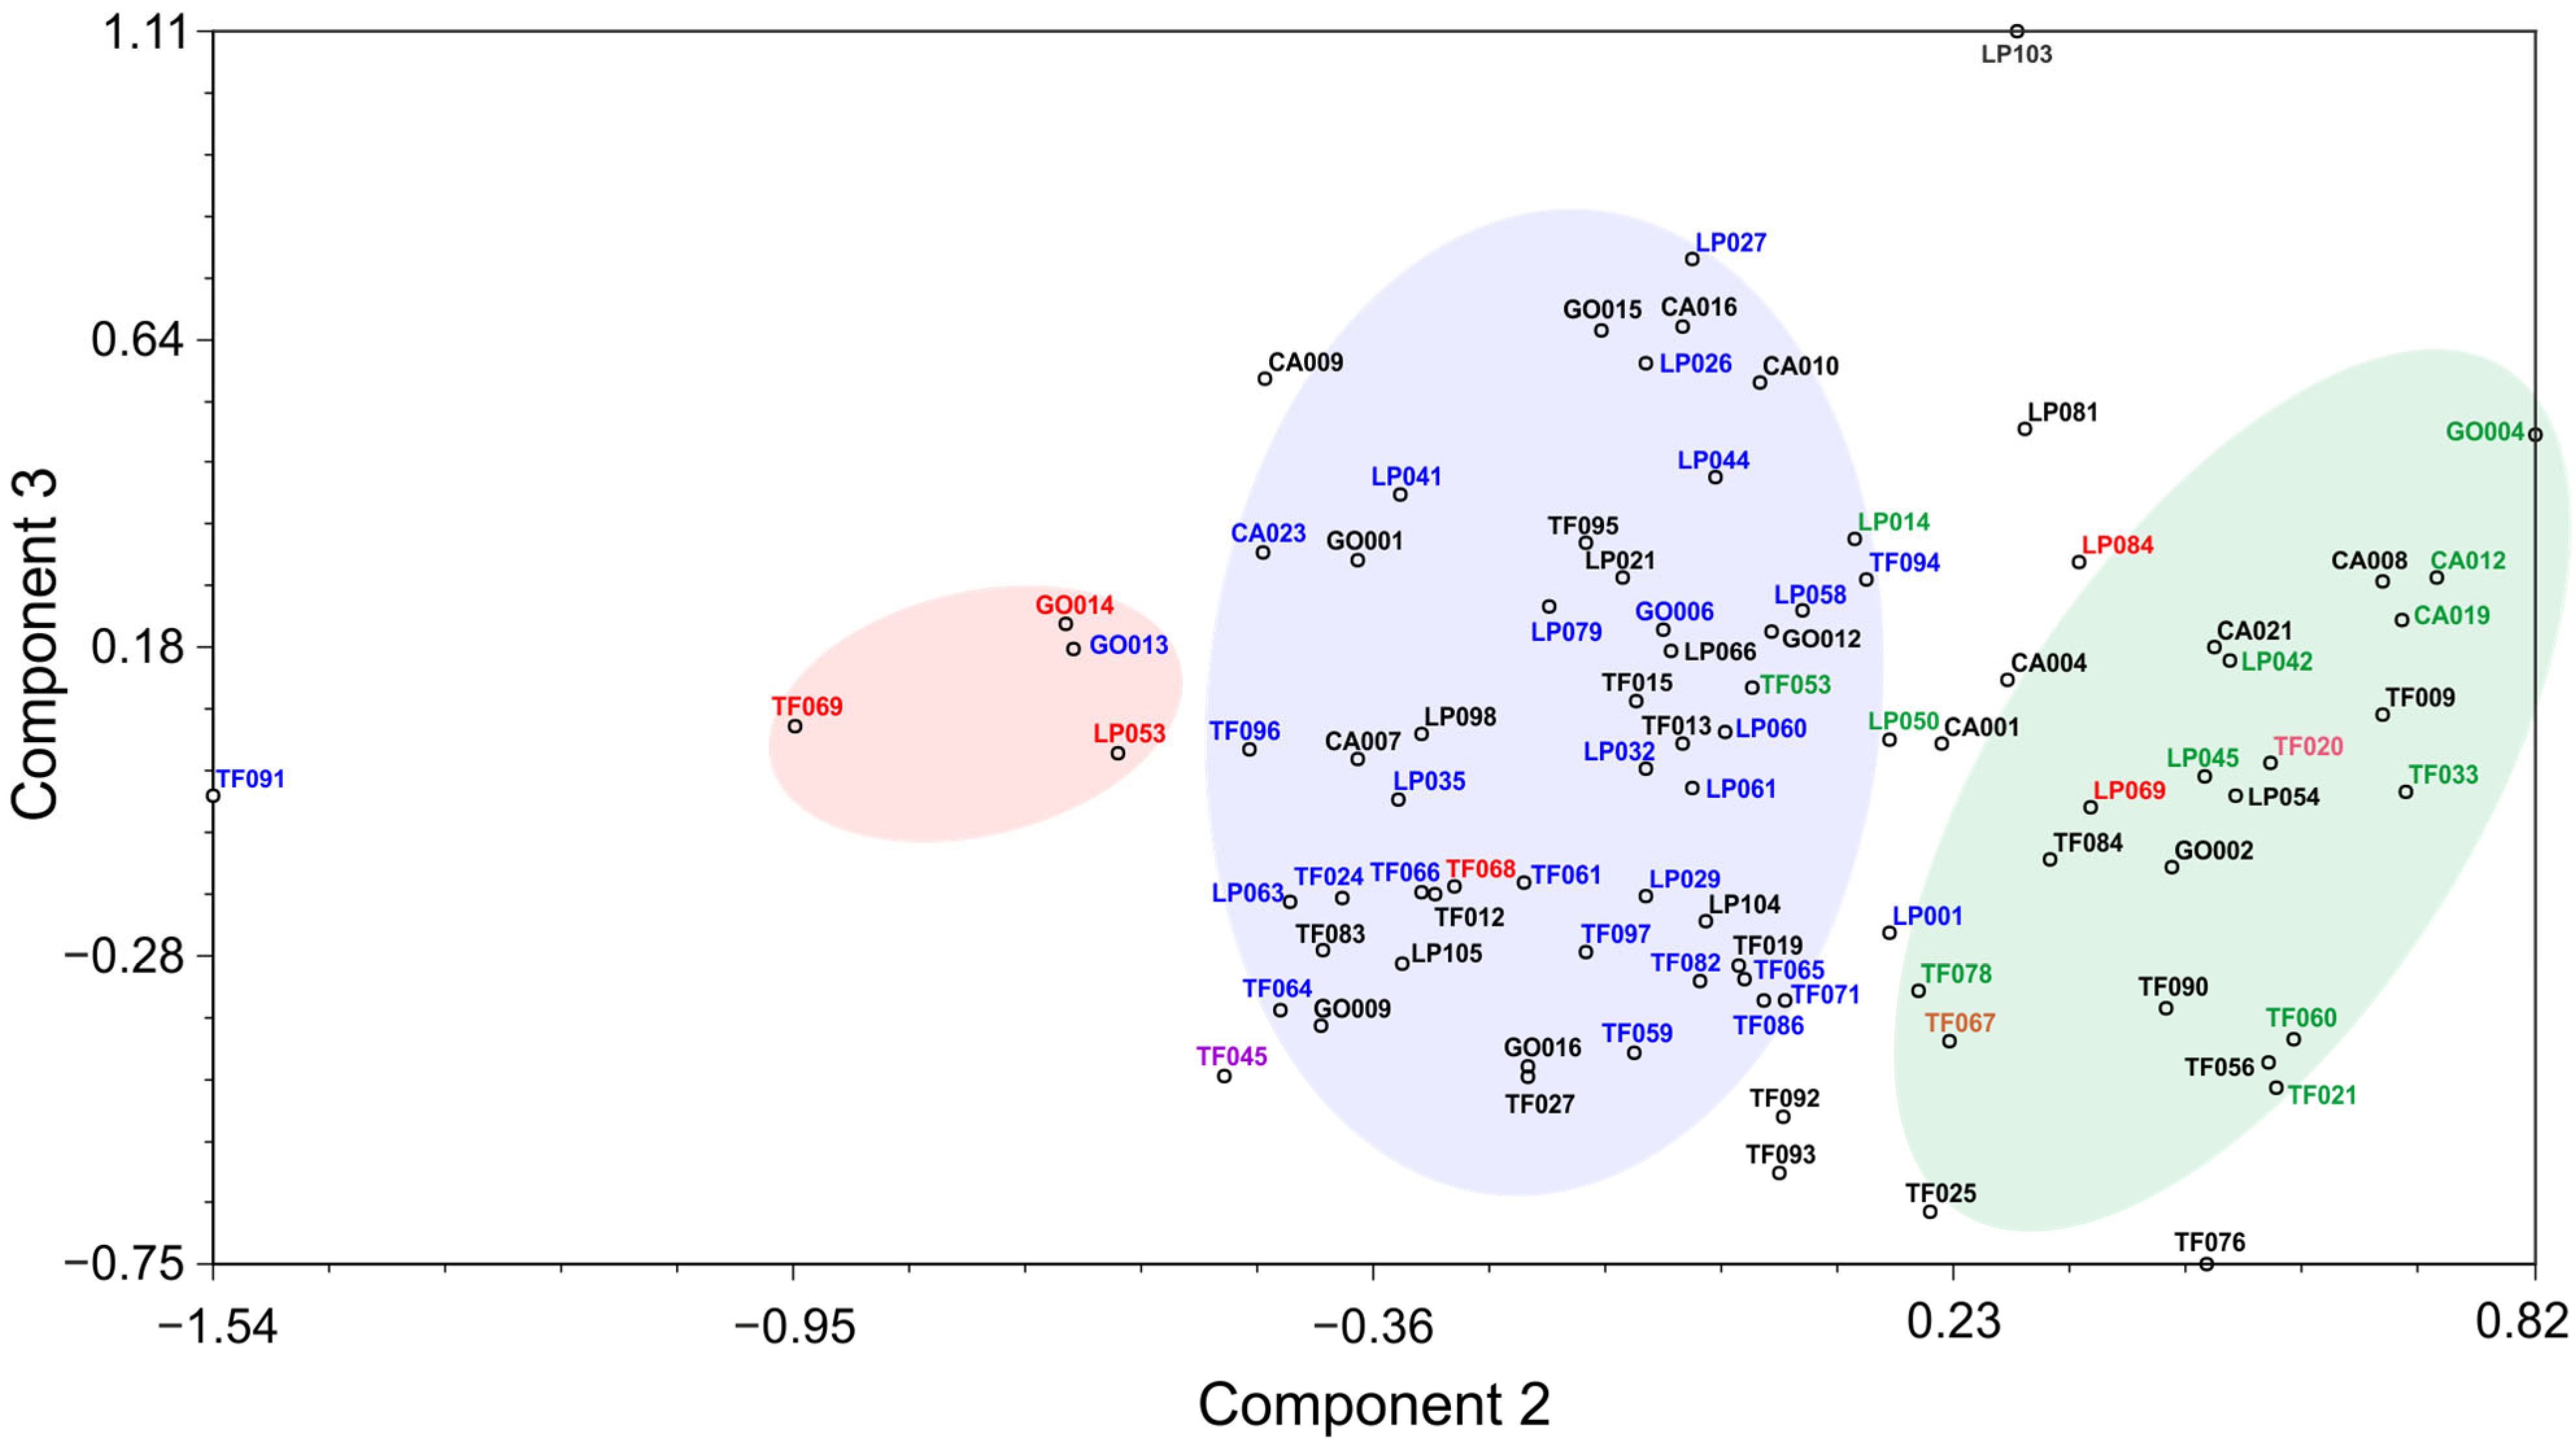
Similarly, components 2 and 3 are represented in two dimensions (Figure 7), showing large clusters of accessions closely related to the most widely cultivated cultivars. The remaining accessions are positioned both inside and outside these clusters, confirming the typical characteristics of hybrid or variant accessions.
The PCA revealed that the first component was the leaf blade length/width ratio, which was also associated with greater fruit peel thickness. Similarly, specimens with a lower fruit length-to-diameter ratio (round fruits) had the smallest divergence of the primary leaf veins with respect to the main vein, as well as the lowest fruit-to-seed length ratio. In other words, accessions with long, narrow leaves and thick skin tend to have spherical fruits with acute veins angles, whereas those accessions with long, narrow leaves and thin skin.
Principal Component 2 showed that accessions with the most divergent primary leaf veins had a higher fruit length-to-diameter ratio and seed length-to-diameter ratio, but a lower fruit-to-seed weight ratio, peduncle length-to-diameter ratio, and pulp-to-seed weight ratio. This component identified long, narrow fruits with large seeds and short peduncles, characteristics commonly associated with ‘Fuerte’ and similar cultivars. It also established a relationship between fruits with a large internode length, long peduncles, and a greater divergence of the secondary veins angles, and fruits with small seeds, a defining feature of this group. This group mainly comprises accessions related to the ‘Pinkerton’ cultivar and some similar accessions to ‘Hass’. Additionally, the ‘singular’ accessions fall outside the main groups. Several accessions initially considered ‘singular’ in this study converge within or on the periphery of the area occupied by the ‘Hass’ related accessions. These include TF092, LP001, LP027, LP098, GO001, CA004, LP103, CA010, TF095, TF083, GO009, LP104, GO015, GO016, CA007, TF093, LP066, TF027, LP105, CA001, TF015 and TF045, all of which share many morphological characteristics with ‘Hass’.
A similar situation occurs with the ‘singular’ accessions, which are very close to the artificially established area for the ‘Fuerte’ cultivar and similar phenotypes (TF056, GO002, TF020, TF067 and TF025). TF020 is a specimen of the ‘Shepard’ cultivar, notable for its morphotype similarity to ‘Fuerte’, while TF067 is a tree with a morphology very similar to that of ‘Fuerte’, but of unknown origin, which justifies its morphological inclusion in the ‘Fuerte’ cultivar group. The accession CA009, considered and marketed as ‘Pinkerton’, is closely related to the morphotypes associated with the ‘Pinkerton’ cultivar in the PCA.

3.3. Molecular Versus Morphological Characterisation

Comparing the results of the molecular study (Figure 4) with those of the morphological characterization (Figure 5 shows that the ‘Hass’ and ‘Fuerte’ cultivars are generally grouped together. However, despite being grouped with the ‘Hass’ cultivar in morphology, accessions TF012, TF027 and TF013 are classified as ‘singular’ with ISSR markers. Furthermore, the accessions grouped with the ‘Pinkerton’ cultivar in the ISSR molecular dendrogram do not correspond with the morphological results. Accession TF020 is grouped with the ‘Edranol’ cultivar in the molecular study but with the ‘Fuerte’ cultivar in the morphological study. Table 5 presents a comparison of the grouping results obtained through morphological and molecular analysis.
These variations could be due to genetic differences or genotype-environment interaction. It should be noted that 80% similarity was considered to establish the groupings in the molecular dendrogram; however, a value close to 60% similarity was considered in the morphological dendrogram due to the high variability obtained in the morphological analysis, which was performed in situ. These differences in expression could be due to differences in management, soil, climate or location (on different islands, slopes or altitudes).

4. Discussion

The number of polymorphic bands obtained in this study (an average of 9.79 per primer, ranging from 5 to 20) differed slightly from those reported by other authors. These differences are probably due to variations in the plant materials from different sources, the primers selected, the PCR conditions, DNA concentration, MgCl2 concentration, electrophoresis techniques, band resolution, among others. Some studies, employed polyacrylamide gels, while others used agarose gels, with variations in gel concentrations as well. For instance, an average of 18.5 amplification bands was reported, ranging from 11.83 to 19.57, when 8% polyacrylamide gels were used [17]. Similar differences in the number of bands were observed when seven ISSR primers were used, four of which -UBC 809, UBC 811, UBC 808 and UBC 807- were also applied in our study, resolved on 6% polyacrylamide gels [18]. The most notable difference was observed in the minimum value within the range: 17 amplification bands were detected when eight ISSR primers were used, including the same four primers, but with 1% agarose gels. A similar number of polymorphic bands were found (ranging from 4 to 17), which is consistent with the results of this study [20]. In another study, between 4 and 14 bands (average 8.25) were observed using four primers and 0.8% agarose gels [19]. In contrast, recent studies reported an average of 6.93 polymorphic bands using 15 primers and 1% agarose gels [21].
The expected heterozygosity (He) ranged from 0.34 to 0.90 for primers PKBT5 and PKBT8, with an average value of 0.68. This value is higher than that reported in genetic diversity studies of native avocados in Nayarit (Mexico), which used eight ISSR primers [20]. Their results showed an average He value of 0.33 across four locations in the state, with a value of 0.17 at the location where the studies were conducted. It was also higher than the He values obtained in a study on crossbreeding and genetic variability in Mexican avocados, which used four ISSR and five SSR primers, yielding an average He value of 0.48 [19]. This difference suggests a higher level of heterozygosity, possibly due to the greater number of primers employed in our study.
The polymorphism percentage obtained in this study (85.68%) was comparable to the values reported by other researchers, which ranged from 82.3% to 95.4% [15,16]. However, it was higher than 71.72% but lower than 93%, as reported in other studies [19,21]. The polymorphic content index (PIC) was found to be 0.45, which is similar to the mean value of 0.42 reported by Reyes-Alemán et al. [17], with a range of 0.35–0.48. This value is slightly higher than the PIC of 0.365, with a range of 0.36–0.37, reported by Sánchez-González and Gutiérrez-Díez [19]. However, the PIC values obtained in this study were significantly higher than those described by Ninh et al. [21], which ranged from 0.09 to 0.31, with a mean of 0.21. The resolution power of the primers in our study had a mean value of 11.39, with a range from 7.31 to 17.3. These values were slightly higher than the mean value of 8.69, with a range from 6.16 to 10.22, obtained in previous studies, but lower than the mean value of 13.37, with a range from 8.86 to 20.29, reported by other authors [17,21].
The morphological dendrogram clearly groups the main commercial cultivars together. As previously noted, three main groups and two subgroups were identified, which are associated with the cultivars most commonly grown in the Islands, such as ‘Hass’ and ‘Fuerte’. These findings are consistent with those of other researchers who have conducted phenotypic characterisation studies based on IPGRI [36] and UPOV [37] descriptors, sometimes supplemented with their own criteria [26,27,28,29,30,31,32,33,34,35]. Regarding the origin of the six accessions forming Group C.II, all of which are related to the ‘Hass’ cultivar and originate from the island of La Palma (LP001, LP058, LP061, LP060, LP026 and LP027), they may have been grouped together based on the hypothesis of Dr. Víctor Galán Sauco, an ICIA Senior researcher specialising in subtropical crops, who suggests that certain accessions from this island may have derived from a selection carried out decades ago by La Palma growers from a single introduction (personal communication, 6 September 2022).
The 34 accessions with different morphotypes, which are located in groups separate from the main clusters, are likely variants, as determined by Reyes-Alemán et al. [53] through morphological characterisation studies of the leaves, flowers, fruits, and seeds of species belonging to the Persea genus and related species. Similarly, a morphological study [31] identified several ungrouped accessions when examining the morphometric relationships of alternative hybrids to the ‘Hass’ cultivar in Mexico.
The remaining 25 accessions are ungrafted trees from seed, with the exception of nine specimens: CA001, TF090, CA010, TF056, TF067, GO001, CA007, TF093 and GO015, which correspond to grafted trees of unknown cultivar origin, and TF045, an accession of the ‘Lamb Hass’ cultivar from a collection held by the Cabildo de Tenerife and the ICIA. This may account for the notable divergence observed between the main groups, as indicated by the results of these molecular markers.
The PCA revealed that the fruit length-to-diameter ratio was the characteristic that contributed most significantly to component 1. These findings are consistent with those of other researchers [26], who considered fruit shape to be a highly discriminating trait in germplasm studies of the Persea genus. These authors also agree with the present study in recognizing ‘seed size’ as a key discriminating trait in avocado collection analyses. In our PCA, fruit traits such as weight and the length-to-diameter ratio showed considerable loading values in components 1 and 2, similar to previous findings. Other studies have reported fruit length as the most important characteristic in component 1 [54], which correlates with traits like fruit length/seed length and fruit weight/seed weight, both of which were also considered in our research. Additionally, studies have found that seed and fruit weight, as well as the fruit length-to-diameter ratio, are the most discriminating traits. These results are consistent with those obtained in this characterization [55]. In selection studies of Creole avocado progenies in Michoacán (Mexico), seed shape was identified as a highly discriminating trait among races and cultivars, which also supports our observations [28].
Similarly to principal component 1 in the previous study [56], component 2 in our analysis showed the strongest correlation with fruit weight/seed weight, pulp weight and skin/seed weight. In this study, the most discriminatory characteristics were fruit weight, fruit diameter, and pulp weight. Previous morphological studies [28] have highlighted the significant influence of fruit weight in PCA, which aligns with our findings, despite some differences in the variables used. Other studies employed multivariate PCA [31,53] identified the most discriminating fruit traits as fruit length, diameter, their ratio, fruit weight, the ratio of fruit length to seed length, seed length and diameter, and seed weight in the leaf and stem. These studies also pointed to petiole length and internode length as keys discriminatory traits. However, factors such as the ‘number of primary veins’, ‘divergence of the primary veins from the main leaf vein’, and ‘fruit skin thickness’, which were decisive factors in the first principal component of our research, were not identified as discriminatory traits in the reviewed literature.

5. Conclusions

The characterization of avocado accessions from the Canary Islands has provided valuable insights into the genetic and morphological diversity of this crop, highlighting both the complexity and the potential for improvement local germplasm. The high level of genetic variation observed, as indicated by the ISSR markers, underscores the importance of preserving this diversity for future breeding programs. The identification of distinct genetic clusters related to well-known commercial cultivars such as ‘Hass’, ‘Fuerte’, and ‘Pinkerton’ further emphasizes the significance of these cultivars in local cultivation, while also revealing the presence of unique, sexually propagated accessions that could offer novel traits.
Morphological traits such as fruit size, seed characteristics, and fruit-to-seed ratios were identified as key discriminators in the PCA, consistent with previous studies in the Persea genus. These traits are crucial not only for selecting promising accessions but also for improving agronomic practices and meeting market demands. The results suggest the existing diversity could be leveraged to develop new cultivars with improved resistance to environmental stresses or diseases, which is a critical concern for the future of avocado production in the Canary Islands.
The study provides valuable information for avocado breeding programs and emphasizes the need to continue conservation efforts to safeguard this valuable germplasm. Additionally, it highlights the potential to explore hybridization strategies that combine desirable traits from different accessions. Future studies should focus on the genetic improvement of underutilized local cultivars, while new molecular tools, such as next-generation sequencing, could further enhance our understanding of avocado genetics to improve cultivation strategies.

Supplementary Materials

The following supporting information can be downloaded at: https://www.mdpi.com/article/10.3390/horticulturae12020182/s1.

Author Contributions

Conceptualization, L.R., J.I.H., F.L. and D.R.; Methodology, J.I.H., F.L. and D.R.; Investigation, L.R., D.R., F.L., and V.P.; Resources, D.R.; Software, L.R., J.I.H., F.L. and D.R.; Data curation, L.R., F.L. and D.R.; Writing—original draft, L.R., M.G.M.-A., F.L. and D.R.; Formal analysis, L.R., J.I.H., F.L. and D.R.; Writing—review and editing, L.R., M.G.M.-A., D.R. and F.L.; Supervision, J.I.H. and D.R.; Project administration, D.R. All authors have read and agreed to the published version of the manuscript.

Funding

The authors would like to acknowledge the funding provided by the Cabildo Insular de Tenerife for their previous work, and by the Canary Islands Agricultural Research Institute (ICIA) for the publication of this manuscript.

Data Availability Statement

The raw data supporting the conclusions of this article will be made available by the authors on request.

Acknowledgments

The authors would like to thank all the farmers on the islands of Gran Canaria, La Gomera, La Palma and Tenerife who own the avocado trees that were studied. Thanks are also due to Verónica Gea and Yolanda Verdú for their help with the laboratory work and to Carla Carballo and Noelia Herrera for their help with the fieldwork. Thanks are also due to the Center for the Conservation of Agricultural Biodiversity of the Cabildo de Tenerife (CCBAT), the Institute of Subtropical and Mediterranean Horticulture La Mayora (IHSM) from CSIC and the Canary Islands Agricultural Research Institute (ICIA), where most of the work was conducted.

Conflicts of Interest

The authors declare no competing interests.

References

  1. Popenoe, W. Origin of the cultivated races of avocados. Calif. Avocado Assoc. Yearb. 1935, 19, 184–194. [Google Scholar]
  2. Williams, L. The botany of the avocado and its relatives. In Proceedings of the First International Tropical Fruit Short Course: The Avocado, Miami Beach, FL, USA, 5–10 November 1976; Sauls, J.W., Philips, R.L., Jackson, L.K., Eds.; Fruit Crops Dept., Florida Cooperative Extension Service, Institute of Food and Agricultural Sciences, University of Florida: Gainesville, FL, USA, 1976; pp. 9–15. Available online: http://www.avocadosource.com/journals/itfsc/proc_1976_pg_9-15.pdf (accessed on 5 August 2025).
  3. Bergh, B.; Ellstrand, N. Taxonomy of the Avocado. Calif. Avocado Soc. Yearb. 1986, 70, 135–146. [Google Scholar]
  4. García Cabezón, A. Prólogo. In El Aguacate; Álvarez de la Peña, F.J., Ed.; Publicaciones de Extensión Agraria, Ministerio de Agricultura, Pesca y Alimentación: Madrid, Spain, 1979. [Google Scholar]
  5. Salas, M.; Cáceres, M.T. Las plantas alimenticias americanas en Canarias en los siglos XV y XVI. In Actas del XV Coloquio de Historia Canario-Americana; Excmo. Cabildo Insular de Gran Canaria: Las Palmas de Gran Canaria, Spain, 2005; pp. 215–228. [Google Scholar]
  6. Hormaza, I. Jornadas Técnicas Sobre Aguacate. El Material Vegetal en el Cultivo del Aguacate. 2018. Available online: https://www.icia.es/icia/download/Aguacate/03.pdf (accessed on 7 July 2025).
  7. Bory de Saint-Vincent, J.B.G.M. Ensayos Sobre las Islas Afortunadas y la Antigua Atlántida o Compendio de la Historia del Archipiélago Canario; José Antonio Delgado Luis: La Orotava, Spain, 1988. (In Spanish) [Google Scholar]
  8. ISTAC. Estadísticas Agrarias del Gobierno de Canarias. 2022. Available online: https://www.gobiernodecanarias.org/istac/estadisticas/sectorprimario/ (accessed on 20 June 2025).
  9. Galán, V.; Fernández, D. Avocado Culture in the Canary Islands. Calif. Avocado Soc. Yearb. 1985, 69, 73–80. [Google Scholar]
  10. Parrilla, M.; Hernández, J.C.; Méndez, C.; Ríos, D.; Fernández, D.; Galán, V. Prospección y Caracterización de las poblaciones locales de aguacate de la Isla de Tenerife. Actas De Hortic. 2009, 54, 77–78. [Google Scholar]
  11. Parrilla, M.; Ríos, D.; Méndez, C.; Fernández, D.; Hernández, P.M.; Galán, V. Preliminary study of the seedling avocado (Persea americana Mill.) population of Tenerife. Acta Hortic. 2012, 928, 81–86. [Google Scholar] [CrossRef] [Scilit]
  12. Zietkiewicz, E.; Rafalski, A.; Labuda, D. Genome Fingerprinting by Simple Sequence Repeat (SSR)-Anchored Polymerase Chain Reaction Amplification. Genomics 1994, 20, 176–183. [Google Scholar] [CrossRef] [Scilit]
  13. Pradeep, M.; Sarla, N.; Siddiq, E.A. Inter simple sequence repeat (ISSR) polymorphism and its application in plant breeding. Euphytica 2022, 128, 9–17. [Google Scholar] [CrossRef] [Scilit]
  14. Bornet, B.; Branchard, M. Nonanchored Inter Simple Sequence Repeat (ISSR) Markers: Reproducible and Specific Tools for Genome Fingerprinting. Plant Mol. Biol. Rep. 2001, 19, 209–215. [Google Scholar] [CrossRef] [Scilit]
  15. Cuiris-Pérez, H.; Guillén-Andrade, H.; Pedraza-Santos, M.E.; López-Medina, J.; Vidales-Fernández, I. Genetic variability within mexican race avocado (Persea americana Mill.) Germplasm collections determined by ISSRs. Rev. Chapingo Serie Hortic. 2009, 15, 169–175. [Google Scholar] [CrossRef] [Scilit]
  16. Reyes-Alemán, J.C.; Valadez-Moctezuma, E.; Simuta-Velázco, L.; Barrientos-Priego, A.F.; Gallegos-Vázquez, C. Distinción de especies del género Persea mediante RAPD e ISSR de ADN. Rev. Mex. Cienc. Agrícolas 2013, 4, 517–529. [Google Scholar] [CrossRef] [Scilit]
  17. Reyes-Alemán, J.C.; Valadez-Moctezuma, E.; Barrientos-Priego, A.F. Assessment of genetic relationship in Persea spp. by traditional molecular markers. Genet. Mol. Res. 2016, 15, 1–11. [Google Scholar] [CrossRef] [Scilit]
  18. Ramírez, M.C. Caracterización Molecular de Colectas de Aguacate de la Zona sur del Estado de México. Ph.D. Thesis, Universidad Autónoma del Estado de México, Toluca de Lerdo, México, 2015. Available online: http://hdl.handle.net/20.500.11799/40641 (accessed on 15 April 2025).
  19. Sánchez-González, E.I.; Gutiérrez-Díez, A. Outcrossing Rate and Genetic Variability in Mexican Race Avocado. J. Amer. Soc. Hort. Sci. 2020, 145, 53–59. [Google Scholar] [CrossRef] [Scilit]
  20. López-Guzmán, G.G.; Palomino-Hermosillo, Y.A.; Balois-Morales, R.; Bautista-Rosales, P.U.; Jiménez-Zurita, J.O. Genetic diversity of native avocado in Nayarit, Mexico, determined by ISSRs. Cienc. Tecnol. Agropecu. 2021, 22, 184. [Google Scholar] [CrossRef] [Scilit]
  21. Ninh, T.T.; Doan, H.T.; Nguyen, M.T.; Tran, T.T.; Duc Dang, P.D.; Truong Dinh, S.; Nguyen, H.T.; Nong, H.T.; Nguyen, C.X. Genetic diversity of avocado (Persea americana Mill.) germplasm in Vietnam using RAPD and ISSR molecular markers. Aust. J. Crop Sci. 2022, 16, 856–862. [Google Scholar] [CrossRef] [Scilit]
  22. Sánchez, S.; Barrientos, F. Avocado production and breeding in Mexico. S. Afr. Avocado Grow. Assoc. Yearb. 1987, 10, 28–30. [Google Scholar]
  23. Barrientos, A.F. Características Principales de las Selecciones “CICTAMEX 120 PLS, CICTAMEX 131 PLS, CICTAMEX 137 PLS, CICTAMEX 148 PLS y CICTAMEX 175 PLS.”; Centro de Investigaciones Científicas y Tecnológicas del Aguacate: Coatepec Harinas, Mexico, 1987; Volume 48, pp. 1–6. [Google Scholar]
  24. Téliz, D. El Aguacate y su Manejo Integrado; Mundi Prensa: Río Pánuco, México, 2000; ISBN 9789687462158. [Google Scholar]
  25. Barrientos-Priego, A.F.; Muñoz-Pérez, R.; Borys, M.W.; Martínez-Damián, M.T. El Aguacate y su Manejo Integrado; Téliz, D., Ed.; Mundi-Prensa: Río Pánuco, México, 2000; pp. 35–54. [Google Scholar]
  26. Campos, E.; Terrazas, T.; López-Mata, L. Persea (avocados) phylogenetic analysis based on morphological characters: Hypothesis of species relationships. Genet. Resour. Crop Evol. 2007, 54, 249–258. [Google Scholar] [CrossRef] [Scilit]
  27. Matamoro, J.M.; Rodríguez, N.; Jiménez, R. Caracterización Cualitativa en la Colección de Aguacateros (Persea americana Mill) del Instituto de Investigaciones en Fruticultura Tropical de Cuba. 2009. Available online: http://www.avocadosource.com/international/cuba_papers/MatamoroJOse2009.pdf (accessed on 10 September 2025).
  28. Larios-Guzmán, A.; Vidales-Fernández, I.; Tapia-Vargas, L.M.; Guillén-Andrade, H.; Villaseñor-Ramírez, F.; Mendoza-López, M.; Teniente, R. Avances en la Caracterización Morfológica de Progenies de Aguacate Criollo en Michoacán, México. In Proceedings of the VII World Avocado Congress 2011, Cairns, Australia, 5–9 September 2011; Available online: https://www.avocadosource.com/wac7/section_14/lariosguzmana2011.pdf (accessed on 5 May 2025).
  29. Ramírez, M.C.; Reyes, J.C.; Mejía, J.; Vázquez, L.M.; Flores, F.; Aguilar, S.; Berdeja, R. Caracterización morfológica y molecular de genotipos de Persea. In Proceedings of the XVI Congreso Internacional de Ciencias Agrarias, Mexicali, México, 24–25 October 2013. [Google Scholar]
  30. Acosta, E.; Almeyda, I.H.; Hernández, I. Evaluación de aguacates criollos en Nuevo León, México: Región norte. Rev. Mex. Cienc. Agrícolas 2013, 4, 531–542. [Google Scholar]
  31. Espíndola-Barquera, M.C.; Campos-Rojas, E.; Santiago-Pablo, A.E.; Aragón-Robles, E.; Sánchez-González, E.A. Descripción morfométrica de híbridos de aguacate (Persea americana Mill.). In Proceedings of the Recursos Genéticos y Manejo de Viveros, VIII Congreso Mundial de la Palta, Lima, Perú, 13–18 September 2015; Available online: https://www.avocadosource.com/WAC8/Section_02/Section_02_Abstracts_Spanish.pdf (accessed on 10 October 2025).
  32. Reyes-Alemán, J.C.; Ramírez-Mendoza, M.C.; Flores-Ayala, F.; Serrano-Hernández, M.; Vázquez-García, L.M.; Mejía-Carranza, J.; Aguilar-Medel, S.; Berdeja-Abreu, R.; Espíndola-Barquera, M.C. Caracterización morfológica y molecular de germoplasma de aguacate en el centro de México. In Proceedings of the Recursos Genéticos y Manejo de Viveros, VIII Congreso Mundial de la Palta, Lima, Perú, 13–18 September 2015; Available online: https://www.avocadosource.com/WAC8/Section_02/ReyesAlemanJC2015b.pdf (accessed on 4 March 2025).
  33. Montes-Hernández, S.; de la Torre-Vizcaino, J.D.; Heredia-García, E.; Hernández-Martínez, M.; Camarena-Hernández, M.G. Caracterización morfológica de germoplasma de aguacate mexicano (Persea americana var. drymifolia, LAURACEAE). Interciencia 2017, 42, 175–180. [Google Scholar]
  34. Jaime, J.C. Caracterización Morfológica y Molecular de Poblaciones de Aguacate Cascarudo. Ph.D. Thesis, Universidad Autónoma del Estado de México, Toluca de Lerdo, México, 2020. Available online: http://hdl.handle.net/20.500.11799/109345 (accessed on 10 April 2025).
  35. Acurio, J.A. Caracterización Morfológica de la Colección de Aguacate (Persea americana) de la Estación Experimental Tropical—Pichilingue (EETP); UTEQ: Quevedo, Ecuador, 2022; 93p, Available online: https://repositorio.uteq.edu.ec/handle/43000/6664 (accessed on 28 January 2026).
  36. IPGRI. Descriptores Para Aguacate (Persea spp.); Instituto Internacional de Recursos Fitogenéticos: Roma, Italy, 1995; Available online: https://hdl.handle.net/10568/72797 (accessed on 3 February 2025).
  37. UPOV. Aguacate. Persea americana Mill. Directrices Para la Ejecución del Examen de la Distinción, la Homogeneidad y la Estabilidad. 2006. Available online: https://www.upov.int/documents/d/upov/tg-documents-es-tg097.pdf (accessed on 5 October 2025).
  38. Hormaza, J.I. Molecular Characterization and similarity relationships among apricot (Prunus armeniaca L.) genotypes using simple sequence repeats. Theor. Appl. Genet. 2002, 104, 321–328. [Google Scholar] [CrossRef] [Scilit]
  39. Susilo, K.R. Genetic Variability Studies on Avocado (Persea americana L.) Using Inter-Simple Sequences Repeat (ISSR) Analysis. Ph.D. Thesis, IPB University, Bogor, Indonesia, 2010. Available online: http://repository.ipb.ac.id/handle/123456789/44813 (accessed on 10 November 2025).
  40. Mohamed, E. Evaluation of Nonanchored Inter Simple Sequence Repeat (ISSR) Marker to Detect DNA Damage in Common Bean (Phaseolus vulgaris L.) Exposed to Acrylamide. J. Forest Environ. Sci. 2008, 24, 61–68. [Google Scholar]
  41. Ashshidiq, J.F.A.; Subositi, D.; Daryono, B.S.; Purnomo. Genetic Diversity of Johar (Senna siamea (Lam.) H.S. Irwin & Barneby) in Five Islands in Indonesia Based on ISSR Molecular Characters. AIP Conf. Proc. 2020, 2260, 020012. [Google Scholar] [CrossRef] [Scilit]
  42. Ibarra-Torres, P.; Valadez-Moctezuma, E.; Pérez-Grajales, M.; Rodríguez-Campos, J.; Jaramillo-Flores, M.E. Inter- and intraspecific differentiation of Capsicum annuum and Capsicum pubescens using ISSR and SSR markers. Sci. Hort. 2015, 181, 137–146. [Google Scholar] [CrossRef] [Scilit]
  43. Rohlf, F.J. NTSYS-pc Numerical Taxonomy and Multivariate Analysis System, Version 2.1; Department of Ecology and Evolution, State University of New York: Stony Brook, NY, USA, 2000; Available online: https://www.researchgate.net/publication/246982444_NTSYS-pc_-_Numerical_Taxonomy_and_Multivariate_Analysis_System (accessed on 10 September 2025).
  44. Jaccard, P. Etude de la distribution florale dans une portion des Alpes et du Jura. Bull. Soc. Vaudoise Sci. Nat. 1901, 37, 547–579. [Google Scholar] [CrossRef] [Scilit]
  45. Sneath, P.H.A.; Sokal, R.R. Numerical Taxonomy. The Principles and Practice of Numerical Classification; W. H. Freeman and Company: San Francisco, CA, USA, 1973; Available online: https://archive.org/details/numericaltaxonom0000snea (accessed on 10 September 2025).
  46. Nei, M. Analysis of Gene Diversity in Subdivided Populations. Proc. Natl. Acad. Sci. USA 1973, 70, 3321–3323. [Google Scholar] [CrossRef] [Scilit]
  47. Roldán-Ruiz, I.; Dendauw, J.; Van Bockstaele, E.; Depicker, A.; De Loose, M. AFLP markers reveal high polymorphic rates in ryegrasses (Lolium spp.). Mol. Breed. 2000, 6, 125–134. [Google Scholar] [CrossRef] [Scilit]
  48. De Riek, J.; Calsyn, E.; Everaert, I.; Van Bockstaele, E.; De Loose, M. AFLP based alternatives for the assessment of Distinctness, Uniformity and Stability of sugar beet varieties. Theor. Appl. Genet. 2001, 103, 1254–1265. [Google Scholar] [CrossRef] [Scilit]
  49. Arteaga, L.D.; Reyes-Alemán, J.C. Análisis de Cuatro Marcadores RAPD en 41 Accesiones de Aguacate (Persea sp.); Universidad Autónoma del Estado de México: Toluca de Lerdo, Mexico, 2017; 16p, Available online: http://hdl.handle.net/20.500.11799/68290 (accessed on 5 June 2025).
  50. Prevost, A.; Wilkinson, M.J. A new system of comparing PCR primers applied to ISSR fingerprinting of potato cultivars. Theor. Appl. Genet. 1999, 98, 107–112. [Google Scholar] [CrossRef] [Scilit]
  51. Jiménez, P.; García, P.; Quitral, V.; Vásquez, K.; Parra-Ruiz, C.; Reyes-Farias, M.; García-Díaz, D.F.; Robert, P.; Encina, C.; Soto-Covasich, J. Pulp, Leaf, Peel and Seed of Avocado Fruit: A Review of Bioactive Compounds and Healthy Benefits. Food Rev. Int. 2021, 37, 619–655. [Google Scholar] [CrossRef] [Scilit]
  52. Sneath, P.H.A.; Sokal, R.R. Numerical taxonomy. Nature 1962, 193, 855–860. [Google Scholar] [CrossRef] [Scilit] [PubMed]
  53. Reyes-Alemán, J.C.; Espíndola, M.X.; Barrientos-Priego, A.F.; Cruz, J.G. Caracterización Morfológica Mediante Hoja, Flor, Fruto y Semilla de Especies del Género Persea y Especies Afines Mediante Análisis por Métodos Multivariados. In Proceedings of the VII World Avocado Congress 2011, Cairns, Australia, 5–9 September 2011; Available online: https://www.avocadosource.com/wac7/section_14/reyesalemanjuan2011.pdf (accessed on 10 August 2025).
  54. López, C.E.; García, A.R.; Martínez, H.G. Caracterización in situ Morfológica y Físico-Química de Aguacates Nativos (Persea americana Mill) en dos Localidades de la Región Huista, Huehuetenango. CRIA OCCIDENTE. Programa Consorcios Regionales de Investigación Agropecuaria. 2019. Available online: https://repositorio.iica.int/items/a0618d0a-000d-49ba-a24c-db0914aa014f (accessed on 15 October 2025).
  55. Gutiérrez-Diez, A.; Martínez-de la Cerda, J.; García-Zambrano, E.; Iracheta-Donjuan, L.; Ocampo-Morales, J.; Cerda-Hurtado, I.M. Study of genetic Diversity of native avocado in Nuevo León, México. Rev. Fitotec. Mex. 2009, 32, 9–18. [Google Scholar]
  56. López, G.; Medina, R.; Guillén, H.; Ramírez, L.; Aguilar, J.; Valdivia, M. Características fenotípicas de hoja y fruto en selecciones de aguacate criollo de clima subtropical en el estado de Nayarit. Rev. Fuente 2012, 4, 10. [Google Scholar]
Figure 1. Maps showing the location of the Canary Islands in relation to the Iberian Peninsula, as well as the sampled islands in the archipelago (marked in red) and the location of the samples on each island (yellow circles).
Horticulturae 12 00182 g001
Figure 2. Relative distribution of amplified fragments for the set of ISSR primers used in this study.
Horticulturae 12 00182 g002
Figure 3. ISSR banding profile of different accessions obtained with primer UBC 811 in 1.8% agarose gel horizontal electrophoresis. M: molecular weight marker.
Horticulturae 12 00182 g003
Figure 4. ISSR-based molecular dendrogram of 87 avocado accessions. The analysis was performed using the SAHN module and the UPGMA method [45]. The Jaccard similarity matrix was calculated with 14 ISSR primers (Table 4). Codes on the nodes represent specific clades discussed in the text.
Horticulturae 12 00182 g004
Figure 5. Morphological dendrogram of 87 avocado entries through the unweighted pair group method with arithmetic mean (UPGMA). Association coefficient “Simple Matching Coefficient (SMC). Codes on the nodes represent specific clades discussed in the text.
Horticulturae 12 00182 g005
Figure 6. Two-dimensional representation of principal components 1 and 2 illustrating the clustering of avocado accessions into ‘Hass’, ‘Fuerte’, and ‘Pinkerton’ groups. ‘Hass’ accessions are shown in blue, ‘Fuerte’ in green, ‘Pinkerton’ in red, ‘Shepard’ in pink, ‘Edranol’ in brown, and ‘Lamb Hass’ in purple. The grouping of the main cultivars is highlighted by manually drawn ellipses, matching the color of each cultivar.
Horticulturae 12 00182 g006
Figure 7. Two-dimensional representation of principal components 2 and 3 illustrating the clustering of avocado accessions into ‘Hass’, ‘Fuerte’, and ‘Pinkerton’ groups. ‘Hass’ accessions are shown in blue, ‘Fuerte’ in green, ‘Pinkerton’ in red, ‘Shepard’ in pink, ‘Edranol’ in brown, and ‘Lamb Hass’ in purple. The grouping of the main cultivars is highlighted by manually drawn ellipses, matching the color of each cultivar.
Horticulturae 12 00182 g007
Table 1. List of avocado accessions for morphological study and their geographic locations.
IDIslandMunicipalityIDIslandMunicipalityIDIslandMunicipalityIDIslandMunicipality
CA001CAAgaeteLP014LPLos Llanos LP084LPSanta CruzTF064TFLa Orotava
CA004CAAgaeteLP021LPLos LlanosLP098LPBreña BajaTF065TFGüímar
CA007CAAgaeteLP026LPLos LlanosLP103LPLos LlanosTF066TFLa Orotava
CA008CAAgaeteLP066LPSanta CruzLP104LPEl PasoTF067TFGüímar
CA009CAAgaeteLP027LPLos LlanosLP105LPSanta CruzTF068TFGüímar
CA010CAAgaeteLP029LPLos LlanosTF009TFLa OrotavaTF069TFGüímar
CA012CAAgaeteLP032LPTijarafeTF012TFLa OrotavaTF071TFLa Orotava
CA016CAArucasLP035LPTijarafeTF013TFLa GuanchaTF076TFArona
CA019CAMogánLP041LPTijarafeTF015TFLa OrotavaTF078TFArona
CA021CAMogánLP042LPTijarafeTF019TFLa OrotavaTF082TFLa Laguna
CA023CATeldeLP044LPLos LlanosTF020TFLa OrotavaTF083TFLa Orotava
GO001GOS. SebastiánLP045LPLos LlanosTF021TFLa OrotavaTF084TFLa Orotava
GO002GOHermiguaLP050LPLos LlanosTF024TFLa OrotavaTF086TFLa Orotava
GO004GOS. SebastiánLP053LPLos LlanosTF025TFLa OrotavaTF090TFBuena Vista
GO006GOS. SebastiánLP054LPLos LlanosTF027TFLa OrotavaTF091TFLa Orotava
GO009GOHermiguaLP058LPSanta CruzTF033TFGüímarTF092TFGuía Isora
GO012GOHermiguaLP060LPSanta CruzTF045TFLa LagunaTF093TFLa Orotava
GO013GOHermiguaLP061LPSanta CruzTF053TFGüímarTF094TFGüímar
GO014GOS. SebastiánLP063LPSanta CruzTF056TFGüímarTF095TFLos Realejos
GO015GOS. SebastiánLP069LPPuntallanaTF059TFTacoronteTF096TFSgo. Teide
GO016GOV. Gran ReyLP079LPLos LlanosTF060TFGüímarTF097TFTacoronte
LP001LPBreña AltaLP081LPSanta CruzTF061TFTacoronte---------
CA: Gran Canaria; GO: La Gomera; LP: La Palma; TF: Tenerife.
Table 2. Selected ISSR primers for genetic polymorphism detection in avocado.
Original
Identification
DomainbpOptimal Annealing
Temperature (°C) 1
Work References
in Avocado
A09AC(GACA)41858Reyes-Alemán et al., 2013 [16]
Ramírez, 2015 (Thesis) [18]
HASS 3(CAG)51558Bornet & Branchard, 2001 [14] 2
PKBT 2(AC)8TT1858Susilo, K. R., 2010 (Thesis) [39]
PKBT 4(AG)8AA1853Susilo, K. R., 2010 (Thesis) [39]
PKBT 5(AG)8TA1853Susilo, K. R., 2010 (Thesis) [39]
PKBT 6(AG)8TT1853Susilo, K. R., 2010 (Thesis) [39]
PKBT 7(GA)9A1954Susilo, K. R., 2010 (Thesis) [39]
PKBT 8(GA)9C1954Susilo, K. R., 2010 (Thesis) [39]
RAF 4(CAA)51552Bornet & Branchard, 2001 [14] 2
UBC 807(AG)8T1753Cuiris-Pérez et al., 2009 [15]
Susilo, K. R., 2010 (Thesis) [39]
UBC 808(AG)8C1754Cuiris-Pérez et al., 2009 [15]
UBC 809(AG)8G1753Cuiris-Pérez et al., 2009 [15]
UBC 811(GA)8C1752Cuiris-Pérez et al., 2009 [15]
UBC 817(CA)8A1756Cuiris-Pérez et al., 2009 [15]
UBC 841(GA)8YC1852Reyes-Alemán et al., 2013, 2016 [16,17]
Ramírez, 2015 (Thesis) [18]
UBC 844(CT)8RC1852Cuiris-Pérez et al., 2009 [15]
UBC 857(AC)8YG1858Reyes-Alemán et al., 2013, 2016 [16,17]
Ramírez, 2015 (Thesis) [18]
UBC 873(GACA)41653Reyes-Alemán et al., 2013 [16]
Bornet & Branchard, 2001 [14] 2
UBC 814(CT)8A1752NR
UBC 818(CA)8G1756NR
UBC 824(TC)8G1753NR
UBC 825(AC)8T1757NR
UBC 829(TG)8C1758NR
UBC 834(AG)8YT1854NR
UBC 847(CA)8RC1857NR
UBC 868(GAA)61852NR
UBC 880(GGAGA)31552NR
UBC810(GA)8T1752NR
1 Optimal temperature for PCR determined during the present work, using an annealing temperature gradient in the thermocycler. 2 Primers used by the authors in other species. The primer (CAG)5 has been named Hass 3, whereas other authors have named it Mp2 and IS17 in molecular studies of Phaseolus vulgaris and Senna siamea, respectively [40,41]. Similarly, the primer AC(GACA)4 has been named A09 in accordance with the naming convention used in DNA fingerprinting studies of Capsicum spp., in which it was named Iso_9 [42]. NR: no references in avocado.
Table 3. Reference values for the percentage of pulp and peel weight in relation to the total fruit weight for the selection of accessions to be conserved (from: https://avocado.ucr.edu/avocado-ratios (accessed on 22 November 2025).
Cultivar% Seed% Peel% Pulp% Pulp + Peel
‘Pinkerton’10137790
‘Fuerte’15107585
‘Gem’15137285
‘Lamb Hass’15147185
‘Hass’16127284
‘Reed’17117283
‘Gwen’18136982
Average15.1412.2972.5784.86
Min10106982
Max18147790
Table 4. Amplification data for each primer.
Primer
Name
DomainTotal Bands 1Different Bands 2MbPbP (%)HePICRp
UBC 811(GA)8C6571411392.90.710.5015.10
UBC 841(GA)8YC4781111090.90.750.5010.99
UBC 807(AG)8T7531811794.40.770.5017.31
PKBT 7(GA)9A38710010100.00.800.498.9
HASS 3(CAG)5377102880.00.810.498.7
UBC 834(AG)8YT505102880.00.660.4911.61
UBC 809(AG)8G409808100.00.650.489.4
RAF 4(CAA)5512102880.00.650.4811.77
UBC 810(GA)8T31892777.80.840.487.31
UBC 825(AC)8T5391641275.00.850.4712.39
PKBT 8(GA)9C55720020100.00.900.4412.80
UBC 808(AG)8C46072571.40.430.3710.57
UBC 818(CA)8G49272571.40.350.3111.31
PKBT 5(AG)8TA49371685.70.340.3111.33
TOTAL 693715720137
AVERAGE 495.511.21.409.7085.70.680.4511.39
1 Total number of amplification fragments (bands) observed in the 87 genotypes for each primer. 2 Number of amplified fragments with different length (bp) in each primer. Mb: Number of monomorphic bands. Pb: Number of polymorphic bands. P: Polymorphism percentage. He: Expected heterozygosity. PIC: Polymorphic information content. Rp: Primer resolving power.
Table 5. Comparison of the grouping results obtained through morphological and molecular analysis.
AccessionISSRMorphologyAccessionISSRMorphology
CA001SSLP084PP
CA004SSLP098SS
CA007SSLP103SS
CA008FSLP104SS
CA009SSLP105SS
CA010SSTF009SS
CA012FFTF012SS
CA016SSTF013SS
CA019FFTF015SS
CA021SSTF019SS
CA023HHTF020SHSH
GO001SSTF021FF
GO002SSTF024HH
GO004FFTF025SS
GO006HHTF027SS
GO009SSTF033FF
GO012HSTF045LHLH
GO013HHTF053FF
GO014PPTF056SS
GO015SSTF059HH
GO016SSTF060FF
LP001SHTF061HH
LP014FFTF064HH
LP021HSTF065HH
LP026HHTF066HH
LP027SHTF067EE
LP029HHTF068PP
LP032HHTF069PP
LP035HHTF071HH
LP041HHTF076SS
LP042FFTF078FF
LP044HHTF082HH
LP045FFTF083SS
LP050FFTF084SS
LP053PPTF086HH
LP054SSTF090SS
LP058HHTF091HH
LP060HHTF092SS
LP061HHTF093SS
LP063HHTF094HH
LP066SSTF095SS
LP069PPTF096HH
LP079HHTF097HH
LP081SS
(S: Singular; F: ‘Fuerte’; H: ‘Hass’; P: ‘Pinkerton’; SH: ‘Shepard’; LH: ‘Lamb Hass’; E: ‘Edranol’).
Disclaimer/Publisher’s Note: The statements, opinions and data contained in all publications are solely those of the individual author(s) and contributor(s) and not of MDPI and/or the editor(s). MDPI and/or the editor(s) disclaim responsibility for any injury to people or property resulting from any ideas, methods, instructions or products referred to in the content.