Article

Assessment of Nutritional Components, Mineral Profiles, and Aroma Compounds in Zanthoxylum armatum Fruit from Different Harvest Times, Tree Age and Fruiting Position

1
Department of Forestry, Faculty of Forestry, Sichuan Agricultural University, Chengdu 611130, China
2
School of Life Science and Engineering, Southwest Jiaotong University, Chengdu 611756, China
3
Sichuan Academy of Forestry, Chengdu 610081, China
4
Forest Ecology and Conservation in the Upper Reaches of the Yangtze River Key Laboratory of Sichuan Province and Mt. Emei Forest Ecosystem National Observation and Research Station, Sichuan Agricultural University, Chengdu 611130, China
*
Authors to whom correspondence should be addressed.
Horticulturae 2025, 11(9), 1028; https://doi.org/10.3390/horticulturae11091028
Submission received: 5 July 2025 / Revised: 12 August 2025 / Accepted: 27 August 2025 / Published: 1 September 2025

Abstract

Zanthoxylum armatum DC. (Z. armatum) is a versatile plant species valued for its aroma oil and nutritional components. However, the variability of chemical composition in Z. armatum fruits in the field remains largely unknown, and it is still unclear how harvest parameters affect the aroma and nutritional quality of the fruits. To address this gap, Z. armatum fruits from varying harvest times, tree ages, and fruiting positions were analyzed for physicochemical properties, nutrients, minerals, aroma profiles, and antioxidant activity. A quality assessment method was developed based on key Z. armatum fruit parameters. Results showed significant differences in the size, weight, total phenol, flavonoid and sanshool content of Z. armatum fruit from different harvest parameters. Z. armatum fruits contained abundant minerals, showing diverse harvest-condition variations. In vitro antioxidant assays showed higher ABTS/DPPH scavenging activity and reducing capacity (23–54 mg/g). HS-SPME-GC-MS identified 64 aroma compounds, encompassing terpenes, alcohols, etc. Linalool was the predominant constituent (46.65%). PLS-DA and Volcano plot analyses highlighted significant differences in VOCs among harvest times and tree ages, while fruit positions showed minimal impact. The Mantel test identified aroma-active compounds associated with antioxidant activity. These findings facilitate a science-based harvesting strategy to standardize Z. armatum fruit quality and marketability.

Graphical Abstract

1. Introduction

Zanthoxylum armatum DC. (Z. armatum) is widely cultivated in marginal lands and valued for its unique numbing-spicy flavor (‘ma’), aroma compounds, and economic applications in essential oil production and cuisine [1,2,3]. Its commercial value has led to extensive cultivation in China, with an annual planting area exceeding 750,000 hm2 [4,5,6]. Due to the large planting area of Z. armatum, the harvest time varies among different growers, even in the same production area. The excellent nutritional and aroma quality, as well as the high content of natural active substances, enhance the uniqueness and competitiveness of Z. armatum immature fruits in the commercial market, and influence consumers’ purchasing preferences. Many researchers have confirmed that the chemical composition of Z. armatum fruit varies with different varieties and production areas, including volatile oil, hemp flavor, polyphenols, flavonoids, proteins, amino acids, mineral elements, antioxidant active substances, etc. [7,8]. Moreover, the fresh immature Z. armatum fruits are often harvested at different developmental stages according to the consumer’s requirement and further processed to the corresponding products. The quality of fruit varies depending on harvest parameters, including harvest times, cultivation methods, and growing environments, etc., representing significant differences in nutritional and aroma compounds of Z. armatum fruits [7]. Therefore, it is crucial to understand the differences in the physical properties, nutritional and aroma compounds of Z. armatum fruit by establishing a comprehensive quality assessment model as an essential strategy to maximize the quality of this unique spice.
The aroma and nutritional value of fruits are factors critical to consumer acceptance and the success of these products. Nutrient profile, including phenolic compounds, flavonoids, carbohydrates, minerals, and amino acids, impacts food flavor, shelf life, marketability, and health benefits [9,10]. Aroma, another key sensory attribute affecting flavor, is significantly influenced by multiple factors, including cultivar and developmental stage. The instability of volatile organic compounds (VOCs), along with variations in harvest time, geographical origin, and cultivars, contributes to the flavor variations in Z. armatum. GC-MS is a standard method for VOC profiling in food, including Z. armatum [7,11]. For instance, Liu et al. developed a flavor quality model for Z. armatum, demonstrating that flavor compounds can be used to evaluate food quality and identify food origin [4]. Feng et al. identified six positively correlated modules and 32 hub VOCs were finally by weighted correlation network analysis among five growth stages of Zanthoxylum bungeanum [12]. During the entire harvest period of Z. armatum, studies have found that the types and contents of aroma profiles in the fruits of Z. armatum among different harvest parameters vary greatly, which in turn leads to significant differences in flavor [13]. It was discovered that the fruits of Z. armatum harvested later have a more intense numbing and fragrant taste. Collectively, fruits exhibit distinct sensory characteristics under varying harvesting conditions. Additionally, VOCs, such as terpenes, exhibit notable antioxidant properties [14]. A higher content of terpenes can significantly affect fruit flavor and quality [15]. A correlation analysis between terpenes and antioxidant activity can facilitate the screening of aroma-active compounds. Among the reported literature, nevertheless, much research has mainly focused on the aroma characteristics of Z. armatum within different producing origins, varieties and tissue parts, as well as the effects of the product processing (e.g., drying) on aroma changes [8,16]. Therefore, how to explore the aroma and nutrient changes of Z. armatum comprehensively would be highly significant for the scientific harvesting of different Z. armatum products, meeting the requirements of the market (or the consumer), and ensuring optimal edible efficacy with bioactive compound preservation.
Harvest parameters, including harvest times, tree ages, and fruiting positions, are recognized as prevalent factors influencing the nutrient and aroma profiles in fruits [17,18]. Judging the maturity, and knowing the internal characteristics and proper parameters and stages of harvesting of horticultural commodities not only retains the internal quality of fruits, but also leads to reduced postharvest losses [19]. For instance, during harvesting, Z. armatum fruit quality indicators continue to undergo significant changes [12]. Fruit trees exhibit intense competition between vegetative and reproductive growth. Young branches prioritize vegetative growth over fruiting, while old branches suffer from declining physiological functions that impair photosynthate supply to developing fruits [20], which ultimately leads to quality variations in fruit from trees of different ages. In addition, the fruit quality also varies significantly among different fruiting positions [17]. Previous studies have demonstrated that VOC profiles vary significantly with developmental stages across different fruit species, including Citrus limon (monoterpene/sesquiterpene ratios) [21], strawberry (ester/alcohol accumulation) [22], and Malus domestica (VOC dynamics) [23], highlighting that fruits exhibit distinct sensory characteristics under varying harvesting conditions. Additionally, VOCs, such as terpenes, exhibit notable antioxidant properties [14]. A higher content of terpenes can significantly affect fruit flavor and quality [15]. These reports indicate that harvest parameters significantly influence fruit quality.
Despite exhibiting exceptional adaptability to diverse growing conditions and holding multifaceted utility, Z. armatum has received inadequate research attention regarding the influence of harvest parameters on its fruit’s chemical composition and antioxidant capacity. Herein, this study systematically evaluates the effects of harvest time (10, 20, and 30 July), fruiting position (top, middle, and bottom), and tree age (3- vs. 5-year-old plants) on phytochemicals, mineral content, VOCs, and antioxidant capacity in Z. armatum. The correlations among these parameters are analyzed using a Partial Least Squares Discriminant Analysis (PLS-DA) model and a Mantel test. The primary objectives of this study are to assess the quality and flavor characteristics of Z. armatum fruits under varying harvest parameters, establish a robust quality evaluation model, and determine the optimal harvest parameter combinations. The insights gained will contribute to the classification and quality assessment of Z. armatum fruits, providing a scientific basis for product development and the selection of raw materials for functional component extraction. These findings will offer comprehensive insights into the factors affecting Z. armatum fruit quality, guiding optimized cultivation and harvest strategies for applications in the food and industrial sectors.

2. Materials and Methods

2.1. Study Site

The study site is located at Jingshan Village, Yongan Town, Shuangliu District, Chengdu, China at latitude 30°36′59.54″ N, longitude 104°00′41.14″ E and altitude 411–425 m. The area has a subtropical monsoon climate with an average annual temperature of 13.3 °C, an average annual precipitation of 985.1 mm, mostly falling in summer, and with an average relative humidity of 81%. The site soils are Humic Umbrisols with a pH of 5.5–6.0, and they are of a sandy–loam texture.

2.2. Plant Material and Fruit Collection

The experimental site was farmland before it was transformed into a tree nursery in March 2021. Z. armatum seedlings with average height of 13.34 cm and stem diameter of 0.27 cm, respectively, were obtained from Danling, Sichuan, China, which is an officially certified superior cultivar (Registration No. Chuan S-SV-ZA-001-2014) of Zanthoxylum armatum ‘Tengjiao’ in Sichuan Province. These seedlings were planted in 3 m × 3 m plots, watered and fertilized, as needed. Fungicides and insecticides were applied to prevent diseases and insect damage. Weeds were periodically cleared throughout the growing season. The selected plants were robust, had normal leaf color, and were free of pests and diseases. The heights of the plants at three-year-old and five-year-old trees were 200–300 cm, respectively. For each plot, three plants were chosen and pooled to represent a replicate. The Z. armatum fruits used in this study were harvested in Chengdu, Sichuan Province, China, on 10, 20, and 30 July 2023. From 3- and 5-year-old trees, three healthy, pest-free trees with good growth conditions were randomly selected. Each shoot was divided into three sections (top, middle, and bottom) based on fruit cluster positions (Table S1). In total, 18 plant samples were analyzed in triplicate (n = 3) to ensure statistical reliability.

2.3. Determination of Physical Characteristics

The length and width of the spike (the follicles or ripe carpels that contain the seeds), as well as the horizontal and vertical diameters of the fruit, were measured using a vernier caliper with an accuracy of 0.01 mm (Figure S1a). The mass of a single spike, the mass of fruits per spike, and the mass of a single fruit were determined using an electronic balance with an accuracy of 0.001 g. The number of fruits per spike, fruit proportion (fruit mass/spike mass), peel proportion (peel mass/fruit mass), and fruit moisture content were calculated and analyzed.

2.4. Determination of Mineral Elements

Carbon (C) content was measured by the potassium dichromate oxidation. Dried 0.05 g samples were digested with 1.6 mol/L K2Cr2O7 and concentrated 98% H2SO4 at 200 °C for 10 min, followed by titration with 0.8 mol/L FeSO4 using an ortho-phenanthroline indicator. Total nitrogen (N) was determined using the Kjeldahl method [24]. A 0.1 g sample was digested with H2SO4 and catalyst tablets, distilled, and titrated. Total phosphorus (P) was analyzed using molybdenum–antimony spectrophotometry after H2SO4/HClO4 digestion and pH adjustment with NaOH. The concentrations of K, Ca, Mg, and Na were determined using flame atomic absorption spectrometry (AAS, AA-6880), with instrumental parameters set according to the method of Yang et al. (details provided in Table S2) [25]. Trace elements were analyzed by inductively coupled plasma mass spectrometry (ICP-MS, NexION 2000 PerkinElmer Inc., Woodbridge, ON, Canada). The ICP-MS operational conditions followed the method of Yang [25], with an RF power of 1350 W, plasma gas flow rate of 16 L/min, auxiliary gas flow rate of 1.2 L/min, nebulizer gas flow rate of 0.85 L/min, and a nebulizer pump speed of 50.00 rpm. Each measurement consisted of 20 sweeps and 3 replicates. Calibration curves and associated parameters for all elements are summarized in Tables S3 and S4. To prevent instrument overload and ensure accuracy, sample solutions were appropriately diluted to maintain concentrations within the optimal detection range.

2.5. Determination of Protein and Amino Acids

Soluble protein content was determined using the Coomassie Brilliant Blue G-250 method [26]. Samples (0.5 g) were mixed with 4 mL of distilled water, shaken well, and centrifuged at 12,000 r/min for 10 min at 4 °C. The supernatant (50 μL, appropriately diluted) was mixed with 2.5 mL of Coomassie Brilliant Blue G250 solution, incubated for 5–10 min, and absorbance was measured at 595 nm using a UV-1990 spectrophotometer (Shimadzu Corporation, Kyoto, Japan). A standard curve was prepared using Bovine Serum Albumin (BSA) to calculate soluble protein content. For amino acid determination, 0.1 g of fresh sample was homogenized in 1 mL extraction buffer and centrifuged at 12,000 rpm for 10 min at 4 °C. The supernatant was analyzed following the G0415F kit protocol (Grace Biotechnology Co., Ltd., Suzhou, China), where a 40 μL sample was mixed with 560 μL reaction mix and 40 μL Reagent, heated at 100 °C for 15 min, then measured at 570 nm after adding 320 μL ethanol. Amino acid content was calculated using the kit’s standard curve (y = 16.218x − 0.0217, R2 = 0.9993), with appropriate dilution when absorbance exceeded 1.5.

2.6. Determination of Total Polyphenol and Total Flavonoid Contents

Total phenolic content (TPC) was determined using the Folin–Ciocalteu colorimetric method [27]. A 0.5 g sample was ground in liquid nitrogen and extracted with 10 mL of 80% ethanol in a boiling water bath for 30 min. After cooling, the mixture was centrifuged at 5000 r/min for 15 min. A 0.4 mL aliquot of the supernatant was mixed with 0.4 mL of Folin–Ciocalteu reagent and allowed to stand for 5 min. Then, 1.2 mL of 7.5% Na2CO3 solution was added, and the mixture was kept in the dark at room temperature for 2 h. Absorbance was measured at 765 nm, and the content was calculated using the gallic acid standard curve.
For total flavonoid content (TFC) determination, the AlCl3 colorimetric method was employed [28]. A 0.3 g dried sample was extracted three times with 10 mL of 60% ethanol at 65 °C. The combined supernatants were centrifuged at 4000 r/min for 10 min and diluted to 50 mL. A 1 mL aliquot was mixed with 60% ethanol to a final volume of 5 mL, followed by the addition of 0.3 mL of 5% sodium nitrite. After 6 min, 0.3 mL of 10% aluminum chloride was added, and the mixture was allowed to react for another 6 min. Subsequently, 4 mL of 1 mol/L NaOH and 0.4 mL of distilled water were added. After 20 min, absorbance at 510 nm was measured, and the flavonoid content was calculated using a rutin standard curve.

2.7. Determination of Total Carbohydrates

The carbohydrate content was determined using the anthrone method [29]. Briefly, a 100 mg sample was boiled with 15 mL of 6 mol/L HCl for 30 min. The solution was adjusted to pH 7.0 using 6 mol/L NaOH, with phenolphthalein as the indicator, and filtered into a 100 mL volumetric flask. The volume was adjusted to the mark with deionized water. A 1 mL aliquot of the solution was mixed with 4 mL of anthrone reagent, boiled for 10 min, and the absorbance was measured at 620 nm. Data were calculated using a D-glucose standard curve and expressed as mg/g dry weight.

2.8. Determination of Sanshool

The sanshool content was determined following the method of Chen et al. [30]. A 0.15 g dried sample was weighed and placed in a conical flask. After adding 40 mL of absolute ethanol, the mixture was ultrasonically extracted at 500 Hz for 15 min, cooled, and transferred to a 50 mL volumetric flask, which was then brought to volume. The solution was shaken, centrifuged at 4500 r/min for 5 min, and 0.1 mL of the supernatant was diluted to 10 mL with absolute ethanol. The absorbance of the solution was measured at 268 nm using a spectrophotometer. A standard curve of hydroxy-α-sanshool was used to determine its concentration in the test solution, and the content of pungent substances (calculated as hydroxy-α-sanshool) was derived.

2.9. Determination of Volatile Organic Compounds

The VOCs were extracted using the headspace solid-phase microextraction (HS-SPME) technique. The GC-MS-QP2020NX from Shimadzu Corp., Kyoto, Japan, was equipped with an DB-WAX GC column (the stationary phase is polyethylene glycol, 0.25 μm film thickness, 60 m in length × 0.25 mm in internal diameter). The methodological approach followed established protocols [31], where 0.3 g of dried sample was placed in a 20 mL headspace vial. A PDMS/CAR/DVB SPME fiber (2 cm, 30/50 µm; Supelco, Bellefonte, PA, USA) was inserted, with the fiber extended for VOC absorption. The extraction proceeded for 10 min at a constant 60 °C water bath temperature. Following absorption, the SPME fiber was transferred to the GC injector and maintained at 250 °C for 5 min to ensure complete VOC desorption. The VOCs were separated utilizing ultra-high-purity helium at a flow rate of 1 mL/min.
GC-MS analysis was performed according to the established method of Feng et al. [31]. In brief, the initial temperature was set at 50 °C (held for 5 min), then increased to 80 °C at a rate of 5 °C/min (held for 3 min), further increased to 110 °C at a rate of 5 °C/min (held for 3 min), and continuously raised to 140 °C at 5 °C/min (held for 3 min), to 170 °C at 5 °C/min (held for 3 min), to 200 °C at 5 °C/min (held for 3 min), and finally to 230 °C at 5 °C/min (held for 3 min). The temperatures of the ion source, quadrupole, and transfer line were set at 240 °C, 250 °C, and 150 °C, respectively. The MS scan was performed using electron impact ionization at 70 eV, with a mass range of 35–450 m/z in full scan mode. VOCs were identified by comparing mass spectra with the NIST 2020 reference library (Version 2.3, National Institute of Standards and Technology, Gaithersburg, MD, USA). Compounds with a similarity index exceeding 85% were classified as VOCs. The relative abundance of volatile compounds was determined based on normalized peak areas obtained from GC-MS chromatograms, representing semi-quantitative comparisons across samples.

2.10. Assay of ABTS Radical Scavenging Activity

ABTS radical scavenging activity was determined according to the method of Hu et al. [6]. ABTS radical solution (1 mL, dissolved in 60% ethanol solution (V/V)) was mixed with 1 mL of potassium persulfate (K2S2O8) solution in a brown tube and incubated in the dark for 12 h. The mixture was diluted 30–60 times to prepare the ABTS+ working solution (OD734nm ≈ 0.7). A 0.8 mL aliquot of the ABTS+ working solution was mixed with 0.2 mL of the sample solution, shaken, and allowed to react for 6 min. Absorbance was measured at 734 nm. For the control, 0.2 mL of deionized water was used, and the spectrophotometer was zero-adjusted with deionized water.

2.11. Assay of DPPH Radical Scavenging Activity

DPPH radical scavenging activity was determined following the methodology used by Hu et al. [6]. DPPH solution (prepared at a concentration of 0.2 mM by dissolving in absolute ethanol) was mixed with 1 mL of 50 mM TRIS-HCl buffer (pH 7.4) in a 5-mL brown centrifuge tube, and the absorbance (A0) was measured at 517 nm. For the sample, 2 mL of DPPH solution was mixed with 100 μL of the sample solution and 1 mL of TRIS-HCl buffer, incubated in the dark for 30 min, and absorbance was measured at 517 nm.

2.12. Assay of Reducing Capacity

Reducing capacity assay was determined using the procedures in Hu et al. [6]. A 2 mL sample was mixed with 2 mL of 1% potassium ferricyanide and 2 mL of 0.2 M phosphate buffer (pH 6.6) in a 5-mL centrifuge tube. The mixture was heated at 50 °C for 20 min, rapidly cooled in an ice bath for 10 min, and then mixed with 2 mL of 10% trichloroacetic acid (TCA). After centrifugation for 10 min, 1.5 mL of the supernatant was mixed with 0.3 mL of 0.1% ferric chloride solution, allowed to react for 10 min, and absorbance was measured at 700 nm. Higher absorbance values indicate stronger reducing capacity.

2.13. Statistical Analysis

All data were performed in triplicate. One-way analysis of variance (ANOVA) and Duncan’s test (α = 0.05) were used to assess significant differences among samples under the same factor, evaluate the effects of nutrients and elements on fruit quality, and analyze relationships among sample groups. A PLS-DA model was established to identify key volatile compounds using GC-MS relative abundance data that were preprocessed by mean-centering followed by unit variance scaling (dividing each variable by its standard deviation) to normalize the contribution of individual volatile compounds. Pearson correlation coefficients were calculated using R-language for Mantel test correlation analysis to examine relationships among measured indicators. Multivariate analysis of variance (MANOVA) was applied to study the effects of influencing factors on the measured indicators. Data were processed using Excel 2010 and SPSS 20.0, and figures were generated using Origin 2021 and R-language (version 4.2.1).

3. Results and Discussion

3.1. Physical Characteristics

As shown in Figure S1, the basic morphological characteristics of Z. armatum fruits, including spike length varying from 44.79 to 108.51 mm, spike width ranging from 26.55 to 67.78 mm, single spike mass fluctuating between 1.79 and 8.02 g, fruit mass of single spike from 1.621 to 7.25 g, fruit horizontal diameter between 4.35 and 6.13 mm, fruit vertical diameter from 4.71 to 6.45 mm, and single fruit mass of nearly 0.09 g, were significantly different (p < 0.01) in relation to harvest times, tree ages and fruit positions (Figure S1b–d,f–i). With rising harvest time, the horizontal diameter, vertical diameter and single fruit mass of the Z. armatum fruits increased, a trend also seen in other plants like Actinidia deliciosa and Punica granatum [32,33]. Tree age also significantly affected the morphological indicators of Z. armatum fruits. Spike length, spike width, single spike mass, fruit horizontal diameter and single fruit mass significantly changed (p < 0.01) (Figure S1b–d,f,h) and generally increased with increasing tree age. There were significant disparities (p < 0.01) in spike length, spike width, single spike mass and number of fruits of single fruited panicle among the Z. armatum fruits at different fruiting positions (Figure S1d,e,i). Similar results were observed in Solanum lycopersicum L. [34], which indicated that limited sunlight in the deep canopy leads to delayed ripening [17]. Fruit proportion, fruit moisture content and peel proportion across different harvest times, tree ages, and fruit positions are shown in Figure S1j–l. Differences in these parameters across harvest times and fruit positions were not significant (p > 0.05), but differences among fruits of different tree age were clearly evident (p < 0.01).

3.2. Nutrient Profiles

As shown in Figure 1, the contents of TPC, TFC, total carbohydrates, soluble proteins, amino acids and sanshools were measured. TPC and TFC ranged from 49.98 to 66.11 mg/g and 10.75 to 17.39 mg/g, respectively, which were closely related to antioxidant activity [35]. Phenols have particularly powerful effects on the cognitive abilities of mammals and may reverse age-related declines in memory and learning abilities [36]. The protein content was between 1.04 and 1.26 mg/g, and it has been acknowledged that dietary proteins, via bioactive peptides, exert functions in diverse dimensions of human health [37]. Sanshool is the primary component responsible for the numbness resulting from the consumption of Z. armatum [1], and its content in the fruit is between 70.87 and 198.23 mg/g. The contents of amino acids and total carbohydrates were 0.2–0.25 mg/g and 77.03–92.5 mg/g, respectively. As shown in Figure 1a,b, the levels of TPC and TFC decreased progressively during the fruit ripening process. This pattern was consistent in plums, where phenolic content peaked near the ripening stage and declined post-ripening [38]. Tree age significantly influenced the contents of most substances, with all measured components except total carbohydrates and amino acids showing a significant upward trend (Figure 1c,e, p < 0.01). Fruiting position had no significant effect on these contents (p > 0.05). Total carbohydrates and amino acids remained stable across harvest times, tree ages and fruiting positions (Figure 1c,e, p > 0.05). Protein content varied significantly with harvest time and tree age (p < 0.01), but only exhibited a significant increase at the bottom fruiting position (Figure 1c). This is likely due to lower temperature and light levels within the canopy, which reduce metabolic activity and protein demand [17]. The higher levels of protein and amino acids in fruits within the tree canopy may indicate poor storage quality, as these fruits are more susceptible to bacterial and fungal invasion, a phenomenon also observed in potatoes [39]. This can guide harvesting plans in food production based on post-harvest storage requirements. Sanshool exhibited the most pronounced changes between different harvest times. Zhu et al. has shown that sanshool levels in the leaves gradually decreased during Z. armatum fruit maturation, while continuously accumulating in the pericarp, indicating its translocation from leaves to the pericarp [40]. In nearly all Zanthoxylum varieties, sanshool content exhibited a consistent pattern: a rapid increase in June, followed by a slower rise and a slight decline until September, potentially attributable to its inherent instability [41]. Sanshool levels exhibited significant variations among fruits from different tree ages, while fruiting position showed minimal influence (Figure 1f). The subjective selection of the harvest time can effectively modulate the pungent flavor of sanshool in Z. armatum pericarp and accommodate diverse gustatory preferences across different regions and demographic groups. Notably, the phytochemical contents measured in this study consistently increased with tree age, probably regulated by ethylene. Tahir et al. demonstrated that ethylene production varies with tree age, significantly influencing fruit ripening, with young trees typically producing higher ethylene levels than middle-aged trees [42]. However, ethylene application reduces chlorophyll content and downregulates CAB expression in Arabidopsis, indicating its inhibitory effect on photosynthesis in juvenile leaves [43]. This likely explains the significantly lower phytochemical contents in fruits from 3-year-old trees compared to 5-year-old trees. Maximum sanshool accumulation and phytochemical richness occurs during late-stage maturation (late July to early August) in 5-year-old trees, particularly targeting fruits from upper canopy positions. These findings suggest that harvest time and tree age significantly influence the quality of Z. armatum pericarp. This offers new insights for harvesting strategies.

3.3. Mineral Profile

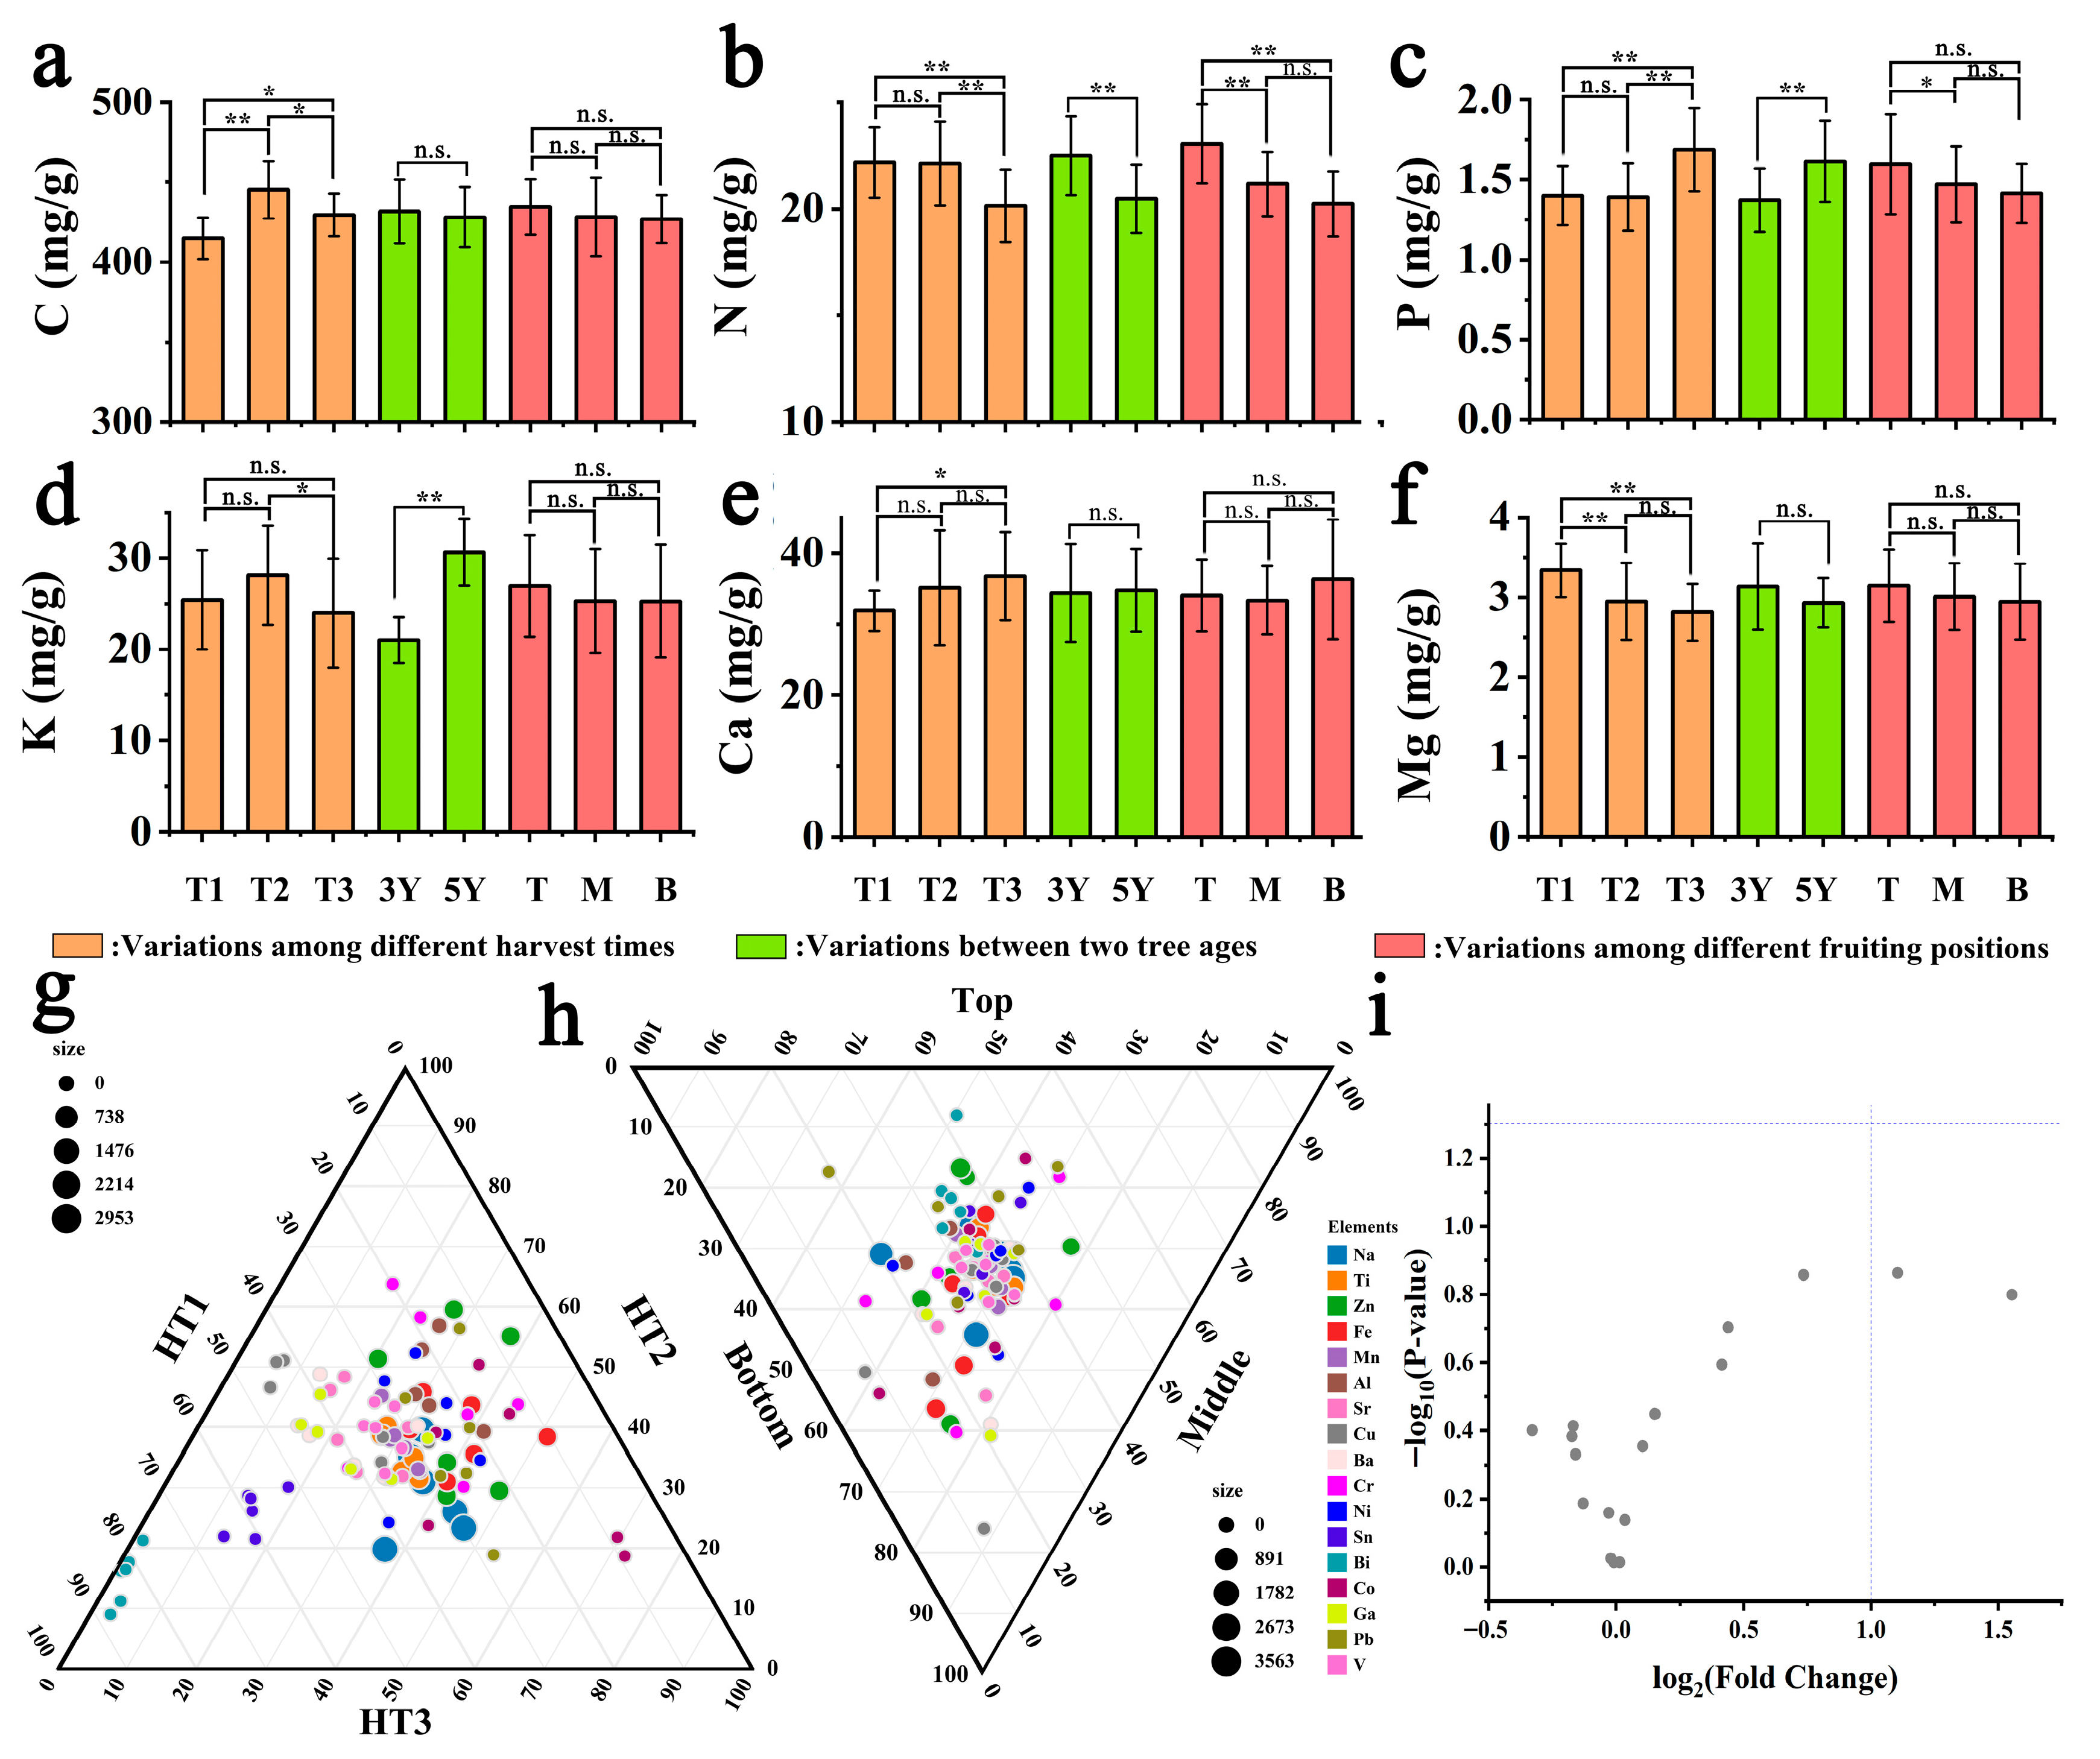
We quantified 25 elements in Z. armatum fruits, encompassing macro elements, trace elements and potentially toxic trace elements (Table S5). Analysis of macronutrients (C, N, P, K, Ca, Mg) across harvest times, tree ages and fruiting positions revealed distinct trends: P and Ca increased during ripening (Figure 2c,e), while N and Mg decreased (Figure 2b,f). Vitamins C and K showed an initial increase followed by a decline (Figure 2a,d), with nearly all changes being statistically significant (p < 0.01). Na, Mg, K and Ca are essential macronutrients for maintaining physiological functions in animals, plants and microorganisms [44], while N, P and K are critical for plant growth and development. Investigating the variations in N, P and K content in fruits across different harvest times, tree ages, and fruiting positions can enhance our understanding of plant growth patterns. In this study, N content significantly decreased at harvest time 3 (HT 3), likely because plants allocated more nitrogen to perennial structures to support new growth in the following spring. A research report on pear trees indicates that roughly 38% of the nitrogen absorbed by plants is retrieved subsequent to autumn [45]. This supports the recommendation of San-Martino et al. for increased spring nitrogen fertilization. San-Martino also noted that P significantly influences N distribution in plants, with a decrease in N content correlating with an increase in P content, aligning with our findings [46]. Across samples from different tree ages, P and K levels rose significantly with tree age (Figure 2c,d), while N content declined markedly. No significant changes were observed for other elements. Previous studies indicate that N, P and K are transported via the xylem [47]. Although leaf xylem sap concentration shows no significant variation with tree age, younger trees show reduced stomatal density and shallower root systems, limiting their capacity to sustain high transpiration-driven sap flow. Senescence in older trees leads to xylem embolism and reduced functional sapwood area, diminishing flow velocity despite similar sap osmolarity [48]. This aligns with our finding that P and K contents increase with tree age. Conversely, N content decreases with tree age, potentially due to enhanced N utilization and assimilation driven by increased P content. Among fruiting positions, N content was significantly higher in the top position (Figure 2b), while other elements showed no significant variation. Higher fruit N content in the top position may be linked to light exposure. Blue light has been shown to maintain nitrate concentration in above-ground parts under limited N supply and enhance nitrate and ammonium uptake [49]. These findings generally explain the variation in N content across fruiting positions. In this study, 19 trace elements were analyzed (Tl and Cd were undetected) and their content variations were examined across harvest times, tree ages and fruiting positions (Figure S2). The contents of Ti, Zn, Mn, Al, Sr, Cu, Cr, Ni and V at HT 2 were significantly higher than those at the other harvest times (Figure 2g). However, there were only minor differences among different tree ages and fruiting positions. No significant differences in trace elements were found between 3-year-old and 5-year-old trees (Figure 2i). There were significant differences in the contents of Fe, Sr and Pb among different fruiting positions (Figure 2h). Trace elements like Cu, Zn, Cr, Mn and Co are essential for diverse physiological functions, including enzyme activity, metabolism, immune function and bone health [50].
The coordinated decline in N/Mg and rise in P/Ca during late maturation (Figure 2b–f) indicated a nutrient reallocation phase where fruits may prioritize structural/defensive compounds over vegetative growth metabolites. This physiological transition window (HT 2) aligns with peak accumulation of Co (vitamin B12 precursor) and Cr (glucose tolerance factor), making it ideal for harvesting functional food ingredients. Early harvest (HT 1) is more suitable for markets requiring higher nitrogen content. These findings provide novel insights for market segmentation of Z. armatum fruits based on quality differentiation.

3.4. Variations in VOCs

As shown in Table 1, 64 VOCs in Z. armatum fruits were identified across different harvest times, tree ages and fruiting positions. The relative contents of each VOC and their odor characteristics are shown in Tables S3 and S4. The TIC profiles of samples under different harvesting parameters are presented in Figure S3. These VOCs included terpenes (n = 27), esters (n = 4), aldehydes (n = 4), ketones (n = 3), alkanes (n = 3), alcohols (n = 20) and others (n = 4). Key volatile compounds, such as linalool, (-)-cis-β-elemene, caryophyllene, cis-β-copaene, 4-thujanol, α-selinene, β-copaene, (-)-γ-cadinene, D-limonene and sabinene, were consistent with previous studies [51,52]. Linalool exhibited the highest relative content, averaging 46.65% across samples, suggesting its critical role in Z. armatum aroma, likely contributing a floral and sweet fragrance [53]. Many of the main volatile substances identified in this study exhibit pharmacological activities. For instance, linalool has anti-inflammatory and analgesic activities [54]. Limonene is characterized by a fresh lemon fragrance, and shows anti-inflammatory, antioxidant, anticancer, antinociceptive and antidiabetic characteristics [55]. To analyze variations in VOCs across harvest times, tree ages and fruiting positions, this study employed a PLS-DA model, a widely used classification method for pattern recognition. PLS-DA combines regression modeling with dimensionality reduction to establish thresholds for discriminating results [56]. Previous studies have used PLS-DA to correlate VOCs measured by HS-SPME-GC-MS with sample categories [57]. Additionally, Volcano plots, commonly used in metabolomics for fold-change analysis and t-tests, were applied to GC-MS data [58]. This method has been utilized for comparative analyses of volatile substances in Passiflora edulis and watermelon [59,60].
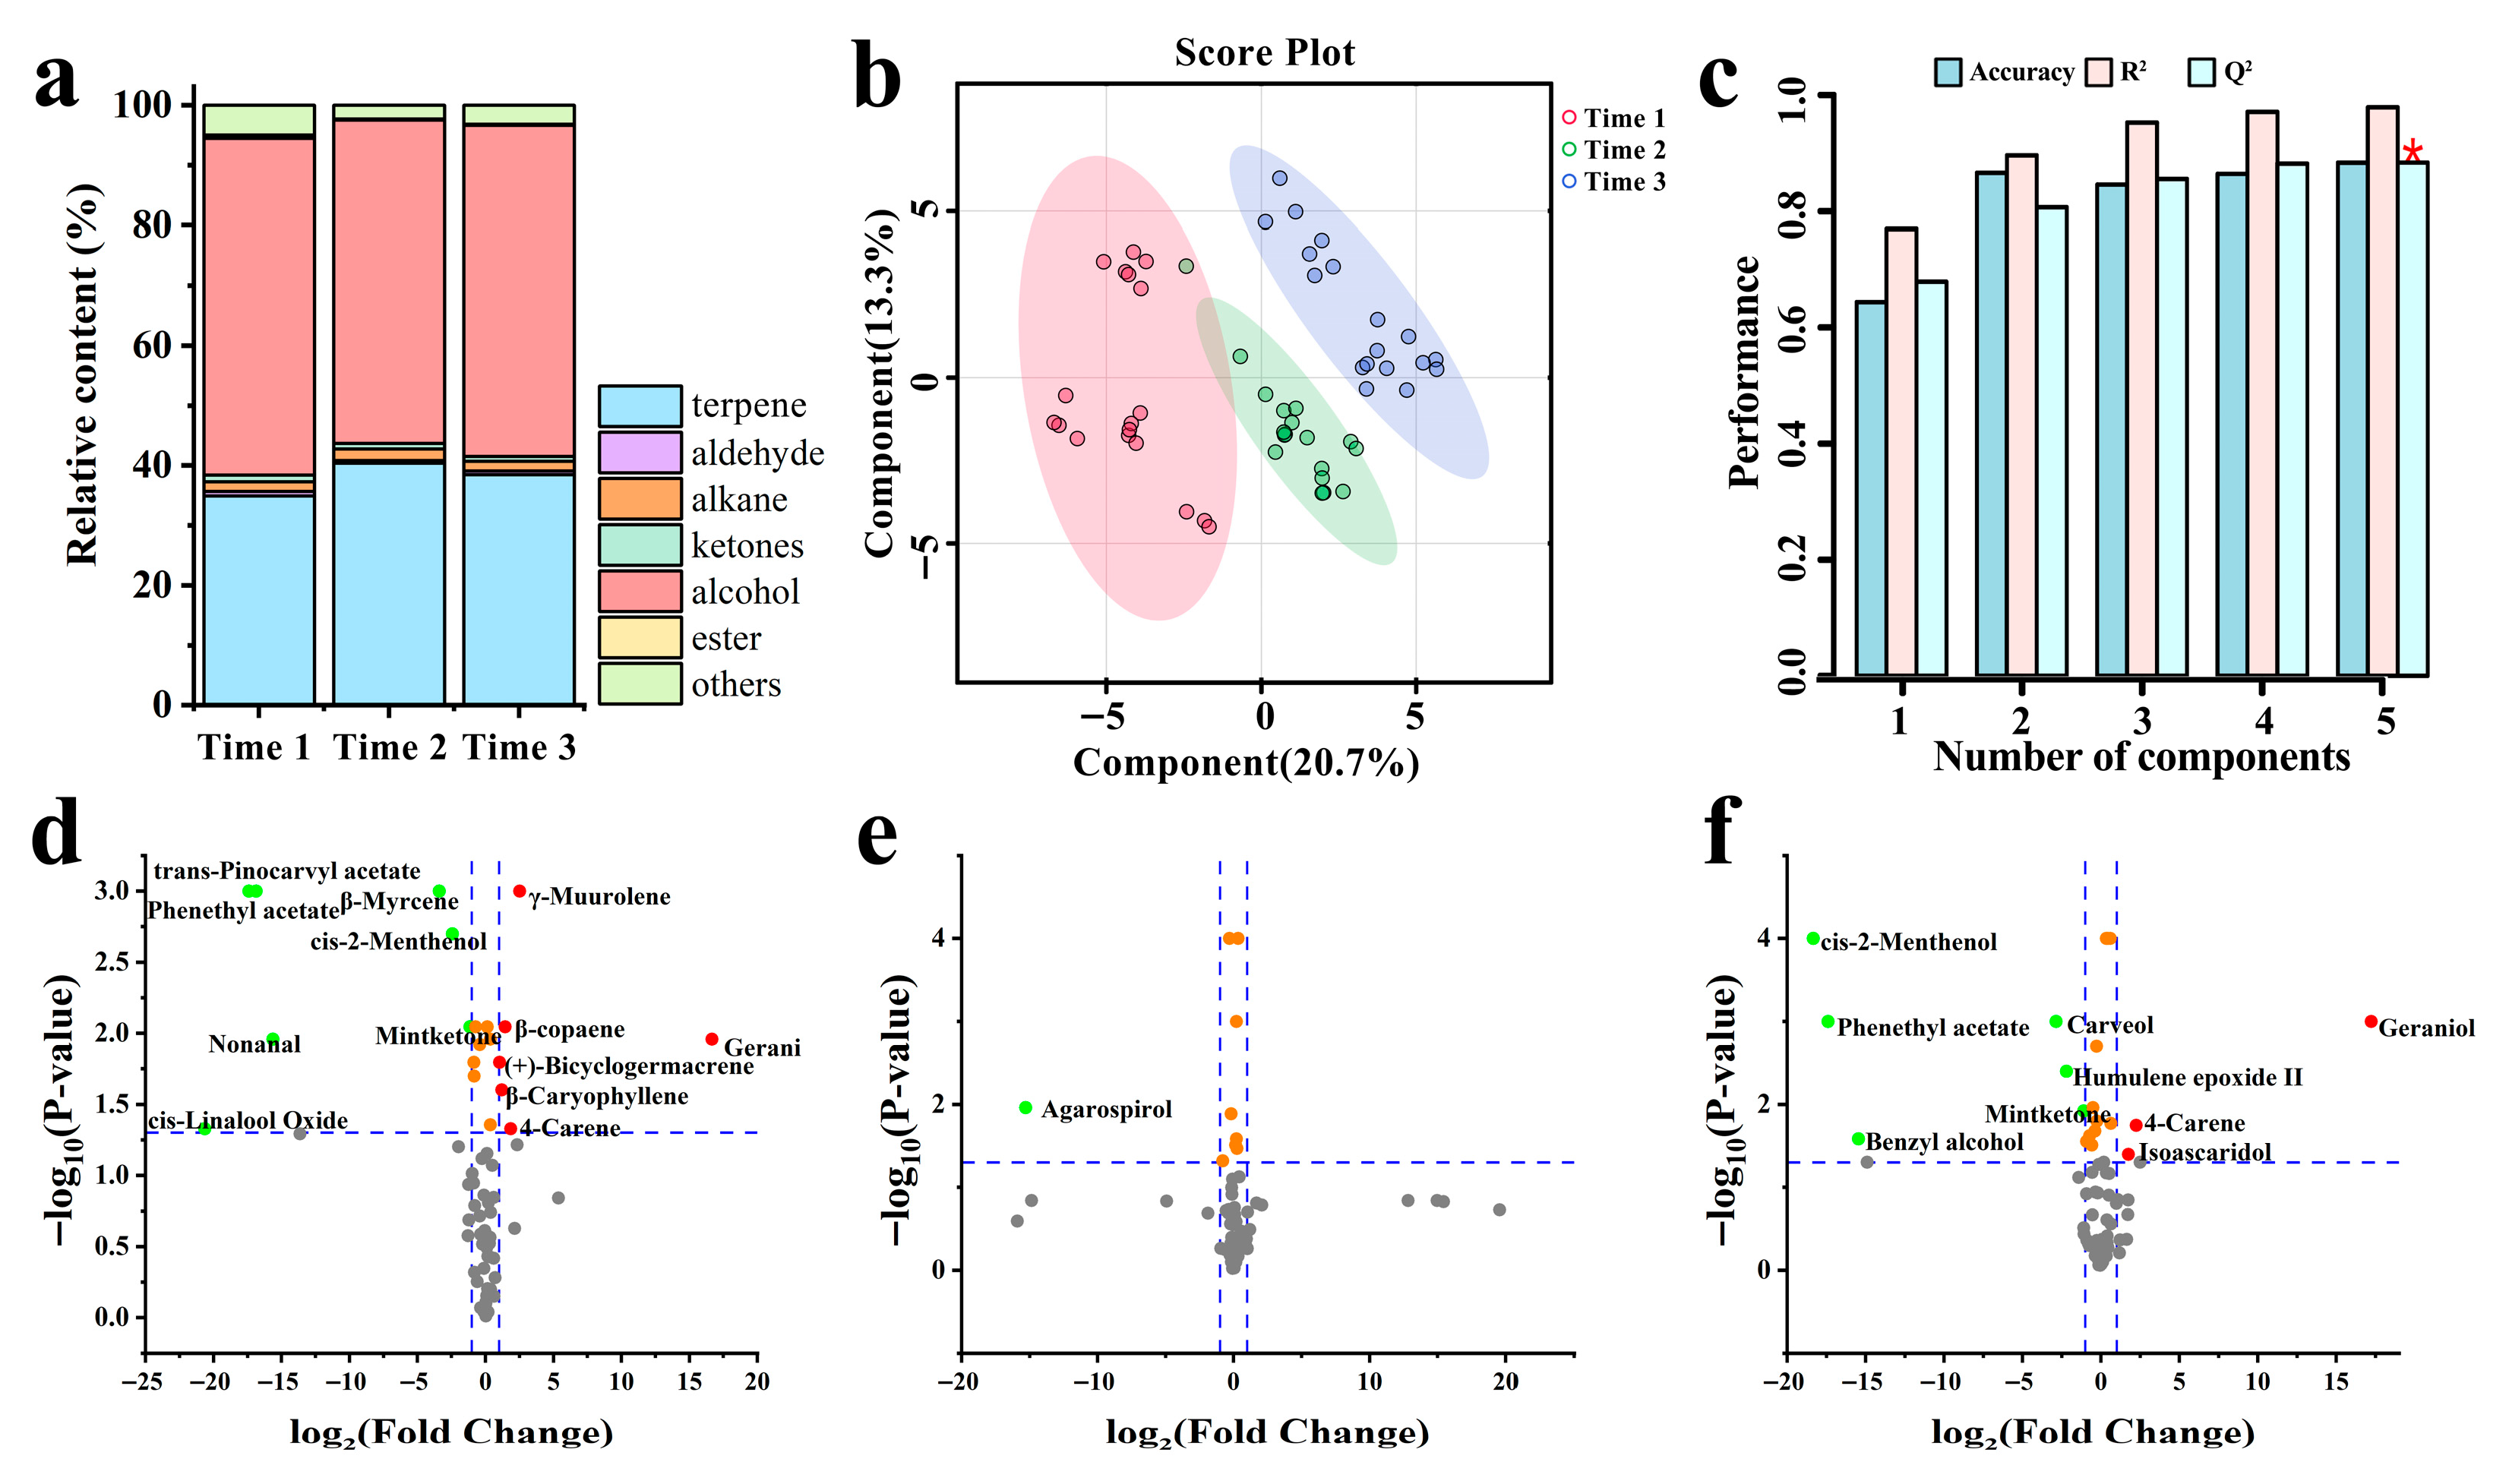
As shown in Figure 3, which depicts the changes in VOCs of different harvest times, terpene concentrations exhibited temporal variation, peaking at HT 2 (highest) and reaching minimum levels at HT 1 (Figure 3a). A PLS-DA model was constructed to analyze VOC differences across the three sampling periods. The score plot (Figure 3b) and cross-validation metrics (R2 = 0.896, Q2 = 0.806, Figure 3c) confirmed the model’s predictive reliability and statistical validity. The score plot revealed clear segregation of HT 3 from HT 1 and HT 2, while HT 1 and HT 2 showed minor similarity. In the PLS-DA model, greater distances between samples indicate more significant differences [52], confirming that VOCs in HT 3 differ markedly from those in HT 1 and HT 2. A Volcano plot was used to compare VOCs in Z. armatum fruits across different harvest times. Comparing HT 1 and HT 2 revealed 13 significantly different VOCs (Figure 3d), with 6 over-enriched in HT 2 and 7 in HT 1. Similarly, 9 differentially abundant VOCs were identified between HT 1 and HT 3 (Figure 3f), with 3 over-enriched in HT 3 and 6 in HT 1. Only 1 differentially abundant VOC was detected between HT 2 and HT 3 (Figure 3e), which was over-enriched in HT 1. This indicates that the aroma compounds tend to stabilize during the transition from HT 2 to HT 3. Notably, compared with HT 1, HT 2 and HT 3 exhibit significant enrichment of phenethyl acetate, mint-ketone, and cis-2-menthenol. In contrast, 4-carene is present in higher concentrations during the HT 1 stage. Based on the olfactory descriptions provided in Table S4, it is suggested that the aromatic profiles of HT 2 and HT 3 may be characterized by floral, rose, sweet, honey, fruity, and tropical notes. Most differential compounds across the three time points were monoterpenes. Notably, in the comparison between HT 1 and HT 2 (Figure 3d), most terpenoids were enriched in HT 2, a result consistent with the findings of Shi et al. [61]. Terpenes are primarily synthesized via the methylerythritol phosphate pathway [62]. For instance, α-pinene, β-myrcene and D-limonene are synthesized from geranyl diphosphate through terpene synthases involving coupled isomerization-cyclization reactions [63]. In this study, the total content of monoterpenes and their derivatives increased during the early development stage of Z. armatum fruits. Oxygenated monoterpenes and terpenes have been identified as key contributors to the aromatic quality of Zanthoxylum species [12,64]. Studies have suggested that monoterpenes play a crucial role in fruit ripening, indicating that the period from HT 1 to HT 2 is critical for Z. armatum fruit maturation [12]. The expression of ZaHMGR1 is low in young fruits but significantly increases during the pre-ripening stage, promoting the biosynthesis of diterpene and monoterpene precursors [13]. This aligns with our finding that terpenes are more enriched in HT 2 compared to HT 1.
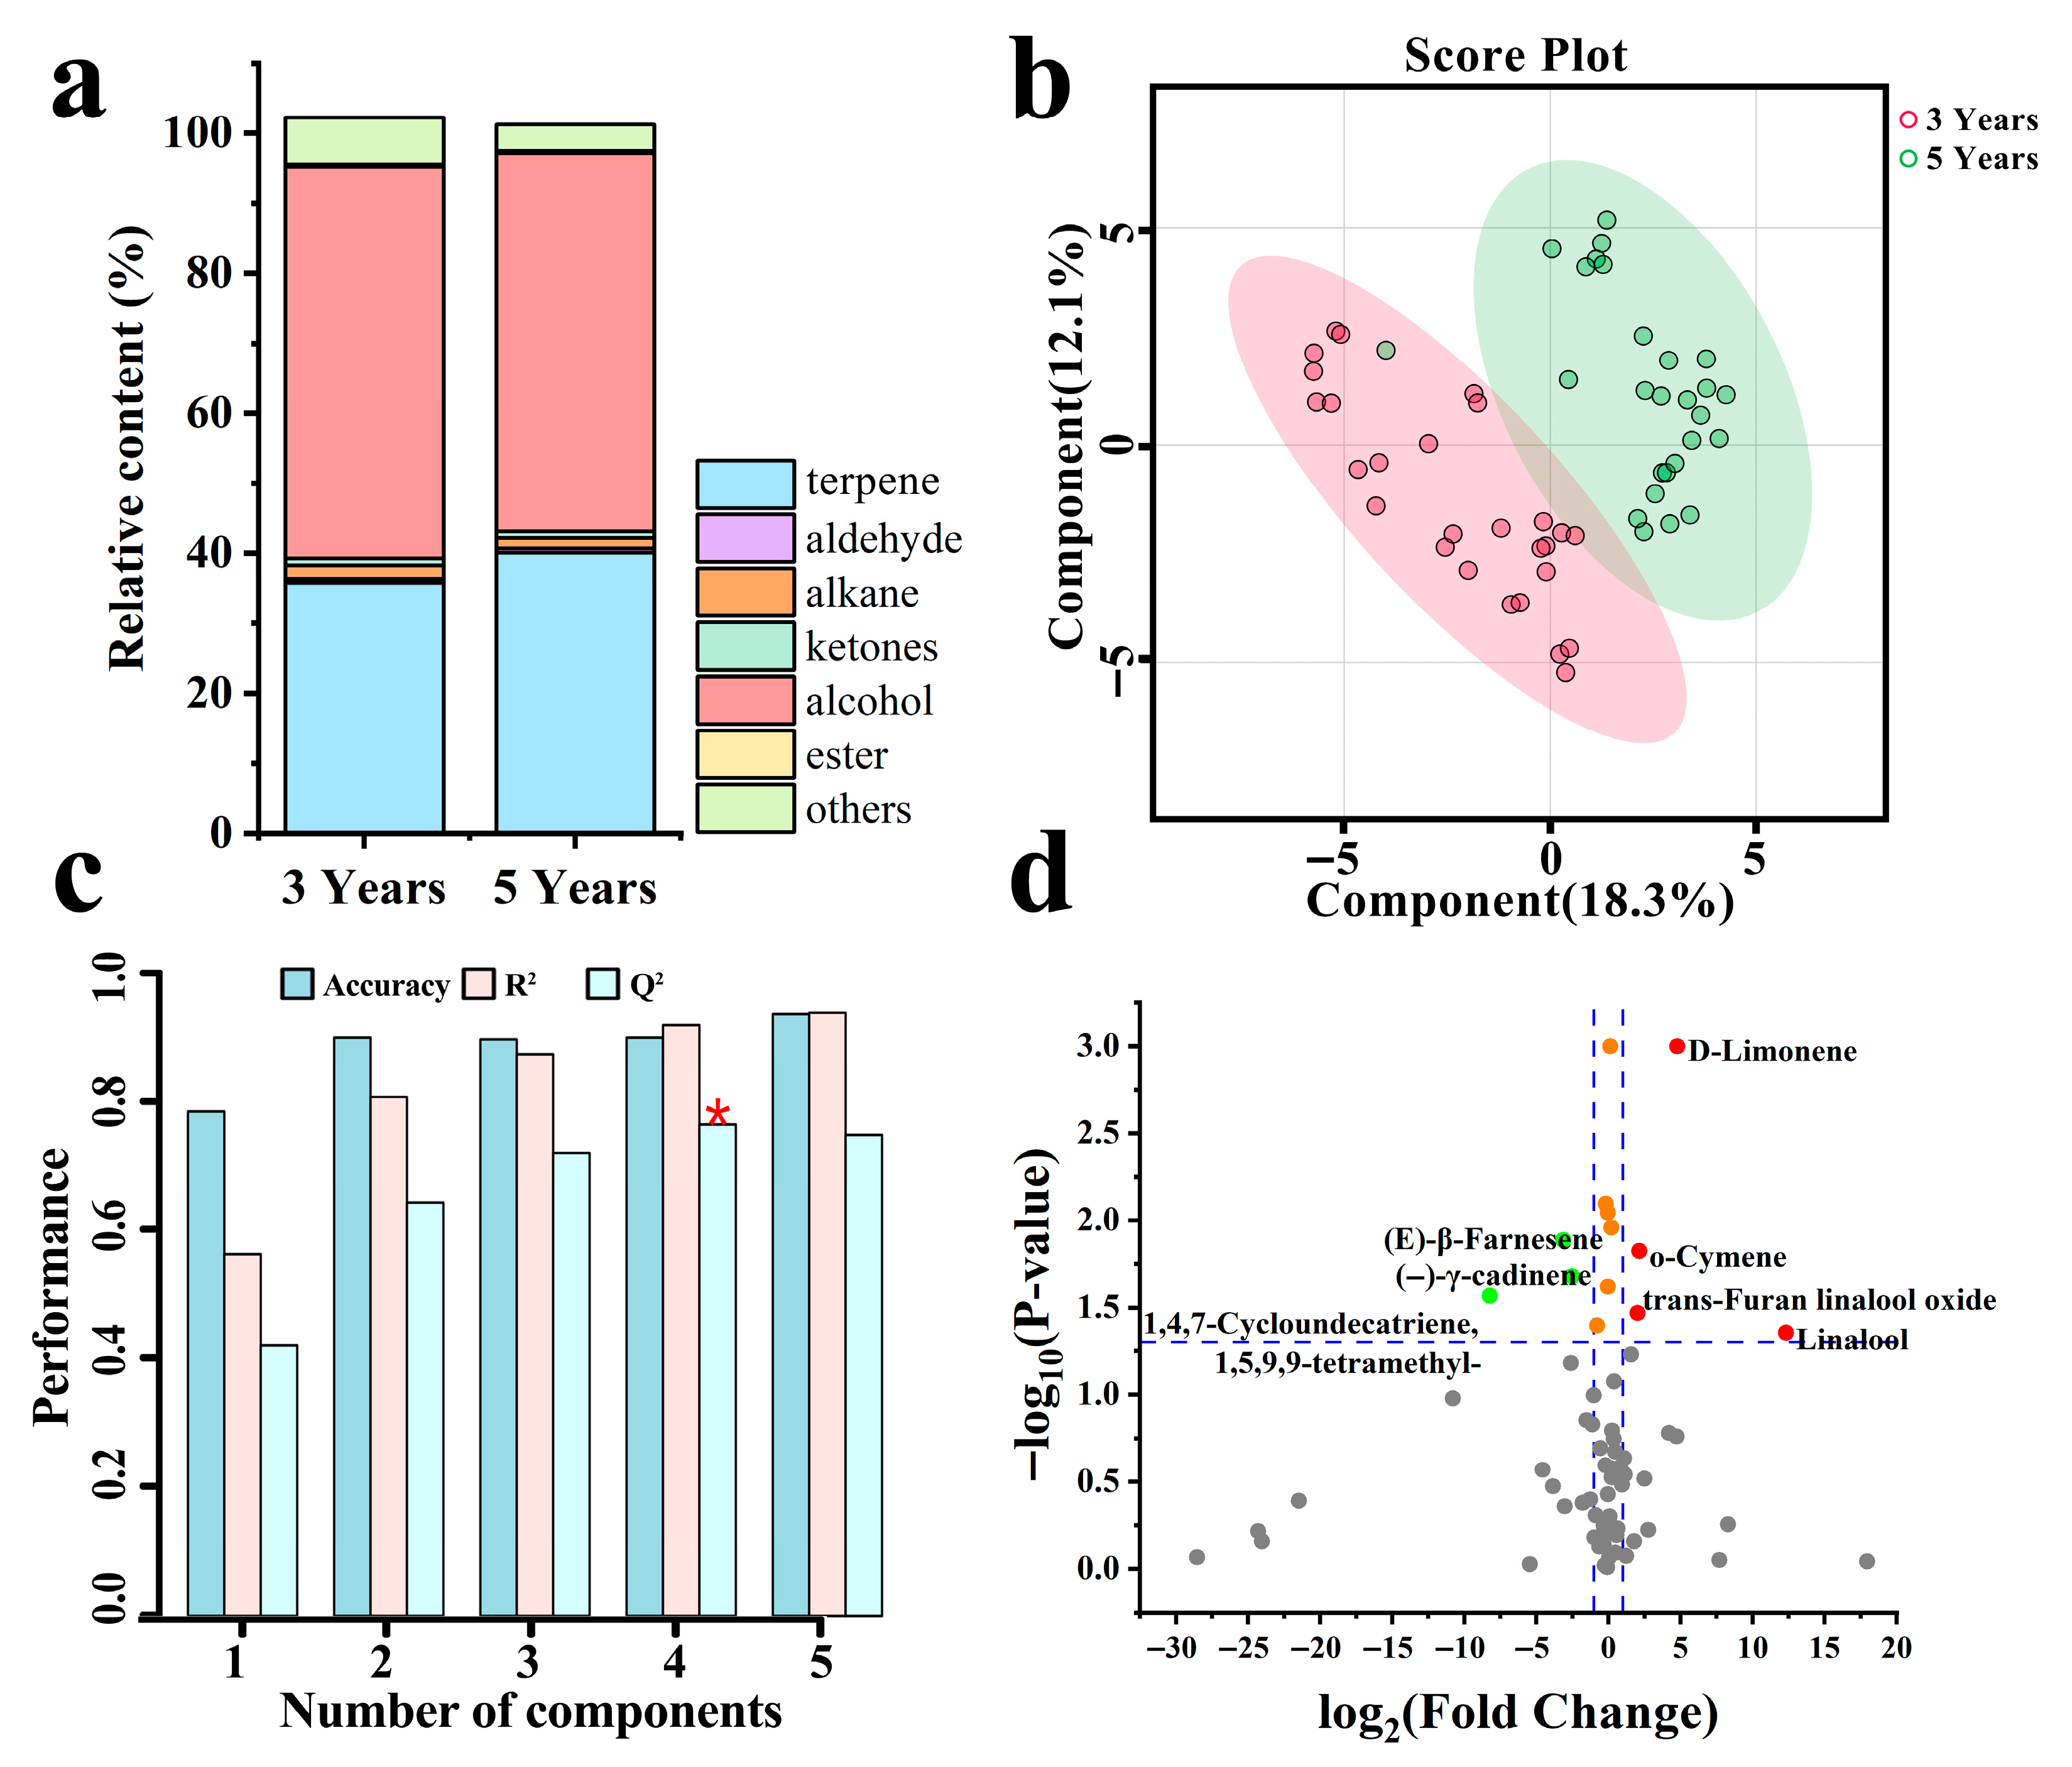
As shown in Figure 4, which depicts the changes in VOCs between different tree ages, 5-year-old fruits exhibited higher terpene content than 3-year-old counterparts (Figure 4a). A PLS-DA model comparing the two age groups demonstrated distinct separation in VOC profiles (Figure 4b), with cross-validation confirming model reliability (R2 = 0.8160, Q2 = 0.6286, Figure 4c). Volcano plot analysis identified seven significantly differential VOCs, including four enriched in 3-year-old peels and three in 5-year-old peels (Figure 4d). Most of these are terpenes. The relative concentrations of D-limonene and linalool were significantly higher (p < 0.05) in 3-year-old trees, and their high relative abundance makes them key biomarkers for this group. Combined with the odor descriptors of D-limonene (orange, fresh) and linalool (sweet, woody), the aroma characteristics of 3-year-old peels can be described as orange, fresh, sweet and woody. With changing tree age, the carotenoid content in fruits generally fluctuates considerably [18,65]. The differences in carotenoid levels across trees of varying ages may indirectly influence terpene profiles, as both classes of compounds share acetyl-CoA as a common precursor for their C5 isoprene building blocks (IPP/DMAPP). Volatile terpenoid compounds (C8-C18) are synthesized through the methylerythritol phosphate (MEP) or mevalonate (MVA) pathways, while carotenoids arise from subsequent condensation of these units [66]. The observed differential volatile compounds between age groups were predominantly terpenes, whose production could be modulated by coordinated metabolic flux with carotenoid biosynthesis.
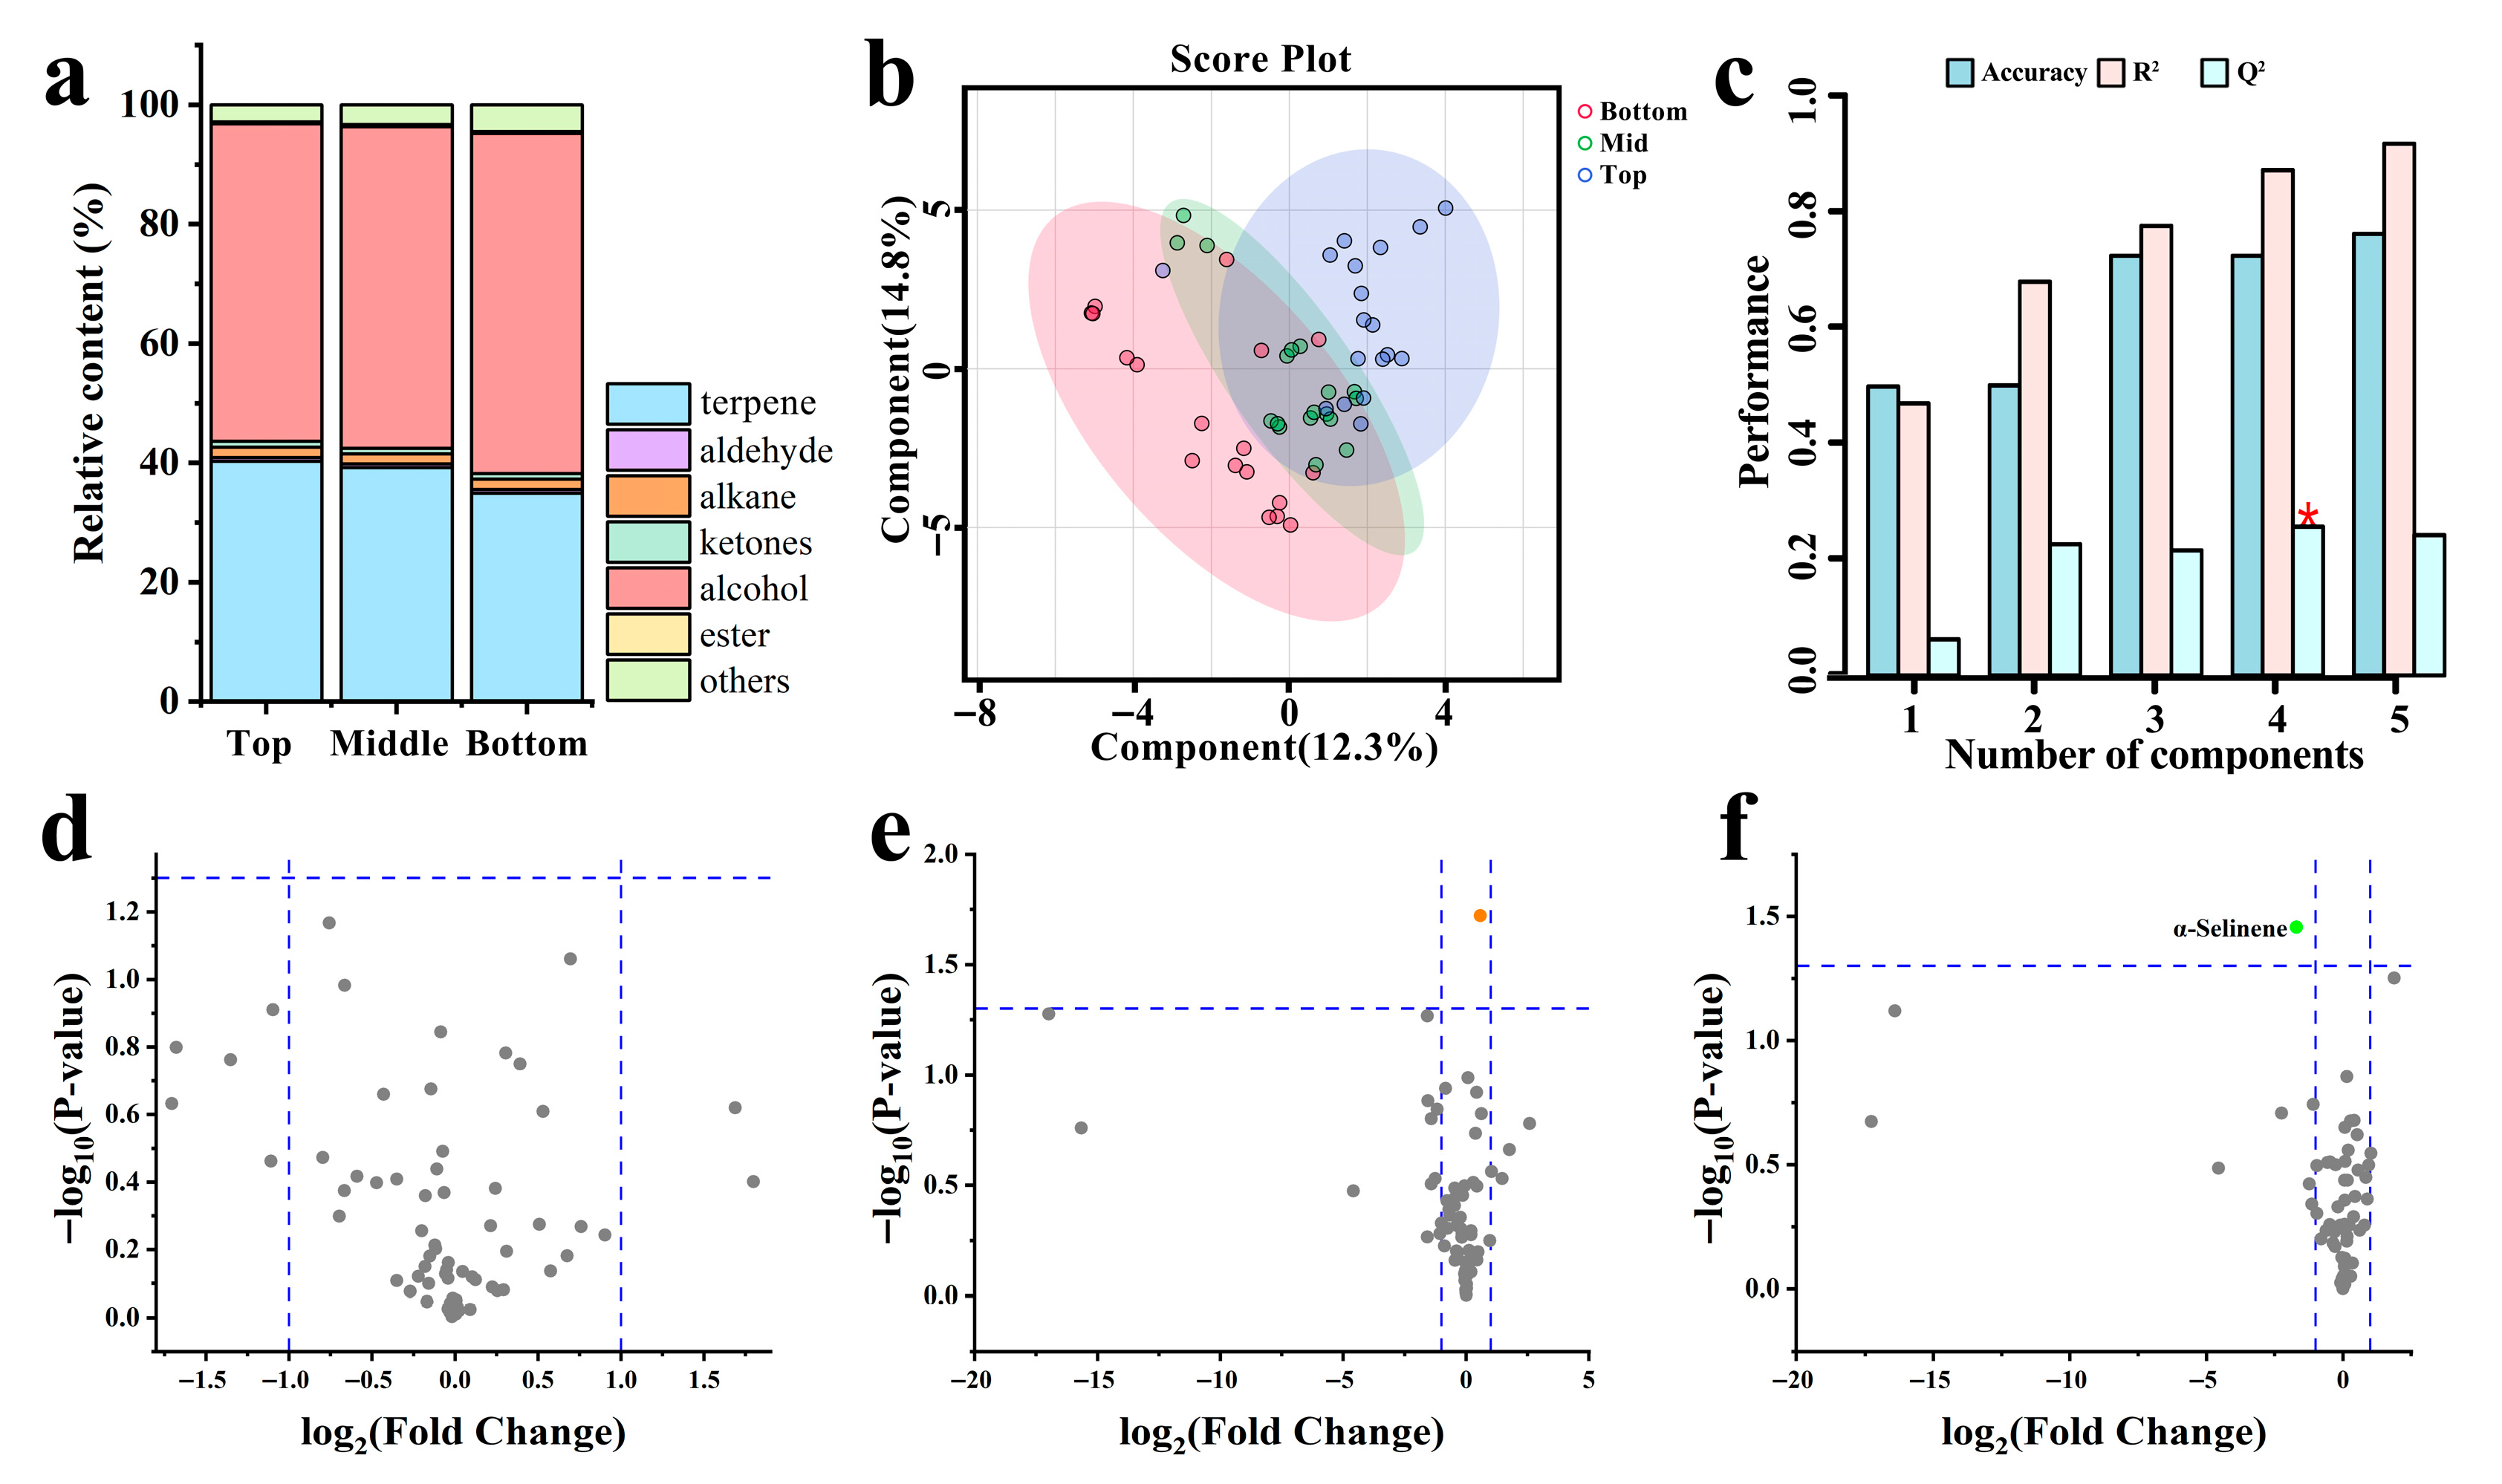
As shown in Figure 5, which depicts the changes in VOCs among different fruiting positions, as the fruiting position changes from the top to the bottom of the shoot, the content of terpene substances gradually decreases (Figure 5a). The PLS-DA score plot of the VOC dataset is shown in Figure 5b, which indicates an obvious similarity in VOCs among the three fruiting positions. Cross-validation results are presented in Figure 5c (R2 = 0.6794, Q2 = 0.3070). In the Volcano plot results, only α-Selinene was found to be more enriched at the Middle position compared to the Bottom position, with no significant substances identified in the Z. armatum fruits at other fruiting positions (Figure 5d–f). This indicates that the volatile components of fruits in different fruiting positions are similar.

3.5. Screening of Dominant-Materials with Key Activity

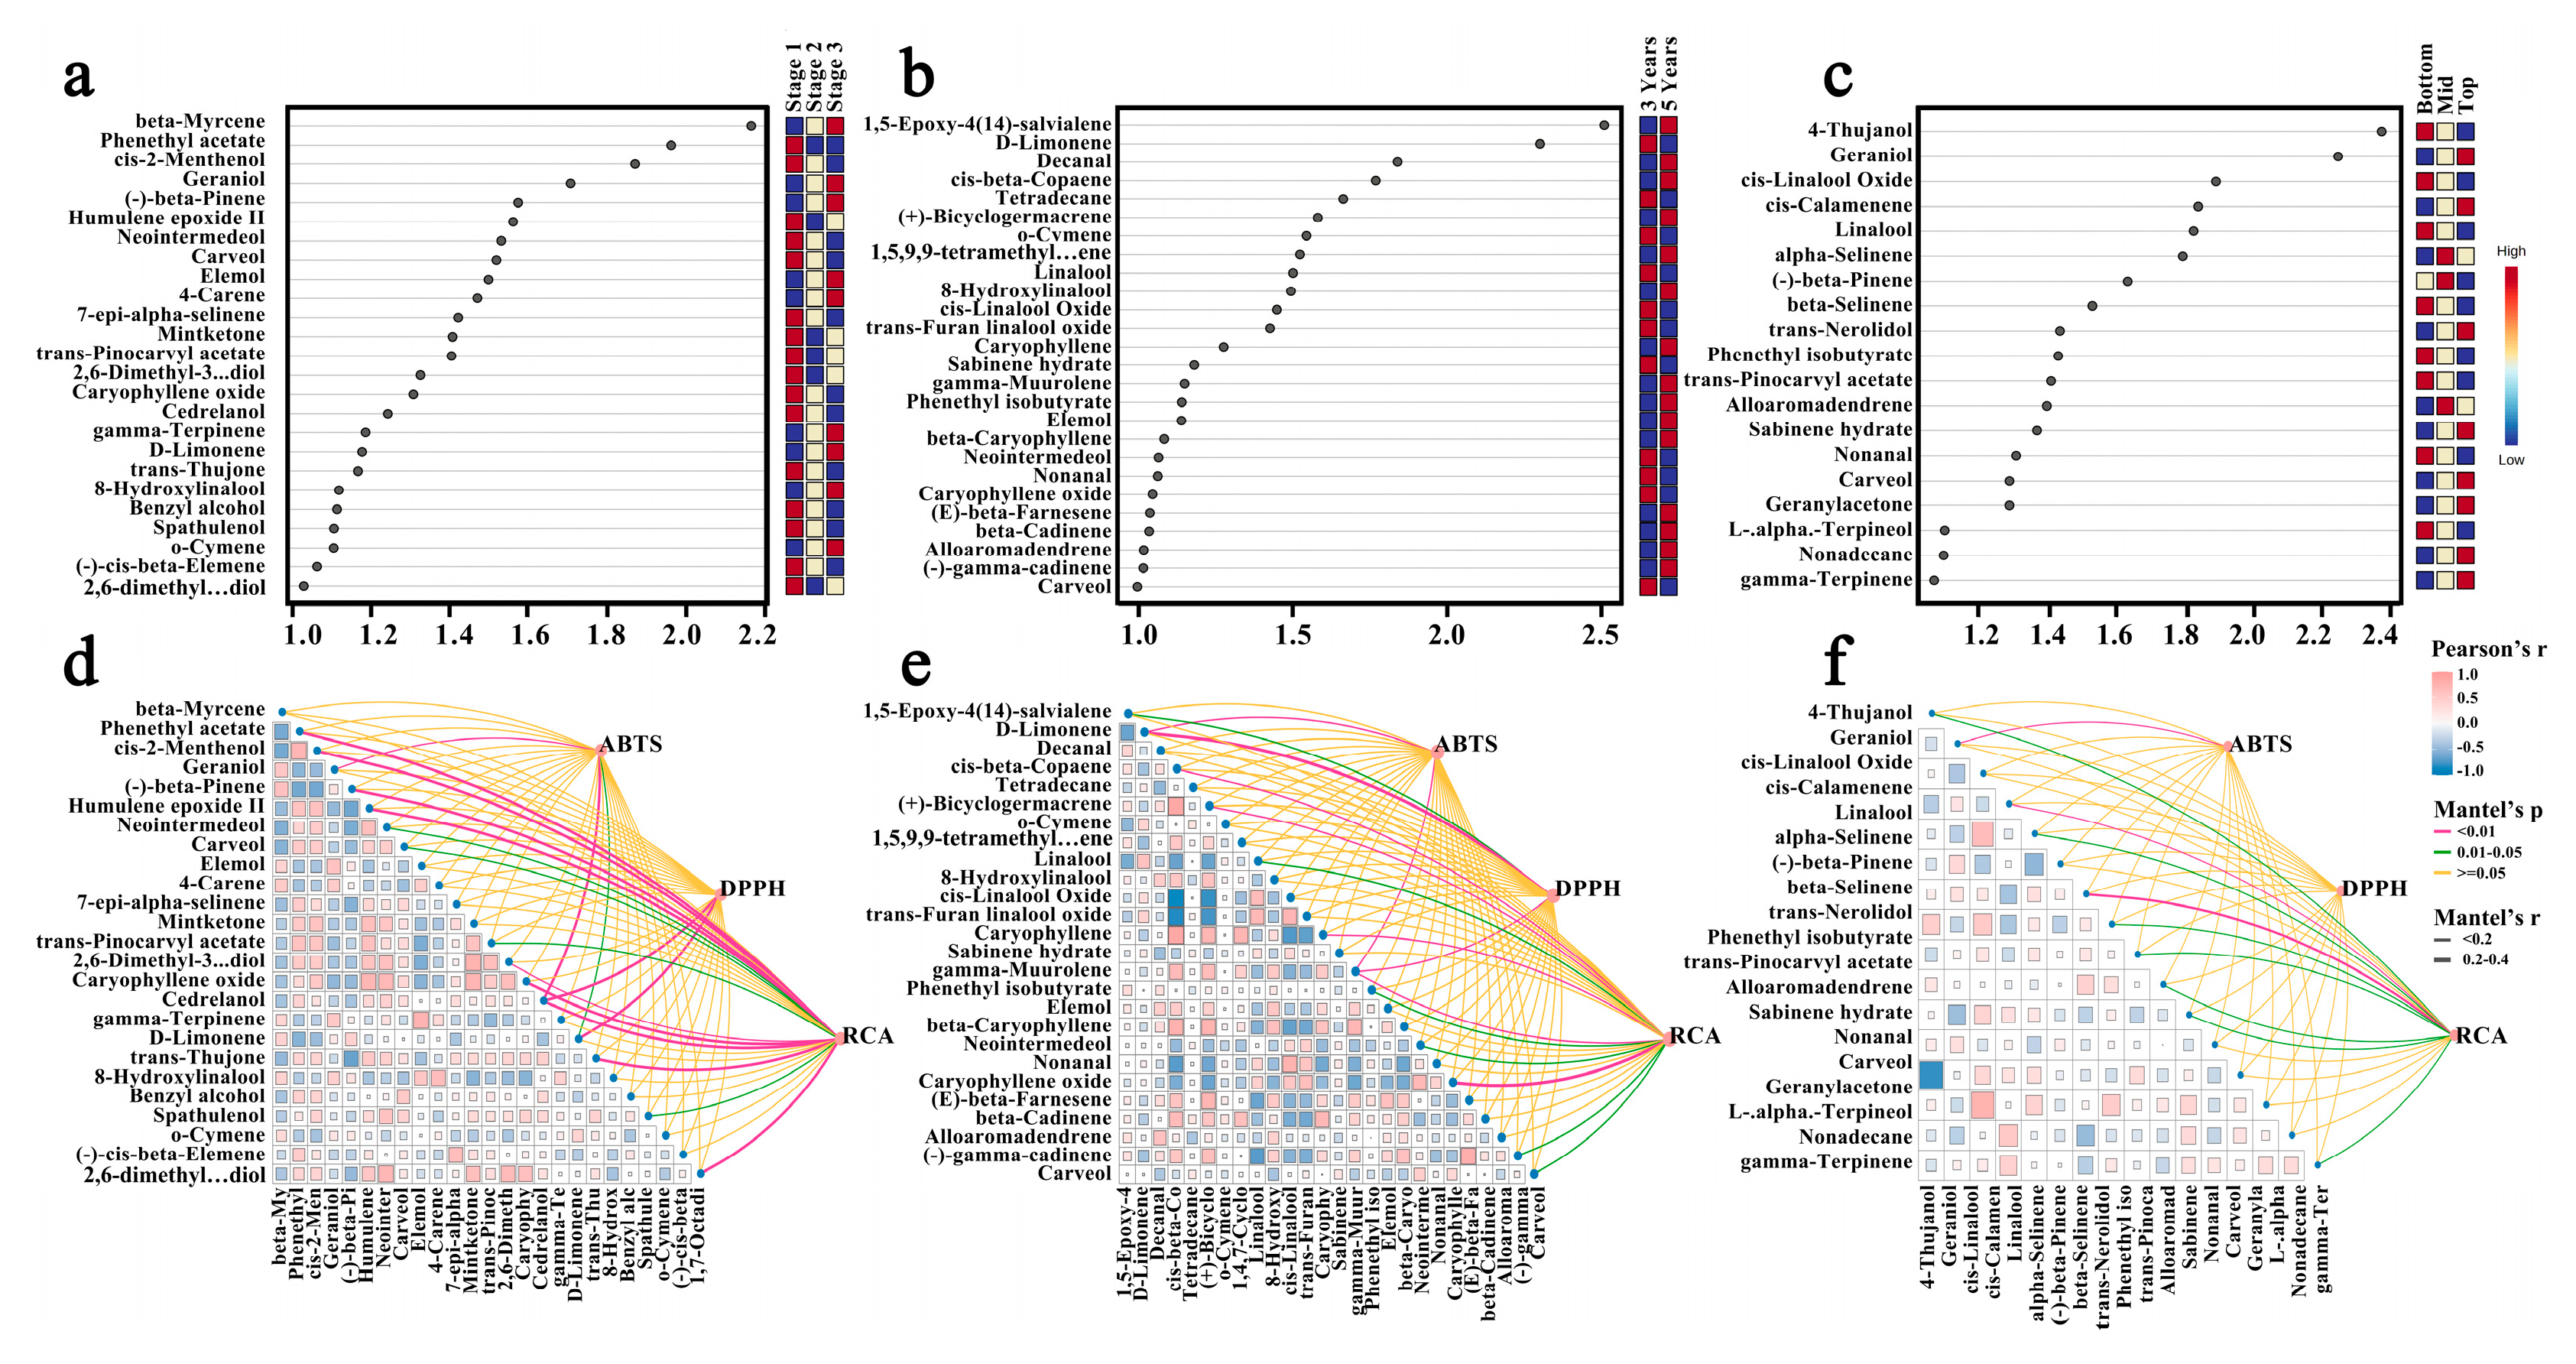
As presented in Table 2, the ABTS and DPPH radical scavenging activities of Z. armatum samples ranged from 35–53 mg/g and 23–51 mg/g, respectively, with reducing power values spanning 27–54 mg/g. The observed substantial variations in antioxidant capacities prompted subsequent correlation analysis with phytochemical and VOC profiles to identify underlying causative factors. To explore antioxidant activity differences, we used the PLS-DA model to screen dominant materials (DMs) by variable importance in projection (VIP) from detected VOCs (VIP > 1). VIP is used to quantify the weight of the independent variable in explaining the dependent variable and, the higher the VIP value, the greater the difference in aroma composition between groups and the more important this is for discriminative classification of aroma types [57,67].
Among three harvest times, 25 DMs were selected (Figure 6a), including terpenes (β-Myrcene, β-Pinene, humulene epoxy, 4-carene, α-selinene, γ-terpinene, D-limonene, o-cymene, (-)-cis-β-elemene), oxides (caryophyllene oxide), esters (phenethyl acetate, trans-pinocarvyl acetate), alcohols (cis-2-menthenol, geraniol, (-)-, neo-intermedeol, carveol, elemol, 2,6-dimethyl-3,7-octadiene-2,6-diol, cedrelanol, 8-hydroxylinalool, benzyl alcohol, spathulenol, 2,6-dimethyl-1,7-Octadiene-3,6-diol) and ketones (7-epi-mintketone, trans-thujone). Sixteen DMs had higher ion intensity at HT 1, while the rest had higher intensity at HT 3; no highly expressed DMs were found at HT 2.
In 3-year-old and 5-year-old trees, 26 DMs were selected, including terpenes (1,5-epoxy-4(14)-salvialene, D-limonene, cis-β-copaene, (+)-bi-cyclo-germacrene, o-cymene, 1,5,9,9-tetramethyl-1,4,7-Cycloundecatriene, caryophyllene, γ-muurolene, β-caryophyllene, (E)-β-farnesene, β-cadinene, alloaromadendrene, (-)-γ-cadinene, 4-carene, sabinene hydrate), alcohols (linalool, 8-hydroxylinalool, elemol, neo-intermedeol, carveol), aldehydes (decanal, nonanal), esters (phenethyl iso-butyrate), alkanes (tetradecane) and oxides (cis-linalool oxide, trans-furan linalool oxide, caryophyllene oxide) (Figure 6b). Eleven DMs had higher ion intensity in 3-year samples, and 15 in 5-year samples.
Among three fruiting positions, 16 DMs were selected, including terpenes (cis-calamenene, α-selinene, (-)-β-pinene, β-selinene, alloaromadendrene, sabinene hydrate), alcohols (4-thujanol, geraniol, elemol, linalool, trans-nerolidol, carveol), aldehydes (nonanal), esters (phenethyl isobutyrate, trans-pinocarvyl acetate), ketones (geranyl-acetone), and oxides (cis-linalool oxide) (Figure 6c). Seven DMs were highly enriched at the top position, three at the middle position, and the rest at the bottom position. The number of DMs in this group was significantly lower than the previous two, indicating smaller differences.

3.6. Mantel Test

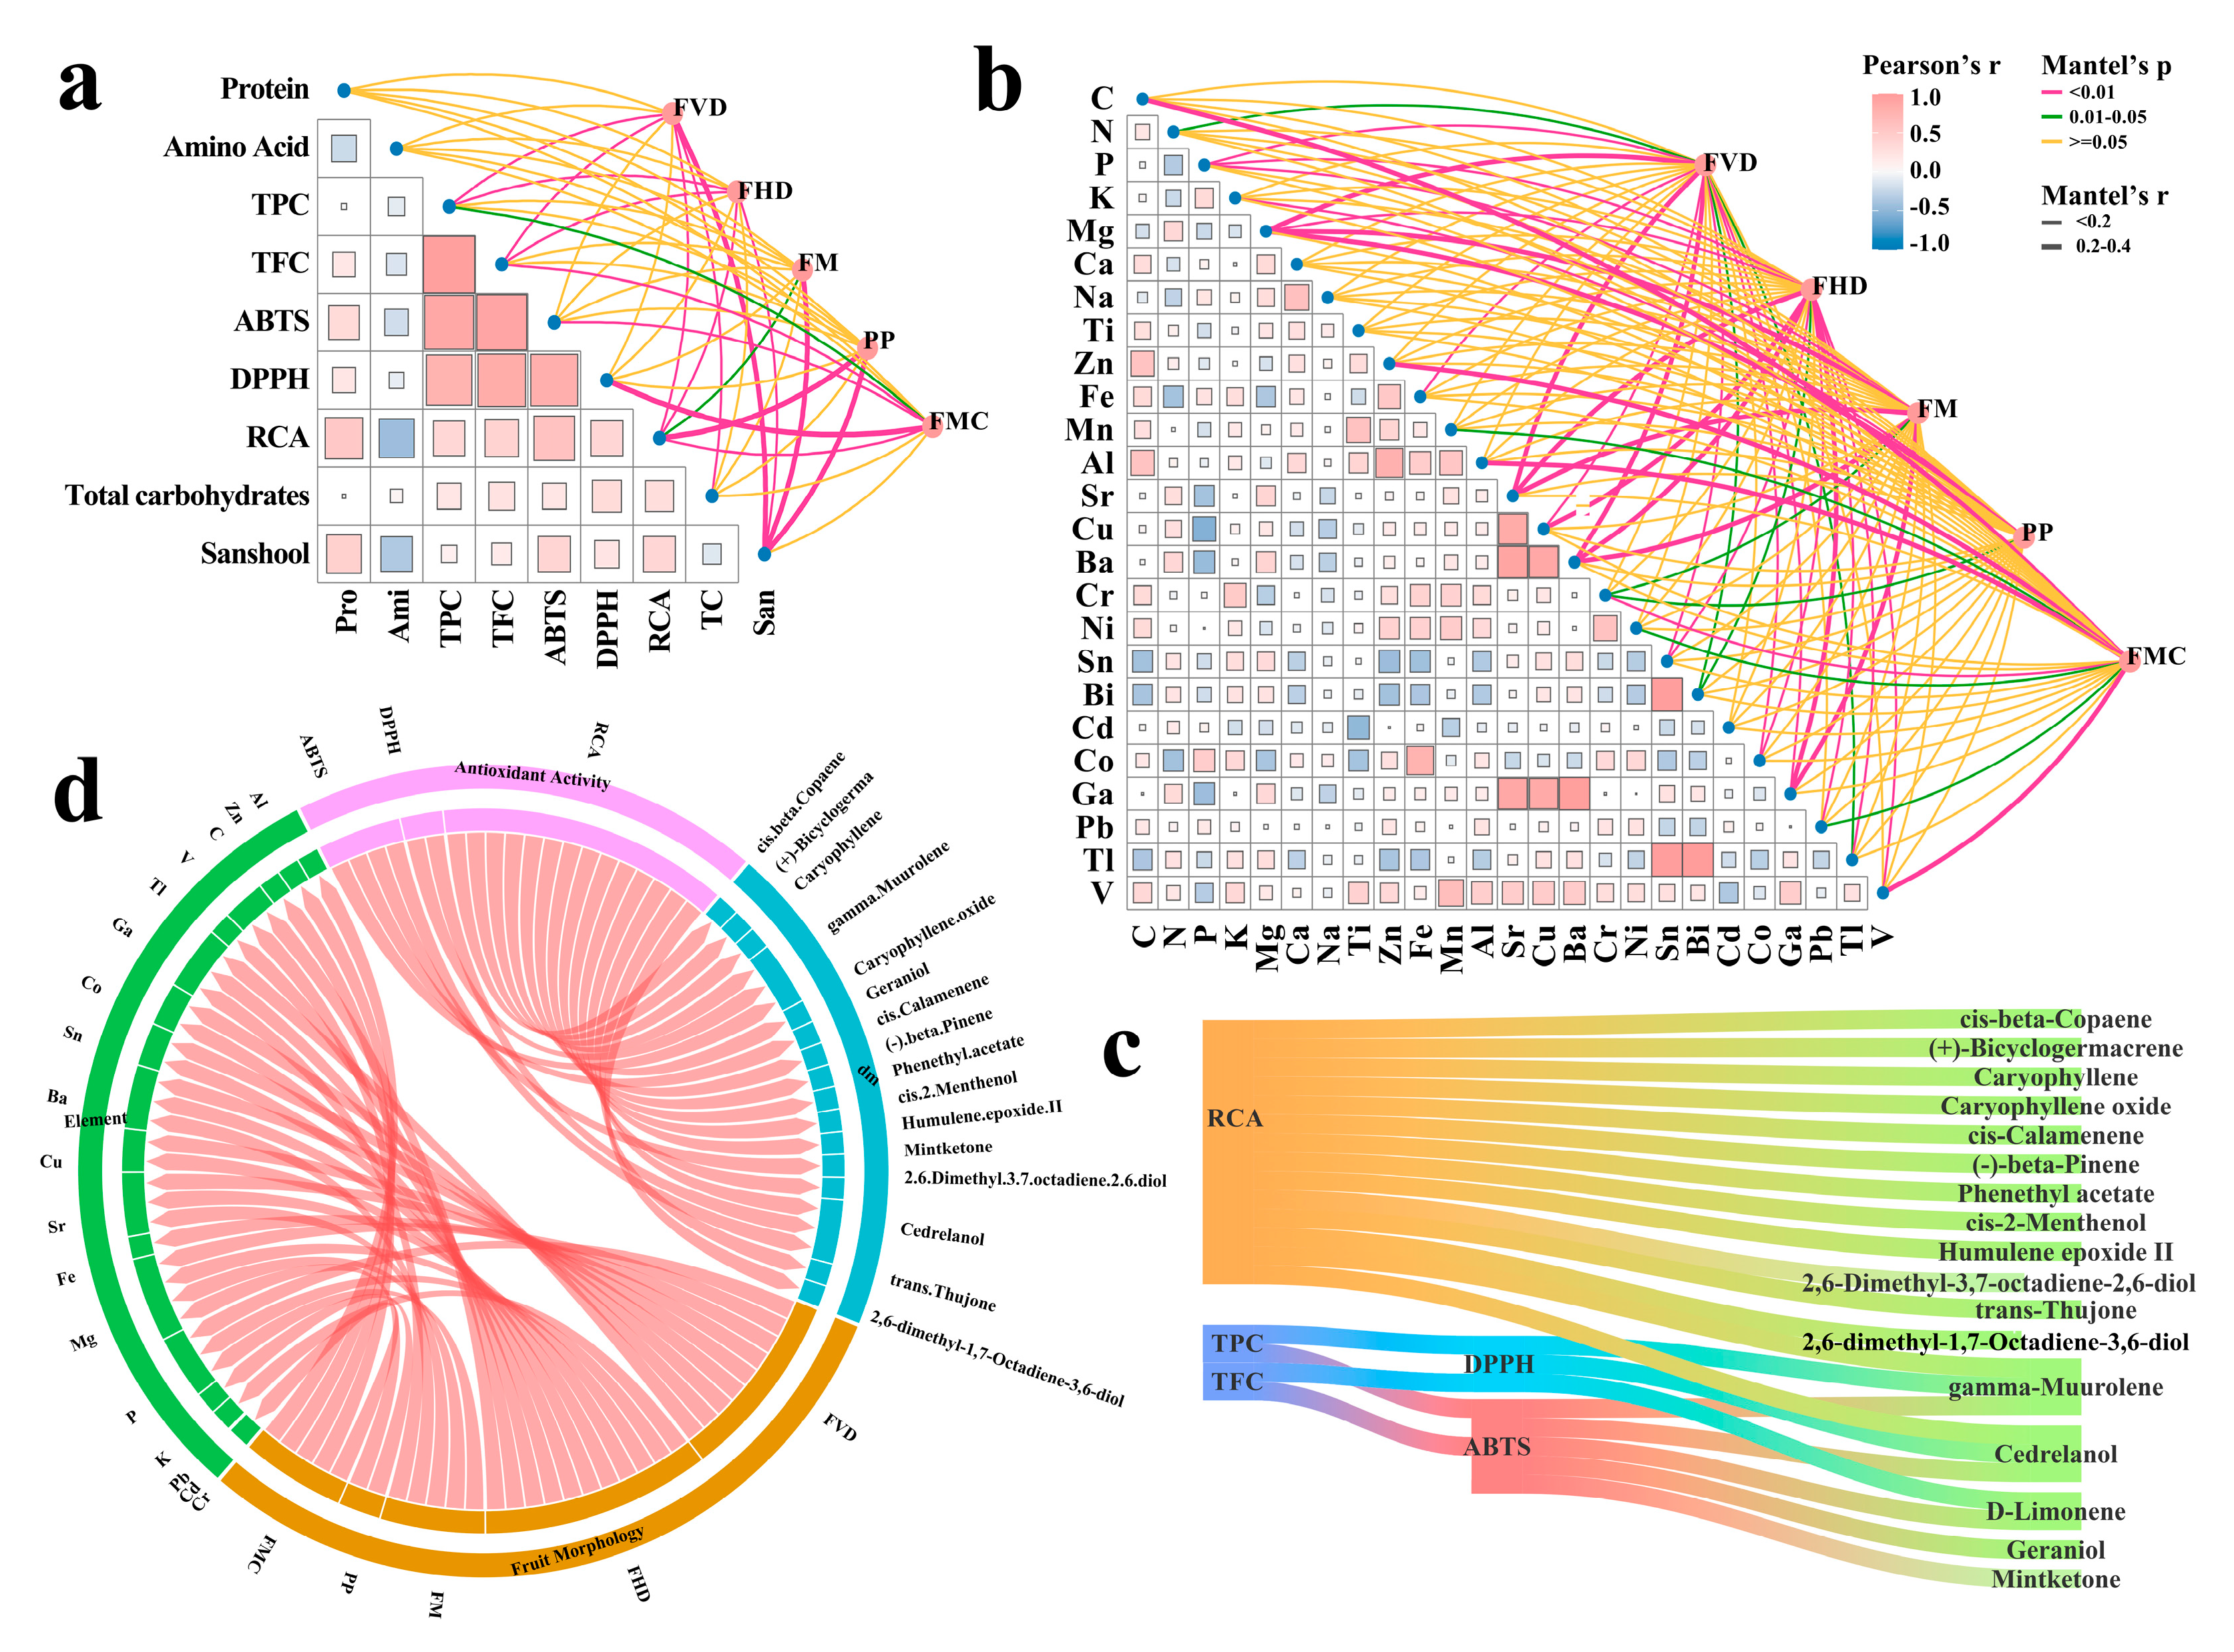
As shown in Figure 6d–f and Figure 7a, 17 VOCs were identified as key active VOCs, including D-limonene, cis-β-copaene, (+)-bi-cyclo-germacrene, caryophyllene, γ-muurolene, caryophyllene oxide, geraniol, cis-calamenene, (-)-β-pinene, phenethyl acetate, cis-2-menthenol, humulene epoxide ii, mint-ketone, 2,6-dimethyl-3,7-octadiene-2,6-diol, cedrelanol, trans-thujone and 1,7-octadiene-3,6-diol,2,6-dimethyl-. D-limonene exhibits notable antioxidant activity. In the study of Ewais et al., D-limonene treatment significantly elevated antioxidant enzyme levels, including glutathione peroxidase (GPX), catalase (CAT) and superoxide dismutase (SOD) [68], while reducing oxidative stress markers such as malondialdehyde (MDA) and nitric oxide (NO) [69]. Other terpenes in Z. armatum, including sabinene, terpinene, myrcene and cymene, have demonstrated antioxidant properties in prior studies through lipid peroxidation inhibition and endogenous antioxidant system enhancement [70]. However, these effects were not observed in the current study, likely due to their low concentrations in Z. armatum. Phytochemicals, namely TFC and TPC, were significantly associated with antioxidant activity (p < 0.01). As for phenolic compounds, increasing evidence proves their protective activity against a multitude of human conditions [71], and they have been confirmed to possess antioxidant activity [72]. The present results illustrated key active VOCs and two phytochemicals linked to antioxidant activity. D-limonene, γ-muurolene and cedrelanol exhibited strong correlations with antioxidant activity, while most terpenes correlated significantly with RC (Figure 7c). Previous studies have indicated that terpenes possess antioxidant activity [73]. Terpenoid compounds are widely applied in human daily life and health, spanning various industries, including pharmaceuticals, nutraceuticals, food and beverage products, cosmetics, perfumery, synthetic chemicals, fragrance and flavor additives, rubber products, and biofuels [74]. This also provides new insights for the development of functional food by-products rich in terpenes.
An integrative correlation analysis revealed that the morphological indexes of fruit clusters had weak correlations with other indexes (Figure S3, p > 0.05). Therefore, mantel tests were conducted on fruit horizontal diameter, fruit vertical diameter, single fruit mass, peel proportion and fruit moisture content to explore their correlations with phytochemical components, antioxidant activity and elements (Figure 7a,b). Fruit horizontal diameter, vertical diameter and fruit mass were significantly correlated with P, Mg, Sr, Ba and Ga, while fruit dimensions also showed a significant correlation with Cu. The phosphoryl transfer from AHPs to ARRs activates the DNA binding capacity of ARRs, facilitating transcriptional activation. P promotes cytokinin synthesis, thereby significantly influencing fruit mass and dimensions [75]. Mg serves as an essential structural component of chlorophyll and enhances photosynthetic efficiency, thereby indirectly promoting fruit enlargement and biomass accumulation. The significant correlation between peel proportion and Mg likely stems from Mg2+ binding to cell walls [76], which modulates pectin cross-linking and consequently affects peel thickness and structural integrity. Fruit moisture content shows significant correlations with C, Zn, Al and V. Zn influences fruit expansion through its dual role in tryptophan biosynthesis regulation and mediation of cell elongation/division processes [77]. Zn2+ may further regulate water transport via aquaporin-mediated membrane permeability [78]. The regulatory mechanisms of other chemical elements need to be further investigated.
A grouped chord diagram presents the correlation indexes (p < 0.01) to identify substances with significant correlations among the measured substances (Figure 7d). Based on the identified correlations between phytochemical profiles, elements and morphological characteristics, we recommend prioritizing harvest during the pre-ripening stage (HT 2) from 5-year-old trees to maximize antioxidant terpenes (D-limonene, γ-muurolene) and phenolic compounds, while implementing targeted P and Mg supplementation during fruit development to enhance cytokinin-mediated biomass accumulation and Mg2+-dependent peel structural integrity [76]. This integrated approach leverages developmental biochemistry and elemental stoichiometry to advance Z. armatum as a multifunctional crop for both the functional food and phytopharmaceutical industries, thereby addressing the growing demand for standardized, high-value Z. armatum products in global food and nutraceutical markets.

4. Conclusions

This study demonstrated that harvest time and tree age significantly influence Z. armatum fruit quality. Later harvests increased fruit size (44.79–108.51 mm spike length) and weight (up to 8.02 g/spike) but decreased phenolic (49.98–66.11 mg/g) and flavonoid (10.75–17.39 mg/g) contents. Five-year-old trees showed superior phytochemical accumulation, including higher sanshool (70.87–198.23 mg/g) and terpene levels (linalool averaging 46.65%). Among 64 identified VOCs, terpenes exhibited the most significant variations, with D-limonene and caryophyllene oxide showing strong antioxidant correlations (ABTS 35–53 mg/g). While fruiting position minimally affected VOC profiles, harvest timing and tree age emerged as critical quality determinants. These findings provide concrete guidance for cultivation practices, particularly recommending pre-ripening harvest from mature trees to optimize both nutritional value and aroma profile, offering valuable insights for the food and nutraceutical industries.

Supplementary Materials

The following supporting information can be downloaded at: https://www.mdpi.com/article/10.3390/horticulturae11091028/s1, Figure S1: Variations of some morphological indicators of Z. armatum fruits in response to harvest time, tree age and fruiting position; Figure S2: Variations of micro elements of Z. armatum fruits in response to harvest time, tree age and fruiting position; Figure S3: Total ion chromatogram (TIC) comparison of Z. armatum at different harvest times, tree ages and fruiting positions; Figure S4: Integrative correlation analysis; Table S1: Sample collection in this study; Table S2: AAS operating conditions; Table S3: AAS performance parameters; Table S4: ICP-MS performance parameters; Table S5: Mineral element content in different samples; Table S6: Relative content of VOCs in different samples; Table S7: The odor characteristics of different VOCs.

Author Contributions

Methodology, investigation, software, validation, data curation, formal analysis, writing—original draft preparation, and writing—review and editing, Y.X. and T.G.; formal analysis, visualization and writing—review and editing, S.H., Y.K., J.H., Y.S. and T.Y.; conceptualization, supervision, project administration, writing—original draft preparation, and writing—review and editing, S.G. and G.Z. All authors have read and agreed to the published version of the manuscript.

Funding

This work was financially supported by grants from the Sichuan Science and Technology Project (No. 2019ZHFP0273).

Data Availability Statement

The original contributions presented in the study are included in the article/Supplementary Materials; further inquiries can be directed to the corresponding authors.

Acknowledgments

We are grateful to all of the group members and workers for their assistance in the field experiment.

Conflicts of Interest

The authors declare no conflicts of interest.

References

  1. Ji, Y.; Li, S.; Ho, C.-T. Chemical Composition, Sensory Properties and Application of Sichuan Pepper (Zanthoxylum Genus). Food Sci. Human Well. 2019, 8, 115–125. [Google Scholar] [CrossRef]
  2. Shah, S.S.; Ahmed, S.; Zhou, B.; Shi, L. A Review on Pharmacological Activities and Phytochemical Constituents of Zanthoxylum armatum DC. Nat. Prod. Res. 2025, 39, 3240–3259. [Google Scholar] [CrossRef] [PubMed]
  3. Singh, S.; Kumar, A.; Semwal, B.C. PRISMA Based Systematic Review: Pharmacognostic Study of Zanthoxylum armatum DC. Mini Rev. Med. Chem. 2021, 21, 1965–1997. [Google Scholar] [CrossRef]
  4. Liu, J.; Wan, J.; Zhang, Y.; Hou, X.; Shen, G.; Li, S.; Luo, Q.; Li, Q.; Zhou, M.; Liu, X.; et al. The Establishment of Comprehensive Quality Evaluation Model for Flavor Characteristics of Green Sichuan Pepper (Zanthoxylum armatum DC.) in Southwest China. Food Chem. X 2023, 18, 100721. [Google Scholar] [CrossRef]
  5. Gu, T.; Ren, H.; Wang, M.; Qian, W.; Hu, Y.; Yang, Y.; Yu, T.; Zhao, K.; Gao, S. Changes in Growth Parameters, C:N:P Stoichiometry and Non-Structural Carbohydrate Contents of Zanthoxylum armatum Seedling in Response to Five Soil Types. Horticulturae 2024, 10, 261. [Google Scholar] [CrossRef]
  6. Hu, Y.-Y.; Qian, W.-Z.; Yi, L.; Mao, Y.-D.; Ye, Y.-L.; Ren, H.-Y.; Gu, T.; Zhang, D.-J.; Cao, G.-X.; Gao, S. Chemical Composition and Antioxidant Activity of Zanthoxylum armatum Leaves in Response to Plant Age, Shoot Type and Leaf Position. Forests 2023, 14, 1022. [Google Scholar] [CrossRef]
  7. Feng, X.; Wang, H.; Wang, Z.; Huang, P.; Kan, J. Discrimination and Characterization of the Volatile Organic Compounds in Eight Kinds of Huajiao with Geographical Indication of China Using Electronic Nose, HS-GC-IMS and HS-SPME-GC–MS. Food Chem. 2022, 375, 131671. [Google Scholar] [CrossRef] [PubMed]
  8. Zhao, C.; Han, M.; Tu, T.; Chen, S.; Hu, W.; Dong, L.; Zhang, F.; Zhao, Y.; Li, Z. Comparative Analysis of Fatty Acids, Volatile and Non-Volatile Components in Red Huajiao (Zanthoxylum bungeanum Maxim.) and Green Huajiao (Zanthoxylum armatum DC.) Using GC-MS, UPLC-LTQ-Orbitrap-MS/MS and HPLC-DAD. Ind. Crop. Prod. 2023, 204, 117371. [Google Scholar] [CrossRef]
  9. Feng, X.; Huang, P.; Duan, P.; Wang, H.; Kan, J. Dynamic Zanthoxylum Pungency Characteristics and Their Correlation with Sanshool Composition and Chemical Structure. Food Chem. 2023, 407, 135138. [Google Scholar] [CrossRef] [PubMed]
  10. Fonseca, A.M.A.; Geraldi, M.V.; Junior, M.R.M.; Silvestre, A.J.D.; Rocha, S.M. Purple Passion Fruit (Passiflora rdulis f. Edulis): A Comprehensive Review on the Nutritional Value, Phytochemical Profile and Associated Health Effects. Food Res. Int. 2022, 160, 111665. [Google Scholar] [CrossRef]
  11. Zhu, Y.; Lv, H.-P.; Shao, C.-Y.; Kang, S.; Zhang, Y.; Guo, L.; Dai, W.-D.; Tan, J.-F.; Peng, Q.-H.; Lin, Z. Identification of Key Odorants Responsible for Chestnut-like Aroma Quality of Green Teas. Food Res. Int. 2018, 108, 74–82. [Google Scholar] [CrossRef] [PubMed]
  12. Feng, J.; Zhang, B.; Zhang, H.; Wu, Z.; Li, M.; Wang, D.; Wang, C. Combining with E-Nose, GC-MS, GC-IMS and Chemometrics to Explore Volatile Characteristics during the Different Stages of Zanthoxylum bungeanum Maxim Fruits. Food Res. Int. 2024, 195, 114964. [Google Scholar] [CrossRef]
  13. Wenkai, H.; Jingyan, W.; Lexun, M.; Feiyan, Z.; Luping, J.; Yu, Z.; Shaobo, Z.; Wei, G. Identification of Key Genes in the Biosynthesis Pathways Related to Terpenoids, Alkaloids and Flavonoids in Fruits of Zanthoxylum armatum. Sci. Hort. 2021, 290, 110523. [Google Scholar] [CrossRef]
  14. Gonzalez-Burgos, E.; Gomez-Serranillos, M.P. Terpene Compounds in Nature: A Review of Their Potential Antioxidant Activity. Curr. Med. Chem. 2012, 19, 5319–5341. [Google Scholar] [CrossRef] [PubMed]
  15. Mele, M.A.; Kang, H.M.; Lee, Y.T.; Islam, M.Z. Grape Terpenoids: Flavor Importance, Genetic Regulation, and Future Potential. Crit. Rev. Food Sci. Nutri. 2021, 61, 1429–1447. [Google Scholar] [CrossRef]
  16. Hou, L.; Liu, Y.; Wei, A. Geographical Variations in the Fatty Acids of Zanthoxylum Seed Oils: A Chemometric Classification Based on the Random Forest Algorithm. Ind. Crop. Prod. 2019, 134, 146–153. [Google Scholar] [CrossRef]
  17. Feng, F.; Li, M.; Ma, F.; Cheng, L. Effects of Location within the Tree Canopy on Carbohydrates, Organic Acids, Amino Acids and Phenolic Compounds in the Fruit Peel and Flesh from Three Apple (Malus × Domestica) Cultivars. Hortic Res. 2014, 1, 14019. [Google Scholar] [CrossRef] [PubMed]
  18. Meena, N.K.; Asrey, R. Tree Age Affects Physicochemical, Functional Quality and Storability of Amrapali Mango (Mangifera indica L.) Fruits. J. Sci. Food Agric. 2018, 98, 3255–3262. [Google Scholar] [CrossRef]
  19. Prasad, K.; Jacob, S.; Siddiqui, M.W. Chapter 2—Fruit Maturity, Harvesting, and Quality Standards. In Preharvest Modulation of Postharvest Fruit and Vegetable Quality; Siddiqui, M.W., Ed.; Academic Press: Cambridge, MA, USA, 2018; pp. 41–69. ISBN 978-0-12-809807-3. [Google Scholar]
  20. Zhang, F.; Wang, Q.; Li, H.; Zhou, Q.; Tan, Z.; Zu, X.; Yan, X.; Zhang, S.; Ninomiya, S.; Mu, Y.; et al. Study on the Optimal Leaf Area-to-Fruit Ratio of Pear Trees on the Basis of Bearing Branch Girdling and Machine Learning. Plant Phenomics 2024, 6, 0233. [Google Scholar] [CrossRef]
  21. Li, C.; Li, X.; Liang, G.; Xiang, S.; Han, G. Volatile Composition Changes in Lemon during Fruit Maturation by HS-SPME-GC-MS. J. Sci. Food Agric. 2022, 102, 3599–3606. [Google Scholar] [CrossRef]
  22. Zhao, J.; Liu, J.; Wang, F.; Wang, S.; Feng, H.; Xie, X.; Hao, F.; Zhang, L.; Fang, C. Volatile Constituents and Ellagic Acid Formation in Strawberry Fruits of Selected Cultivars. Food Res. Int. 2020, 138, 109767. [Google Scholar] [CrossRef] [PubMed]
  23. Feng, S.; Yan, C.; Zhang, T.; Ji, M.; Tao, R.; Gao, H. Comparative Study of Volatile Compounds and Expression of Related Genes in Fruit from Two Apple Cultivars during Different Developmental Stages. Molecules 2021, 26, 1553. [Google Scholar] [CrossRef]
  24. Bradstreet, R.B. Kjeldahl Method for Organic Nitrogen. Anal. Chem. 1954, 26, 185–187. [Google Scholar] [CrossRef]
  25. Yang, Y.; Zhu, M.-Y.; Zhao, S.-M.; Fan, Y.-T.; Huang, J.-W.; Yu, T.; Zhuang, G.-Q.; Gao, S. Variations in the Mineral Composition of Houpoea officinalis Flowers at Different Stages of Development. Horticulturae 2025, 11, 387. [Google Scholar] [CrossRef]
  26. Snyder, J.C.; Desborough, S.L. Rapid Estimation of Potato Tuber Total Protein Content with Coomassie Brilliant Blue G-250. Theoret. Appl. Genet. 1978, 52, 135–139. [Google Scholar] [CrossRef]
  27. Vázquez, C.V.; Rojas, M.G.V.; Ramírez, C.A.; Chávez-Servín, J.L.; García-Gasca, T.; Ferriz Martínez, R.A.; García, O.P.; Rosado, J.L.; López-Sabater, C.M.; Castellote, A.I.; et al. Total Phenolic Compounds in Milk from Different Species. Design of an Extraction Technique for Quantification Using the Folin–Ciocalteu Method. Food Chem. 2015, 176, 480–486. [Google Scholar] [CrossRef]
  28. Mammen, D.; Daniel, M. A Critical Evaluation on the Reliability of Two Aluminum Chloride Chelation Methods for Quantification of Flavonoids. Food Chem. 2012, 135, 1365–1368. [Google Scholar] [CrossRef]
  29. Kurzyna-Szklarek, M.; Cybulska, J.; Zdunek, A. Analysis of the Chemical Composition of Natural Carbohydrates—An Overview of Methods. Food Chem. 2022, 394, 133466. [Google Scholar] [CrossRef] [PubMed]
  30. Chen, Q.; Wang, Z.; Yang, B.; Yang, Q.; Kan, J. Determination of Main Alkylamides Responsible for Zanthoxylum bungeanum Pungency through Quantitative Analysis of Multi-Components by a Single Marker. Food Chem. 2022, 396, 133645. [Google Scholar] [CrossRef]
  31. Feng, J.; Hao, L.; Zhu, H.; Li, M.; Liu, Y.; Duan, Q.; Jia, L.; Wang, D.; Wang, C. Combining with Volatilomic Profiling and Chemometrics to Explore the Volatile Characteristics in Five Different Dried Zanthoxylum bungeanum Maxim. Food Res. Int. 2024, 175, 113719. [Google Scholar] [CrossRef]
  32. Fawole, O.A.; Opara, U.L. Fruit Growth Dynamics, Respiration Rate and Physico-Textural Properties during Pomegranate Development and Ripening. Sci. Hort. 2013, 157, 90–98. [Google Scholar] [CrossRef]
  33. Morandi, B.; Manfrini, L.; Losciale, P.; Zibordi, M.; Corelli Grappadelli, L. Changes in Vascular and Transpiration Flows Affect the Seasonal and Daily Growth of Kiwifruit (Actinidia deliciosa) Berry. Ann. Bot. 2010, 105, 913–923. [Google Scholar] [CrossRef]
  34. Coyago-Cruz, E.; Corell, M.; Moriana, A.; Hernanz, D.; Stinco, C.M.; Meléndez-Martínez, A.J. Effect of the Fruit Position on the Cluster on Fruit Quality, Carotenoids, Phenolics and Sugars in Cherry Tomatoes (Solanum lycopersicum L.). Food Res. Int. 2017, 100, 804–813. [Google Scholar] [CrossRef] [PubMed]
  35. Scalbert, A.; Manach, C.; Morand, C.; Rémésy, C.; Jiménez, L. Dietary Polyphenols and the Prevention of Diseases. Crit. Rev. Food Sci. Nutri. 2005, 45, 287–306. [Google Scholar] [CrossRef] [PubMed]
  36. Rodriguez-Mateos, A.; Vauzour, D.; Krueger, C.G.; Shanmuganayagam, D.; Reed, J.; Calani, L.; Mena, P.; Del Rio, D.; Crozier, A. Bioavailability, Bioactivity and Impact on Health of Dietary Flavonoids and Related Compounds: An Update. Arch. Toxicol. 2014, 88, 1803–1853. [Google Scholar] [CrossRef]
  37. Shashirekha, M.N.; Mallikarjuna, S.E.; Rajarathnam, S. Status of Bioactive Compounds in Foods, with Focus on Fruits and Vegetables. Crit. Rev. Food Sci. Nutri. 2015, 55, 1324–1339. [Google Scholar] [CrossRef]
  38. Zhang, H.; Pu, J.; Tang, Y.; Wang, M.; Tian, K.; Wang, Y.; Luo, X.; Deng, Q. Changes in Phenolic Compounds and Antioxidant Activity during Development of ‘Qiangcuili’ and ‘Cuihongli’ Fruit. Foods 2022, 11, 3198. [Google Scholar] [CrossRef]
  39. De Wilde, T.; De Meulenaer, B.; Mestdagh, F.; Govaert, Y.; Vandeburie, S.; Ooghe, W.; Fraselle, S.; Demeulemeester, K.; Van Peteghem, C.; Calus, A.; et al. Influence of Fertilization on Acrylamide Formation during Frying of Potatoes Harvested in 2003. J. Agric. Food Chem. 2006, 54, 404–408. [Google Scholar] [CrossRef]
  40. Zhu, L.; Wang, L.; Chen, X.; Peng, W.; Liu, Y.; Yu, L.; Liang, F.; Wu, C. Comparative Studies on Flavor Substances of Leaves and Pericarps of Zanthoxylum Bungeanum Maxim. at Different Harvest Periods. Trop. J. Pharm. Res. 2019, 18, 279–286. [Google Scholar] [CrossRef]
  41. Wu, Z.; Wang, W.; Sun, L.; Wei, A.; Wang, D. Accumulation and Biosynthesis of Hydroxyl-α-Sanshool in Varieties of Zanthoxylum bungeanum Maxim. by HPLC-Fingerprint and Transcriptome Analyses. Ind. Crop. Prod. 2020, 145, 111998. [Google Scholar] [CrossRef]
  42. Tahir, I.I.; Johansson, E.; Olsson, M.E. Improvement of Quality and Storability of Apple Cv. Aroma by Adjustment of Some Pre-Harvest Conditions. Sci. Hort. 2007, 112, 164–171. [Google Scholar] [CrossRef]
  43. Grbić, V.; Bleecker, A.B. Ethylene Regulates the Timing of Leaf Senescence in Arabidopsis. Plant J. 1995, 8, 595–602. [Google Scholar] [CrossRef]
  44. Zoroddu, M.A.; Aaseth, J.; Crisponi, G.; Medici, S.; Peana, M.; Nurchi, V.M. The Essential Metals for Humans: A Brief Overview. J. Inorgan. Biochem. 2019, 195, 120–129. [Google Scholar] [CrossRef]
  45. Wu, Y.; Sun, M.; Qi, Y.; Liu, S. Remobilization of Storage Nitrogen in Young Pear Trees Grafted onto Vigorous Rootstocks (Pyrus betulifolia). Horticulturae 2021, 7, 148. [Google Scholar] [CrossRef]
  46. San-Martino, L.; Sozzi, G.O.; San-Martino, S.; Lavado, R.S. Isotopically-Labelled Nitrogen Uptake and Partitioning in Sweet Cherry as Influenced by Timing of Fertilizer Application. Sci. Hort. 2010, 126, 42–49. [Google Scholar] [CrossRef]
  47. Gaymard, F.; Pilot, G.; Lacombe, B.; Bouchez, D.; Bruneau, D.; Boucherez, J.; Michaux-Ferrière, N.; Thibaud, J.-B.; Sentenac, H. Identification and Disruption of a Plant Shaker-like Outward Channel Involved in K+ Release into the Xylem Sap. Cell 1998, 94, 647–655. [Google Scholar] [CrossRef] [PubMed]
  48. Bodo, A.V.; Arain, M.A. Radial Variations in Xylem Sap Flux in a Temperate Red Pine Plantation Forest. Ecol. Process 2021, 10, 24. [Google Scholar] [CrossRef] [PubMed]
  49. Liang, Y.; Cossani, C.M.; Sadras, V.O.; Yang, Q.; Wang, Z. The Interaction Between Nitrogen Supply and Light Quality Modulates Plant Growth and Resource Allocation. Front. Plant Sci. 2022, 13, 864090. [Google Scholar] [CrossRef]
  50. Jomova, K.; Makova, M.; Alomar, S.Y.; Alwasel, S.H.; Nepovimova, E.; Kuca, K.; Rhodes, C.J.; Valko, M. Essential Metals in Health and Disease. Chem. Biol. Interact. 2022, 367, 110173. [Google Scholar] [CrossRef]
  51. Hu, M.; Wang, S.; Liu, Q.; Cao, R.; Xue, Y. Flavor Profile of Dried Shrimp at Different Processing Stages. LWT 2021, 146, 111403. [Google Scholar] [CrossRef]
  52. Wang, S.; Zhao, F.; Wu, W.; Wang, P.; Ye, N. Comparison of Volatiles in Different Jasmine Tea Grade Samples Using Electronic Nose and Automatic Thermal Desorption-Gas Chromatography-Mass Spectrometry Followed by Multivariate Statistical Analysis. Molecules 2020, 25, 380. [Google Scholar] [CrossRef] [PubMed]
  53. Sun, J.; Sun, B.; Ren, F.; Chen, H.; Zhang, N.; Zhang, Y. Characterization of Key Odorants in Hanyuan and Hancheng Fried Pepper (Zanthoxylum bungeanum) Oil. J. Agric. Food Chem. 2020, 68, 6403–6411. [Google Scholar] [CrossRef]
  54. Li, X.-J.; Yang, Y.-J.; Li, Y.-S.; Zhang, W.K.; Tang, H.-B. α-Pinene, Linalool, and 1-Octanol Contribute to the Topical Anti-Inflammatory and Analgesic Activities of Frankincense by Inhibiting COX-2. J. Ethnopharmacol. 2016, 179, 22–26. [Google Scholar] [CrossRef]
  55. Vieira, A.J.; Beserra, F.P.; Souza, M.C.; Totti, B.M.; Rozza, A.L. Limonene: Aroma of Innovation in Health and Disease. Chem. Biol. Interact. 2018, 283, 97–106. [Google Scholar] [CrossRef]
  56. Lee, L.C.; Liong, C.-Y.; Jemain, A.A. Partial Least Squares-Discriminant Analysis (PLS-DA) for Classification of High-Dimensional (HD) Data: A Review of Contemporary Practice Strategies and Knowledge Gaps. Analyst 2018, 143, 3526–3539. [Google Scholar] [CrossRef]
  57. Scavarda, C.; Cordero, C.; Strocchi, G.; Bortolini, C.; Bicchi, C.; Liberto, E. Cocoa Smoky Off-Flavour: A MS-Based Analytical Decision Maker for Routine Controls. Food Chem. 2021, 336, 127691. [Google Scholar] [CrossRef]
  58. Pan, Y.-Y.; Chen, Y.-C.; Chang, W.C.-W.; Ma, M.-C.; Liao, P.-C. Visualization of Statistically Processed LC-MS-Based Metabolomics Data for Identifying Significant Features in a Multiple-Group Comparison. Chemom. Intell. Lab. Sys. 2021, 210, 104271. [Google Scholar] [CrossRef]
  59. Li, C.; Xin, M.; Li, L.; He, X.; Yi, P.; Tang, Y.; Li, J.; Zheng, F.; Liu, G.; Sheng, J.; et al. Characterization of the Aromatic Profile of Purple Passion Fruit (Passiflora edulis Sims) during Ripening by HS-SPME-GC/MS and RNA Sequencing. Food Chem. 2021, 355, 129685. [Google Scholar] [CrossRef] [PubMed]
  60. Yang, F.; Liu, Y.; Wang, B.; Song, H.; Zou, T. Screening of the Volatile Compounds in Fresh and Thermally Treated Watermelon Juice via Headspace-Gas Chromatography-Ion Mobility Spectrometry and Comprehensive Two-Dimensional Gas Chromatography-Olfactory-Mass Spectrometry Analysis. LWT 2021, 137, 110478. [Google Scholar] [CrossRef]
  61. Shi, J.; Fei, X.; Hu, Y.; Liu, Y.; Wei, A. Identification of Key Genes in the Synthesis Pathway of Volatile Terpenoids in Fruit of Zanthoxylum bungeanum Maxim. Forests 2019, 10, 328. [Google Scholar] [CrossRef]
  62. Dudareva, N.; Klempien, A.; Muhlemann, J.K.; Kaplan, I. Biosynthesis, Function and Metabolic Engineering of Plant Volatile Organic Compounds. New Phytol. 2013, 198, 16–32. [Google Scholar] [CrossRef]
  63. Pu, D.; Shan, Y.; Duan, W.; Huang, Y.; Liang, L.; Yan, Y.; Zhang, Y.; Sun, B.; Hu, G. Characterization of the Key Aroma Compounds in the Fruit of Litsea pungens Hemsl. (LPH) by GC-MS/O, OAV, and Sensory Techniques. J. Food Qual. 2021, 2021, 6668606. [Google Scholar] [CrossRef]
  64. Liu, Y.; Li, Q.; Yang, W.; Sun, B.; Zhou, Y.; Zheng, Y.; Huang, M.; Yang, W. Characterization of the Potent Odorants in Zanthoxylum armatum DC Prodr. Pericarp Oil by Application of Gas Chromatography–Mass Spectrometry–Olfactometry and Odor Activity Value. Food Chem. 2020, 319, 126564. [Google Scholar] [CrossRef] [PubMed]
  65. Meena, N.K.; Asrey, R. Tree Age Affects Postharvest Attributes and Mineral Content in Amrapali Mango (Mangifera indica) Fruits. Hort. Plant J. 2018, 4, 55–61. [Google Scholar] [CrossRef]
  66. Bergman, M.E.; Huang, X.-Q.; Baudino, S.; Caissard, J.-C.; Dudareva, N. Plant Volatile Organic Compounds: Emission and Perception in a Changing World. Curr. Opin. Plant Biol. 2025, 85, 102706. [Google Scholar] [CrossRef]
  67. Xu, M.; Wang, J.; Zhu, L. Tea Quality Evaluation by Applying E-Nose Combined with Chemometrics Methods. J. Food Sci. Technol. 2021, 58, 1549–1561. [Google Scholar] [CrossRef] [PubMed]
  68. Ewais, O.; Abdel-Tawab, H.; El-Fayoumi, H.; Aboelhadid, S.M.; Al-Quraishy, S.; Falkowski, P.; Abdel-Baki, A.-A.S. Antioxidant Properties of D-Limonene and Its Nanoemulsion Form Enhance Its Anticoccidial Efficiency in Experimentally Infected Broilers with Eimeria tenella: An In Vitro and In Vivo Study. Vet. Res. Commun. 2024, 48, 3711–3725. [Google Scholar] [CrossRef] [PubMed]
  69. Kaurinovic, B.; Vlaisavljevic, S.; Popovic, M.; Vastag, D.; Djurendic-Brenesel, M. Antioxidant Properties of Marrubium peregrinum L. (Lamiaceae) Essential Oil. Molecules 2010, 15, 5943–5955. [Google Scholar] [CrossRef]
  70. Wojtunik, K.A.; Ciesla, L.M.; Waksmundzka-Hajnos, M. Model Studies on the Antioxidant Activity of Common Terpenoid Constituents of Essential Oils by Means of the 2,2-Diphenyl-1-Picrylhydrazyl Method. J. Agric. Food Chem. 2014, 62, 9088–9094. [Google Scholar] [CrossRef]
  71. Carocho, M.; Ferreira, I.C.F.R. A Review on Antioxidants, Prooxidants and Related Controversy: Natural and Synthetic Compounds, Screening and Analysis Methodologies and Future Perspectives. Food Chem. Toxicol. 2013, 51, 15–25. [Google Scholar] [CrossRef]
  72. Martins, N.; Barros, L.; Ferreira, I.C.F.R. In Vivo Antioxidant Activity of Phenolic Compounds: Facts and Gaps. Trends Food Sci Tech. 2016, 48, 1–12. [Google Scholar] [CrossRef]
  73. Masyita, A.; Mustika Sari, R.; Dwi Astuti, A.; Yasir, B.; Rahma Rumata, N.; Emran, T.B.; Nainu, F.; Simal-Gandara, J. Terpenes and Terpenoids as Main Bioactive Compounds of Essential Oils, Their Roles in Human Health and Potential Application as Natural Food Preservatives. Food Chem. X 2022, 13, 100217. [Google Scholar] [CrossRef] [PubMed]
  74. Tetali, S.D. Terpenes and Isoprenoids: A Wealth of Compounds for Global Use. Planta 2019, 249, 1–8. [Google Scholar] [CrossRef] [PubMed]
  75. Zhou, C.-M.; Li, J.-X.; Zhang, T.-Q.; Xu, Z.-G.; Ma, M.-L.; Zhang, P.; Wang, J.-W. The Structure of B-ARR Reveals the Molecular Basis of Transcriptional Activation by Cytokinin. Proc. Natl. Acad. Sci. USA 2024, 121, e2319335121. [Google Scholar] [CrossRef] [PubMed]
  76. Singh, M.; Nara, U.; Rani, N.; Pathak, D.; Sangha, M.K.; Kaur, K. Mineral Content Variation in Leaves, Stalks, and Seeds of Celery (Apium graveolens L.) Genotypes. Biol. Trace Elem. Res. 2023, 201, 2665–2673. [Google Scholar] [CrossRef]
  77. Sourati, R.; Sharifi, P.; Poorghasemi, M.; Alves Vieira, E.; Seidavi, A.; Anjum, N.A.; Sehar, Z.; Sofo, A. Effects of Naphthaleneacetic Acid, Indole-3-Butyric Acid and Zinc Sulfate on the Rooting and Growth of Mulberry Cuttings. J. Integr. Plant Biol. 2022, 13, 245–256. [Google Scholar] [CrossRef]
  78. Mom, R.; Réty, S.; Mocquet, V.; Auguin, D. Deciphering Molecular Mechanisms Involved in the Modulation of Human Aquaporins’ Water Permeability by Zinc Cations: A Molecular Dynamics Approach. Int. J. Mol. Sci. 2024, 25, 2267. [Google Scholar] [CrossRef]
Figure 1. Variations in morphological indicators of Z. armatum fruits in response to harvest time, tree age and fruiting position. (a) Total phenols content. (b) Total flavonoids content. (c) Total carbohydrates content. (d) Soluble protein content. (e) Amino acids content. (f) Sanshool content. **, represent significant differences in the tested parameters, with a significance level of 0.01. *, represent significant differences in the tested parameters, with a significance level of 0.05, n.s., represent no significant differences in the tested parameters.
Horticulturae 11 01028 g001
Figure 2. Variations of mineral elements of Z. armatum fruits in response to harvest time, tree age and fruiting position. (a) C content. (b) N content. (c) P content. (d) K content. (e) Ca content. (f) Mg content. (g) Ternary plot of micro elements content at different harvest times. (h) Ternary plot of micro elements in different fruiting positions. (i) Volcano plot of micro elements between two tree ages. **, represents significant differences in different elements, with a significance level of 0.01. *, represents significant differences in different elements, with a significance level of 0.05, n.s., represent no significant differences in the tested parameters.
Horticulturae 11 01028 g002
Figure 3. Analysis of VOCs at different harvest times. (a) Classification of VOC substances. (b) PLS-DA analysis. (c) Cross-validation results of the PLS-DA model. (d) VOC-Volcano plot analysis for HT1 and HT2. (e) VOC-Volcano plot analysis for HT1 and HT3. (f) VOC-Volcano plot analysis for HT2 and HT3. The red dots represent up-regulated substances with log2 (fold change) > 1, while the green dots represent down-regulated substances with log2 (fold change) < 1. The red asterisk in the cross-validation plot represent the predictive accuracy (Q2) of the PLS-DA model for each component number.
Horticulturae 11 01028 g003
Figure 4. Analysis of VOCs of three-year and five-year trees. (a) Classification of VOC substances. (b) PLS-DA analysis. (c) Cross-validation results of the PLS-DA model. (d) VOC-Volcano plot analysis. The red dots represent up-regulated substances with log2 (fold change) > 1, while the green dots represent down-regulated substances with log2 (fold change) < 1. The corresponding substances are labeled in the figure. The red asterisk in the cross-validation plot represent the predictive accuracy (Q2) of the PLS-DA model for each component number.
Horticulturae 11 01028 g004
Figure 5. Analysis of VOCs at different fruiting positions. (a) Classification of VOC substances at different positions. (b) PLS-DA analysis. (c) Cross-validation results of the PLS-DA model. (d) VOC-Volcano plot analysis of Top and Middle. (e) VOC-Volcano plot analysis of Top and Bottom. (f) VOC-Volcano plot analysis of Middle and Bottom. The green dots represent down-regulated substances with log2 (fold change) < 1. The red asterisk in the cross-validation plot represent the predictive accuracy (Q2) of the PLS-DA model for each component number.
Horticulturae 11 01028 g005
Figure 6. Screening of Dominant-Materials and mantel test analysis. (a) DMs (VIP > 1) at three harvest times. (b) DMs between 3-year and 5-year trees. (c) DMs at three fruiting positions. (d) Antioxidant activity and DMs at different harvest times. (e) Antioxidant activity and DMs at 3-year and 5-year trees. (f) Antioxidant activity and DMs at three fruiting positions. *2,6-Dimethyl-3...diol*: 2,6-Dimethyl-3,7-octadiene-2,6-diol. *2,6-dimethyl…diol*: 2,6-dimethyl-1,7-Octadiene-3,6-diol. *1,5,9,9-tetramethyl…ene*: 1,5,9,9-tetramethyl-1,4,7-Cycloundecatriene.
Horticulturae 11 01028 g006
Figure 7. Mantel tests of morphology metrics, phytochemical components, mineral elements, and integrative correlation analysis. (a) Morphology metrics with phytochemical components and antioxidant activity. (b) Morphology metrics with mineral elements. (c) Correlation between antioxidant activity and DMs, as well as phytochemical components. (d) Integrative correlation analysis.
Horticulturae 11 01028 g007
Table 1. Volatile organic components (VOCs) of Z. armatum fruits in response to harvest time, tree age and fruiting position.
No.Volatile ComponentsRet TimeRICAS
1(-)-β-Pinene11.371081 18172-67-3
2Sabinene11.651089 3387-41-5
3β-Myrcene12.491116 123-35-3
4D-Limonene13.431146 5989-27-5
5γ-Terpinene14.611184 99-85-4
6o-Cymene15.261205 527-84-4
74-Carene15.671218 29050-33-7
8Nonanal18.801379 124-19-6
9Tetradecane19.231400 629-59-4
10trans-Thujone20.091439 471-15-8
11cis-Linalool Oxide20.561443 5989-33-3
122-Methyltetradecane20.951469 1560-95-8
134-Thujanol21.211472 17699-16-0
14trans-Furan linalool oxide21.501483 34995-77-2
15δ-EIemene21.831489 20307-84-0
16Decanal22.581498 112-31-2
17Pentadecane22.901500 629-62-9
18Linalool24.391502 78-70-6
19Sabinene hydrate24.561512 546-79-2
202-p-Menthen-1-ol24.981515 619-62-5
21β-copaene25.761576 18252-44-3
22(-)-cis-β-Elemene26.221587 33880-83-0
23Caryophyllene26.841600 515-13-9
24Alloaromadendrene27.041605 25246-27-9
25cis-2-Menthenol27.381607 29803-82-5
26Myrtenal27.821612 564-94-3
27β-Caryophyllene27.931625 87-44-5
28γ-Muurolene28.281633 30021-74-0
29trans-Pinocarvyl acetate28.421639 1686-15-3
30(E)-Farnesene28.781644 18794-84-8
31(-)-γ-cadinene29.271655 39029-41-9
321,5,9,9-tetramethyl-1,4,7-Cycloundecatriene29.601662 515812-15-4
33L-α-Terpineol30.291685 10482-56-1
34Viridiflorene30.551683 21747-46-6
35cis-β-Copaene31.291700 18252-44-3
36β-Selinene31.711709 17066-67-0
37α-Selinene31.911714 473-13-2
38(+)-Bi-cyclo-germacrene32.201720 24703-35-3
39Geranyl acetate32.611732 105-87-3
40β-Cadinene32.971737 523-47-7
417-epi-α-selinene33.401747 123123-37-5
42Cumin-aldehyde33.871799 122-3-2
43Phenethyl acetate35.101808 103-45-7
44cis-Calamenene36.001835 72937-55-4
45Geraniol36.271876 106-24-1
46Geranyl-acetone36.641892 3796-70-1
47Carveol37.111893 99-48-9
48Iso-ascaridol37.261898 17948-59-3
49Benzyl alcohol37.431901 100-51-6
501,5-Epoxy-4(14)-salvialene39.911962 88395-47-5
512,6-Dimethyl-3,7-octadiene-2,6-diol40.361966 51276-34-7
52Phenethyl iso-butyrate41.261963 103-48-0
53Caryophyllene oxide42.271975 1139-30-6
54Mintketone43.001981 73809-82-2
558-Hydroxylinalool43.281990 64142-78-5
56trans-Nerolidol43.511993 40716-66-3
57Humulene epoxide II43.861995 19888-34-7
58Elemol44.631997 639-99-6
59γ-Eudesmol45.302012 1209-71-8
602,6-dimethyl-1,7-Octadiene-3,6-diol45.492017 51276-33-6
61Spathulenol45.662020 6750-60-3
62Neo-intermedeol45.942027 5945-72-2
63Cedrelanol46.552040 5937-11-1
64Agarospirol46.762045 1460-73-7
Table 2. Antioxidant activities of Z. armatum fruit extracts in response to harvest time, tree age and fruiting position.
SampleABTS (mg/g)DPPH (mg/g)RC (mg/g)
1T553.94 ± 1.38 bc44.59 ± 1.49 bc35.29 ± 0.23 ef
1M547.10 ± 0.79 def33.62 ± 4.74 ef31.63 ± 0.27 f
1B551.84 ± 2.00 bcd40.26 ± 2.22 cd35.23 ± 1.75 ef
1T346.21 ± 1.31 def36.07 ± 1.72 de27.51 ± 1.33 g
1M347.40 ± 1.11 def35.50 ± 2.79 de50.01 ± 0.58 b
1B346.67 ± 1.66 def32.00 ± 1.01 ef45.22 ± 0.96 c
2T560.61 ± 2.026 a51.96 ± 3.38 a54.17 ± 2.71 a
2M555.48 ± 3.56 ab43.44 ± 5.87 bc51.29 ± 4.00 ab
2B556.45 ± 4.45 ab46.95 ± 4.76 ab50.86 ± 1.26 ab
2T342.53 ± 3.82 f33.31 ± 2.91 ef40.79 ± 0.70 d
2M336.81 ± 1.35 g25.95 ± 2.16 gh38.95 ± 0.12 de
2B343.55 ± 4.02 f24.93 ± 3.88 h37.25 ± 1.108 de
3T550.04 ± 5.04 cde35.73 ± 1.53 de41.31 ± 1.88 d
3M546.88 ± 1.00 def34.31 ± 2.44 e38.75 ± 0.17 de
3B546.71 ± 6.34 def35.18 ± 3.37 de39.63 ± 6.66 d
3T335.69 ± 1.50 g23.68 ± 2.97 h31.86 ± 1.02 f
3M344.44 ± 0.83 ef28.28 ± 1.07 fgh39.96 ± 0.75 d
3B343.59 ± 3.03 f30.84 ± 2.40 efg34.88 ± 3.40 ef
Notes: Data ae means ± standard error deviation (n = 3). Different lowercase letters indicate significant differences (p < 0.05).
Disclaimer/Publisher’s Note: The statements, opinions and data contained in all publications are solely those of the individual author(s) and contributor(s) and not of MDPI and/or the editor(s). MDPI and/or the editor(s) disclaim responsibility for any injury to people or property resulting from any ideas, methods, instructions or products referred to in the content.