Article

Integrated Assays and Microscopy to Study the Botrytis cinerea–Strawberry Interaction Reveal Tissue-Specific Stomatal Penetration

by
Lorena Rodriguez Coy
1,2,†,
Donovan Garcia-Ceron
1,2,†,
Scott W. Mattner
1,2,3,
Donald M. Gardiner
1,4 and
Anthony R. Gendall
1,2,5,6,*
1
Australian Research Council Research Hub for Sustainable Crop Protection
2
La Trobe Institute for Sustainable Agriculture and Food (LISAF), Department of Ecological, Plant and Animal Sciences, School of Agriculture, Biomedicine and Environment, La Trobe University, Bundoora, VIC 3086, Australia
3
Victorian Strawberry Industry Certification Authority, Toolangi, VIC 3777, Australia
4
Queensland Alliance for Agriculture and Food Innovation, Centre for Horticultural Science, The University of Queensland, St Lucia, QLD 4072, Australia
5
Australian Research Council Research Hub for Medicinal Agriculture
6
Australian Research Council Research Hub for Protected Cropping
*
Author to whom correspondence should be addressed.
These authors contributed equally to this work.
Horticulturae 2025, 11(8), 954; https://doi.org/10.3390/horticulturae11080954
Submission received: 8 July 2025 / Revised: 4 August 2025 / Accepted: 6 August 2025 / Published: 12 August 2025
(This article belongs to the Special Issue Fungal Diseases in Horticultural Crops)

Abstract

Strawberry (Fragaria x ananassa) production has increased around the world, but crop quality and yield are threatened by fungal pathogens. Botrytis cinerea is a filamentous fungus that infects over 1400 species of crops, causing gray mold disease with devastating losses to horticulture worldwide, including strawberry. The heavy reliance on synthetic fungicides in the strawberry industry has led to the emergence of fungicide resistance in B. cinerea. Therefore, understanding the fundamental biology of B. cinerea is an important step in the search for novel antifungals. Although B. cinerea is one of the most serious pathogens of strawberry, this pathosystem is understudied compared to other plant hosts. Consequently, further evidence is needed on pathogen penetration and early disease development in strawberry tissues. Here, we adapted and advanced assays using detached strawberry leaves, fruits, and petals to study B. cinerea infection. These assays allow the comparison of the treatment effect on the same fruit, avoiding confounding from differential ripening, and facilitate the screening of fungicides or biocontrol agents. Through chlorophyll fluorescence analysis and scanning electron and confocal microscopy, we quantified lesions caused by B. cinerea in the early stages of infection in fruit and petals, and demonstrated that B. cinerea penetrates through the stomata of strawberry achenes, revealing a previously unrecognized infection route in this host. These data provide a deeper understanding of the B. cinerea–strawberry interaction and will serve as a foundation for future studies seeking novel antifungal treatments against B. cinerea.

Graphical Abstract

1. Introduction

Strawberry (Fragaria x ananassa) makes a substantial contribution to a balanced diet and human health. The fruit is rich in fructose, dietary fiber, vitamin C, polyphenols, and minerals [1], while the seeds contain polyunsaturated fatty acids [2]. Production value in 2021 was dominated by three countries—China (USD 8.8B), the USA (USD 3.8B), and Japan (USD 1.8B) [3]. In Australia, the strawberry market was valued at AUD 435 million in 2019–2020 (equivalent to USD 280 million), with a production of 82,000 metric tons of fruit [4]. However, pests and diseases are the major threats to obtaining high-quality fruit [5].
Botrytis cinerea is a pathogenic filamentous fungus that infects more than 1400 plant hosts [6,7,8], including key crops such as soy, tomatoes, grapes, and strawberries, where it causes critical losses in yield and quality [9]. For this reason, B. cinerea is widely regarded as one of the most important fungal pathogens due to its significant impact on horticulture and agriculture [10]. Without the use of fungicides, B. cinerea has the potential to cause up to 80% yield reduction [11]. Berries are particularly affected by B. cinerea, with estimates of USD 2B losses for grapes [7], 50% yield reduction in strawberries [12], and 20% losses in blueberries [13]. Sources of B. cinerea inoculum in strawberry plants include infected leaves, petals and fruit, and sclerotia, which can remain in the soil for long periods and serve as sources of later infection. Flowers are the primary sites of infection; these develop browning of the tissue followed by decay and can fall on other plant tissues, causing secondary infections [14,15,16].
In Australia, gray mold of strawberry caused by B. cinerea can result in pre-harvest losses in marketable fruit of 16% and up to 70% rejection of fruit due to post-harvest rot [17,18,19]. Hence, efforts are underway to identify novel control mechanisms that contribute to a more sustainable protection of strawberries from B. cinerea. Management of gray mold in strawberry is heavily reliant on fungicides [20]. This often leads to fungicide resistance in populations of B. cinerea [21,22]. Indeed, isolates that are resistant to benzimidazole, fenhexamid, iprodione, procymidone, and pyrimethanil have been identified [18,20].
B. cinerea infection is initially asymptomatic in plant tissue, followed by a rapid necrotrophic phase, leading to the fast deterioration and death of plant tissues [6,7]. During the asymptomatic phase, B. cinerea can delay conidia germination, exhibit endophytic growth, or colonize petals and whole flowers [14,23,24]. In strawberry cv. Redcoat, tissue penetration occurred through appressoria as soon as 24 h post inoculation (h.p.i.) [25]. After penetration, B. cinerea creates multicellular appressoria or “infection cushions” [26], which are sites for the secretion of protein effectors, phytotoxins, and hydrolytic enzymes [27].
Assessing the impact of plant protection treatments for gray mold can be difficult in strawberries. Field experiments are essential for evaluating the effectiveness of treatments under commercial conditions but require regular picking of strawberry fruit (2–3 times per week) over long periods (5–9 months) [28], which is costly and labor intensive. For this reason, field experiments are unsuitable for rapidly screening multiple or factorial combinations of treatments. Moreover, measurements of disease severity in the field often utilize scoring systems that can be subject to assessor variability and may not allow for the direct comparison of results between different experimenters. In planta assays in the laboratory are rapid and more suitable for screening large numbers of treatments, but some measures of disease may be confounded by the environment and plant development. For example, Braun and Sutton [25] found that quantifying sporulation as a measure of disease caused by B. cinerea in strawberry assays varied according to leaf age, the degree of senescence, and exposure to cold stress. Furthermore, it is difficult to visualize and quantify early disease in assays using traditional approaches based on image analysis. Visual assessment of leaves used to quantify disease severity depends on visible symptoms, which might be unclear in the early stages of B. cinerea infection. Non-destructive techniques based on measurements of chlorophyll fluorescence in photosystem II (PSII) could provide better detection of infection [29,30].
Although B. cinerea has a broad host range, its infection mechanism is not universal [31]. B. cinerea changes its secretome in response to plant protectants produced by different host plants, uses specialized machinery to infect angiosperms, and evolves to preferentially infect a specific host [31,32,33]. Therefore, it should not be assumed that the early stages of strawberry infection are identical to those described in other hosts. For strawberry, there are no records of the formation of infection cushions in all tissues, or insights into how the pathogen penetrates them. Therefore, the aims of this study were to adapt previously published protocols to better understand the infection of B. cinerea in multiple strawberry tissues, image the early fungus–host interaction, and set the foundation for a platform that allows the rapid screening of strawberry protectants. This study provides an example of an integrated methodology to study the B. cinerea–strawberry interaction and will assist in facilitating the future discovery of novel protection means against B. cinerea.

2. Materials and Methods

2.1. Fungal Material

B. cinerea accession BRIP 28032a (Queensland Department of Primary Industries, Plant Pathology Herbarium) was originally isolated from strawberry plants at the Department of Primary Industries, Maroochydore Research Facility, Nambour, Queensland, Australia. The isolate was grown on solid full-strength potato dextrose agar (PDA, ThermoFisher Scientific, Scoresby, VIC, Australia) at 22 °C and passaged in strawberry leaves, reisolated, and stored following single conidia isolation. The strain was validated as B. cinerea by RNA sequencing using ribo-depleted RNA isolated from fungal mycelia (data available at NCBI BioProject ID: PRJNA1123308; https://www.ncbi.nlm.nih.gov/bioproject/PRJNA1123308 (accessed on 12 June 2024)). Single-conidia origin cultures were mixed with 15% glycerol, frozen in liquid nitrogen, and stored at −80 °C until further use. B. cinerea accession B05.10 was a gift from J. van Kan (Wageningen University and Research). This isolate was originally obtained from grapevines [34]. Glycerol stocks were reactivated on PDA plates and incubated for seven to fifteen days at 22 ± 1 °C with a photoperiod of 12 h of light (Fluorescent globe 15W cool white) and 12 h of darkness (Thermoline TRIL-495-1-SD), for conidia production. For all pathogenicity assays, once conidia were produced, they were harvested by excising an agar piece (approximately 2 cm2) followed by washing in 5 mL of sterile ultrapure water in a 50 mL conical tube. This was filtered through two layers of sterile Miracloth (Merck, Darmstadt, Germany) or a 100 μm cell strainer (Corning Falcon®, Merck, Bayswater, VIC, Australia) into a 10 mL tube, which was centrifuged for 4 min at 4000× g. The supernatant was removed and discarded, and the pelleted conidia were resuspended in the appropriate growth medium or sterile ultrapure water. Conidia number and concentration were determined using a hemocytometer (LW Scientific, Lawrenceville, GA, USA, double Neubauer improved).

2.2. Fungal Transformation

B. cinerea isolate BRIP 28032a was transformed with a binary vector construct expressing the enhanced green fluorescent protein (eGFP) under the control of an Aspergillus nidulans translation elongation factor (TEF) promoter as described elsewhere [35], using Agrobacterium tumefaciens-mediated transformation, essentially as described [36]. Briefly, A. tumefaciens strain AGL1 carrying the vector was grown in Luria–Bertani medium containing rifampicin (50 μg/mL), ampicillin (100 μg/mL), and kanamycin (50 μg/mL) at 28 °C with shaking (250 rpm) overnight. The culture was diluted to an optical density measured at a 660 nm wavelength (OD660; DEN-600, Biosan, Regia, Latvia) of 0.05 with induction medium (Minimal media salts, 40 mM of 2-(N-morpho ethane sulfonic acid), 10 mM of glucose, 0.5% [w/v] glycerol and 200 μM of acetosyringone, pH of 5.3). B. cinerea was grown on PDA plates, and conidia were harvested and suspended in water at a concentration of 1.2 × 10⁶ conidia/mL. Equal volumes (200 μL) of the A. tumefaciens cultures and B. cinerea conidia were plated onto each of three 14 cm Petri plates with induction media (IM) (containing 2% agar and 200 μM of acetosyringone) and allowed to dry in a biohazard cabinet. Plates were sealed and incubated for two days in the dark at room temperature (22 °C). Plates were overlayed with half-strength PDA containing nourseothricin sulfate and cefotaxime, both at a final concentration of 50 μg/mL (accounting for the lower IM layer), and plates were incubated at room temperature until colonies emerged (4–10 days post overlay). Fungal colonies were subcultured from the edge of the growing colony onto PDA media with nourseothricin sulfate and cefotaxime at the same concentration as above and grown for a further seven days at room temperature.

2.3. B. cinerea Transformant Evaluation

When transformants had visibly emerged through the overlay, single resistant colonies were transferred to PDA plates containing nourseothricin sulfate (50 μg/mL) and cefotaxime (50 μg/mL). Transformants were evaluated for their fluorescence using a fluorescence excitation flashlight (Xite Fluorescence Flashlight System), and observed using Royal Blue Filter Glasses (Nightsea, Hatfield, PA, USA). Growth rate on malt extract agar (MEA) and PDA was assessed by measuring the diameter of three replicate colonies at four days and eleven days (Supplementary Figure S1). The virulence of the transformants was tested by inoculating strawberry petals in a 60 mm × 15 mm Petri dish containing a five mm layer of 15% water agar (15%; bacteriologic agar No 1, Oxoid). Inoculation was made using four μL of a B. cinerea isolate at 2 × 10⁴ conidia/mL suspended in 1% MEB (BD, Macquarie Park, NSW, Australia), with conidia being collected as above. The area of fungal infection and growth rate assessment was determined using Fiji 2.14.0 [37] at 48 h. Images of the GFP fluorescence of mycelia were taken with an Olympus BX53 upright microscope.

2.4. Confocal Microscopy

Leaves and petal tissues were collected from axenic plants and placed in 50 mm diameter Petri dishes containing a five mm layer of sterile water agar. B. cinerea conidia of the GFP transgenic strain were obtained as described above, and leaves were inoculated with eight μL of 105 conidia/mL suspended in 50% MEB. Fruit were collected from the glasshouse and submerged in 50% ethanol with 1% sodium hypochlorite for five minutes, followed by three washes with sterilized water, and were allowed to dry for approximately 30 min in a laminar flow hood [34]. Petals were inoculated with four μL of 104 conidia/mL in 1% MEB, and fruit were inoculated with eight μL of 105 conidia/mL in 1% MEB. Images were captured with a Zeiss LSM 980 Upright confocal microscope, with 488 nm of excitation and a 412–695 nm detection wavelength.

2.5. Scanning Electron Microscopy

Fruit produced in a glasshouse of the same maturity and free from visible disease symptoms were collected for scanning electron microscopy (SEM) preparation. Fruit were surface sterilized as described previously (see confocal microscopy). Fruit were placed in Petri dishes and stored inside a rectangular plastic box that had been previously sterilized under UV light for 10 min. A moist paper towel was placed at the bottom of the box to maintain humidity. Fruit were inoculated with eight μL of a B. cinerea BRIP 28032a conidia suspension containing 105 conidia/mL in 0.5X PDB (Sigma, Bayswater, VIC, Australia). Boxes were sealed and kept at ambient temperature (22 °C) for 24 h, and dissected fruit pieces (approximately 10 mm2) were fixed in 2% paraformaldehyde and 2.5% glutaraldehyde in 0.1 M of phosphate buffer (pH 7.2) overnight at room temperature. Each sample was washed twice for 20 min with 0.1 M of phosphate-buffered saline (pH 7.2), followed by fixation for another hour in a 1% osmium tetroxide solution. Samples were dehydrated through an ethanol series (30%, 50%, 70%, 90%, and absolute ethanol) for 20 min each, followed by 1:1 ethanol:hexamethyldisilazane (HMDS) for 20 min. Finally, samples were washed three times using HMDS for 20 min each. Samples were then left to dry and coated with a carbon layer using an ion coater in a Polaron SC7640 sputter coater. Specimens were observed and photographed using a The Hitachi SU7000 (Newspec, Adelaide, Australia) field emission scanning electron microscope with an accelerating voltage of 5 kV.

2.6. Strawberry Plant Material

Certified strawberry runners (cv. Albion) were sourced from the Victorian Strawberry Industry Certification Authority (Toolangi, VIC, Australia). Runners were transplanted into five L black plastic pots (approx. 20 cm in diameter, 40 cm tall) containing standard potting mix (Osmocote, Bella Vista, NSW, Australia) and placed inside a glasshouse with an automated temperature of 22 °C, natural daylengths supplemented with artificial lighting (high-pressure sodium bulbs), a relative humidity of 60%, and an automated fertigation system that delivered a nutrient solution composed of calcium (19.3%), boron (0.5%), copper (3%), iron (4%), manganese (4%), zinc (1.5%), molybdenum (4%), potassium (28.5%), phosphorus (22.7%), magnesium (9.6%), sulfur (12.8%), and nitrogen (13.7%) twice a day until field capacity. Plants were maintained by pruning to avoid excessive foliage, the removal of dead tissue, and the occasional (less than once per month) application of pesticides against whiteflies and thrips (afidopyropen and abamectin).

2.7. Axenic Strawberry Plant Material

Strawberry plants were grown under axenic conditions in a controlled environment room with 16 h of light (fluorescent globe and high-pressure sodium bulb) and eight hours of darkness, 60% relative humidity, and a 23 °C temperature. These plants were propagated in two different ways. Firstly, seeds were collected from an Albion fruit produced in the glasshouse, and mature seeds were submerged in 98% sulfuric acid for eight minutes, then rinsed twice with sterilized ultrapure water [38] and placed in water agar at room temperature. After germination, seedlings were transferred to Murashige and Skoog (MS) Basal media with 15% agar, or into sterilized 42 mm peat pellets (Jiffy, Mirigama, Sri Lanka). Secondly, short stolon tips of less than five mm long were taken from glasshouse-grown plants, sterilized with 1% sodium hypochlorite for five minutes, then rinsed three times with sterilized reverse osmosis water. These tips were then placed in MS Basal media (Sigma, Bayswater, VIC, Australia) until they reached 10 cm in height and were then transferred to sterilized soil Coco Perlite 70/30 (Nutrifield, Sunshine West VIC, Australia) in a 140 mm diameter 1.5 L pot, watered every two days, and manually fertilized once a week as described previously.

2.8. Pathogenicity Assays—General

Before the pathogenicity assays, strains BRIP 28032a and B05.10 were grown on PDA and spores were collected to infect strawberry petals, followed by the preparation of glycerol stocks. These passaged colonies were used to inoculate leaves, fruit, and petals to track the formation of disease lesions through time. Conidia were obtained by incubation on PDA (Sigma) for 7–14 days at 22 ± 1 °C with a photoperiod of 12 h of light as described above. As a negative control, tissues were treated with commercially available Thiram (tetramethylthiuram disulfide) at a concentration of 150 g/100 L. Leaves were sprayed with fungicide using three puffs from a plastic 50 mL spray travel bottle (approximately 500 μL in total) and allowed to dry inside a laminar flow hood for one hour before inoculation with each isolate of B. cinerea. Compound fruit and petals were sprayed with fungicide until runoff and were allowed to dry in the laminar hood for 30 min. Negative controls included no fungal inoculation, growth medium alone, and no fungicide for all strawberry tissues.

2.9. Pathogenicity Assays—Leaves

All leaves were sourced from axenic strawberry plants (cv. Albion) grown in a controlled environment room. Young leaves (4–5 cm in length) were removed from plants and placed in a 60 mm × 15 mm Petri dish with water agar as described above. For each leaf, two leaflets were inoculated: the median leaflet and one of the lateral leaflets. The remaining lateral leaflet was used a non-inoculated control. Leaves were inoculated using sterile procedures with eight μL of 105 conidia/mL suspended in a 50% concentration of malt extract broth (MEB, Difco, ThermoFisher Scientific). This was because the fungus was unable to infect strawberry leaves when conidia were suspended in 1% of MEB or water. Six leaves were used for each treatment and were photographed 2, 3, 4, and 6 days post inoculation (d.p.i). Leaves were incubated at 23 °C with 12 h of light (Phillips, cool-white fluorescent globe) and 12 h of darkness.
Two methods were used to quantify the infection. The first method involved setting up a classification for RGB color (described below). The symptomatic area was delimited using thresholding in Fiji. The second method involved pixel thresholding for chlorophyll fluorescence imaging, derived from Fv/Fm values.

2.10. Pathogenicity Assays—Detached Petals

Whole flowers from non-axenic plants were collected on the day of the assay and placed in a clean beaker. Petals were carefully removed by hand inside a laminar flow hood and collected inside a small stainless-steel strainer, followed by surface sterilization using a solution of 60% ethanol and 0.6% sodium hypochlorite, and then washed three times with sterile ultrapure water. The petals were placed on a sterile stainless-steel plate, and allowed to dry for 30 min. The petals were transferred to Petri dishes containing a 5 mm layer of 2% water agar for moisture, and inoculated with four μL of a B. cinerea BRIP 28032a or B05.10 at 2.5 × 10⁴ conidia/mL in 1% MEB. The inoculum was allowed to rest for approximately 30 min inside a laminar flow hood. Petals were photographed at 0, 16, 24, and 40 h.p.i. Three independent experiments were conducted with five technical replicates of each treatment.

2.11. Pathogenicity Assays—Compound Fruit

All compound fruit were collected from glasshouse-grown plants on the morning before the assay and placed in a clean beaker. Fruit were surface sterilized inside a laminar flow hood using a solution of 60% ethanol with 1% sodium hypochlorite and gently stirred for 4 min (34). The solution was discarded, and the fruit were washed three times with sterile ultrapure water [39], the final last wash was discarded, and the fruit were placed on a sterile stainless-steel plate and allowed to dry for approximately 30 min in a laminar flow hood. Next, the calyx was removed using a sterile scalpel, and the fruit were sliced in half longitudinally. Fruit halves were placed in glass Petri dishes of 150 mm in diameter (Westlab, Mitchell Park, VIC, Australia) containing a five mm layer of 2% water agar to maintain moisture, with the inner fruit surface in contact with the agar, and allowed to sit inside the laminar flow hood for about 30 min. The two halves of each fruit were separated and placed in different Petri dishes so that different treatments could be applied to each half, thus better controlling the fruit ripeness state. Fruit were inoculated with eight μL of a BRIP 28032a or B05.10 conidia suspension containing 105 conidia/mL in 1% MEB. Nine biological replicates were used for each treatment. The inoculum was maintained for approximately 30 min inside the laminar flow hood. Lesions were measured manually using Fiji, and photographs were taken every 24 h.p.i.

2.12. Image Analysis of Infected Plant Material

Images of infected strawberry tissue (see pathogenicity assays) were taken using a Canon EOS 600D digital camera, using the manual mode and ISO of 100, f11, and a 1/10 s speed shutter. The camera was mounted on a pedestal (Kaiser RS 2 CP) directly above the samples with two halogen light bulbs on each side. Leaves, petals, and fruit were maintained inside Petri dishes to avoid external contamination. After collecting photos for all timepoints, images were processed using Fiji, converting the images to RGB color, and using the free draw tool to surround the visible infection area. A metric ruler was included in each photo and used to calibrate the scale within Fiji. Data was processed using Microsoft Excel (Microsoft 365) 20or RStudio (v 2024.12.1), and lesion areas were expressed in square millimeters (mm2) with a minimum sample size of three biological replicates.

2.13. Chlorophyll Image Analysis

Chlorophyll fluorescence imaging, derived from Fv/Fm values, is a technique used to measure the photosynthetic efficiency and health of leaves or plants. Fv/Fm is the maximum quantum efficiency of Photosystem II (PSII), where Fm is the maximal possible fluorescence value and Fv is the difference between Fm and the minimum fluorescence (Fo). Chlorophyll fluorescence was monitored using a Chlorophyll Fluorescence Imager (Colchester UK Technologica, Colchester, UK) in all infected leaves at 2, 4, and 6 d.p.i. Leaves were exposed to weak pulses of 1.66 μmol m−2 s−1 for the measurement of the Fo map image, when the PSII were in their open state, and a grayscale image was recorded. Twenty seconds later, a saturating pulse of 6239 μmol m−2 s−1 was applied for 0.8 s to image Fm, when the PSII were in their closed state.

2.14. DNA Extractions

Genomic DNA was extracted using a DNeasy Plant mini kit (Qiagen, Hilden, Germany) as reported by [40], with modifications. Briefly, the lysis buffer was substituted with a cetyltrimethylammonium bromide (CTAB) buffer containing 100 mM of Tris pH 8.0, 2 M of NaCl, 50 mM of ethylenediaminetetraacetic acid (EDTA) pH 8.0, 2.5% (w/v) CTAB, 1% (w/v) polyvinylpyrrolidone (PVP-40), and 0.2% (v/v) 2-β-mercaptoethanol added prior to use. Uninfected petals used for validation of the assay were collected on the day of the assay and quickly frozen in liquid nitrogen inside a mortar that had been previously cooled with liquid nitrogen. Plant material was ground to a fine powder (approximately 50 mg) and mixed with 700 µL of CTAB buffer, followed by thorough grinding. The sample was allowed to thaw, and immediately transferred to a 1.5 mL microcentrifuge tube, followed by the addition of 5 μL of RNAse A (10 mg/mL, Qiagen). Samples were vortexed for 10 s and incubated at 65 °C for 30 min with 800 rpm of agitation in a Thermomixer (Eppendorf, Hamburg, Germany). From this point, the protocol for DNA extraction using the Qiagen kit was followed, starting at step number three. DNA was eluted twice in lukewarm water in a final volume of 50 µL, and the DNA concentration was measured using a Nanodrop 8 (ThermoFisher Scientific). DNA samples were stored at 4 °C until used.

2.15. Fungal Biomass Quantification in Petals by qPCR

The amount of fungal genomic DNA in petals infected for 0, 16, 24, and 40 h.p.i. was measured using SYBR-green qPCR to amplify the B. cinerea Intergenic Spacer (IGS) region using primers reported previously [41] (forward primer: 5′-GCTGTAATTTCAATGTGCAGAATCC-3′; reverse primer: 5′-GGAGCAACAATTAATCGCATTTC-3′), relative to the strawberry actin gene (forward primer: 5′-CGAGGCTCAATCCAAAAGAG-3′; reverse primer: 5′ GGGGCCTCAGTTAGGAGAAC-3′). Actin primers were designed using Geneoius version 2023.0.4. Both primer sets were synthesized by Bioneer Pacific. qPCR reactions of 10 µL were prepared in 384-well plates (ThermoFisher). Individual wells contained 5 µL of 2X PowerUp SYBR-green master mix (ThermoFisher), 1 µL of forward and 1 µL of reverse primer (900 nM each), 1 µL of the genomic DNA template, and 2 µL of nuclease free water (Promega, Madison, WI, USA). A stock containing all reaction components was prepared and aliquoted into the qPCR plate to minimize pipetting error. Four technical replicates were included for all samples. To quantify fungal DNA in infected petals, healthy plant and mycelial fungal DNA samples of known concentrations were serially diluted at 1/10, 1/100, 1/1000, and 1/10,000, and included in each qPCR experiment as a standard curve, along with a no-DNA-template control. Samples were amplified using the Standard Curve preset in a QuantStudio5 thermocycler (ThermoFisher) as follows: 50 °C for 2 min, 95 °C for 2 min, 40 cycles of 95 °C for 15 s, 52 °C for 15 s, and 72 °C for 1 min. After each run, a melting curve was generated by heating to 95 °C (1.6 °C/s), cooling to 60 °C for 1 min, and heating to 95 °C for 15 s (1.6 °C/s). The Ct value of the unknown samples was extrapolated from the standard curves, and the normalized amount of B. cinerea DNA was calculated by dividing the fungal DNA by the plant DNA for each sample, as reported by Suarez et al., 2005 [41]. Data (Table S1) were analyzed using the software Design and Analysis 2.6.0 (ThermoFisher).

2.16. Statistical Analysis

Data were assessed for normality and homogeneity of variance using the Shapiro–Wilk and Bartlett tests, respectively. To evaluate differences between the wild-type BRIP 28032a and the GFP-expressing transformant, a two-sample t-test was conducted with a significance level of p ≤ 0.05 to determine differences between means. For analyzing leaf infection across different treatments and days after inoculation, a Kruskal–Wallis one-way ANOVA was used, followed by Tukey’s honest significant difference (HSD) test to identify differences between groups if ANOVA indicated significant differences.

3. Results

3.1. B. cinerea GFP Transformant Has Typical Morphology and Pathogenicity

To more clearly visualize the infection of B. cinerea in different tissues of strawberry, a GFP-expressing transformant with a normal morphological appearance and growth rate (Figure 1A,B,E,F and Figure S1) was selected from 21 primary transformants and compared to the wild type isolate BRIP 28032a. Most transformants stably expressed GFP and nine were examined for the production of conidia. The selected GFP transformant had uniform fluorescence in mycelia (Figure 1G). For the selected transformant, no statistically significant differences in pathogenicity were observed compared to the wild type in detached petals at 48 h.p.i. (Figure 1D,H,I).

3.2. Microscopy Reveals Different Modes of B. cinerea Penetration in Strawberry Tissues

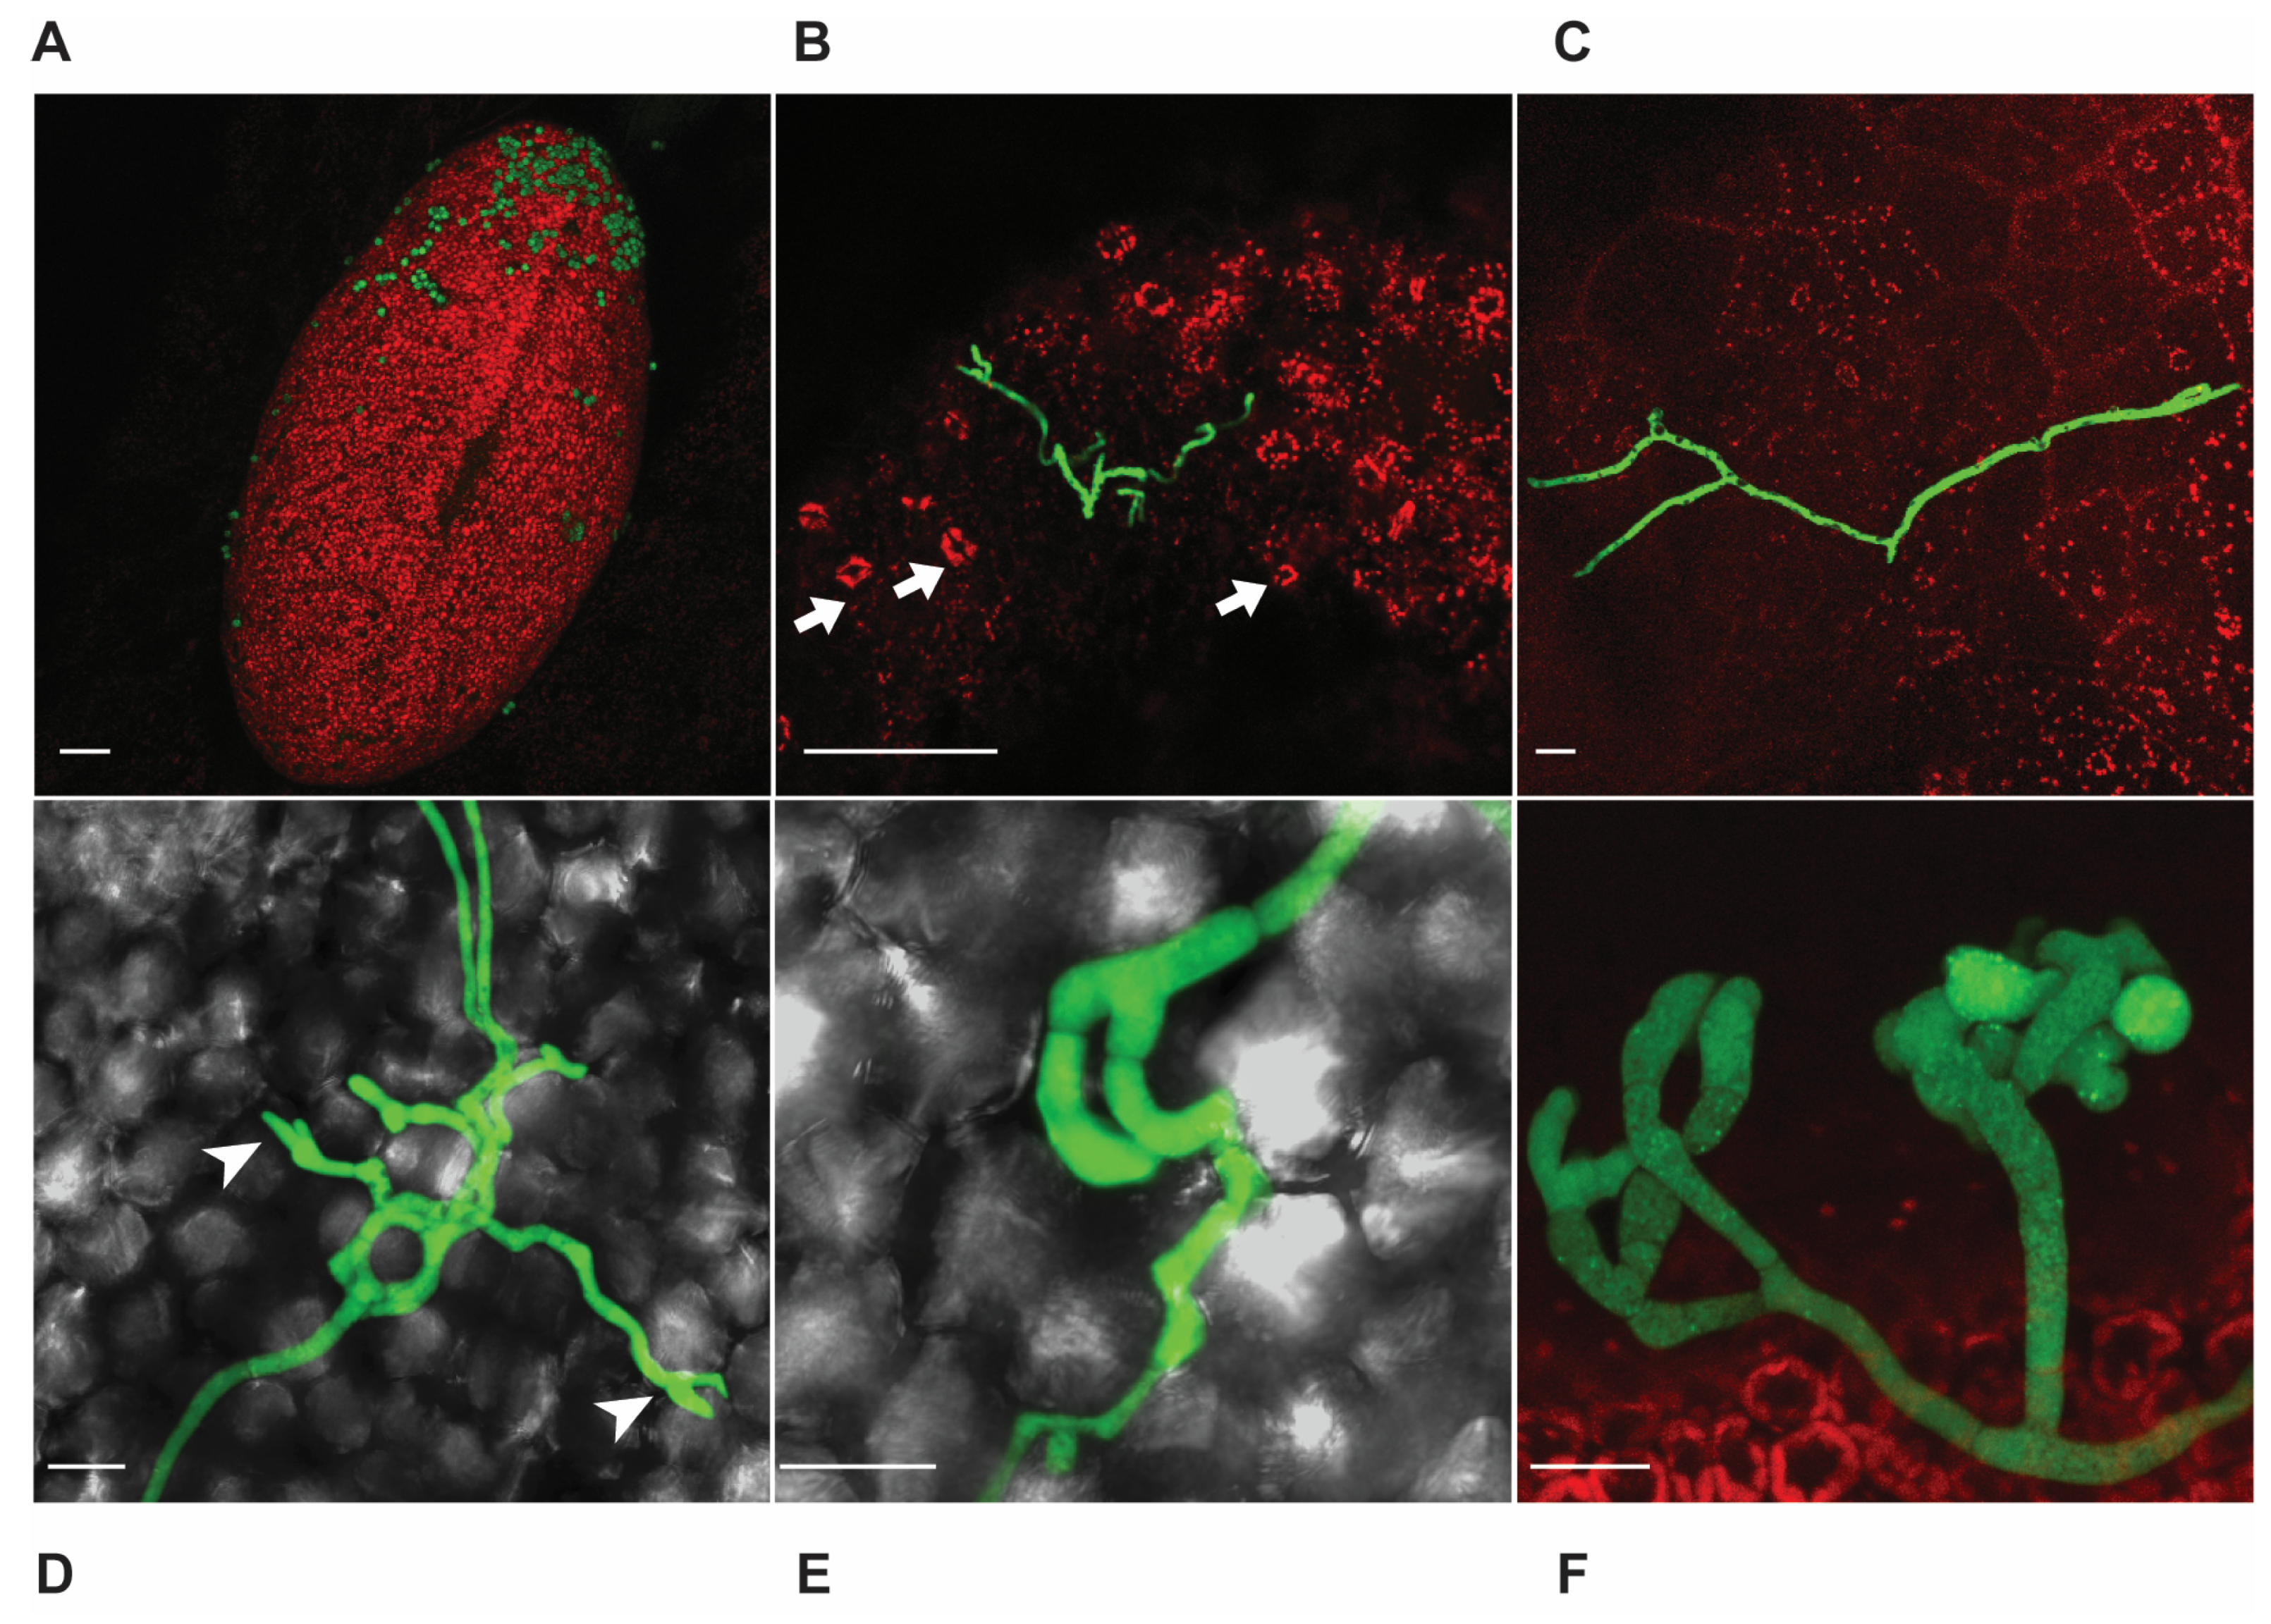
Using confocal microscopy, the surface of strawberry achenes was visualized, possibly suggesting the presence of trichome bases, which fluoresce green (Figure 2A), and stomata, which fluoresce red (Figure 2B, white arrows). In fruit infections, germinations of conidia were noted on the achene surface near stomata (Figure 2B). In contrast, in fruit receptacle tissue, conidia germinated and hyphae grew on the surface of the receptacle, without any observed production of appressoria or infection cushions (ICs) (Figure 2C). Germinated conidia of B. cinerea were observed on the surface of both leaves and petals, forming hyphae and ICs (Figure 2D–F). In petals, penetration began at 24 h.p.i (Figure 2D,E), whereas in leaves, it was observed as early as 48 h.p.i with the formation of ICs (Figure 2F).
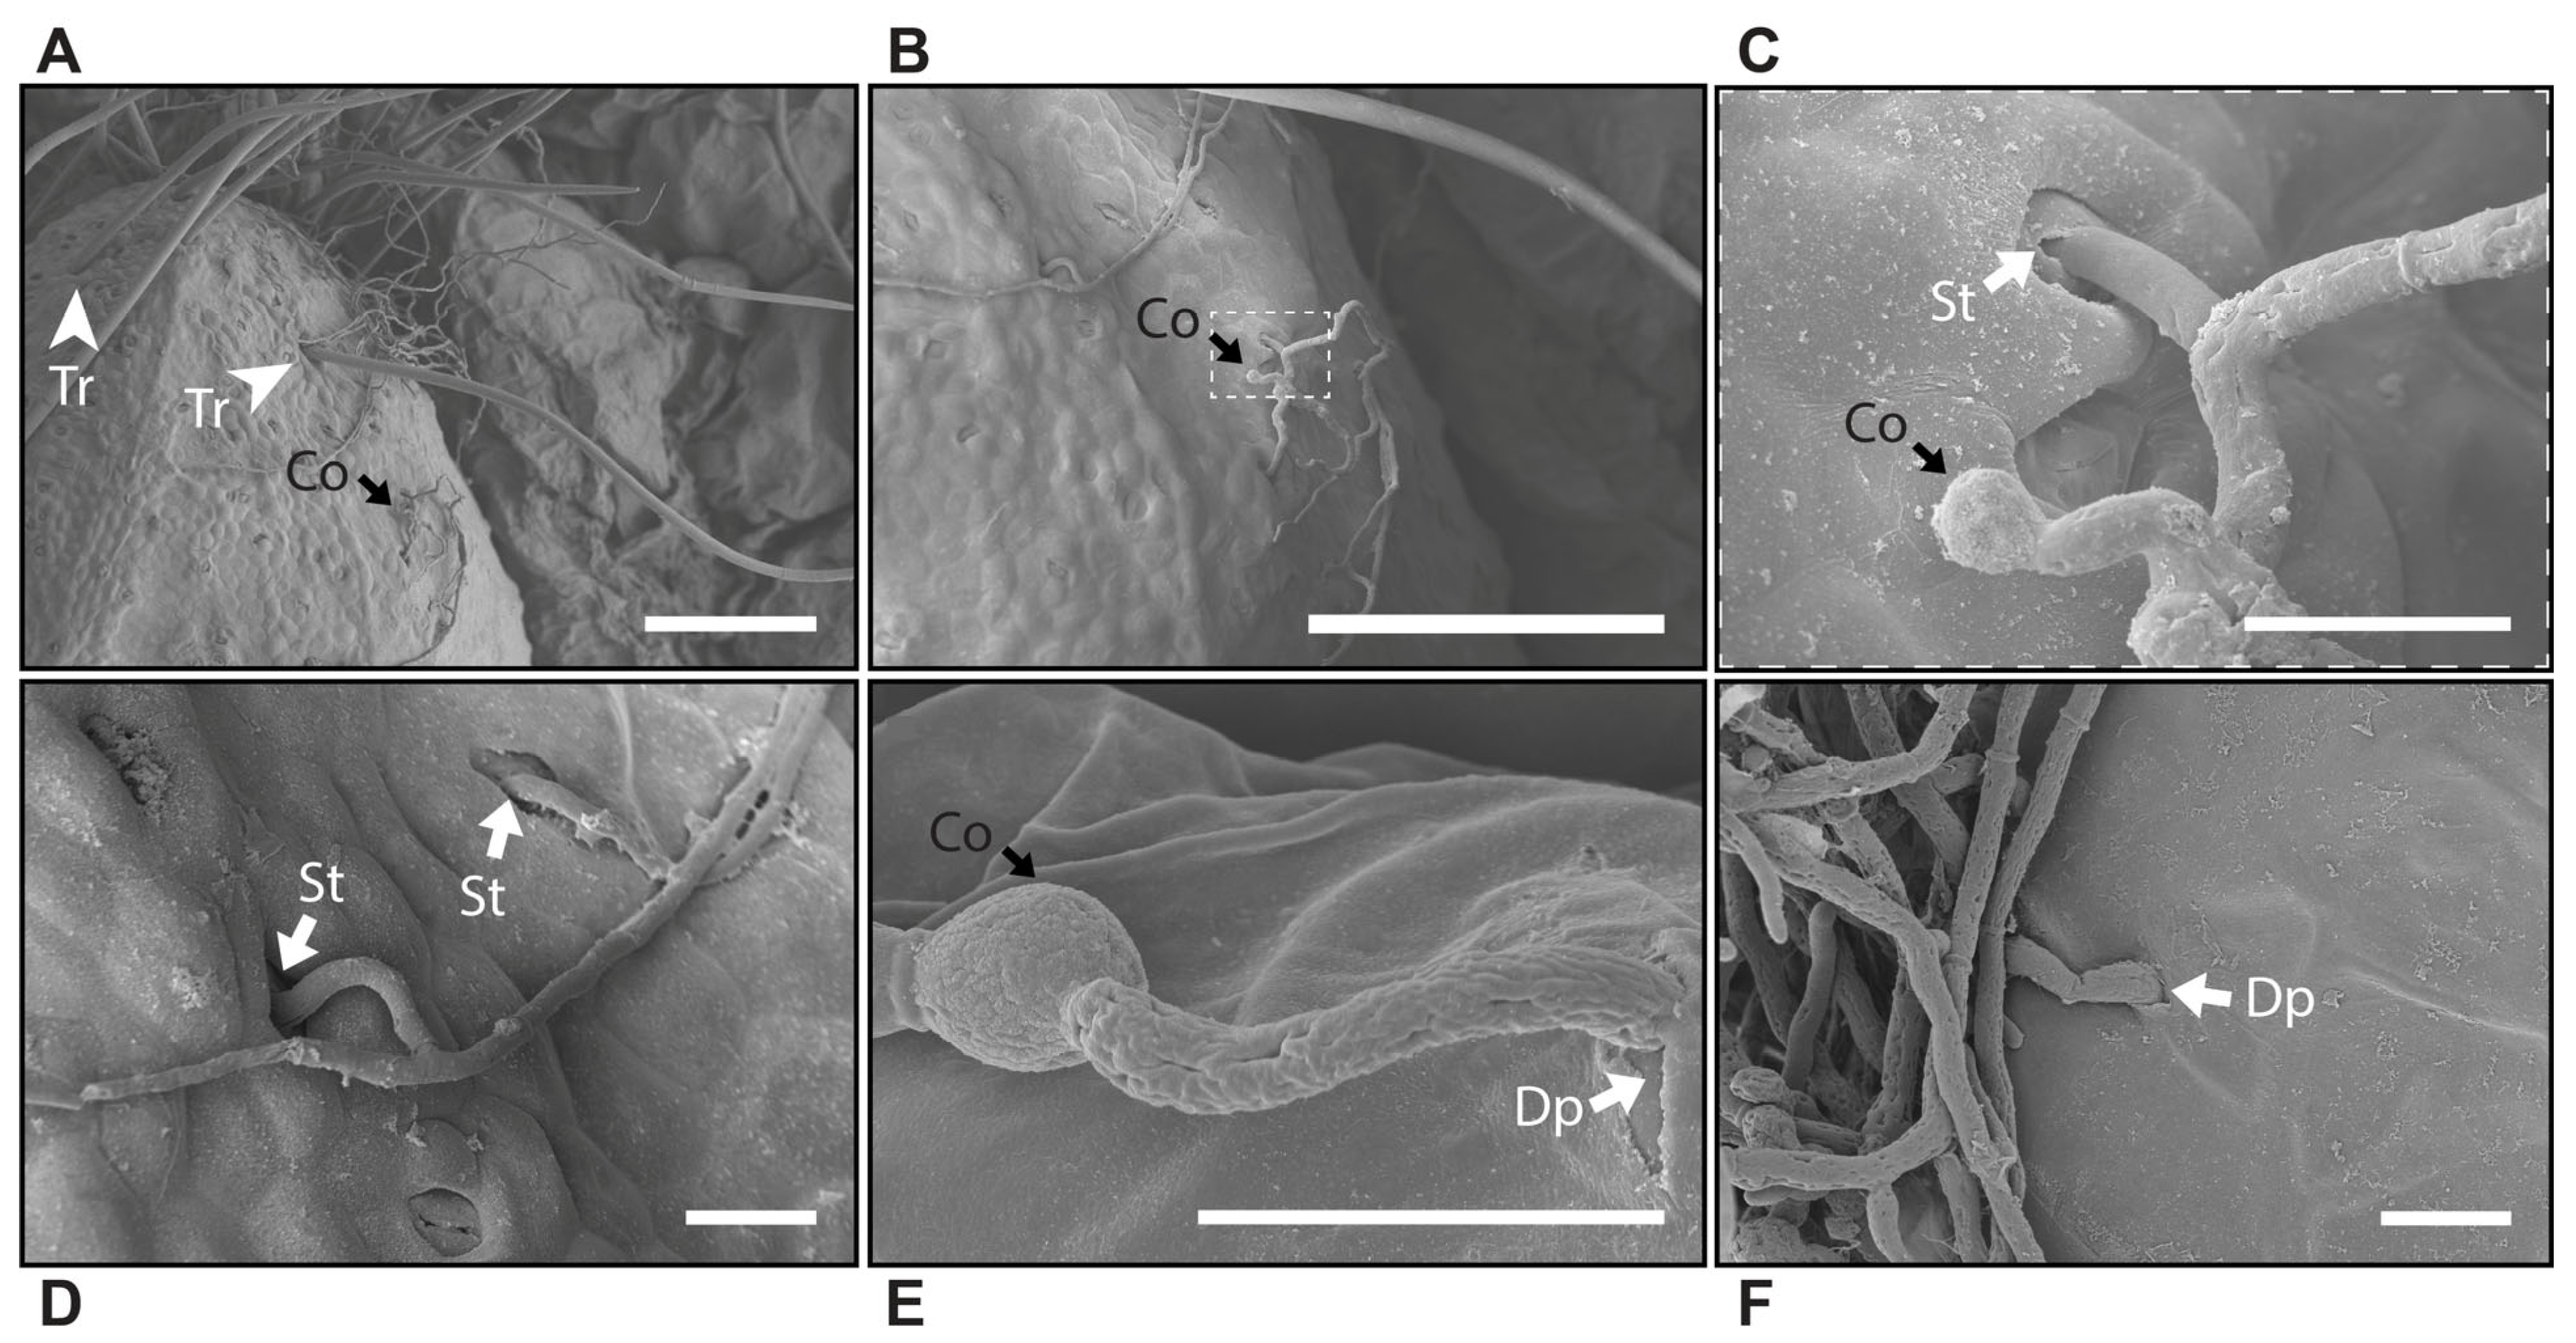
To clarify the infection mechanism of B. cinerea in strawberry fruit, scanning electron microscopy was utilized. The achenes of the cv. Albion displayed several stomata (Supplementary Figure S2), corroborating the observations from confocal images (Figure 2D,E). Conidia germination on the achene surface was observed (Figure 3A,B), with frequent penetration of hyphae through the stomata (Figure 3C,D). In contrast, hyphae of B. cinerea penetrated directly through the receptacle of fruit tissue (Figure 3E,F).

3.3. In Vitro Assays Allow for a Sensitive Measurement of B. cinerea Disease Progression

To better quantify the progress of infection by B. cinerea in strawberry, we utilized several improved assays for monitoring disease progression. In detached leaf assays at 2 d.p.i. using two B. cinerea isolates, B05.10 and BRIP 28032a, disease was visible using conventional RGB and chlorophyll fluorescence imaging methods (Figure 4A). Notably, the B05.10 isolate exhibited a faster infection rate than the BRIP 28032a isolate in leaves and other tissues. Using the RGB color method, the diseased tissue appeared as brown, while in the chlorophyll fluorescence method, it appeared as yellow, and the diseased tissue showed Fv/Fm values below 0.75 by 2 d.p.i. Since Fv/Fm indicates the maximum quantum yield of PSII, low values reflect reduced photosynthetic efficiency, and in this case, disease caused by B. cinerea. Chlorophyll fluorescence showed not only quantitative but also qualitative observations in the infection of leaves with both isolates. By 6 d.p.i., some of the disease had started to reach the border of the leaf. In all assays, control leaves were free of significant background infections (Supplementary Figure S3).
Analysis of the chlorophyll fluorescence data showed that for leaves inoculated with either isolate of B. cinerea, the value of Fv/Fm of some pixels started to decrease by 2 d.p.i. (Figure 4B). In this case, the values representing disease were considered to be below 0.75 (highlighted with brown), compared with the control, which only had media and no conidia of B. cinerea (Figure 4B). Infection with the strain BRIP 28032a showed some Fv/Fm values close to 0 at 2 d.p.i, while for B05.10, those values only started at 4 d.p.i. On the other hand, inoculation and treatment with the fungicide Thiram maintained Fv/Fm at high values compared with the inoculum-only controls. Values of Fv/Fm did not decrease in the Thiram treatment with B05.10 until 6 d.p.i. compared with Bc20832a, which started to slightly decrease from 2 d.p.i.
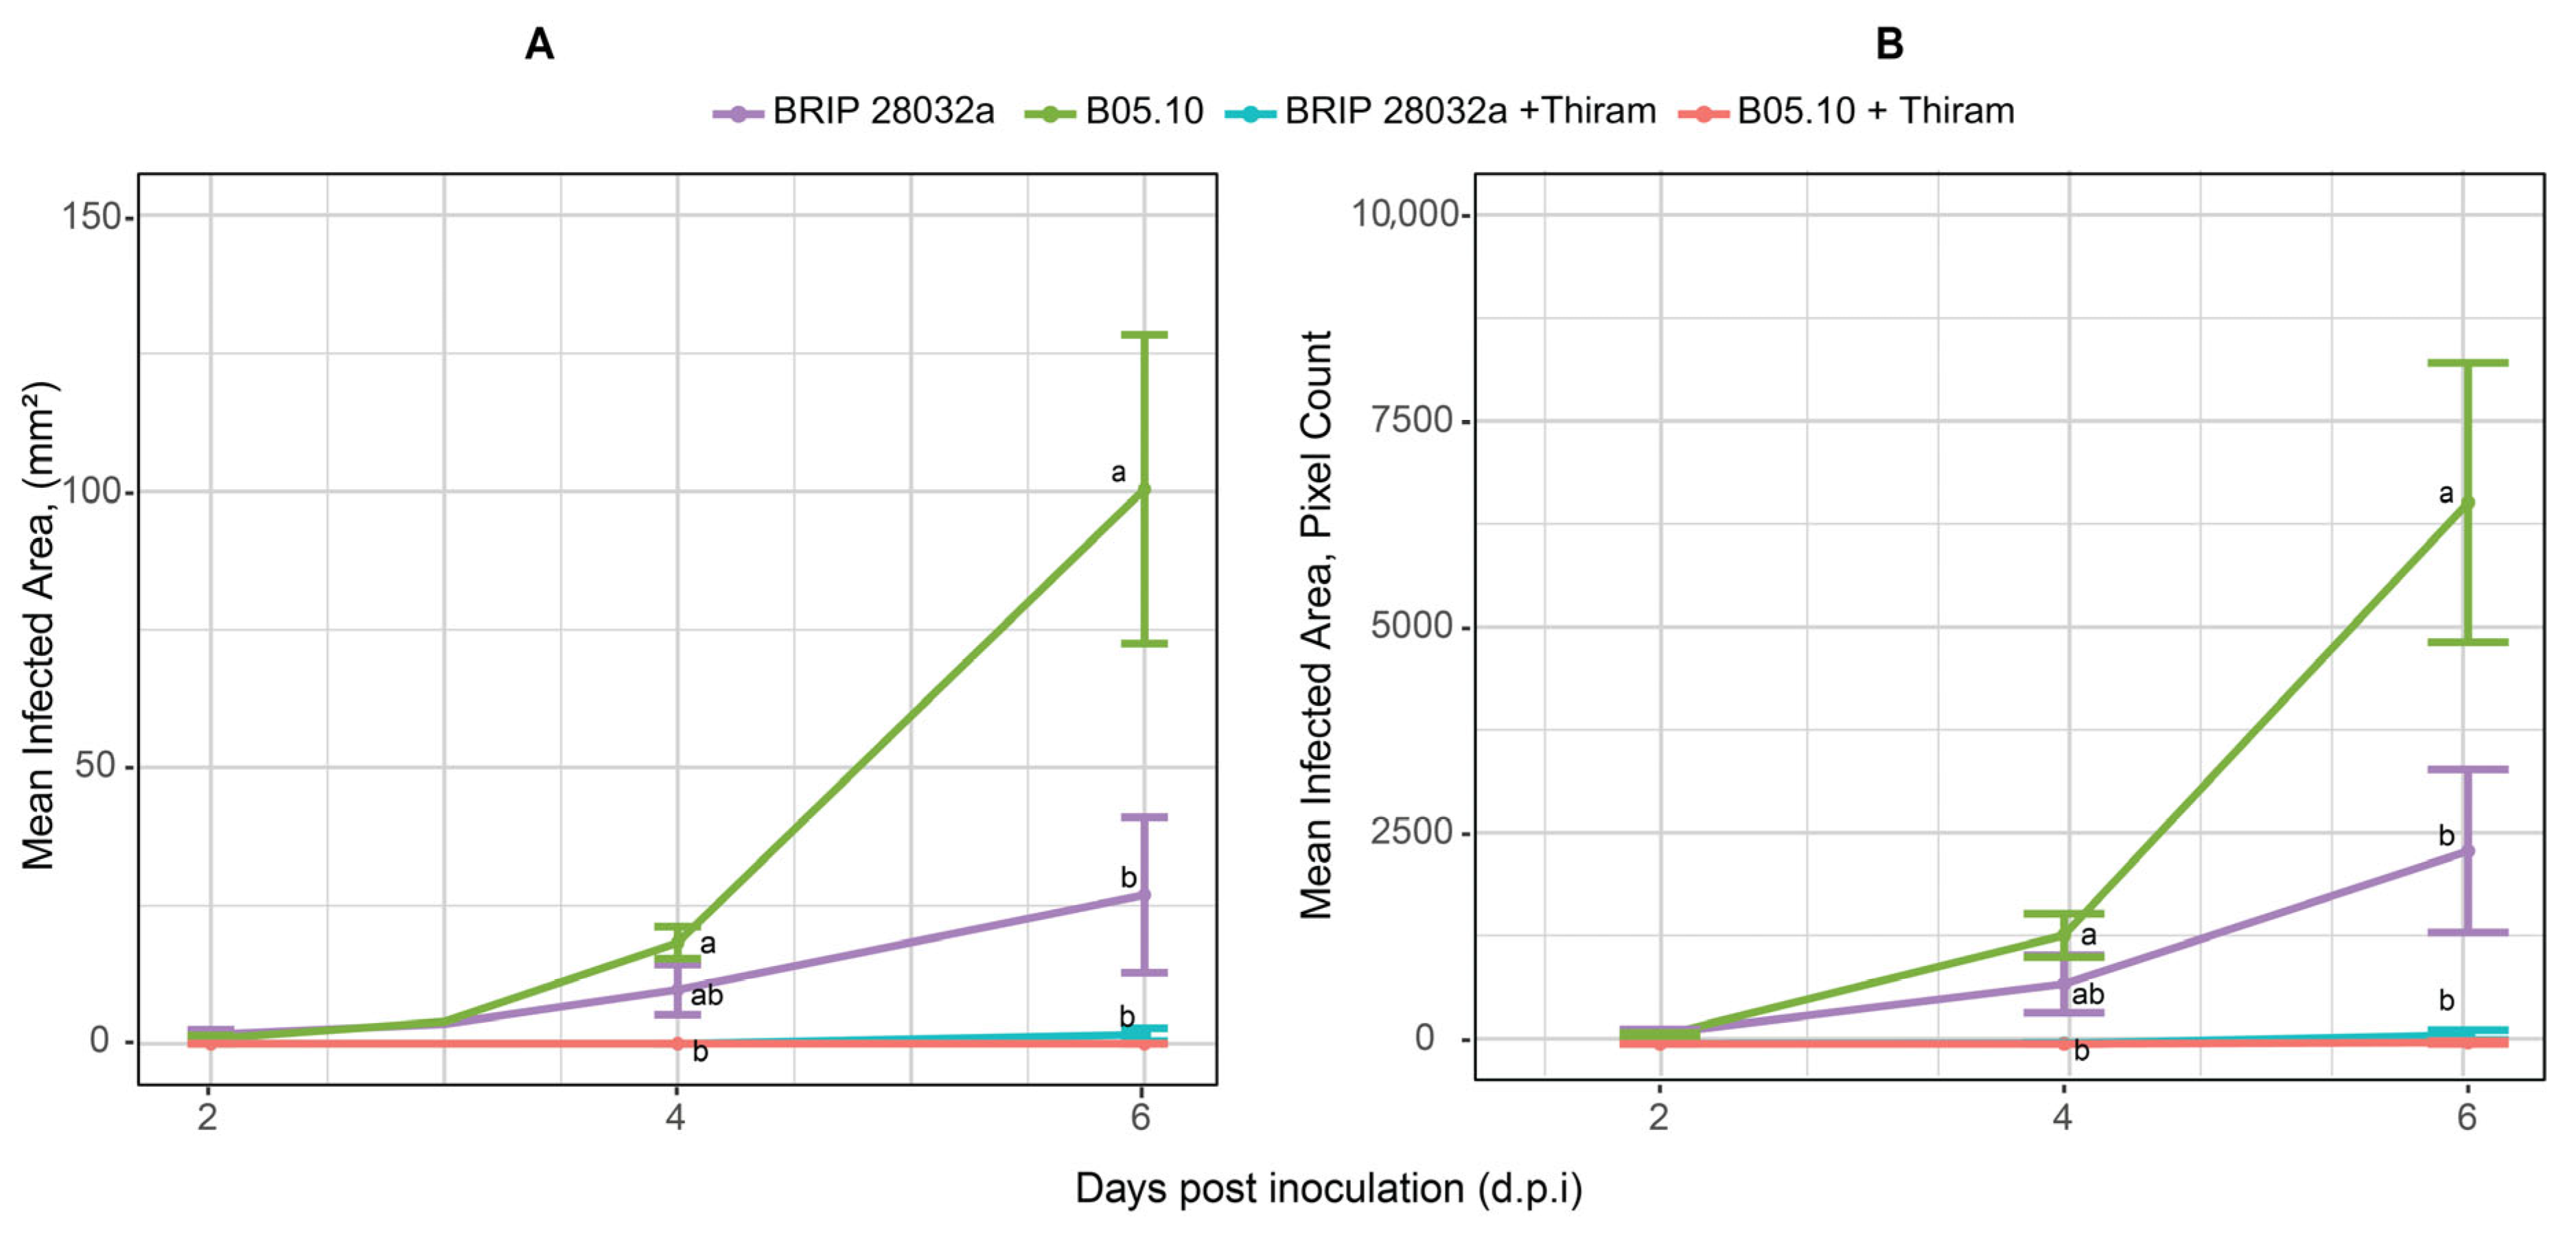
To compare disease progress, Fiji was used to measure lesion area in mm2 based on the RGB method (Figure 5A), and pixel count based on the chlorophyll fluorescence method (Figure 5B). For all four treatments, the trend and statistical analysis were similar each day, irrespective of the method used to assess disease. Significant differences in disease first occurred between treatments at 4 d.p.i. Thiram significantly reduced disease in leaves inoculated with the B05.10 isolate (from approximately 20 mm2 or 1250 pixels to zero), but not in those inoculated with the BRIP 28032a isolate, where disease began at 6.d.p.i. Also, at 4 d.p.i., there was no statistical difference in disease between leaves inoculated with the two isolates. However, at 6 d.p.i. inoculation with the B05.10 isolate showed significantly greater disease compared to BRIP 28032a (3-fold to 1.5-fold increase for the RGB and chlorophyll fluorescence methods, respectively).
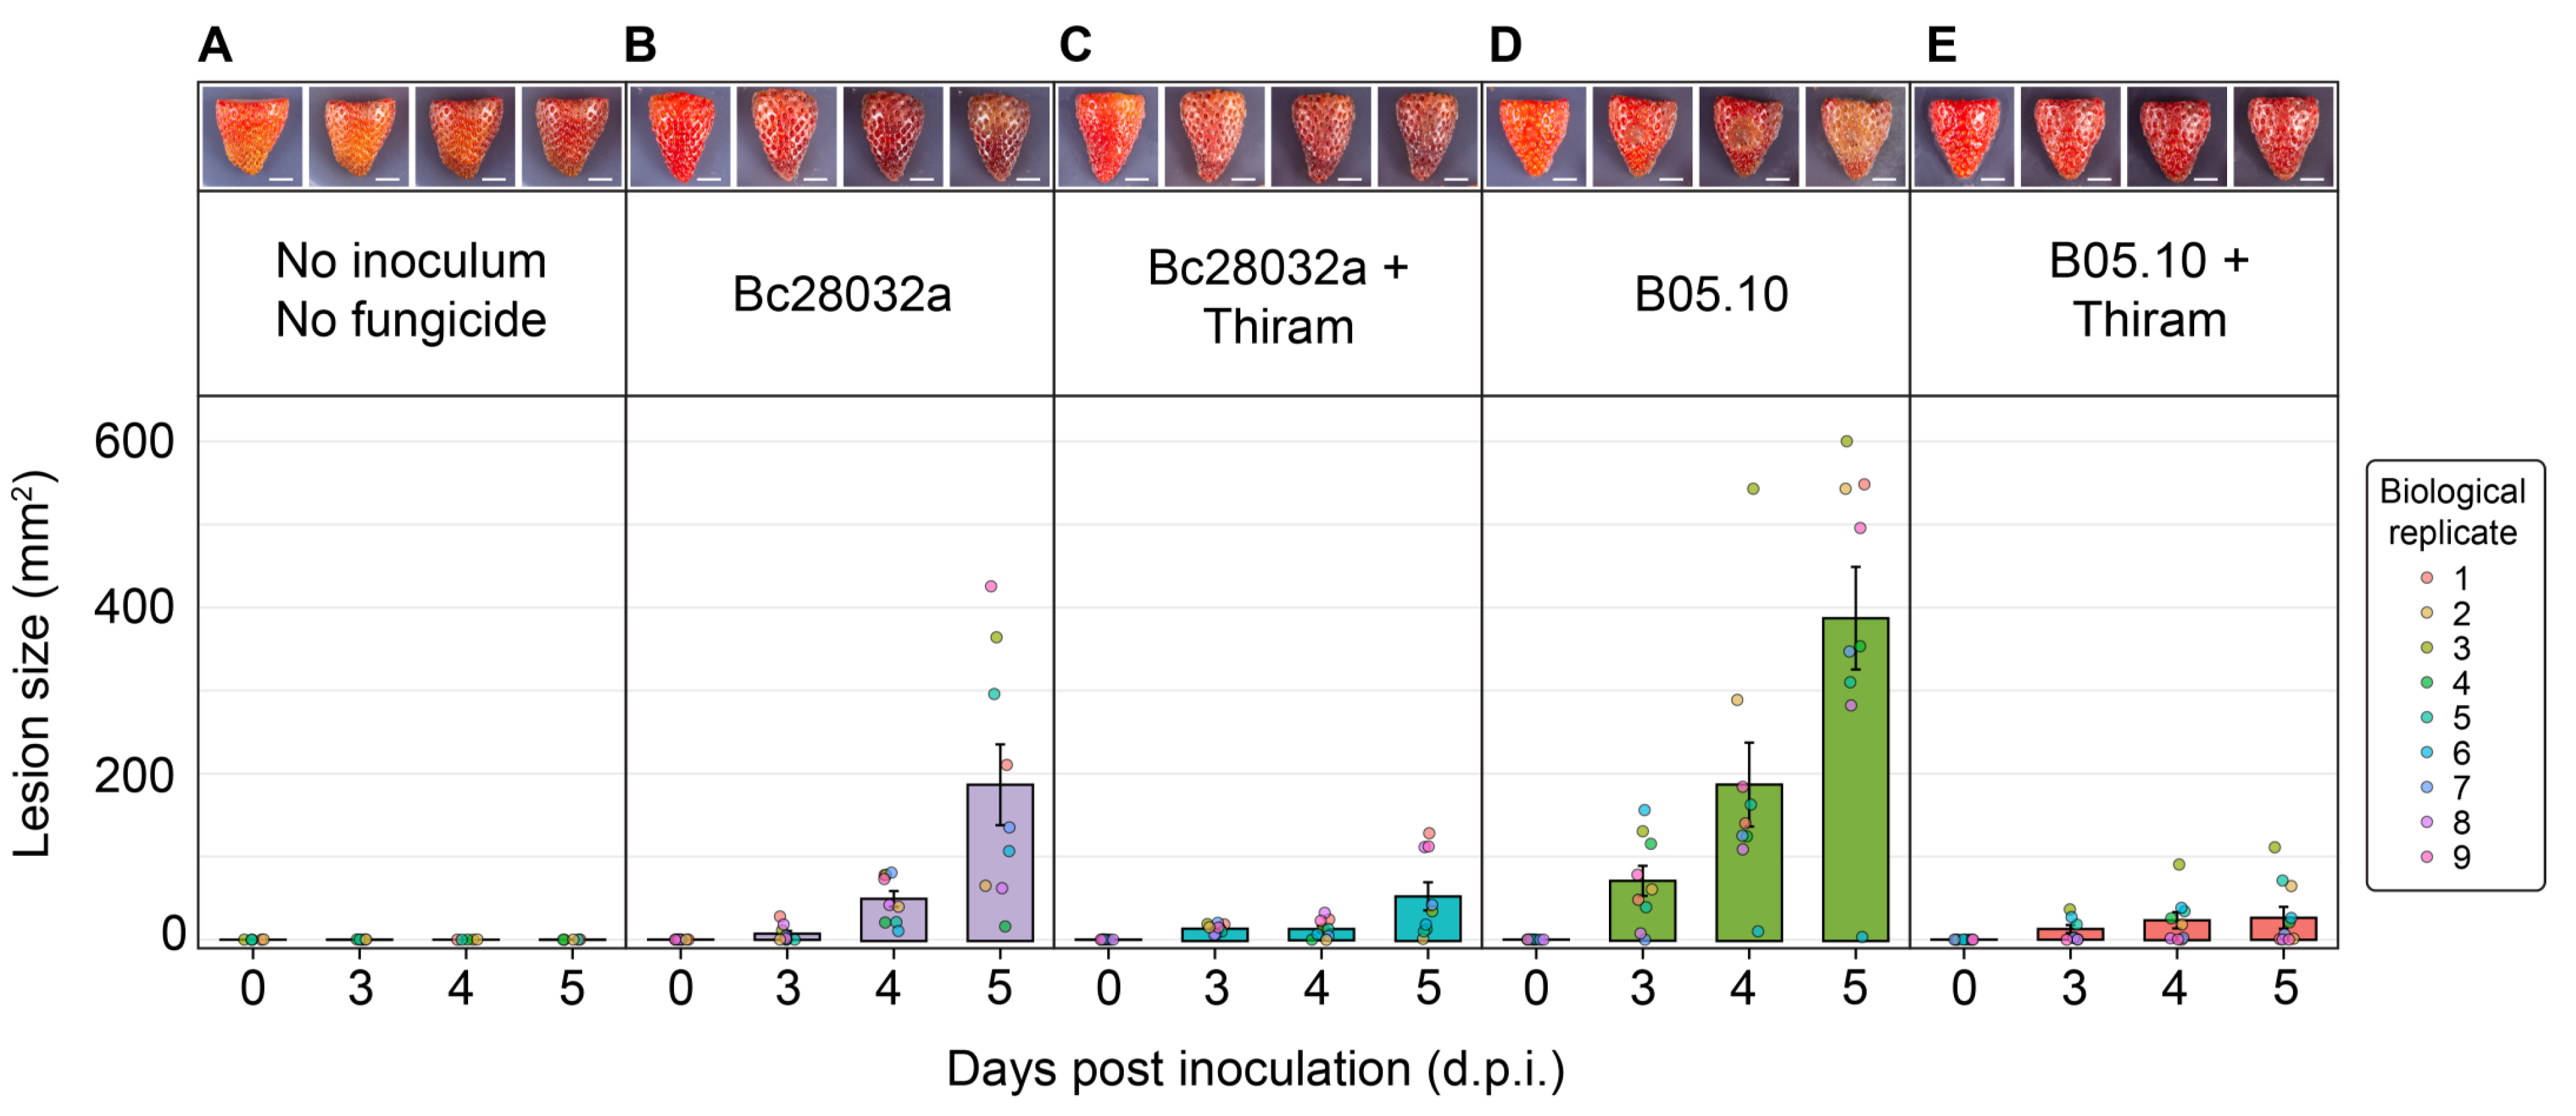
In the fruit assay, lesions became visible at 2 d.p.i. for B05.10 and BRIP 28032 (Figure 6). Thiram led to reduced lesion sizes at 5 d.p.i. from an average of 188 mm2 for BRIP 28032 (n = 9) and 388 mm2 for B05.10 (n = 9), down to 53 and 26 mm2, respectively, after the fungicide treatment (reduction of 72 and 93%, respectively). No significant lesions or fruit decay were recorded for uninoculated fruit (n = 5).
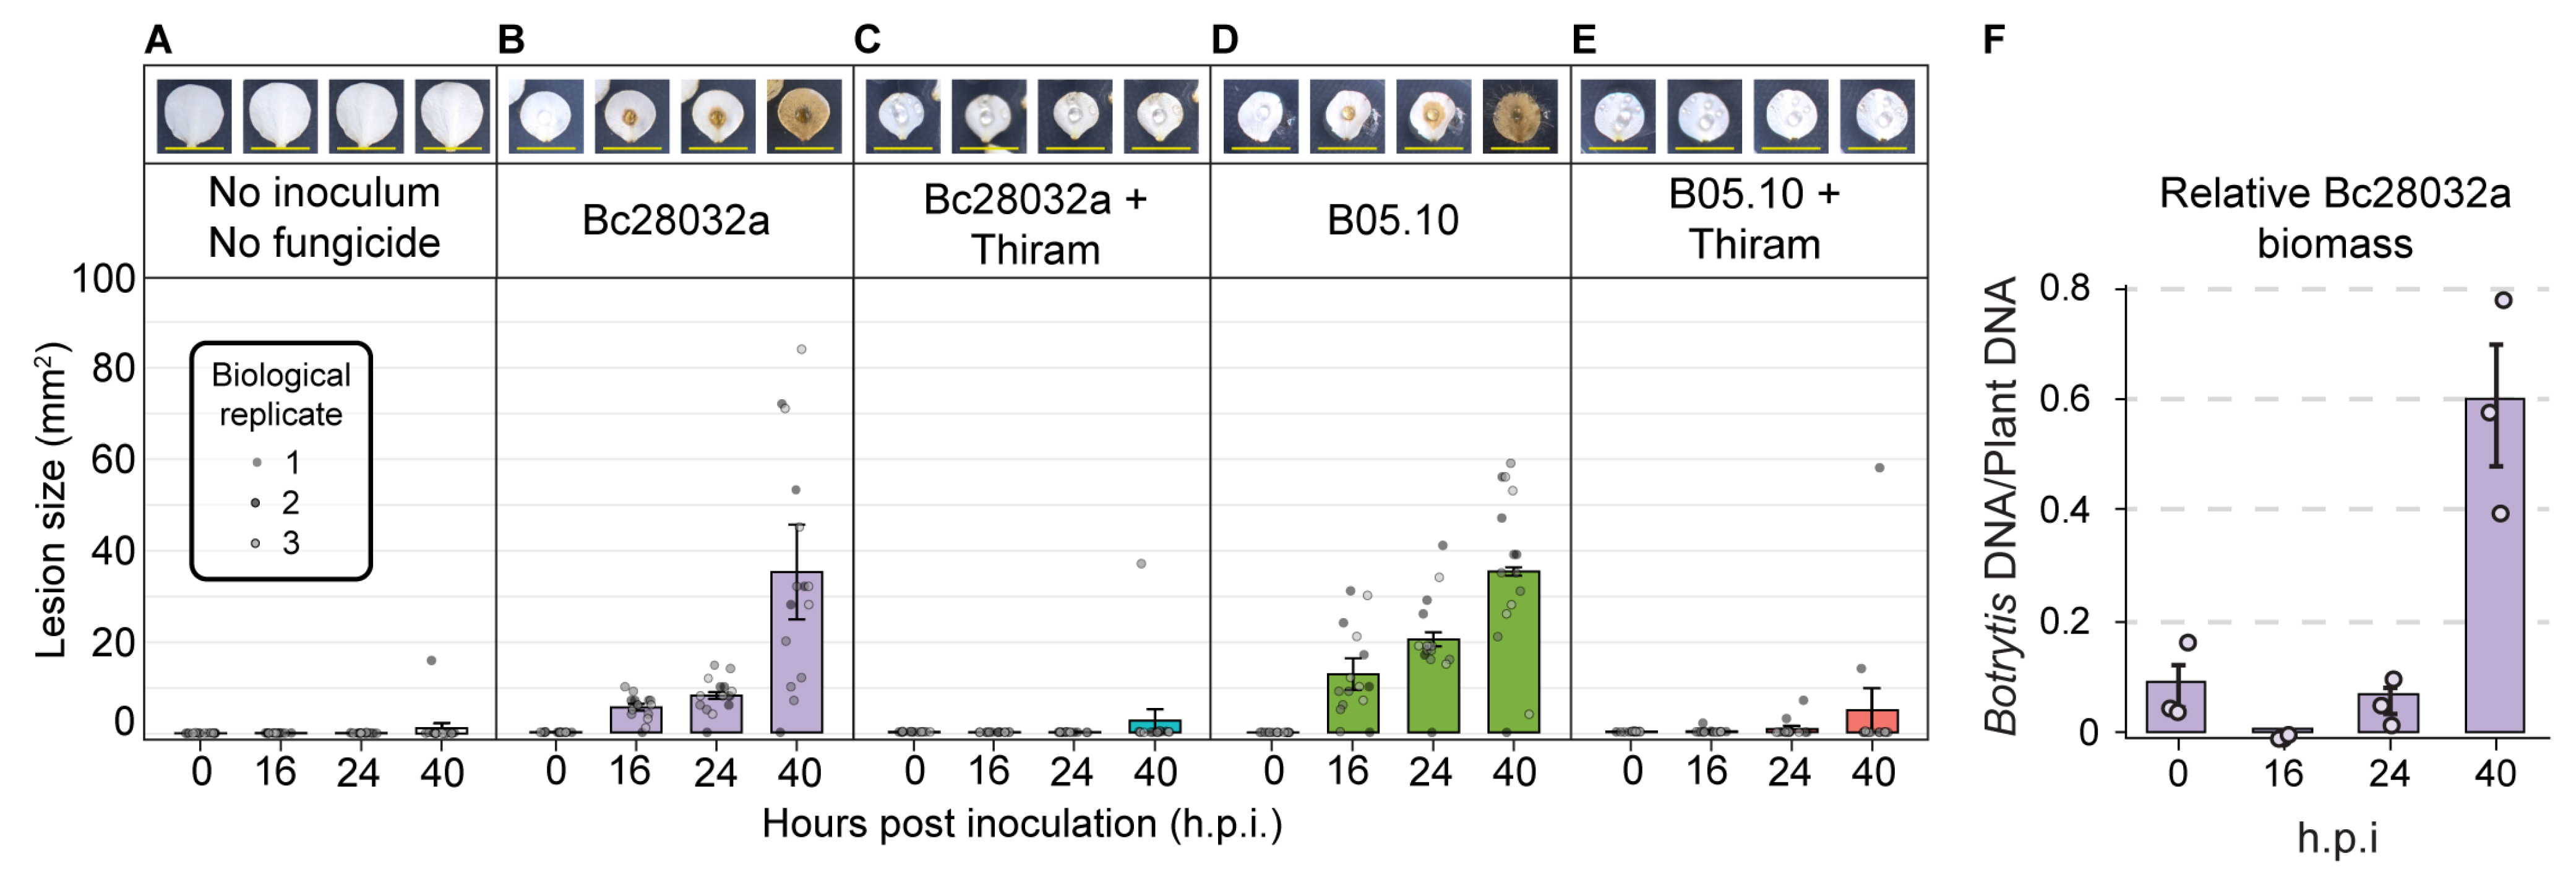
At 16 h.p.i. in the strawberry petal assay (Figure 7), B05.10 and BRIP 28032a caused an average lesion of 13.6 mm2 and 5.8 mm2, respectively, while at 24 h.p.i., these became 21.8 mm2 and 8.6 mm2, respectively. Both isolates caused disease across the entire petal at 40 h.p.i. (Figure 7B,D). B05.10 and BRIP 28032 had a lesion reduction of 88% and 94% when the petals were treated with Thiram at 40 h.p.i. (Figure 7C,E), and no significant background infections were detected in petals that were not inoculated with fungal conidia (Figure 7A), even after 72 h.p.i (Supplementary Figure S4). We also tested a whole-flower assay that successfully recorded infections with the isolates. However, in the un-inoculated control, petals started to naturally detach after approximately 40 h.p.i. Despite this, flowers and petals in the control were free of significant background infections (Supplementary Figures S4 and S5). The B. cinerea intergenic spacer (IGS) region and strawberry ACTIN (reference gene) yielded single PCR amplicons at the expected sizes of 95 and 158 bp, respectively (Supplementary Figures S6 and S7). The R2 and efficiency of the qPCR reactions were 0.998 and 88.2%, respectively, for IGS, and 0.986 and 96.6%, respectively, for ACTIN (Supplementary Figure S8). The Ct values for the unknown IGS samples ranged from 19 to 35, while the actin samples ranged from 20 to 28 (Supplementary Table S1). All unknown samples were quantified and produced single peaks when running control melting curves (Supplementary Figure S7). The amount of fungal genomic DNA was normalized according to Suarez et al. [41]. and expressed as Botrytis genomic DNA relative to strawberry ACTIN DNA (Figure 7F). The amount of fungal IGS decreased from 0.9 ng at 0 h.p.i. to 0.005 ng at 16 h.p.i. before increasing exponentially to 0.06 and 0.6 ng at 24 and 40 h.p.i., respectively (n = 3 for all timepoints). At this point, the petals became completely diseased, as shown in the previous section (Figure 7, 40 h.p.i.). A two-tailed pair-wise t-test (unequal variance) revealed significant differences in the biomass at 40 h.p.i. compared with that at 24, 16, and 0 h.p.i (p < 0.05).

4. Discussion

We demonstrated for the first time that in strawberry, B. cinerea infects through the stomata on the achenes and by direct penetration through the receptacle of the compound fruit. Our adapted pathogenicity assays and qPCR methods led to the rapid quantification of lesion size and relative fungal biomass. Similar assays have been used individually in other hosts, but the uniqueness of the current study was the adaptation of these protocols to the B. cinerea–strawberry pathosystem, as well as the simultaneous assessment of leaves, petals, and compound fruit. The assays were sensitive enough to detect differences in isolate pathogenicity, and responded well to a fungicide control, offering an integrated methodology to screen crop protection agents and new strawberry genotypes against B. cinerea.
Early detection of Botrytis infection is critical for strawberry growers to enable targeted fungicide applications, thereby minimizing the risk of resistance development and preventing disease dissemination [42]. The primary and secondary phases of the infection in the B. cinerea–strawberry pathosystem have been described elsewhere [14]; however, the modes of fungal penetration have only been characterized in the leaves of the strawberry cv. Redcoat [25]. To date, no clear documentation of this process has been reported for petals or fruit. Here, we obtained consistent infections by inoculation using conidia suspensions. Because infections were considerably slower in leaves and fruit (lesions visible at 48 h.p.i.) compared with petals (<16 h.p.i.), we changed the concentration of the growth medium used to inoculate leaves (50% MEB), compared to fruit and petals (1% MEB). The differences in the pathogen colonization of strawberry tissues are explained by their composition and structural changes across time. For instance, cutin and wax decrease as the receptacle enlarges, causing the thinning of the cuticle. The receptacle cell wall also undergoes changes, mainly the depolymerization of pectin. Thus, the receptacle becomes more susceptible to pathogen penetration [43,44]. In contrast, the cuticle of the leaves is thicker and remains relatively unchanged across time [45]. Notably, a strawberry leaf mutant that overproduced epicuticular leaf waxes might improve resistance to B. cinerea, although no direct leaf infection assays were performed [45]. In this context, the hard cuticle and other protective layers of mature leaves might suppress artificial infections, which is why we employed and recommend young leaves in further studies that focus on this tissue as a site of fungal infection. It is also important to use methods that minimize the risk of background infections in the leaves; hence, the use of axenically produced plants is recommended.
Microscopy revealed the formation of fungal infection cushions (ICs) on the surfaces of strawberry leaves and petals at 48 h.p.i and 24 h.p.i, respectively. The formation of ICs has been well documented in B. cinerea in vitro and in other hosts [46,47,48], but to the best of our knowledge, there are no published images of ICs on leaves or petals of strawberries. This contrasts with a previous report in which B. cinerea formed appressoria at 24 h.p.i in leaves and the first visible signs of cell death were observed at 48 h.p.i on cv. Redcoat [25]. Although Redcoat is commonly used in plant pathology research [25,49,50], it is not a current commercial cultivar for strawberry production, unlike the cv. Albion [50]. ICs are formed in areas of tissue without cuticle disruptions, suggesting that ICs enhance pathogen penetration [27]. In ICs, hyphal growth is decreased, followed by the branching of the apex hypha and the growth of parallel or low-intertwined hyphae [26]. This is in line with our observation that ICs were observed on infected leaves and petals but not on the receptacle. More advanced techniques have revealed that there are upregulated genes and proteins during IC formation, indicating that these structures support fungal virulence [27].
SEM revealed that B. cinerea penetrates through achene stomata in strawberry. While stomata have previously been reported in the receptacle of strawberry [51,52,53], the current study is, to our knowledge, the first report of the presence of stomata in the strawberry achene. Stomata are present in seeds and achenes of other plant species but are poorly documented [53,54], and the role of achene stomata in the penetration of fungal pathogens has not been investigated. In seeds, stomata contribute to imbibition, gas exchange and potentially to water entry [55,56]. We employed a single strawberry cultivar (cv. Albion) in our study, so it is possible that other strawberry genotypes have different distributions of achene stomata. For example, strawberry cultivars differ in stomatal density in the leaf, which can explain their susceptibility to salinity [57]. Therefore, investigating if there is a connection between achene stomata and susceptibility to B. cinerea infection presents an important future research question.
SEM also revealed direct hyphal penetration through the receptacle, which agrees with previous studies in other hosts [58,59], but we found no reports for strawberry. During ripening, cell walls disassemble, softening tissues and reducing mechanical barriers such as the cuticle [15,60,61]. The thinning and cracking of the cuticle during this process further facilitates pathogen entry, either through enzymatic degradation by cutinases or via direct physical damage [62,63]. These observations highlight the susceptibility of ripening fruits to fungal pathogens and support existing studies on B. cinerea pathogenesis. Future studies should investigate the mechanisms behind direct penetration in different strawberry tissues. Potential mechanisms that explain this direct penetration include the B. cinerea secretome, the generation of conidia by superficial colonies, and the formation of penetration structures [64,65]. In other hosts, the fungus directly penetrates the receptacle surface through the secretion of enzymes that include exo- and endopolygalacturonases (BcPG1, BcPG2, BcPG3), cutinases, hemicellulases, cellulases, glucosyltransferases, lipases, and proteases including BcAP8. In a proteomic study, BcAP8 was the most abundant protease secreted by B. cinerea in media containing kiwifruit, tomato, and strawberry [66]. The BcAP8 protease constitutes almost 25% of the proteinase activity of B. cinerea but, notably, it is not essential for virulence [66].
Tracking the development of disease lesions through the leaf, petal, and fruit of strawberry revealed that the B05.10 isolate of B. cinerea (from grape) was more aggressive than BRIP 28032a (from strawberry). Both isolates were equally maintained and passaged through host tissue, so these cultural factors do not explain differences in their aggressiveness in strawberry tissues. Differences in saprophytic and necrotrophic growth imply quantitatively different virulence mechanisms in B. cinerea isolates [67] and might contribute to the variance in disease between the isolates tested in this study. Additionally, genetic variability between isolates and their respective virulence factors may explain differences in infection; a phenomenon that has been reported previously [68,69]. Other explanations include differences in growth rate or the presence of mycoviruses, which can impact fungal pathogenicity [70]. The B05.10 isolate is reportedly free of viruses [71], thus a comprehensive mycoviral screening of isolates with varying aggressiveness levels could elucidate the role of viral infections in modulating B. cinerea pathogenicity.
The nutrient concentration in the inoculum influences the length of the B. cinerea germ tubes, likely by enhancing the basal metabolism and accelerating polarized growth [66]. We observed that before 48 h.p.i., B. cinerea began growing in the inoculum medium but did not necessarily penetrate the leaf, which could confound the subsequent assessment of the genuine infection. To address this, we utilized a chlorophyll fluorescence method to identify when the pathogen affected the function of photosystem II in the leaf. The sensitivity of chlorophyll fluorescence to biotic factors is an effective method for understanding destructive changes in chloroplasts and photosystem II caused by fungal infection [30,72,73]. The reduction in Fv/Fm values due to pathogen attack correlated with an increase in lesion size, where infected areas appeared as yellow/orange with Fv/Fm values approaching zero. Disease symptoms in our assay were detectable at 48 h.p.i, consistent with other studies [74]. This method has been used to detect B. cinerea infection in strawberry leaflets [30], using mycelial plugs rather than spore inoculation. The size of the agar plug may interfere with the earliest detection of leaf penetration; thus we consider spore inoculation to be a superior approach. Chlorophyll fluorescence represents a significant advancement over visual assessment since it does not rely on visible wavelengths to detect plant lesions. On the contrary, visual assessment can be rapid, inexpensive, and more accessible to researchers. We employed both methods combine their strengths in assessing plant injury.
We developed a detached fruit assay where one fruit is split into two halves, allowing each half to receive a different treatment, while controlling for variability in fruit ripeness. This is key, as strawberry susceptibility to B. cinerea changes dramatically as the fruit ripens [15]. We could also double the number of compound fruit available for our assays, as the dissection of the fruit does not interfere with usual disease progression. We also reduced latent infections by producing fruit under controlled conditions, which is far superior to purchasing commercially available berries, where fruit are often of an unknown provenance and have an unknown fungicide treatment history. We believe that this detached fruit assay is innovative and offers attractive advantages compared to other reported assays. In this assay, the B05.10 isolate produced lesions that were almost twice the size of those of the BRIP 28032a isolate at 5 d.p.i, similar to the response observed in leaves and petals. Therefore, it can be speculated that the B05.10 isolate has a more efficient necrotrophic phase, or a faster infection rate. This could be assessed by modifying the impact of strawberry tissue (fresh vs. senescent) on the production of biomass or gene expression [75]. Our fruit assay also confirmed that there is a substantial increase in fungal biomass at around 4 d.p.i. [76]. Another possibility that may explain the difference in aggressiveness is that B05.10 lacks virulence-attenuating mycoviruses [77], which may be present in BRIP 28032a (see above).
Due to its affordability and high-throughput capacity, we propose that the detached petal assay is suitable as a platform for the rapid testing of plant protectants. Petals are more abundant per plant than fruit, and flowers are the primary infection point for B. cinerea which can initiate secondary infections in leaves or fruit [15]. This platform is also suitable for downstream validation using qPCR. Similar assays have been reported for detached petals from rose and lily, but were previously not available for strawberry [78,79]. Our results provide evidence that B. cinerea lesions develop more linearly across time in petals, while the fruit had lesions that developed exponentially. This is likely due to the high availability of nutrients and the softening of receptacle tissue [43,44]. We found very few records of the specific ultrastructure composition of strawberry plants. A better description of this tissue can lead to the improvement of current assays.
We considered that the most appropriate way to estimate the biomass of B. cinerea in strawberry was by using genomic DNA. However, quantifying the fungal biomass in infected tissue can also be achieved using cDNA [80]. The latter option might be more suitable when obtaining high-quality genomic DNA for qPCR analysis is difficult. Indeed, we had to optimize the DNA extraction from strawberries since the first isolations produced poor amplifications, likely due to the presence of PCR inhibitors. We solved this by using an extraction buffer that contained PVP-40, high-sodium-chloride concentrations, and β-mercaptoethanol. Our results revealed that fungal biomass decreases slightly from 0 to 16 h.p.i, followed by an exponential increase and maximum petal colonization at 40 h.p.i. Since there are, to the best of our knowledge, no published studies performing qPCR on strawberry petals, it is difficult to provide accurate comparisons on the development of fungal biomass across time, but other studies have found that B. cinerea biomass increases at around 24 h.p.i. in Pelargonium leaf disks [41], while in rose petals, the lesion develops mostly linearly between 24 and 72 h.p.i. [78].

5. Conclusions

In conclusion, we adapted protocols to improve the study of the B. cinerea–strawberry interaction. We used confocal and scanning electron microscopy to confirm that B. cinerea forms infection cushions in strawberry leaves and petals, but none were detected in the receptacle. For the first time, we revealed that B. cinerea penetrates through stomata in achenes as well as directly through the receptacle. Our multi-tissue pathology assays provide tools to measure the fungal lesion sizes and track the development of disease symptoms, while the petal assay is a rapid and inexpensive platform for testing new strawberry protectants. In summary, our findings will facilitate the elucidation of infection mechanisms and may aid in the future discovery of novel antifungal molecules against B. cinerea.

Supplementary Materials

The following supporting information can be downloaded at https://www.mdpi.com/article/10.3390/horticulturae11080954/s1: Figure S1: GFP growth in plate; Figure S2: SEM of strawberry achene; Figure S3: Leaf control and Fungicide; Figure S4: Petal assays; Figure S5: Whole-flower assays; Figure S6: Validation of qPCR primers; Figure S7: Melting curves of qPCR primers; Figure S8: qPCR standard curves; Table S1: qPCR Ct values.

Author Contributions

L.R.C.: investigation, methodology, writing—review and editing, writing—original draft, and visualization. D.G.-C.: investigation, methodology, writing—review and editing, writing—original draft, and visualization. S.W.M.: resources, writing—original draft, and writing—review and editing. D.M.G.: investigation, resources, and writing—review and editing. A.R.G.: writing—review and editing, writing—original draft, supervision, project administration, conceptualization, and visualization. All authors have read and agreed to the published version of the manuscript.

Funding

L.R.C. is supported by a La Trobe University Post Graduate Research Scholarship and a La Trobe University Full Fee Research Scholarship. This work was supported by the Australian Government Linkage Grant Scheme through the Australian Research Council Research Hub for Sustainable Crop Protection (Project Number IH190100022) to A.R.G. and S.W.M. Work in the ARG laboratory is also supported by the Australian Research Council Research Hub for Medicinal Agriculture (IH180100006) and the Australian Research Council Research Hub for Protected Cropping (IH240100024).

Data Availability Statement

Transcriptomic data from B. cinerea is available from NCBI BioProject ID: PRJNA1123308.

Acknowledgments

We thank Kieran Murphy (NuFarm) for supplying the fungicide, Jan van Kan and Apollo Gomez for providing the Botrytis isolates, Julian Ratcliffe, Chad Johnson, and Jennifer Whan from the La Trobe University Bioimaging Platform for their support with microscopy, James Dorgan and Viet Long Ha for support with plant maintenance, and Kim Plummer for advice throughout.

Conflicts of Interest

The authors declare no conflicts of interest.

References

  1. Giampieri, F.; Tulipani, S.; Alvarez-Suarez, J.M.; Quiles, J.L.; Mezzetti, B.; Battino, M. The strawberry: Composition, nutritional quality, and impact on human health. Nutrition 2012, 28, 9–19. [Google Scholar] [CrossRef] [PubMed]
  2. Samykanno, K.; Pang, E.; Marriott, P.J. Chemical characterisation of two Australian-grown strawberry varieties by using comprehensive two-dimensional gas chromatography-mass spectrometry. Food Chem. 2013, 141, 1997–2005. [Google Scholar] [CrossRef] [PubMed]
  3. FAO. Crops and Livestock Products. 2021. Available online: https://www.fao.org/faostat/en/#data/QCL (accessed on 13 August 2024).
  4. Hort Innovation. Berry Strategic Investment Plan 2022–2026; Hort Innovation: North Sydney, NSW, Australia, 2021. [Google Scholar]
  5. Samtani, J.B.; Rom, C.R.; Friedrich, H.; Fennimore, S.A.; Finn, C.E.; Petran, A.; Wallace, R.W.; Pritts, M.P.; Fernandez, G.; Chase, C.A.; et al. The Status and Future of the Strawberry Industry in the United States. HortTechnology 2019, 29, 11–24. [Google Scholar] [CrossRef]
  6. Jarvis, W.R. Botryotinia and Botrytis Species: Taxonomy, Physiology, and Pathogenicity: A Guide to the Literature; Research Branch, Canada Department of Agriculture: Ottawa, ON, Canada, 1977. [Google Scholar]
  7. Elad, Y.; Williamson, B.; Tudzynski, P.; Delen, N. Botrytis spp. and Diseases They Cause in Agricultural Systems—An Introduction. In Botrytis: Biology, Pathology and Control; Elad, Y., Williamson, B., Tudzynski, P., Delen, N., Eds.; Springer: Dordrecht, The Netherlands, 2007; pp. 1–8. [Google Scholar]
  8. Singh, R.; Caseys, C.; Kliebenstein, D.J. Genetic and molecular landscapes of the generalist phytopathogen Botrytis cinerea. Mol. Plant Pathol. 2024, 25, e13404. [Google Scholar] [CrossRef]
  9. Qin, S.; Veloso, J.; Baak, M.; Boogmans, B.; Bosman, T.; Puccetti, G.; Shi-Kunne, X.; Smit, S.; Grant-Downton, R.; Leisen, T.; et al. Molecular characterization reveals no functional evidence for naturally occurring cross-kingdom RNA interference in the early stages of Botrytis cinerea-tomato interaction. Mol. Plant Pathol. 2023, 24, 3–15. [Google Scholar] [CrossRef]
  10. Dean, R.; Van Kan, J.A.; Pretorius, Z.A.; Hammond-Kosack, K.E.; Di Pietro, A.; Spanu, P.D.; Rudd, J.J.; Dickman, M.; Kahmann, R.; Ellis, J.; et al. The Top 10 fungal pathogens in molecular plant pathology. Mol. Plant Pathol. 2012, 13, 414–430. [Google Scholar] [CrossRef]
  11. Ries, M.S. RPD No. 704—Gray Mold of Strawberry; Reports on Plant Diseases; University of Illinois Urbana-Champaign: Champaign, IL, USA, 1995. [Google Scholar]
  12. Mertely, J.; Oliveira, M.S.; Peres, N.A. Botrytis Fruit Rot or Gray Mold of Strawberry: PP230 PP152, Rev. 2 2018. EDIS 2018, 2018, 230. [Google Scholar] [CrossRef]
  13. Abbey, J.A.; Percival, D.; Asiedu, S.K.; Prithiviraj, B.; Schilder, A. Management of Botrytis blossom blight in wild blueberries by biological control agents under field conditions. Crop Prot. 2020, 131, 105078. [Google Scholar] [CrossRef]
  14. Bristow, P.R.; McNicol, R.J.; Williamson, B. Infection of strawberry flowers by Botrytis cinerea and its relevance to grey mould development. Ann. Appl. Biol. 1986, 109, 545–554. [Google Scholar] [CrossRef]
  15. Petrasch, S.; Knapp, S.J.; Van Kan, J.A.; Blanco-Ulate, B. Grey mould of strawberry, a devastating disease caused by the ubiquitous necrotrophic fungal pathogen Botrytis cinerea. Mol. Plant Pathol. 2019, 20, 877–892. [Google Scholar] [CrossRef]
  16. Garrido, C.; Carbú, M.; Fernández-Acero, F.J.; González-Rodríguez, V.E.; Cantoral, J.M. New Insights in the Study of Strawberry Fungal Pathogens. Genes Genomes Genom. 2011, 5, 24–39. [Google Scholar]
  17. Washington, W.S.; Engleitner, S.; Boontjes, G.; Shanmuganathan, N. Effect of fungicides, seaweed extracts, tea tree oil, and fungal agents on fruit rot and yield in strawberry. Aust. J. Exp. Agric. 1999, 39, 487–494. [Google Scholar] [CrossRef]
  18. Washington, W.S.; Shanmuganathan, N.; Forbes, C. Fungicide control of strawberry fruit rots, and the field occurrence of resistance of Botrytis cinerea to iprodione, benomyl and dichlofluanid. Crop Prot. 1992, 11, 355–360. [Google Scholar] [CrossRef]
  19. Berries Australia. Next Generation of Strawberry Disease Control. Aust. Berry J. Winter 2023, 15, 80–83. [Google Scholar]
  20. Menzel, C.; Gomez, A.; Smith, L. Control of grey mould and stem-end rot in strawberry plants growing in a subtropical environment. Australas. Plant Pathol. 2016, 45, 489–498. [Google Scholar] [CrossRef]
  21. Leroch, M.; Plesken, C.; Weber, R.W.S.; Kauff, F.; Scalliet, G.; Hahn, M. Gray mold populations in german strawberry fields are resistant to multiple fungicides and dominated by a novel clade closely related to Botrytis cinerea. Appl. Environ. Microbiol. 2013, 79, 159–167. [Google Scholar] [CrossRef]
  22. Fernández-Ortuño, D.; Grabke, A.; Bryson, P.K.; Amiri, A.; Peres, N.A.; Schnabel, G. Fungicide Resistance Profiles in Botrytis cinerea from Strawberry Fields of Seven Southern U.S. States. Plant Dis. 2014, 98, 825–833. [Google Scholar] [CrossRef]
  23. Sowley, E.N.K.; Dewey, F.M.; Shaw, M.W. Persistent, symptomless, systemic, and seed-borne infection of lettuce by Botrytis cinerea. Eur. J. Plant Pathol. 2010, 126, 61–71. [Google Scholar] [CrossRef]
  24. Dewey, F.; Grant-Downton, R. Botrytis-Biology, Detection and Quantification. In Botrytis—The Fungus, the Pathogen and Its Management in Agricultural Systems; Fillinger, S., Elad, Y., Eds.; Springer International Publishing: Cham, Germany, 2016; pp. 17–34. [Google Scholar]
  25. Braun, P.G.; Sutton, J.C. Infection cycles and population dynamics of Botrytis cinerea in strawberry leaves. Can. J. Plant Pathol. 1988, 10, 133–141. [Google Scholar] [CrossRef]
  26. Backhouse, D.; Willetts, H.J. Development and structure of infection cushions of Botrytis cinerea. Trans. Br. Mycol. Soc. 1987, 89, 89–95. [Google Scholar] [CrossRef]
  27. Choquer, M.; Rascle, C.; Gonçalves, I.R.; de Vallée, A.; Ribot, C.; Loisel, E.; Smilevski, P.; Ferria, J.; Savadogo, M.; Souibgui, E.; et al. The infection cushion of Botrytis cinerea: A fungal ‘weapon’ of plant-biomass destruction. Environ. Microbiol. 2021, 23, 2293–2314. [Google Scholar] [CrossRef] [PubMed]
  28. Mattner, S.W.; Porter, I.; Gounder, R.; Shanks, A.; Wren, D.; Allen, D. Factors that impact on the ability of biofumigants to suppress fungal pathogens and weeds of strawberry. Crop Prot. 2008, 27, 1165–1173. [Google Scholar] [CrossRef]
  29. Pavicic, M.; Overmyer, K.; Rehman, A.U.; Jones, P.; Jacobson, D.; Himanen, K. Image-Based Methods to Score Fungal Pathogen Symptom Progression and Severity in Excised Arabidopsis Leaves. Plants 2021, 10, 158. [Google Scholar] [CrossRef] [PubMed]
  30. Meng, L.; Audenaert, K.; Van Labeke, M.-C.; Höfte, M. Detection of Botrytis cinerea on strawberry leaves upon mycelial infection through imaging technique. Sci. Hortic. 2024, 330, 113071. [Google Scholar] [CrossRef]
  31. Reboledo, G.; Agorio, A.; Vignale, L.; Batista-García, R.A.; De León, I.P. Botrytis cinerea Transcriptome during the Infection Process of the Bryophyte Physcomitrium patens and Angiosperms. J. Fungi 2020, 7, 11. [Google Scholar] [CrossRef]
  32. You, Y.; Suraj, H.M.; Matz, L.; Valderrama, A.L.H.; Ruigrok, P.; Shi-Kunne, X.; Pieterse, F.P.J.; Oostlander, A.; Beenen, H.G.; Chavarro-Carrero, E.A.; et al. Botrytis cinerea combines four molecular strategies to tolerate membrane-permeating plant compounds and to increase virulence. Nat. Commun. 2024, 15, 6448. [Google Scholar] [CrossRef]
  33. Asadollahi, M.; Fekete, E.; Karaffa, L.; Flipphi, M.; Árnyasi, M.; Esmaeili, M.; Váczy, K.Z.; Sándor, E. Comparison of Botrytis cinerea populations isolated from two open-field cultivated host plants. Microbiol. Res. 2013, 168, 379–388. [Google Scholar] [CrossRef]
  34. Koch, F.; Voigt, K.; Quidde, T.; Risch, S.; Blaich, R.; Tudzynski, P.; Büttner, P.; Brückner, B. Variations in ploidy among isolates of Botrytis cinerea: Implications for genetic and molecular analyses. Curr. Genet. 1994, 25, 445–450. [Google Scholar] [CrossRef]
  35. Sabburg, R.; Gregson, A.; Urquhart, A.S.; Aitken, E.A.; Smith, L.; Thatcher, L.F.; Gardiner, D.M. A method for high-throughput image-based antifungal screening. J. Microbiol. Methods 2021, 190, 106342. [Google Scholar] [CrossRef]
  36. Gardiner, D.M.; Howlett, B.J. Negative selection using thymidine kinase increases the efficiency of recovery of transformants with targeted genes in the filamentous fungus Leptosphaeria maculans. Curr. Genet. 2004, 45, 249–255. [Google Scholar] [CrossRef]
  37. Schindelin, J.; Arganda-Carreras, I.; Frise, E.; Kaynig, V.; Longair, M.; Pietzsch, T.; Preibisch, S.; Rueden, C.; Saalfeld, S.; Schmid, B.; et al. Fiji: An open-source platform for biological-image analysis. Nat. Methods 2012, 9, 676–682. [Google Scholar] [CrossRef]
  38. Galvão, A.; Resende, L.V.; Guimaraes, R.M.; Ferraz, A.K.L.; Morales, R.G.F.; Marodin, J.C.; Catão, H.C.R.M. Overcoming strawberry achene dormancy for improved seedling production in breeding programs. Idesia 2014, 32, 57–62. [Google Scholar] [CrossRef]
  39. Baroncelli, R.; Sarrocco, S.; Zapparata, A.; Tavarini, S.; Angelini, L.G.; Vannacci, G. Characterization and epidemiology of Colletotrichum acutatum sensu lato (C. chrysanthemi) causing arthamus tinctorius anthracnose. Plant Pathol. 2015, 64, 375–384. [Google Scholar] [CrossRef]
  40. Green, M.J.; Thompson, D.A.; MacKenzie, D.J. Easy and Efficient DNA Extraction from Woody Plants for the Detection of Phytoplasmas by Polymerase Chain Reaction. Plant Dis. 1999, 83, 482–485. [Google Scholar] [CrossRef] [PubMed]
  41. Suarez, M.B.; Walsh, K.; Boonham, N.; O’Neill, T.; Pearson, S.; Barker, I. Development of real-time PCR (TaqMan) assays for the detection and quantification of Botrytis cinerea in planta. Plant Physiol. Biochem. 2005, 43, 890–899. [Google Scholar] [CrossRef] [PubMed]
  42. Wu, Z.; Zhang, J.; Hao, J.; Liu, P.; Liu, X. Understanding Efflux-Mediated Multidrug Resistance in Botrytis cinerea for Improved Management of Fungicide Resistance. Microb. Biotechnol. 2025, 18, e70074. [Google Scholar] [CrossRef] [PubMed]
  43. Straube, J.; Hurtado, G.; Zeisler-Diehl, V.; Schreiber, L.; Knoche, M. Cuticle deposition ceases during strawberry fruit development. BMC Plant Biol. 2024, 24, 623. [Google Scholar] [CrossRef]
  44. Moya-León, M.A.; Mattus-Araya, E.; Herrera, R. Molecular Events Occurring During Softening of Strawberry Fruit. Front. Plant Sci. 2019, 10, 615. [Google Scholar] [CrossRef]
  45. Jiang, Y.; Peng, Y.; Hou, G.; Yang, M.; He, C.; She, M.; Li, X.; Li, M.; Chen, Q.; Zhang, Y.; et al. A high epicuticular wax strawberry mutant reveals enhanced resistance to Tetranychus urticae Koch and Botrytis cinerea. Sci. Hortic. 2024, 324, 112636. [Google Scholar] [CrossRef]
  46. Yu, H.; Sutton, J.C. Morphological development and interactions of Gliocladium roseum and Botrytis cinerea in raspberry. Can. J. Plant Pathol. 1997, 19, 237–246. [Google Scholar] [CrossRef]
  47. Dinh, S.Q.; Joyce, D.C.; Irving, D.E.; Wearing, A.H. Histology of waxflower (Chamelaucium spp.) flower infection by Botrytis cinerea. Plant Pathol. 2011, 60, 278–287. [Google Scholar] [CrossRef]
  48. Bi, K.; Liang, Y.; Mengiste, T.; Sharon, A. Killing softly: A roadmap of Botrytis cinerea pathogenicity. Trends Plant Sci. 2023, 28, 211–222. [Google Scholar] [CrossRef]
  49. Nehra, N.S.; Kartha, K.K.; Stushnoff, C.; Giles, K.L. Effect of in vitro propagation methods on field performance of two strawberry cultivars. Euphytica 1994, 76, 107–115. [Google Scholar] [CrossRef]
  50. Ullah, I.; Demirsoy, H.; Soysal, D.; Lizalo, A.; Doğan, D.E.; Demirsoy, L. Evaluation of Strawberry Cultivars Based on Growth-Related Attributes. Appl. Fruit Sci. 2024, 66, 431–439. [Google Scholar] [CrossRef]
  51. Blanke, M. Photosynthesis of strawberry fruit. Acta Hortic. 2002, 567, 373–376. [Google Scholar] [CrossRef]
  52. Wang, Z.; Narciso, J.; Biotteau, A.; Plotto, A.; Baldwin, E.; Bai, J. Improving storability of fresh strawberries with controlled release chlorine dioxide in perforated clamshell packaging. Food Bioprocess Technol. 2014, 7, 3516–3524. [Google Scholar] [CrossRef]
  53. Mohammadi, L.; Ramezanian, A.; Tanaka, F. Impact of Aloe vera gel coating enriched with basil (Ocimum basilicum L.) essential oil on postharvest quality of strawberry fruit. J. Food Meas. Charact. 2021, 15, 353–362. [Google Scholar] [CrossRef]
  54. Wang, L.; Hasenstein, K.H. Seed coat stomata of several Iris species. Flora 2016, 224, 24–29. [Google Scholar] [CrossRef]
  55. Paiva, É.A.S.; Lemos-Filho, J.P.; Oliveira, D.M.T. Imbibition of Swietenia macrophylla (Meliaceae) Seeds: The Role of Stomata. Ann. Bot. 2006, 98, 213–217. [Google Scholar] [CrossRef]
  56. Boesewinkel, F.D.; Bouman, F. The Seed: Structure. In Embryology of Angiosperms; Johri, B.M., Ed.; Springer: Berlin/Heidelberg, Germany, 1984; pp. 567–610. [Google Scholar]
  57. Orsini, F.; Alnayef, M.; Bona, S.; Maggio, A.; Gianquinto, G. Low stomatal density and reduced transpiration facilitate strawberry adaptation to salinity. Environ. Exp. Bot. 2012, 81, 1–10. [Google Scholar] [CrossRef]
  58. Coertze, S.; Holz, G. Surface Colonization, Penetration, and Lesion Formation on Grapes Inoculated Fresh or After Cold Storage with Single Airborne Conidia of Botrytis cinerea. Plant Dis. 1999, 83, 917–924. [Google Scholar] [CrossRef]
  59. Viret, O.; Keller, M.; Jaudzems, V.G.; Cole, F.M. Botrytis cinerea Infection of Grape Flowers: Light and Electron Microscopical Studies of Infection Sites. Phytopathology 2004, 94, 850–857. [Google Scholar] [CrossRef]
  60. Brummell, D.A.; Harpster, M.H. Cell wall metabolism in fruit softening and quality and its manipulation in transgenic plants. In Plant Cell Walls; Carpita, N.C., Campbell, M., Tierney, M., Eds.; Springer: Dordrecht, The Netherlands, 2001; pp. 311–340. [Google Scholar]
  61. Blanco-Ulate, B.; Labavitch, J.M.; Vincenti, E.; Powell, A.L.; Cantu, D. Hitting the Wall: Plant Cell Walls During Botrytis cinerea Infections. In Botrytis—The Fungus, the Pathogen and Its Management in Agricultural Systems; Fillinger, S., Elad, Y., Eds.; Springer International Publishing: Cham, Germany, 2016; pp. 361–386. [Google Scholar]
  62. Cheung, N.; Tian, L.; Liu, X.; Li, X. The Destructive Fungal Pathogen Botrytis cinerea-Insights from Genes Studied with Mutant Analysis. Pathogens 2020, 9, 923. [Google Scholar] [CrossRef] [PubMed] [PubMed Central]
  63. Holz, G.; Coertze, S.; Williamson, B. The Ecology of Botrytis on Plant Surfaces. In Botrytis: Biology, Pathology and Control; Elad, Y., Williamson, B., Tudzynski, P., Delen, N., Eds.; Springer: Dordrecht, The Netherlands, 2007; pp. 9–27. [Google Scholar]
  64. van Kan, J.A. Licensed to kill: The lifestyle of a necrotrophic plant pathogen. Trends Plant Sci. 2006, 11, 247–253. [Google Scholar] [CrossRef] [PubMed]
  65. Steentjes, M.B.F.; Tonn, S.; Coolman, H.; Langebeeke, S.; Scholten, O.E.; van Kan, J.A.L. Visualization of Three Sclerotiniaceae Species Pathogenic on Onion Reveals Distinct Biology and Infection Strategies. Int. J. Mol. Sci. 2021, 22, 1865. [Google Scholar] [CrossRef] [PubMed]
  66. Espino, J.J.; Gutiérrez-Sánchez, G.; Brito, N.; Shah, P.; Orlando, R.; González, C. The Botrytis cinerea early secretome. Proteomics 2010, 10, 3020–3034. [Google Scholar] [CrossRef]
  67. Srivastava, D.A.; Yakubov, M.; Feldbaum, R.; Tish, N.; Shoyhet, H.; Manasherova, E.; Pandaranayaka, E.P.J.; Rav-David, D.; Elad, Y.; Harel, A. Multiparametric analysis of diversity in Botrytis cinerea isolates from Israel. Phytoparasitica 2018, 46, 569–581. [Google Scholar] [CrossRef]
  68. Kumari, S.; Tayal, P.; Sharma, E.; Kapoor, R. Analyses of genetic and pathogenic variability among Botrytis cinerea isolates. Microbiol. Res. 2014, 169, 862–872. [Google Scholar] [CrossRef]
  69. Brauna-Morževska, E.; Stoddard, F.L.; Bankina, B.; Kaņeps, J.; Bimšteine, G.; Petrova, I.; Neusa-Luca, I.; Roga, A.; Fridmanis, D. Evaluation of pathogenicity of Botrytis species isolated from different legumes. Front. Plant Sci. 2023, 14, 1069126. [Google Scholar] [CrossRef]
  70. Ahn, I.I.P.; Lee, Y.-H. A Viral Double-Stranded RNA Up Regulates the Fungal Virulence of Nectria radicicola. Mol. Plant-Microbe Interact. 2001, 14, 496–507. [Google Scholar] [CrossRef]
  71. Hao, F.; Ding, T.; Wu, M.; Zhang, J.; Yang, L.; Chen, W.; Li, G. Two Novel Hypovirulence-Associated Mycoviruses in the Phytopathogenic Fungus Botrytis cinerea: Molecular Characterization and Suppression of Infection Cushion Formation. Viruses 2018, 10, 254. [Google Scholar] [CrossRef]
  72. Kuckenberg, J.; Tartachnyk, I.; Noga, G. Temporal and spatial changes of chlorophyll fluorescence as a basis for early and precise detection of leaf rust and powdery mildew infections in wheat leaves. Pres. Agric. 2009, 10, 34–44. [Google Scholar] [CrossRef]
  73. Martínez-Ferri, E.; Zumaquero, A.; Ariza, M.T.; Barceló, A.; Pliego, C. Nondestructive Detection of White Root Rot Disease in Avocado Rootstocks by Leaf Chlorophyll Fluorescence. Plant Dis. 2016, 100, 49–58. [Google Scholar] [CrossRef]
  74. Meng, L.; Mestdagh, H.; Ameye, M.; Audenaert, K.; Höfte, M.; Van Labeke, M.-C. Phenotypic Variation of Botrytis cinerea Isolates Is Influenced by Spectral Light Quality. Front. Plant Sci. 2020, 11, 1233. [Google Scholar] [CrossRef]
  75. Martinez, F.; Dubos, B.; Fermaud, M. The Role of Saprotrophy and Virulence in the Population Dynamics of Botrytis cinerea in Vineyards. Phytopathology 2005, 95, 692–700. [Google Scholar] [CrossRef]
  76. Mehli, L.; Kjellsen, T.D.; Dewey, F.M.; Hietala, A.M. A case study from the interaction of strawberry and Botrytis cinerea highlights the benefits of comonitoring both partners at genomic and mRNA level. New Phytol. 2005, 168, 465–474. [Google Scholar] [CrossRef] [PubMed]
  77. Córdoba, L.; Ruiz-Padilla, A.; Rodríguez-Romero, J.; Ayllón, M.A. Construction and Characterization of a Botrytis Virus F Infectious Clone. J. Fungi 2022, 8, 459. [Google Scholar] [CrossRef] [PubMed]
  78. Cao, X.; Yan, H.; Liu, X.; Li, D.; Sui, M.; Wu, J.; Yu, H.; Zhang, Z. A detached petal disc assay and virus-induced gene silencing facilitate the study of Botrytis cinerea resistance in rose flowers. Hortic. Res. 2019, 6, 136. [Google Scholar] [CrossRef] [PubMed]
  79. Xiang, J.; Lei, X.; Wu, Z.; Cao, X.; Zhang, D.; Teng, N. An efficient and novel method to screen Botrytis cinerea resistance genes based on TRV-induced gene silencing with lily petal discs. Physiol. Mol. Plant Pathol. 2022, 122, 101923. [Google Scholar] [CrossRef]
  80. Niño-Sánchez, J.; Sambasivam, P.T.; Sawyer, A.; Hamby, R.; Chen, A.; Czislowski, E.; Li, P.; Manzie, N.; Gardiner, D.M.; Ford, R.; et al. BioClayTM prolongs RNA interference-mediated crop protection against Botrytis cinerea. J. Integr. Plant Biol. 2022, 64, 2187–2198. [Google Scholar] [CrossRef]
Figure 1. Evaluation of wild-type (WT) and a GFP-expressing transformant of B. cinerea isolate BRIP 28032a. (A,E) No differences were observed between the WT and transformant based on morphology and growth on potato dextrose agar (PDA). Brightfield microscopy revealed no morphological changes between BRIP 28032a (B) and the GFP transformant (F) mycelia, while fluorescence microscopy confirmed that only the GFP transformant exhibited fluorescence (C,G). Pathogenicity in petals of strawberry in the wild type, (D) and GFP (H) at 48 h post inoculation (h.p.i). (I) Quantification of data in (D,H). Boxplots indicate the median values of WT and GFP isolates while the dots represent individual data that were considered outliers, falling outside the main data distribution. There was no significant difference between the pathogenicity of the wild type (BRIP 28032a) and the GFP transformant (p > 0.05). Scale bars: (A,D,E,H) 1 cm; (B,C,F,G) 200 µm.
Horticulturae 11 00954 g001
Figure 2. Confocal laser scanning microscopy images of B. cinerea penetrating leaves, petals, and fruit of strawberry cv. Albion. (A) Fluorescence of a strawberry achene without fungus infection (red may indicate stomata, while green may indicate the base of trichomes). (B) Germinated conidia of B. cinerea (green), with stomata on the strawberry achene (white arrows) at 24 h post inoculation (h.p.i.). (C) B. cinerea growing on the receptacle of fruit at 24 h.p.i., with no observed appressoria or infection cushions. (D) Strawberry petal infected with B. cinerea at 24 h.p.i., showing the commencement of the formation of infection cushions (arrowheads). (E) Infection cushion of B. cinerea growing on a petal. (F) B. cinerea produces infection cushions on the adaxial leaf surface at 48 h.p.i. Scale bars: (AC) 20 µm; (DF) 100 µm.
Horticulturae 11 00954 g002
Figure 3. B. cinerea was observed to enter strawberry fruit cv. Albion tissues through achene stomata (St) and direct receptacle penetration (Dp). (A,B) Germinated conidia of B. cinerea (black arrow) and hyphal growth on the achene and near trichomes (white arrowheads). High magnification ((C), dashed box in (B)) revealed that the achene surface includes numerous stomata ((D,E); Supplementary Figure S3) that were penetrated by B. cinerea hyphae during the infection process ((C,E), indicated with white arrows, St). Otherwise, the hyphae of the fungus were captured penetrating through the receptacle of the fruiting tissue ((D,F), white arrows). Scale bars: (A,B) 200 µm; (CF) 20 µm. Tr: trichome; Co: conidia.
Horticulturae 11 00954 g003
Figure 4. B. cinerea infection assay in leaves showing original RGB visible and Fv/Fm images obtained by chlorophyll fluorescence. (A) Disease progression visualized using RGB (left) and chlorophyll fluorescence (right) following infection with isolates BRIP 28032a and B05.10. Color bar represents Fv/Fm values. (B) Boxplots represent the distribution of all Fv/Fm values from all pixels of six replicates for each treatment. The Fv/Fm value, which is measured across entire leaves, decreases as the infection with either isolate of B. cinerea progresses by 2 days post inoculation. The panel on the left is control media only, malt extract broth (MEB). The middle panel shows Fv/Fm data for disease progression with the B05.10 isolate, and the right panel shows data for the BRIP 28032a isolate.
Horticulturae 11 00954 g004
Figure 5. Disease progression in strawberry (cv. Albion) following inoculation with B. cinerea isolates BRIP 28032a and B05.10 in a detached leaf assay. (A) The diseased area of each leaf (RGB) was measured using Fiji. (B) Progress of chlorophyll fluorescence of pixels with Fm/Fv values below 0.75 on three different days post inoculation. Each data point represents the mean, and the bars indicate the standard error (n = 6 leaves per treatment). Points followed by different letters are significantly different on each day, where p ≤ 0.05.
Horticulturae 11 00954 g005
Figure 6. Validation of the B. cinerea infection assay in strawberry fruit (cv. Albion) using the fungicide Thiram. Fruit were surface sterilized in 60% ethanol + 0.6% sodium hypochlorite and cut in half so that each of the two halves received a different treatment. (A) No background infections were detected in fruit that were not inoculated. Fruit halves were inoculated with B. cinerea conidia (eight µL of a suspension of 105 conidia/mL in 1% malt extract broth) using BRIP 28032a (B) or the B05.10 isolate (D). Fruit were also inoculated using the same isolates and treated with the fungicide Thiram (1.5 mg/mL) (C,E). Uninoculated controls did not develop an infection by B. cinerea (A). Fruit were photographed at 3, 4, and 5 days post inoculation (d.p.i.). Lesion area was measured using Fiji and expressed as mm2. Data was processed using RStudio. Scale bar: 1 cm; n = 9 for each treatment. Error bars represent the standard error.
Horticulturae 11 00954 g006
Figure 7. A detached strawberry petal assay is an effective platform to measure disease caused by B. cinerea. Uninoculated and untreated controls revealed no significant latent infections (A). Flower petals were inoculated with B. cinerea conidia (four µL of a 2.5 × 10⁴ conidia/mL suspension) (B,D) or inoculated and treated with the fungicide Thiram (label rate of 1.5 mg/mL, (C,E). In the absence of fungicide, petals became completely diseased at 40 h post inoculation (h.p.i.). Petals were photographed at 0, 16, 24, and 40 h.p.i. Lesion area was measured using Fiji (v2.14.0) and expressed as mm2. Representative images of petals are presented (n = 3 independent experiments, with 5 technical replicates in each). Scale bars = 1 cm. Fungal biomass in the petals was quantified by qPCR using the fungal intergenic spacer (IGS) normalized to the strawberry ACTIN gene, revealing significant differences between 40 h.p.i. and all other times (n = 3) (F). Error bars represent the standard error. Data was processed using RStudio.
Horticulturae 11 00954 g007
Disclaimer/Publisher’s Note: The statements, opinions and data contained in all publications are solely those of the individual author(s) and contributor(s) and not of MDPI and/or the editor(s). MDPI and/or the editor(s) disclaim responsibility for any injury to people or property resulting from any ideas, methods, instructions or products referred to in the content.