Article

Effect of the Combined Application of Aqueous Cabbage Seed Extract and Chitosan Solutions on the Shelf Life of Fresh-Cut Apple Cubes

by
Despina Alexaki
,
Athanasios Gerasopoulos
and
Dimitrios Gerasopoulos
*
Laboratory of Food processing and Engineering, Department of Food Science and Technology, Aristotle University of Thessaloniki, 54124 Thessaloniki, Greece
*
Author to whom correspondence should be addressed.
Horticulturae 2025, 11(8), 953; https://doi.org/10.3390/horticulturae11080953
Submission received: 19 June 2025 / Revised: 3 August 2025 / Accepted: 4 August 2025 / Published: 12 August 2025

Abstract

Enzymatic browning is the negative color effect of polyphenol oxidase activity in cut fresh fruit products, which reduces their quality, shelf life, and marketability. To preserve the color after cutting, apple cubes were treated with aqueous cabbage seed extracts (ACEs) at 5–10% w:v seed–water ratios, adjusted to pH 4.0 and 6.0 and 1% chitosan added to the ACE before preservation at 7 °C for 0–10 days. Chromatometric readings (L*, a*, and b*) and visual color score were used for shelf life calculation. The ACE total phenolics and glucosinolate levels showed differences among the 5–10% and control groups. Based on color score, uncoated or coated (chitosan or ACE combined with chitosan) apple cubes reached marketing limit levels (score > 3/5) on day one, but apple cubes treated with 5 or 10% ACE alone did so on day four, which was considered the effective shelf life. These findings were further supported by FT-IR analysis. ACE modification to pH 6.0 was more effective at keeping the natural cut apple color than pH 4.0. ACE treatment (at 5 or 10%) without coating is regarded as a very promising natural agent for extending the shelf life of fresh-cut apples, which is a key attribute in their marketing.

Graphical Abstract

1. Introduction

Fresh-cut fruit processing can reduce its shelf life by inducing weight loss, softness, and microbial development in addition to browning [1,2].
The color of fresh-cut fruit is the main determinant of customer choice [3], and polyphenol oxidase can adversely impact this factor. The substrate of polyphenol oxidase is fruit polyphenols which are oxidized to quinones that exert browning on cut produce surfaces [4,5,6]. As polyphenol oxidase inhibitors, ascorbic acid, its derivatives, and sulfites have been the most successfully used compounds in the processing of fresh-cut fruit [7]. However, sulfites have been demonstrated to cause allergies that negatively impact human health, while ascorbic acid’s effects are temporary during preservation [8,9].
Alternatively, for sliced apples, which are favored worldwide due to their distinct flavor [10,11] and health advantages [12], a wide range of natural compounds (extracts of various plant parts) from different plants have been explored over the past 20 years in order to prevent their browning [13,14,15,16,17,18,19,20,21,22,23]. Natural products originated from Cruciferae plants have also been tested. The initiative to investigate Cruciferae plant was based on the observation that the induced polyphenol oxidase activity of cut products is considerably less than that of other produce [24]. Previous studies have demonstrated that Cruciferous leaf extracts inhibited commercial and polyphenol oxidases from grapes [25] and, when combined with allium extracts, they stabilized avocado pulp during refrigerated preservation [26]. In other studies, Cruciferous seed extracts inhibited the browning of cut lettuce leaves [27] or fresh-cut apple [28]. Seeds are considered a favored material due to their year-round availability.
Further, plant extracts or plant material can be combined with edible coating agents, such as chitosan [29], in order to synergistically enhance properties that prolong the shelf life of produce. Among edible coating agents [30], chitosan is a promising material primarily due to its antimicrobial activity and oxygen barrier formation [8,31]. Chitosan has been used as a coating agent for cut apples as a potential shelf life inducer [8,10,11,31].
Extending the shelf life of fresh-cut apples is a contemporary research subject. The purpose of this work was to evaluate the potential for inhibiting enzymic browning utilizing aqueous cabbage seed extracts alone or in combination with chitosan edible coatings, for which there have been no previous findings. In addition to year-round seed availability, aqueous seed extracts are simple to produce and apply immediately to cut apples after processing. Both aqueous cabbage seed extract and/or chitosan coatings were subjected to the necessary pH changes prior to application. The shelf life of cut apple cubes was determined based on measurement of the incidence of browning on their surfaces during preservation, using both subjective (visual) and objective (chromatometric) indices.

2. Materials and Methods

2.1. Chemicals and Reagents

Chitosan (MW of 190,000–310,000 g/mol) with a degree of deacetylation greater than 90% was obtained from Siveele (Breda, The Netherlands). Glycerol (99%) and hydrochloric acid (37% reagent grade) were purchased from Scharlab (Barcelona, Spain). Acetic acid (glacial 99–100%), methanol (HPLC Grade), methanol (Analytical reagent), sodium carbonate (Na2CO3, Anhydrous), sinigrin, Folin–Ciocâlteu’s phenol reagent, and palladium (57%) were obtained from Chem-Lab (Zedelgen, Belgium). Sodium hydroxide (NaOH), gallic acid, and DPPH (2,2-diphenyl-1-picrylhydrazyl) were purchased from Sigma-Aldrich (St. Louis, MO, USA). Maxi Clean C-18 (300 mg) and SPE cartridges were obtained from Sepachrom Srl (Rho-Milan, Italy).

2.2. Plant Material

The apples (Malus domestica Borkh. cv. Starking Delicious) used in this study were produced by Zagorin (Zagora, Greece) and were large in size, spherical and elongated in shape, and their flesh was firm and white. The fruits were harvested in September and had been stored for 3–4 months when they were purchased from the local market. The seed of the domestic variety of cabbage (Brassica oleracea L. cv. Kilkis) used in this study was obtained from General Phytotechnic Athens (Athens, Greece). It is a mid–early variety of cabbage (maturing in about 90 days) that produces soft and white-green heads.

2.3. Preparation of Aqueous Seed Extracts, Chitosan-Based Coatings, and pH Adjustment

Based on earlier studies [27], the cabbage seeds were chosen to yield aqueous extracts (ACEs) that prevent freshly cut apple cubes from browning. Pre-experimentation tests were used to define the maximum and intermediate values of the cabbage seed–water ratio (w:v), which were 5 and 10%, respectively. After that, these combinations were homogenized in a water ice bath (5 °C) for two min at 10,000–12,000 rpm using a PT 10–35 GT (Kinematica, Malters, Switzerland) homogenizer. After passing through a 0.5 mm plastic screen, the homogenate was centrifuged using a Universal 320 (Hettich, Tuttlingen, Germany) at 7000 g for 15 min at 25 °C. This produced aqueous seed extracts (ACEs), which were subsequently employed. In addition to the ACE, distilled water was used as a control.
The produced ACEs were then divided in half, with half of them incorporated into 1% chitosan edible coatings (w:v), and the mixture was stirred with a magnetic stirrer until the chitosan was entirely dissolved. During the stirring process, 1 mL of acetic acid (1% v/v) and 0.3 g of glycerol as a plasticizer (30% w:w based on chitosan) were added, according to Nair et al. [32] and Peng et al. [33]. Deionized water was employed as a control coating instead of the ACE.
Solutions used for the uncoated and coated treatments were subjected to two different pH modifications using an HI 221 laboratory pH meter (Hanna Instruments, Woonsocket, RI, USA); the first was adjusted to pH 4.0, which was approximately equal to the initial pH of the ACE, using acetic acid, and the second was adjusted to pH 6.0 using NaOH.

2.4. Sample Preparation and Application of Treatments

Apples of uniform size, appearance, and ripeness were selected. The apples were cleaned with tap water to eliminate any foreign matter, dried, sliced in half, cored, and then cut into 12 mm3 cubes using a multi-cutter (Westmark GmbH, Lennestadt-Elspe, Germany) and a sharp knife. Any cubes containing a portion of the peel were removed, and those judged inappropriate were discarded.
The apple cubes were then immersed in the ACE solutions (no coating and coating) for 10 min without being rinsed before or after immersion. After immersion, the apple cubes with the chitosan coating were allowed to dry naturally for 30 min at room temperature, until the excess coating was removed.
Each treatment consisted of six cubes from a different apple, all immersed in a 20 mL solution; following immersion, they were weighed and placed in a Petri dish; each Petri dish was considered to be one replication. Three dish replications were used for each of the twelve treatments (3 ACE, 2 coatings, and 2 pH treatments). The Petri dishes were kept at 7 °C for 0, 1, 3, 6, and 10 days and used to obtain CIE Lab coordinates and weight loss. Additional apple cubes were also processed and preserved in a similar manner in order to assess hardness, phenolic compounds, and antioxidant activity.

2.5. Quality Assessment Parameters

2.5.1. Determination of Phenolics, Antioxidant Capacity, and Total Glucosinolates

The pure ACE solutions of 5 and 10% (w:v), comprising three batch replications per treatment, were produced and utilized as anti-browning treatments for flesh-cut apple cubes, and analyzed for their phenolic compound content, antioxidant capacity, and total glucosinolates.
Apple cubes from each treatment were homogenized with 1:4 methanol (w:v) using a PT 10–35 GT (Kinematica, Malters, Switzerland) homogenizer and then centrifuged at 7000 rpm for 15 min at 25 °C using a Universal 320 (Hettich, Tuttlingen, Germany). The supernatant was collected to be used for the determination of phenolic compounds and DPPH radical scavenging activity [23].
The total phenolic compounds (TPCs) of the ACE, as well as of the cut apple cubes, were determined using Folin–Ciocalteu reagent according to AOCS [34] and Scalbert et al. [35], with some modifications. ACE or apple cube methanolic extracts, 0.5 mL, were mixed with 1.5 mL Folin–Ciocalteu reagent and, after 3 min with 6 mL of Na2CO3 (10% w:v), mixed and kept in a dark environment at room temperature (at 20 °C) for 90 min. The absorbance of the solution was monitored at 765 nm using a Genesys 80 UV-VIS (Thermo Fisher Scientific, Waltham, MA, USA) spectrophotometer. To the control, 0.5 mL of water or methanol was added, for the ACE or apple cube methanolic extracts, respectively. TPC of ACE were determined from the linear regression equation of a standard curve (y = 0.025x − 0.0707, R2 = 0.995), and the results are expressed as mg of gallic acid equivalent (GAE) per L of ACE.
The antioxidant activity of the samples was also evaluated using DPPH as a free radical, according to Brand-Williams et al. [36] and Nenadis et al. [37]. In a test tube, 2960 µL of DPPH methanolic solution (100 µM) was mixed with 0.6 mL of ACE, 0.5 mL of apple cube methanol extract, and methanol (control). The tubes were then vortexed and kept in a dark location at room temperature (20 °C) for 30 min. The absorbance of the solution was then measured at 517 nm using a Genesys 80 UV-VIS spectrophotometer (Thermo Fisher Scientific, Waltham, MA, USA). The antioxidant activity of the ACE or apple cube extract (%) values (%RSA) were obtained using the formula below, following adjustment with appropriate blanks.
RSA ( % )   =   A b s 515 ( t = 0 ) A b s 515 ( t = 0 ) A b s 515 ( t = 0 ) × 100
The total glucosinolates (GSLs) of the pure ACE 5% and 10% solutions were measured following sample preparation as follows: ACE was filtered, and its hydrophobic compounds (such as phenolics) were excluded using a Maxi-Clean SPE (300 mg) C18 cartridge (Sepachrom Srl, Rho-Milano, Italy). The column was activated with 5 mL of acidified methanol (HPLC grade + acetic acid) and washed with 5 mL of deionized water. ACE samples, 0.5 mL, were run through the column, followed by 0.5 mL of deionized water. GSLs were measured in the 1 mL column, which included the sample plus the deionized water eluent. The determination of the GSLs was carried out according to the method of Ishida et al. [38]; PdCl2 solution was produced from 60.17 mg PdCl2, 168 µL hydrochloric acid, and 100 mL deionized water. A mixture of 200 µL of GSL extract, 300 µL of deionized water, and 3 mL of PdCl2 solution was prepared. The mixture was stirred and left at room temperature (25 °C) for 1 h before the measurement of absorbance was measured at 425 nm using a Genesys180 UV-VIS spectrophotometer (Thermo Fisher Scientific, Waltham, MA, USA). For the control, 500 µL of deionized water was combined with 3 mL of PdCl2. The operation was repeated two times. The sinigrin equivalents were calculated using the linear regression equation of a calibration curve (y = 0.0006x − 0.0315, R2 = 0.999) and results were expressed in mg/g of cabbage seed.

2.5.2. Chromatometric Color Measurement and Weight Loss

At days 0, 1, 3, 6, and 10 of preservation, the chromatometric color, and the weight loss were monitored. Two color measurements were made for each apple cube, with six cubes per Petri dish replication, and three replications per treatment.
A chromameter (Minolta CR-400, Minolta, Osaka, Japan) with an 8 mm measuring head and a D65 illuminant was used to test the surface color of the cut apple cubes. Before taking any measurements, the device was calibrated using a white reference tile (L* = 97.52, a* = −5.06, b* = 3.57). The CIELAB coordinate color space system was used to determine the L* (0 = black, 100 = white), a* (+red, −green), and b* (+yellow, −blue) color coordinates [39].
The hue angle (h°) and color saturation (C), which are the second derivative parameters of the L*, a*, and b*, were also determined, as shown below.
h o = 180 + t a n 1 b a
When a* < 0 and b* ≥ 0: 90° < Hue < 180°;
When a* > 0 and b* ≥ 0: 0° < Hue < 90°.
C = a 2 + b 2
Additionally, the browning index (BI) was calculated as described below [40]:
BI   =   100 x 0.31 0.17
where [41]
x = a + 1.75 L 5.64 L + a 0.012 b
Weight loss (WL) was measured in the same apple cubes used for chromatometric readings; three Petri dish replications for each treatment were weighed at each sampling interval during preservation. Weight loss was determined using the equation
WL   ( % ) = m t m 0 m 0 · 100
where m0 is the initial weight of the freshly cut apple cubes and mt is the weight of the apple cubes at time t of preservation [42].

2.5.3. Hardness Determination

For hardness (HNS) measurement, 9 individual typical cubes were utilized for each treatment on each preservation day. Individual apple cubes were picked at random and placed on the bottom of a single-chip setup (TA.XT plus C, Stable Micro Systems Ltd., Surrey, UK). Each cube was penetrated with a 2 mm diameter cylindrical probe at a crosshead speed of 0.8 mm/s. The texture analysis parameter employed was the absolute force required to penetrate the apple cube, which was measured in grams. After being punctured, they were frozen (−20 °C) for use in determining total phenolics and antioxidant capacity.

2.5.4. FTIR FT-IR Spectroscopy

To help explain the browning development of cut apple cubes that were uncoated and those that were coated with chitosan, FTIR analysis was utilized. FTIR analysis is a flexible method for classifying and identifying materials according to their molecular structure. It can be useful for fingerprinting coating interactions, comprehending the chemistry of browning in cut apples, or for evaluating their overall quality.
A 6700 IR (Jasco, Essex, UK) spectrometer with a DLaTGS detector, a high-throughput Single Re-flection ATR with diamond crystal, and the Spectra Manager software (Jas-co, Essex, UK) were used to obtain attenuated total reflection (ATR) FT-IR spectra. Ten scans were collected for each spectrum in the reflectance mode, with a resolution of 4 cm−1 and 32 scans per sample, spanning from 4000 to 400 cm−1.
Spectra were obtained for both uncoated and chitosan-coated cut apple cubes; the ACE of 0, 5, and 10% adjusted to pH 4.0 was utilized. Before any additional pre-processing was performed, 10 spectra from each sample were recorded and averaged to provide the corresponding overall spectrum. Spectra Manager software (V.2.15.01, JASCO, Great Dunmow, UK) was used to adjust the original spectra.

2.5.5. Visual Evaluation of Browning

A three-person trained panel evaluated the degree of browning on the cut apple cube surface using a scale of 1 to 5, where 1 indicated no browning, 3 was the moderate-limit of marketability, and 5 indicated severe browning. A standard sensory evaluation room with separate booths furnished with neutral hues and lighting was used for the visual examination. Table 1 shows in photographs the range of the five scales used. The scores of each replication (three replications per treatment) were averaged to produce a visual score index (VCS) for each treatment at days 0, 1, 3, 6, and 10 of preservation.

2.5.6. Shelf Life Determination

The shelf life was defined by the period of time it took for a unit of replication to reach a score of 3 (Table 1), which indicated that browning had proceeded to an unsatisfactory level for marketing. Three Petri dish replications (each containing 6 apple cubes) were utilized to assess shelf life, and the average shelf life for each treatment was computed for VCS. VCS was additionally correlated with the BI to create a threshold value that corresponded to a score of 3 (unacceptable degree for marketing). This value was used to determine shelf life according to BI.

2.6. Statistical Analysis

The design of the statistical analysis was completely randomized. Eleven dependent variables (L*, a*, b*, h° C, BI, VCS, HNS, WL, TPC, and DPPH) and three factors (ACE, pH adjustment and preservation period) were used in a three-way ANOVA with three replications per treatment. Analysis was performed on the main effects of the factors and their interactions. Additionally, principal component analysis (PCA) and Pearson’s correlation coefficient were also used to determine the interactions of variables. Data mean separation was performed using Duncan’s multiple range test. Statistical analyses were performed using the SPSS statistical software for Windows (version 29).

3. Results and Discussion

3.1. Total Phenolics, Antioxidant Capacity, and Total Glucosinolates of Cabbage Seeds Aqueous Extracts

Table 2 presents the concentrations of TPC, DPPH radical scavenging activity, and GSL in various levels of ACE solutions (no coating—control) and coating solutions after chitosan addition, before pH adjustment. The TPC of 5% ACE was 799.8 mg gallic acid/L and those of 10% were about double, and this difference was maintained after developing the coating solution with chitosan (1% w:w), with 1% (v/v) acetic acid, and glycerol (0.3 g/g chitosan). The same pattern was observed for DPPH radical scavenging activity. It has been reported that all natural preservation agents with anti-browning capabilities (and their aqueous extracts) have elevated TPC and antioxidant activity [43,44]. TPC and DPPH values were equivalent to those determined by Androudis et al. [27] when investigating 10 and 20% aqueous extracts of cabbage seeds, and Wessels et al. [28] while analyzing broccoli seed supercritical CO2 extract solutions.
GSL concentrations of 5% and 10% ACE were 5.41 and 7.24 mg sinigrin/g seed on a fresh weight basis, respectively. Cabbage seeds contain various glucosinolates, but the exact concentrations vary significantly between cultivars, developmental stages, and even different parts of the plant. The GSL content of ACE was within the reported range of 2.1–8.3 mg/g of cabbage seed on dry mass basis [45,46], even though the reported values were determined by different methodologies. GSL of the chitosan combinations with ACE were not detected due to the inability of chitosan to pass through the C18 cartridge. Pre-experiments demonstrated that the sample preparation phase in which phenolic compounds were retained using a C18 cartridge was necessary for determining GSL. It was evident that the phenolic compounds interfered with the determination of the GSL in ACE using the method of Ishida et al. [38]. Additionally, the effect of pH adjustment on any of the variables was found to be within the standard deviation range and is not presented.

3.2. Analysis of Variance

The study’s data (dependent variables) were colorimetric, based on CIE L*a*b* coordinate color model; organoleptic, based on visual evaluation (VCS); and physicochemical, based on the changes in weight loss or flesh hardness, as well as in phenolic component content and antioxidant activity. Enzymatic browning is commonly assessed using as variables the polyphenol oxidase activity [47,48] and/or the surface color of cut tissue; Eissa et al. [49], in order to assess enzymatic browning in apples, used the L*, a*, and b* color model, their second derivatives C and h°, and the BI, which is also calculated from the L*, a*, and b* model. Decreased L* shows darker tones associated with tissue browning, whereas positive and high a* or b* values represent red or yellow colors, both linked with enhanced tissue browning. BI is calculated using the CIE L*a*b* color space coordinates (L*, a*, and b*) determined on cut apple cubes. A higher BI value suggests a greater level of browning. Incardona et al. [50] and Luo et al. [51] investigating the effects of cutting tool quality on the main physical, chemical, and microstructural properties of fresh apples used VCS in addition to the L*, a*, and b* color model (which includes C and h° and the BI). On the other hand, Moreira et al. [52] solely employed the color parameters L* and ho for fresh-cut apple browning and indicated that brightness (L*) was considered the most significant indicator of enzymatic fruit and vegetable browning.
Table 3 displays the main effects as a function of ACE level in the presence or absence of coating, adjusted at two different pH levels and preservation times. The color of the water (control, uncoated fruit)-treated cubes differed significantly in L*, a*, b*, BI, C, and VCS when compared to apple cubes treated with ACE; however, there was no difference between the 5% and 10% ACE levels (Table 3). Apple cubes treated with ACE exhibited less browning, indicating that their quality had been maintained. Cruciferous plant part extracts were tested for their ability to reduce enzymatic browning in cut apples and other fruits or vegetables. Eissa et al. [49] prepared aqueous extracts from white cabbage leaves (Brassica oleracea L.) at levels of 5, 10, 15, 20, and 25% to evaluate the enzymatic browning of apples; the assessed inhibitory activity increased when the concentration was raised from 5% to 15%, but gradually decreased when the concentration was raised above this point. Fresh-cut apples treated with 1% broccoli seed extract were shown to have partial anti-browning properties [26]. Furthermore, treatment with aqueous extracts of cabbage seeds at 10% (w:v) was as effective as 20% or close to the bisulfate control in demonstrating anti-browning activity in lettuce leaf mid-rib segments [27]. According to Bustos et al. [26], the great efficacy of cruciferous vegetable extracts such as cauliflower and Brussels sprouts as polyphenol oxidase inhibitors increased the shelf life of chilled avocado pulp. Furthermore, cruciferous vegetables include glucosinolates [53,54], which are considered to be responsible for the effective inhibition of PPO, while the particular mechanism of action is unknown.
Most of the variables were impacted by the ACE pH level (Table 3). ACE adjusted to pH 6.0 resulted in increased L* (indicating less browning), compared to pH 4.0; other color attributes such as a*, b*, BI, C, and VCS decreased while ho increased (also indicating less browning). This indicates that adjustment of ACE to pH 6.0 was superior overall in keeping enzymatic browning low (Table 3). The optimal pH for polyphenol oxidase has been reported to be directly influenced by the type of phenolic substrate [55]. The impact of pH was also investigated by Karaibrahimoglu et al. [56], however, on apple slices treated with calcium ascorbate. Attributes a* and b* were higher and L* was lower at pH 4.0 than at pH 6.0; the pH decrease between 4.5 and 3.5 resulted in more browning on the apple’s surface, but 4.5 is generally a crucial pH for preserving apple quality. The reported conclusions on how different pH values may impact the responses of cut apple cubes as reflected by colorimetric variables are supported by the outcomes of the current experiment (Table 3).
The factors ACE strength and pH had no significant effect on the tissue HNS and WL parameters; however, the addition of a coating maintained the hardness without decreasing the weight loss when compared to uncoated samples (Table 3).
In regard to coating application, the immersion time for freshly cut apples in chitosan coatings varies from 2 min [57,58] to 30 min [49,59,60]. In the present experiment, an immersion time of 10 min was chosen for both the chitosan and ACE solutions and the coated apple cubes were left to dry for 30 min, as recommended by Karagöz & Demirdöven [59] and Demircan & Velioglu [31].
The anti-browning capacity of ACE was more effective in the absence of a coating than in its presence (1% chitosan), as evidenced by higher L* values and lower a*, BI, C, and VCS values (Table 3). The chitosan-coated apple cubes had a surprisingly lower L* and higher BI than the uncoated water-treated control, implying that coating them with chitosan might not have been sufficient to properly protect the color of freshly cut apples (Table 3). Opposite to the results of this study, apple enzymatic browning has been effectively inhibited by a 1% chitosan coating [42,58]. Luo et al. [51] postulated that the acidic nature of the chitosan solution most likely corroded the apple surface and accelerated enzymatic browning reactions by promoting the release of metal ions. This in turn facilitated reactions with enzymes or polyphenolic compounds found in apple flesh, and exacerbating oxidative processes. On the other hand, according to Batkan et al. [61], Starking Delicious apples had a pH of 3.77, making them marginally more acidic than the 4.0 of the liquids in which they were submerged. Ackah et al. [62] suggested that the application of chitosan speeds up enzymatic browning in injured apples by encouraging the phenylpropanoid pathway to produce more phenolic compounds and thereby increasing the activity of polyphenol oxidase to stimulate the oxidation of phenols to quinones. The findings of the current study, which show an increase in a*, b*, and C, and a decrease in L* and h° (Table 3), may confirm this hypothesis.
Many investigations emphasize the effects of chitosan coating on hardness and weight loss during preservation. Apples treated with chitosan reduced tissue softening, preserving hardness when compared to the control (Table 3), which is consistent with previous published works [57,63]. A chitosan coating has been reported to maintain the uniformity [51] and stability [64] of fresh-cut apples during preservation. Tissue stress after cutting might lead to loss of cohesion and texture changes, primarily due to enzymatic hydrolysis of cell wall agents caused by the action of pectinolytic enzymes such as polygalacturonase, cellulose crystallinity reduction, and cell wall thinning [57].
Another important factor influencing fresh fruit quality is the rate at which it loses weight [65]. When cut apple tissue is subjected to low relative humidity, it loses weight. Weight loss in fresh-cut fruits is associated with transpiration and a loss of storage carbon as a result of CO2 generation by respiration [51,66]. In this study apple cubes coated with chitosan lost a comparable weight to the other treatments (Table 3) and did not prove to be effective as water vapor barriers for the entire preservation duration, which is consistent with the findings of Xiao et al. [63] and Qi et al. [57]. Furthermore, due to its hygroscopic character, chitosan as a hydrocolloid does not function as an effective water vapor barrier in food substrates with high water activity. Humidity, which determines the degree of adherence of both hydrophilic and hydrophobic coating materials, could explain the fruit’s inability to generate a homogeneous coating [57]. In addition, alginate-coated apple cubes had higher relative enzyme activity values than untreated samples in the Fernades et al. [67] study; when compared to untreated samples, the coating may result in increased water activity, trapping moisture within the coated apple cubes. Because enzyme activity increases with water activity, the coating’s application was ineffective in preventing oxidation during the dehydration process.
As expected, preservation time was the most critical determinant in the development of browning in cut apple cubes (Table 3). Studies on the kinetics of enzymatic browning, a catalytic reaction that changes with time, are prevalent [68]. In the total analysis of variance, the time of preservation accumulated the highest variability as reflected by a high eta squared (Table S1). The preservation factor reduced the variable L* while raising all other parameters, including considerable changes in a*, b*, BI, C, and VCS. Regardless of the preservation conditions (low temperature and lack of light), the apple cubes’ color changes toward browning increased over time, making it the most important factor impacting their quality (Table 3). Preservation had an inversely proportionate effect on the average values of two variables, HNS and WL, decreasing HNS but increasing WL over time (Table 3).
TPC values for Delicious apple cultivars ranged from 340 to 500 mg GAE/kg FW, which was within the previously reported range of 161.9–882.4 mg GAE/kg FW, with variations attributed to factors such as cultivar, processing method, and storage conditions [69,70]. Only between the water-treated control and the ACE-treated apple cubes (5 or 10%) did the ACE level have an impact on the variables TPC and DPPH. By preventing the generation of free radicals and triggering the intracellular antioxidant defense system, TPC is known to increase antioxidant capacity [71,72]. The TPC variable was unaffected by pH adjustment, while greater DPPH values were noted at pH 6.0. The antioxidant profile and ability of chitosan to prevent fruit browning and reduce the loss of phenolic compounds has been shown to help preserve TPC and DPPH [73,74], but the uncoated samples exhibited higher TPC and DPPH values than the coated samples (Table 3). In a study of blue honeysuckle and chitosan coating, Qiao et al. [75] found that the TPC of the control samples was significantly higher than that of the chitosan-coated samples. The TPC and DPPH parameters, which were only tested on days 1 and 6, showed a tendency to decrease with the duration of preservation (Table 3).

3.3. Pearson Linear Correlation and Principal Component Analysis

To establish safe ground regarding the perception of enzymic browning by consumers, Pearson’s linear correlation coefficient was used to correlate chromatometric variable(s) with visual color as well as with physicochemical parameters. Table 4 shows the analysis of Pearson coefficients; significant strong correlations are shown among color variables (L*, a*, and b*), their second derivatives, as well as the calculated indexes (BI) and VCS (p < 0.05). HNS did not correlate with any of the other variables, indicating that enzymatic browning is rather independent of tissue softening; cut apples may be firm yet brown due to browning processes, or they may soften but not brown substantially if enzymatic browning is inhibited. TPC and DPPH were moderately correlated with all chromatometric variables except h° and VCS, but not with WL or HNS. As expected, TPC and DPPH were strongly correlated with one another.
The visual evaluation was considered the most representative indicator of browning, reflected in the variable VCS; the Pearson linear correlation coefficient of the VCS with the other variables revealed that VCS had a very high correlation with b* and C and a high correlation with L*, a*, h°, and BI, with Pearson correlation values of 0.82 and 0.79–0.66, respectively (Table 4); however, VCS showed a moderately negative association with TPC and DPPH, whereas with HNS it showed virtually no correlation (0.065).
To support the differences between treatments with respect to the variables examined (L*, a*, b*, h°, C, BI, VCS, HNS, WL, TPC, and DPPH), PCA was conducted (Figure 1). Two main components, which together accounted for 73.8% of the total variability, were extracted from the data gathered for the treatments. A PCA biplot displays the data matrix pertaining to variables (vectors) and treatments (symbols).
Potential connections between the variables themselves are also highlighted by the loading plot of PC1 vs. PC2 (Figure 1A), which displays the primary relationship between variables and principal components [76]. Vectors with similar directions indicate positively correlated variables, whereas opposing directions suggest negative correlations. The loading plots show a possible relationship between browning development and discriminative treatment aspects. As previously indicated in Table 4, the vectors of L*, h°, TPC, and DPPH point in the opposite direction to those of BI, a*, b*, h°, C, and VCS, suggesting negative connections.
Component 1, which explains 59.6% of parameter variability, was negatively influenced by variables L*, h°, TPC, and DPPH, and positively by variables a*, b*, C, BI, and VCS; component 2, which explains 14.2% of the variability, was primarily influenced by the variables WL and HNS (Figure 1A). This reveals that browning is predominantly associated with reductions in L*, h°, TPC, and DPPH, as well as increases in a*, b*, C, BI, and VCS.
As previously shown in Table 4, highly correlated groups, including L* and h° (R2 = 0712), and TPC and DPPH (R2 = 0.797), were linked on the PC1′s negative side, whereas the groups of a*, b*, C, BI, and VCS (R2 = 0.902–0.782) were coupled on the PC1′s positive side.
Day 1 and 6 of preservation were clearly separated on the PCA score plot (Figure 1B). Chitosan-coated samples were placed in the second quadrant, suggesting that the coating treatments were inferior to the control because of causing enzymatic browning. Coated and uncoated treatments were also distinguished within each preservation day (Figure 1B). The first component’s positive side (quadrants 2 and 4) showed more browning, whereas its negative side (quadrants 1 and 3) showed less. Control coating treatments found in the first quadrant exhibited the least browning on the first day of preservation, but the chitosan-treated cubes were split between the first and second quadrants. Day 6 of preservation shows similar pattern to day 1; however, only the uncoated treatments exposed to 5 or 10% ACE were found in the third quadrant, indicating the occurrence of a very low level of browning (Figure 1B).

3.4. FTIR

FT-IR (Fourier transform infrared) spectroscopy was used to investigate changes in the structural properties and identify the major functional groups involved in the reactions occurring in tissue browning. The FT-IR spectra of non-coated (water control plus ACE) and coated (chitosan control plus chitosan combined with ACE) apple cubes obtained throughout preservation for 0 or 10 days are shown in Figure 2. All spectra exhibited a noticeable decrease in both the intensity and broadness of the –OH stretching vibrations within the range of 3500–3000 cm−1 after 10 days of preservation. This change may indicate the degradation of phenolic compounds and the appearance of browning on the apple surface due to polyphenol oxidase activity, which is consistent with both visual and colorimetric measurements (Table 3). More distinct changes in the -OH band of apple cubes coated with chitosan were observed. This demonstrated the low anti-browning impact of chitosan coatings compared to uncoated ACE treatment.
As previously reported, polyphenol oxidase catalyzes the oxidation of phenolic compounds, leading to the formation of quinones [2,3,4]. Notably, in water-treated apple cubes, new peaks appeared at 2920 and 2852 cm−1 after 10 days of preservation, assigned to the asymmetric and symmetric stretching vibrations of –CH2– groups, respectively [77]. Similarly to the –OH reflectance band, changes were observed at 1637 cm−1, corresponding to the C=C and C–C stretching vibrations within the aromatic ring of phenolic compounds [78,79]. In addition, significant alterations were detected at 1673 cm−1, attributed to C–H bending vibrations in aromatic ring structures for all apple cube samples. The peaks at 1146 cm−1 and 1034 cm−1, associated with C–OH and C–O–C stretching vibrations, are characteristic of alcohols, carboxylic acids, and esters. The peak at 1044 cm−1 is attributed to C–C and C–O stretches in carbohydrate structures as well as C–O bonds in phenolic compounds. The proportionate reduction in the intensity of these peaks, which are associated with phenolic compounds, supports the finding that the ACE had an effective anti-browning impact on the apple cubes. Furthermore, it confirms that chitosan had limited anti-browning efficiency when compared to ACE. These observations are in agreement with findings reported by Irchad et al. [80] and Hssaini et al. [81].

3.5. Visual Color Score, Browning Index, and Shelf Life

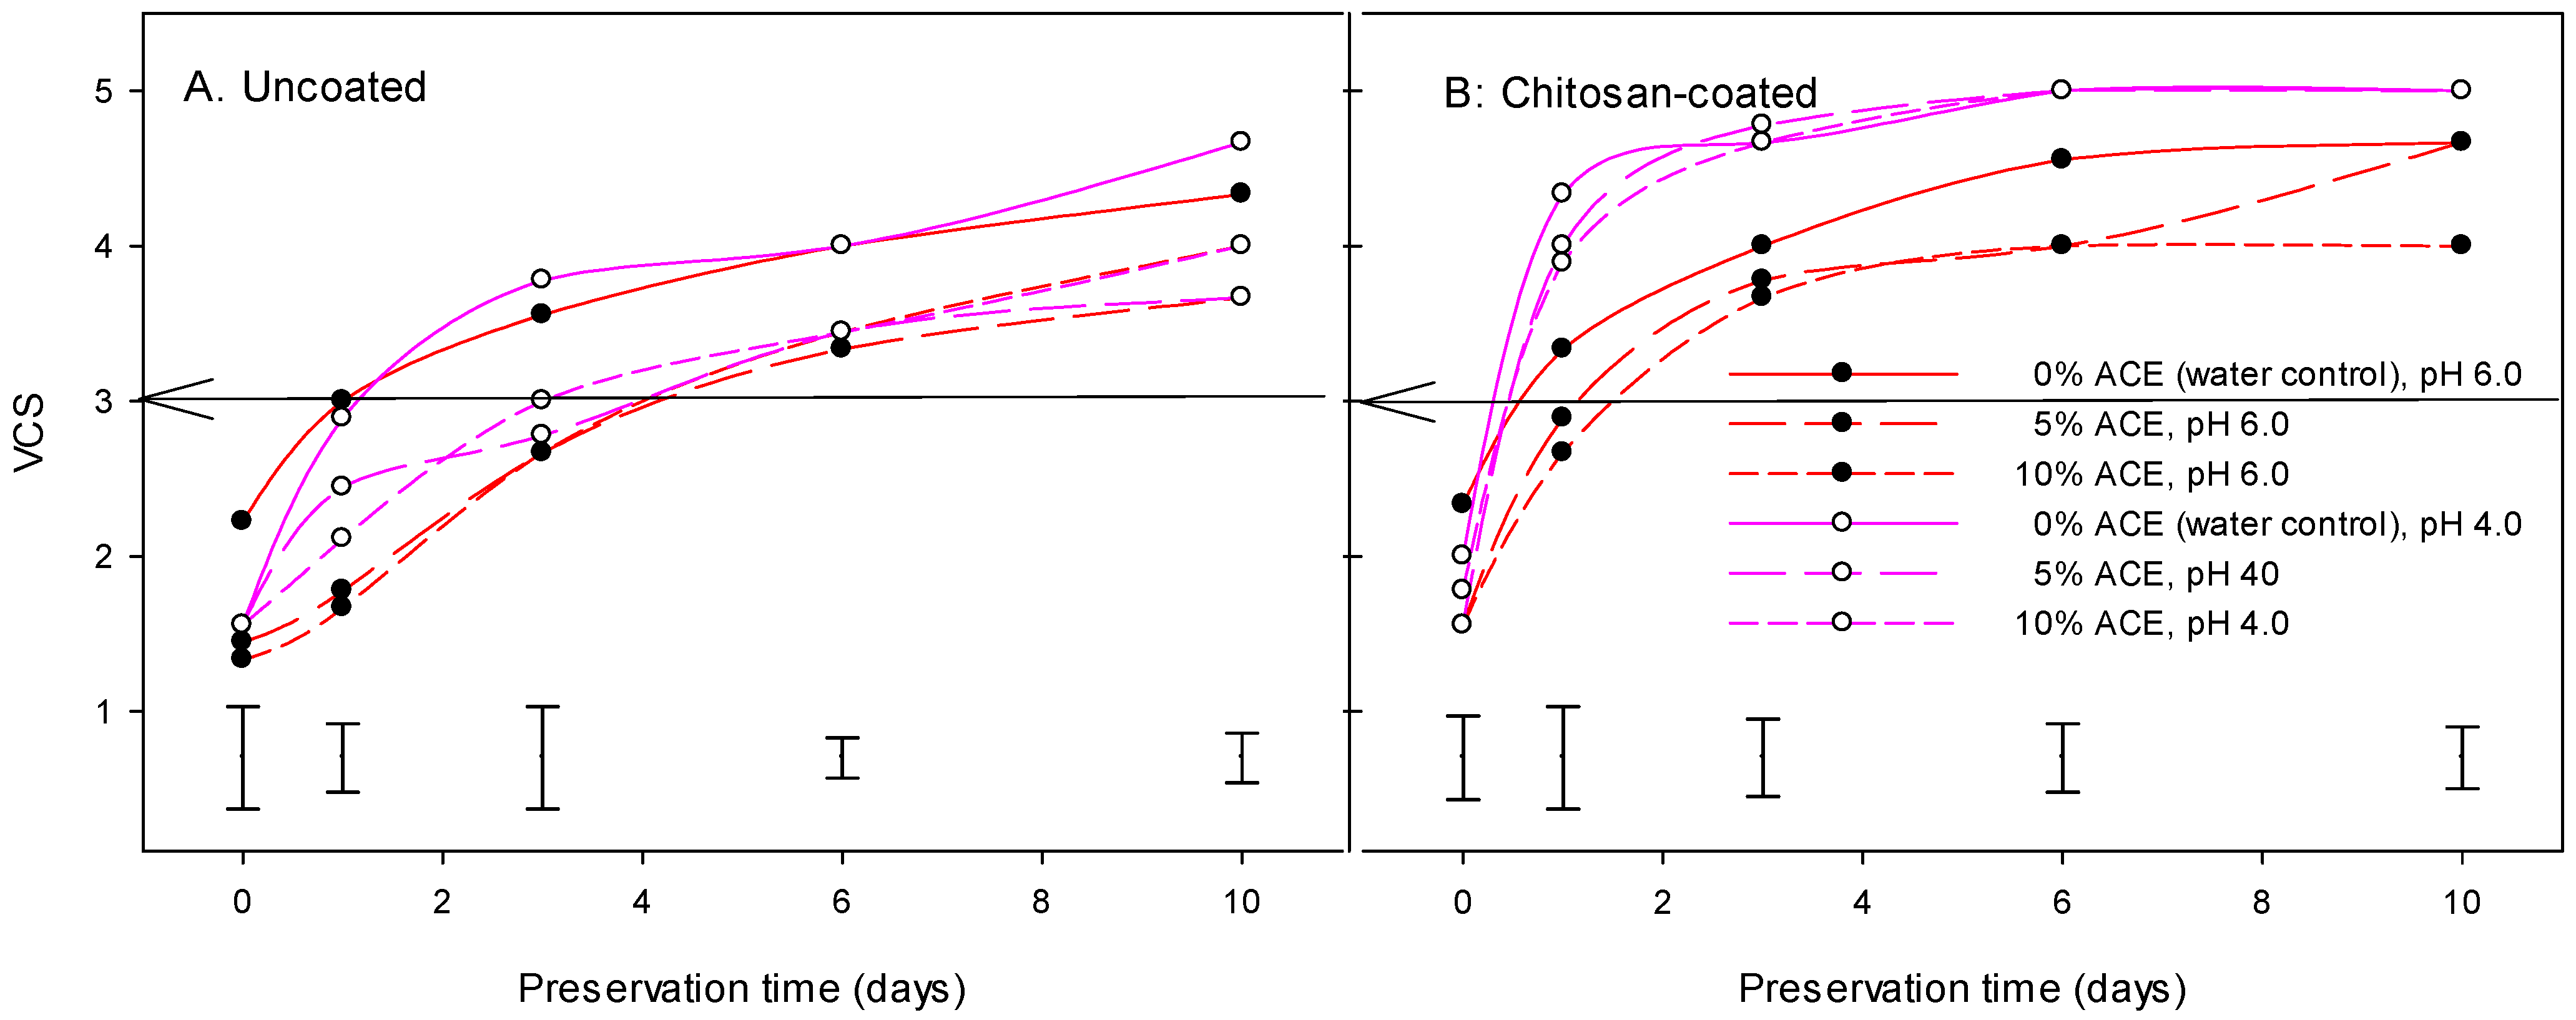
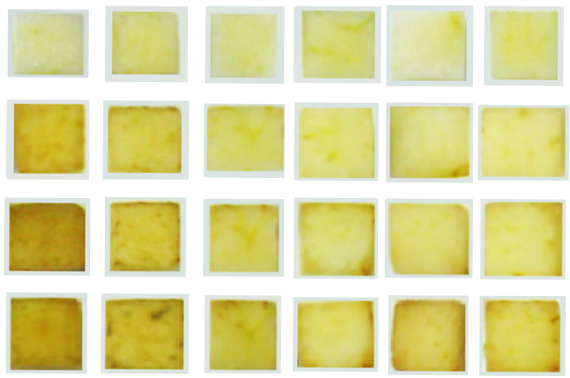
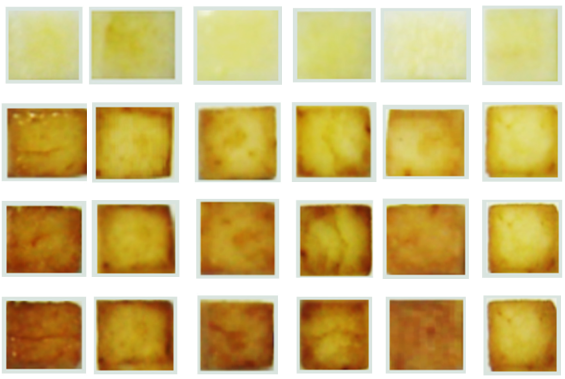
Figure 3A,B and Table 5 show the development of browning, expressed as VCS, for uncoated and chitosan-coated apple cubes, respectively, during preservation for 10 days at 7 °C. All treatments showed an increase in VCS which continued to increase until the end of the preservation period, but the treatments with chitosan showed a greater increase. The changes in the appearance of fresh-cut apple cubes reflecting visual color during preservation are shown in Table 5.
The pH adjustment of the ACE employed in the uncoated treatments had no significant effect on the change in VCS of apple cubes over time; however, treatments adjusted to pH 4.0 reached VCS values beyond the acceptable limit of 3/5 more quickly than pH 6.0 (Figure 3, Table 5). The VCS of uncoated apple cubes treated with water-control (0% ACE) reached the acceptable sales level in one day, whereas those treated with 5 or 10% ACE took about four days; the exception was the treatment with 10% ACE adjusted to pH 4, which took 3 days.
Throughout the preservation period, chitosan-coated apple cubes adjusted to pH 4.0 had significantly higher VCS values than those adjusted to pH 6.0 (Table 5). This is demonstrated by the fact that applying ACE adjusted to pH 4.0 to the coating resulted in VCS values above the accepted sales limit of 3/5 upon treatment (day 0), whereas adjustment to pH 6.0 kept the VCS within acceptable limits for just one day (Figure 3, Table 5). These findings highlight that adjusting ACE to pH 6.0 was more effective in delaying visible browning and preserving marketability.
The demand for fresh-cut fruit reflects consumer preferences towards appearance and freshness at the time of purchase as being among the main quality criteria [1]. Browning is another challenge for fresh-cut apple preservation, which significantly affects consumer perceptions among other sensory parameters [48,82].
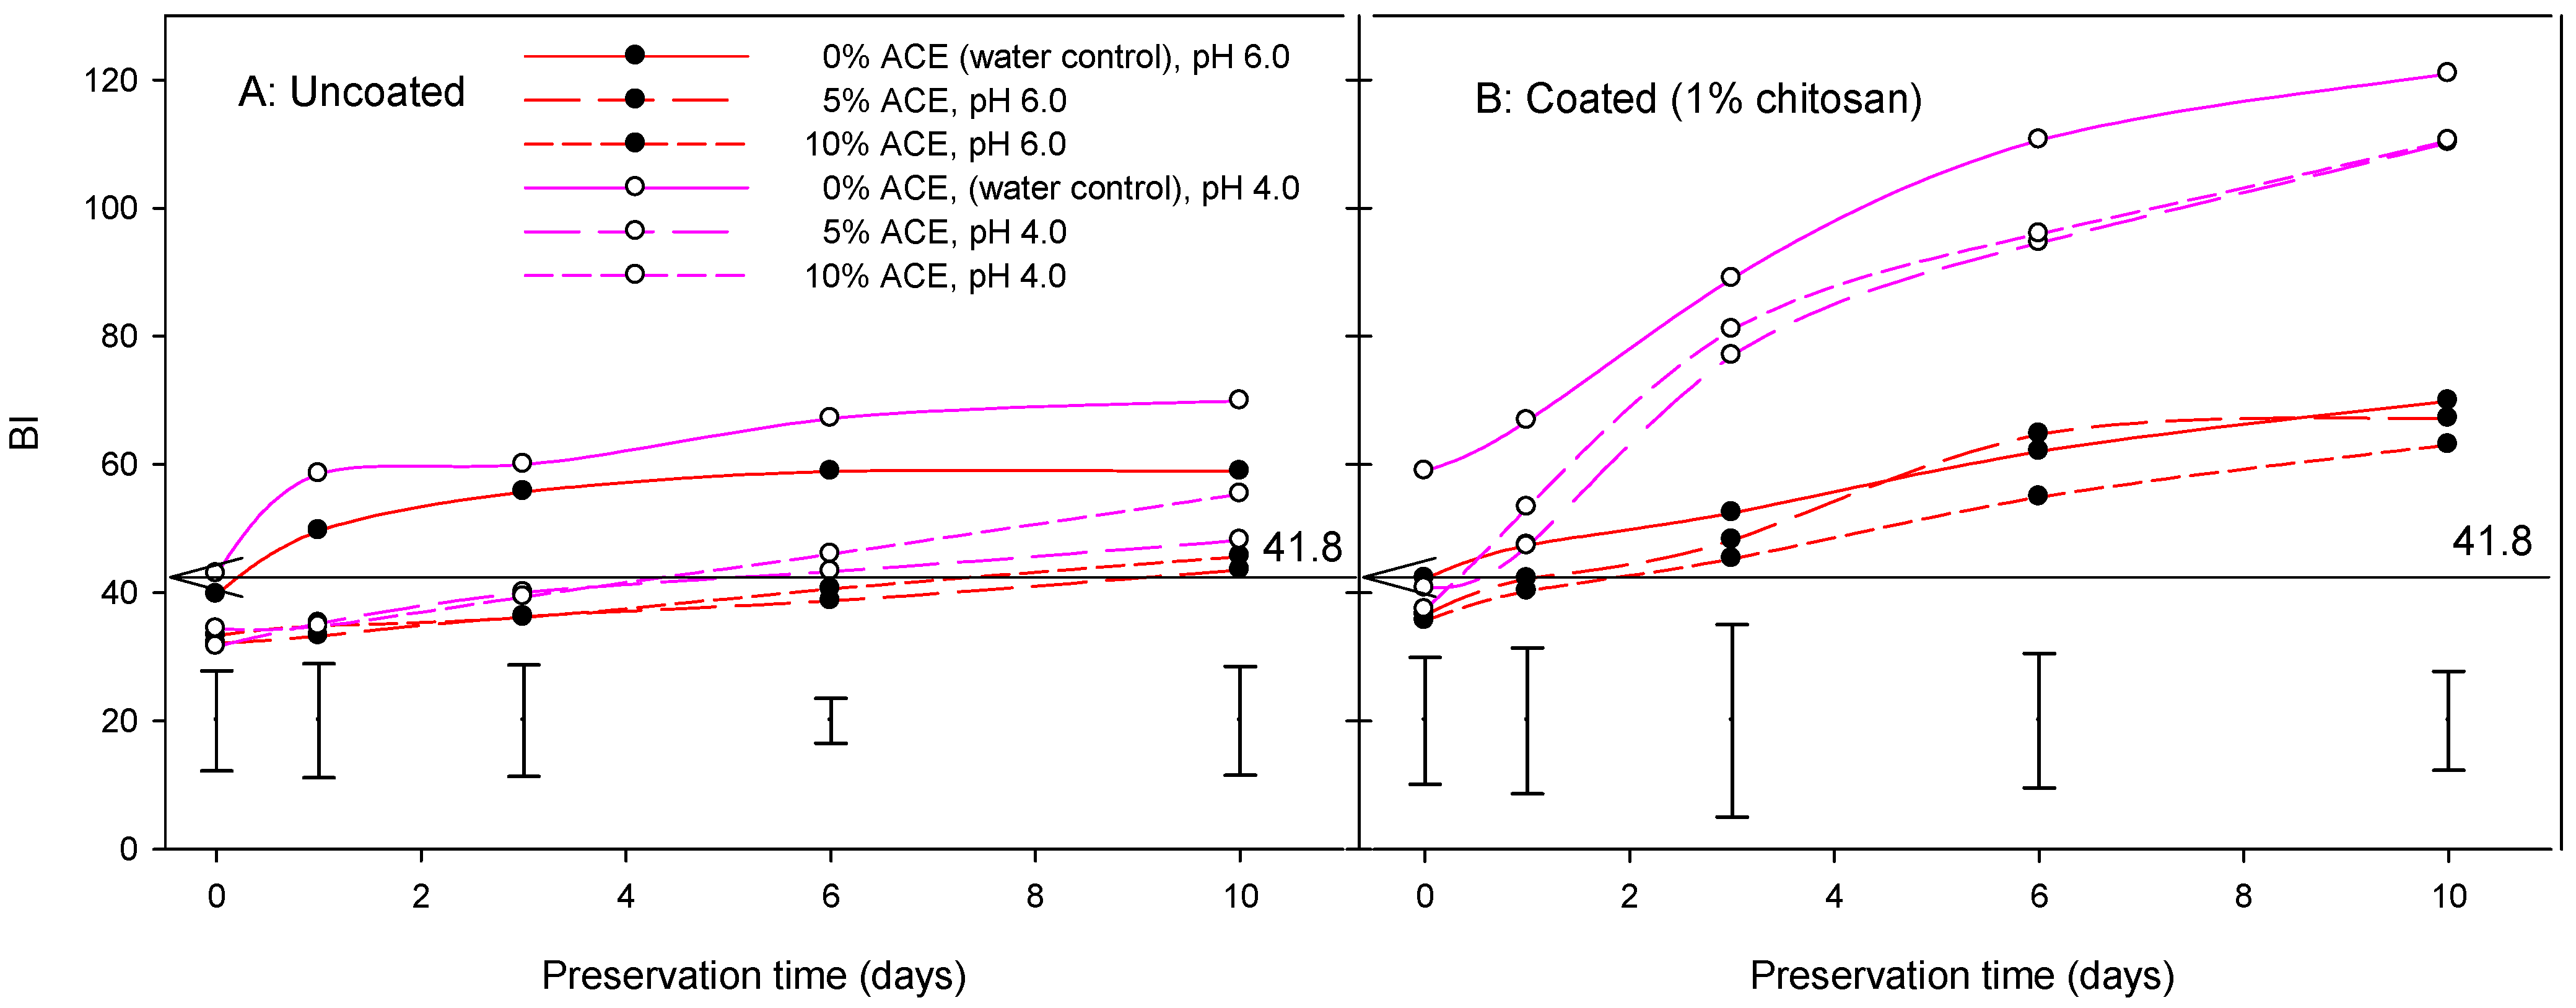
Correlation of VCS with BI (R2 = 0.837, p < 0.05), using the curve-fitting model of exponential growth, a single third parameter, indicates that the acceptable limit (a VCS score of 3/5) corresponds to a BI value of 41.85 (Figure S1). Androudis et al. [27], who used aqueous cabbage extracts on freshly cut lettuce stem sections, discovered an approximate threshold acceptable value for BI of 40. Figure 4A,B depict the development of browning, indicated as BI, in ACE-treated apple cubes (coated and uncoated) preserved for 10 days at 7 °C. In general, BI rose during preservation, whereas chitosan treatments caused a substantially larger rise.
Apple cubes coated with ACE adjusted to pH 4.0 showed maximum BI values from the beginning (>40) to the end (>100) of preservation duration (Figure 4B), followed by the uncoated controls (0% ACE) adjusted to either pH 4.0 or 6.0 (Figure 4A). Apple cubes subjected to coating with ACE plus chitosan adjusted to pH 6.0 showed intermediate BI (values of ~60 at the end of preservation), while minimum BI was noted in treatments of 5 or 10% ACE without coating (Figure 4A).
BI was more sensitive than VCS for the majority of the treatments. However, under the treatment of 5% ACE adjusted to pH 6.0, BI values remained below 41.85 for the whole preservation duration (Figure 4A), despite the fact that VCS had risen over 3 by day 4 (Figure 3A) and the average color had altered to darker brownish tones between days 3 and 6 (Table 5). This was probably due to perceptual sensitivity differences between human scoring and instrumental color change. Similar was the case for ho (Figures S1 and S2) The decrease in BI values correlated with the increase in L values during preservation. Karseno et al. [83] used BI to describe the browning of fresh-cut apples.
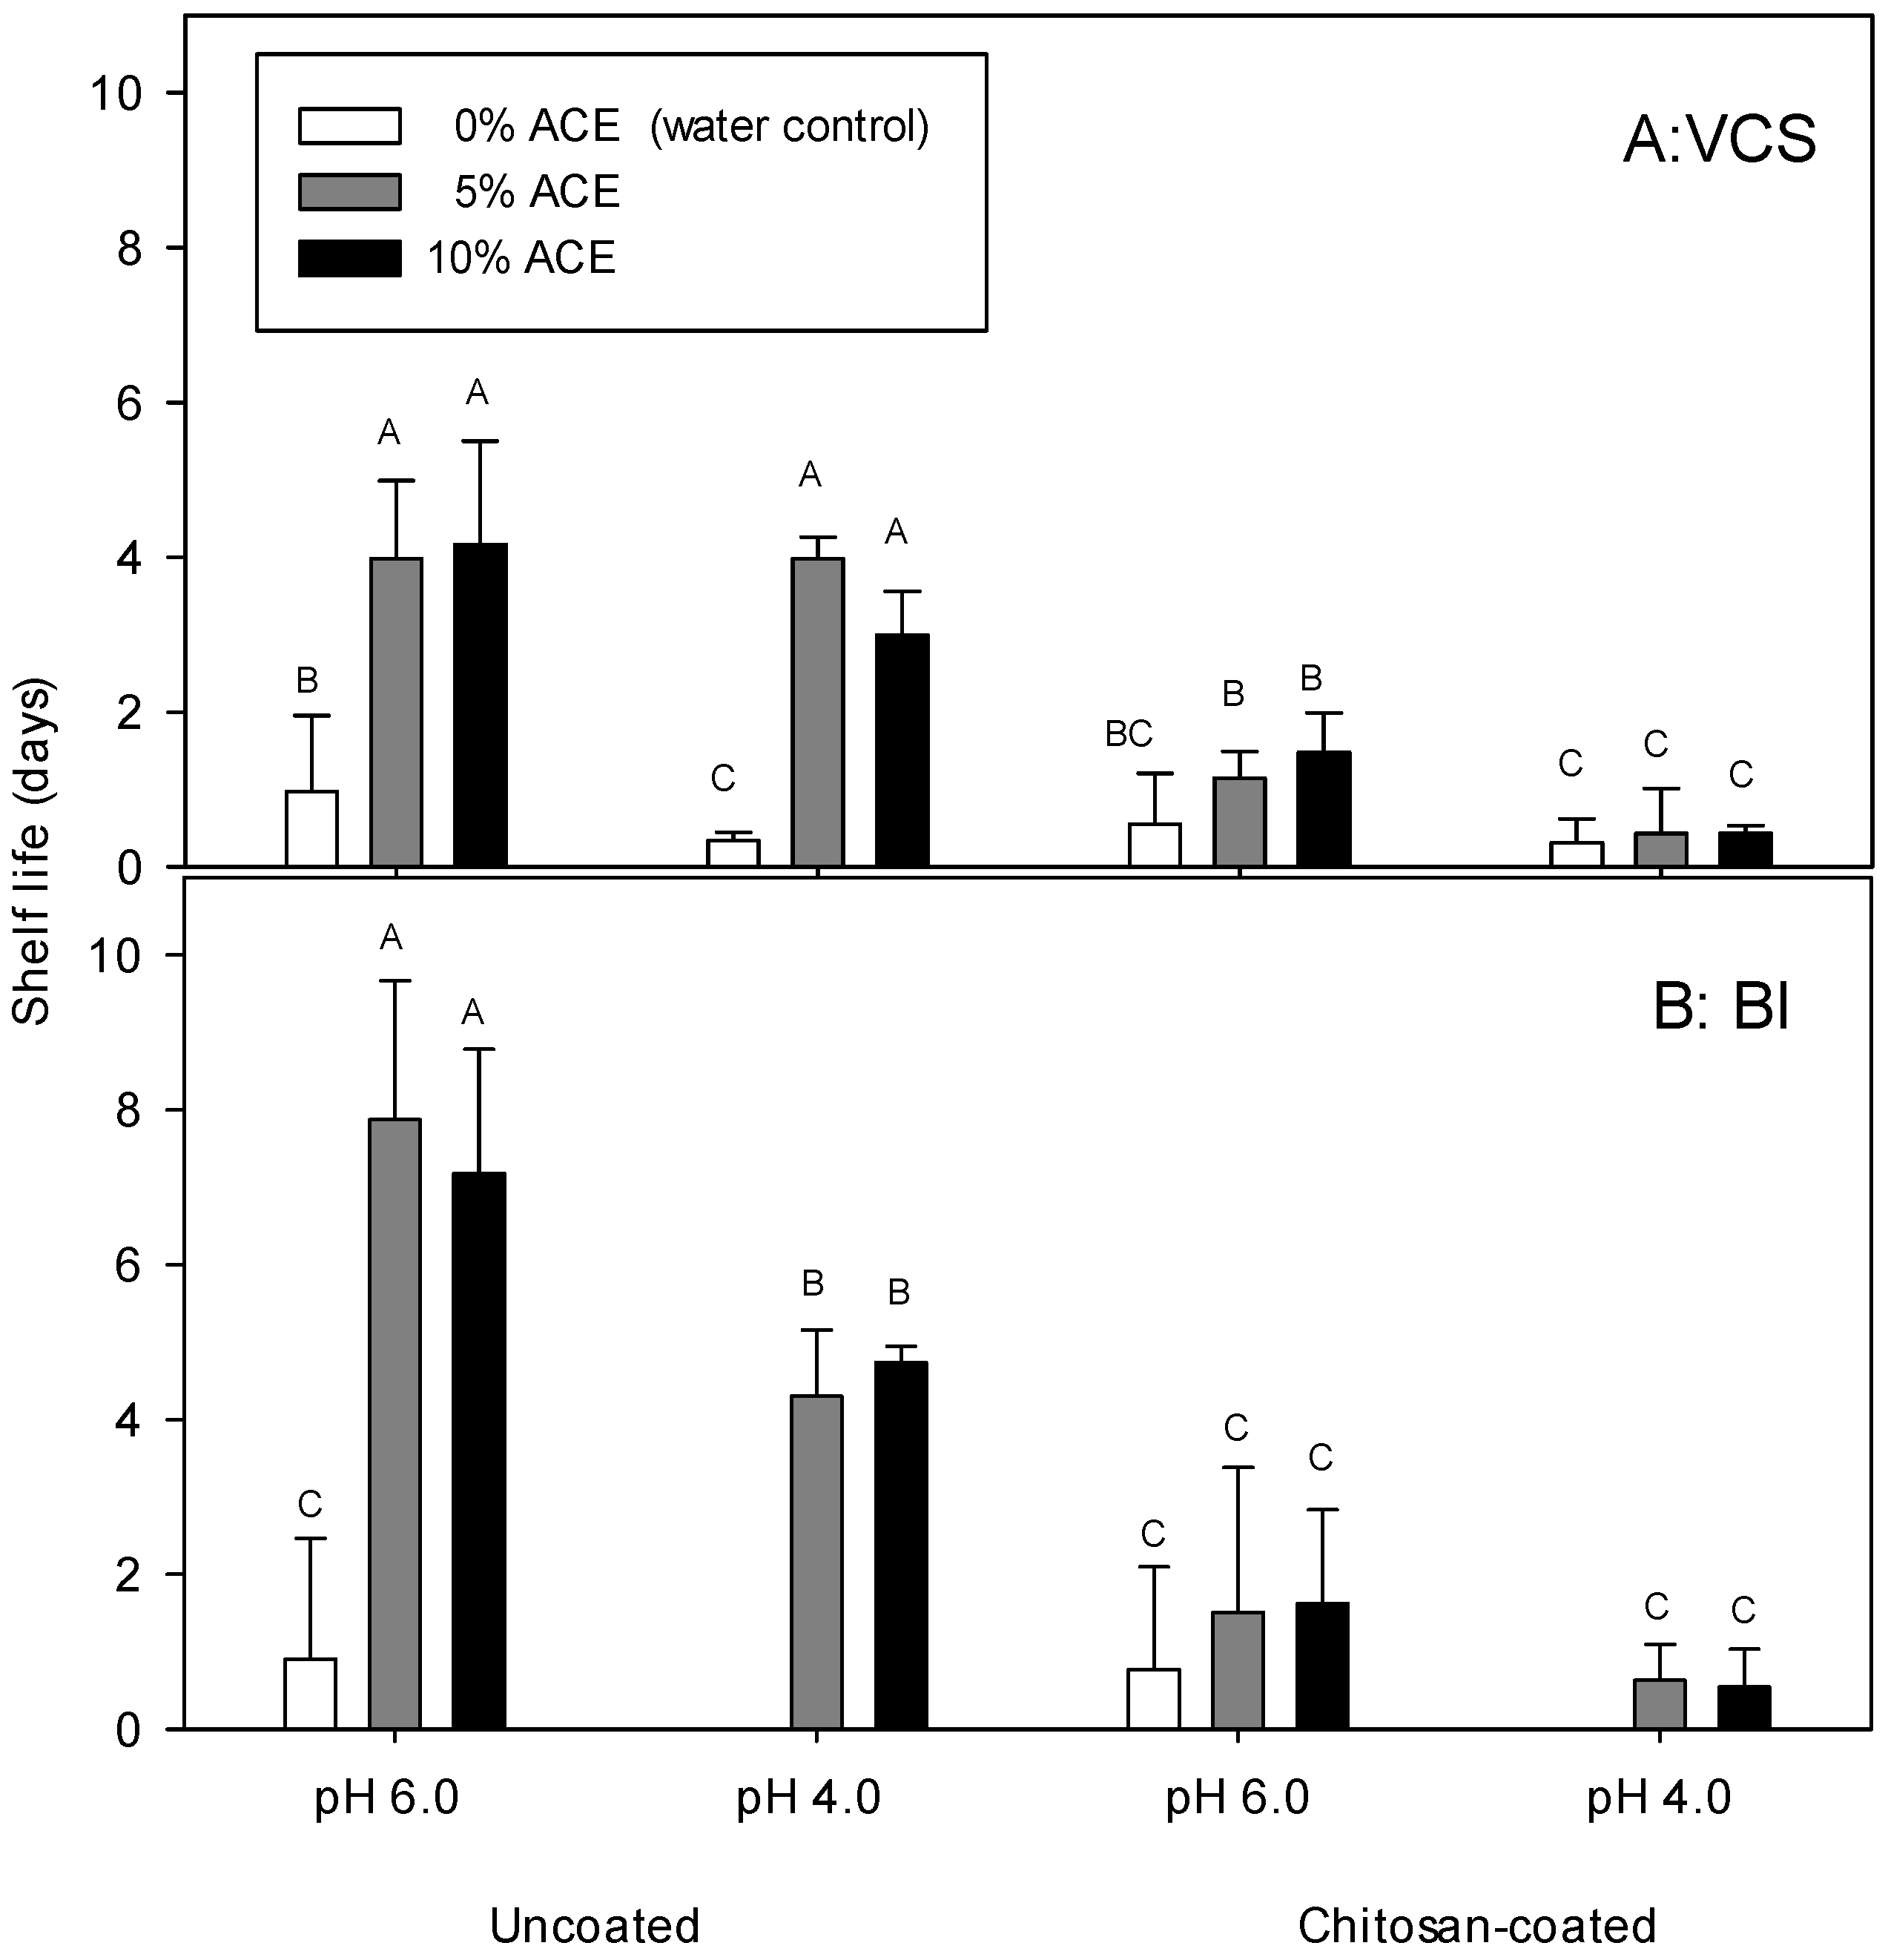
The shelf life was determined as the total time it took for apple cubes to reach the VCS threshold of 3/5, with the corresponding value for BI being 41.85, indicating that browning had proceeded to an undesirable level. VCS was acquired from three Petri dishes, three replicates per treatment (6 apple cubes per replication) and shelf life was calculated using the average shelf life of each Petri dish (three replicates) per treatment. For cases when the sample did not approach the value 3 on a given day but instead proceeded right to a higher value, the Acceptance Rate vs. Preservation Time curve was used to estimate the day when it passed from a “threshold of 3” on a scale of 1–5. Following the analysis of variance, the means were compared using the least significant difference (LSD) method at a 95% confidence level; treatments marked with different letters (A, B, and C) differ significantly (p < 0.05) (Figure 5).
The treatments with the best performance were uncoated 5% and 10% ACE adjusted to pH = 6.0, or to pH = 4.0, which provided 4.0 and 4.2, or 4 and 3.6 days of effective acceptable brown color levels based on VCS (Figure 5A). On the other hand, the addition of chitosan did not result in an extension of shelf life, compared to uncoated water control (Figure 5A). The combination of ACE and chitosan failed to extend shelf life, most likely due to metal ion permeability issues intensifying oxidative processes [51] or stimulating oxidation via the production of phenol substrates [62], as previously discussed.
BI was found to be more sensitive for calculating shelf life (Figure 5B). Uncoated apples treated with 5% and 10% ACE at pH 6.0 had a shelf life extension of 7–8 days, compared to only 4–4.5 days at pH 4.0 (p < 0.05). Chitosan coatings had a similar shelf life for both VCS and BI calculations (Figure 5B).
According to Rojas-Graü et al. [84], fresh-cut fruit’s browning may be delayed by natural sulfur compounds. Glucosinolates, which are naturally occurring sulfur- and nitrogen-containing chemicals that have been discovered to be present in cruciferous vegetables, and may be responsible for the anti-browning characteristics of ACEs. To determine the impact of one or both kinds of phytochemicals on the enzymatic browning of fresh-cut apple more research and examination of the interrelationship between phenolic and glucosinolate profile and ACE may be required.

4. Conclusions

In this study, the ACEs were found to have a high phenolic and glucosinolate content, with the 10% level significantly higher than the 5%. Untreated cut apples began browning to unsatisfactory levels (based on VCS assessment) on day one, whereas 5 or 10% ACE treatment delayed it until day four of preservation, which was regarded as the effective shelf life. When BI was used to calculate shelf life, ACE treatments were found to delay browning until day 8 of preservation. This indicated that BI has a different sensitivity to browning than VCS. However, both were regarded as valid indices of enzymatic browning; to balance sensitivities, the VCS scale might be based on a 1–9 range.
Furthermore, ACE modified to pH 6.0 was more efficient than that at pH 4.0 in delaying the browning of cut apples. However, the pH issue may require further investigation to maximize the shelf life extension of cut apples.
After applying chitosan coatings (without or with the addition of ACE) to apple cubes, they developed browning to unsatisfactory levels as early as day one, as did the uncoated water control. These findings were supported by FT-IR analysis during preservation. Considering these results, chitosan coatings are not recommended for Starking Delicious cut apples. Further research is required to clearly show the mechanism of chitosan action.
This study shows that the compounds present in cabbage seeds may inhibit browning reactions in a cut apple cube model. However, the possible anti-browning capabilities of the ACE must be assigned to specific chemicals in future research, which will employ more advanced analysis techniques (HPLC, LC-MS/MS) as well as validation across various cut fruits and vegetables.

Supplementary Materials

The following supporting information can be downloaded at: https://www.mdpi.com/article/10.3390/horticulturae11080953/s1, Table S1. Analysis of variance for the variables L*, a*, b* hue angle (ho), and saturation (C), as well as indices for browning (BI), visual color score (VCS), hardness (HNS), weight loss (WL), phenolic compounds (TPCs), and antioxidant capacity (DPPH) obtained during the 10 day/7 °C preservation of cut apple cubes previously exposed to the aqueous extracts (ACEs) of cabbage seeds (5 and 10% w:v) adjusted to pH 4.0 and 6.0, as well as coatings with water (control) or 1% chitosan; Figure S1. Regression of (A) browning index (BI) and of (B) hue angle (ho) values of cut apple cubes stored for 10 days at 7 °C after being treated with aqueous cabbage seed extracts (ACEs) of 0, 5, and 10% (w:w, seed–water) and adjusted to pH 6.0 or 4.0. The extracts were utilized either straight (uncoated) or with 1% chitosan added (coated). Vertical arrows represent the acceptable/unacceptable VCS value borderline, while horizontal arrows indicate the value BI or ho* that corresponds to the acceptable/unacceptable VCS value; Figure S2. Development of enzymatic browning based on hue angle-(ho) of cut apple cubes during preservation for 10 days at 7 °C, previously exposed to aqueous cabbage seed extracts (ACEs) of 0, 5 and 10% (w:w, seed:water) adjusted to pH 6.0 or 4.0. The extract was used directly (uncoated) (A) or after the incorporation of 1% chitosan (coating) (B). Vertical bars in each figure represent the least significant difference method (LSD) at each sampling date and a confidence level of 0.05. Arrows indicate borderline of acceptable/unacceptable color.

Author Contributions

Conceptualization, D.G.; methodology, D.A. and A.G.; project execution, D.A. and A.G.; formal analysis, A.G. and D.A.; writing—original draft preparation, D.G., D.A. and A.G.; writing—review and editing, D.G.; supervision, D.G.; project administration, D.G. All authors have read and agreed to the published version of the manuscript.

Funding

This research received no external funding.

Data Availability Statement

The data presented in this study are available on request from the corresponding author.

Conflicts of Interest

The authors declare no conflicts of interest.

References

  1. Xin, Y.; Yang, C.; Zhang, J.; Xiong, L. Application of Whey Protein-Based Emulsion Coating Treatment in Fresh-Cut Apple Preservation. Foods 2023, 12, 1140. [Google Scholar] [CrossRef]
  2. Wang, Y.; Zhang, J.; Wang, D.; Wang, X.; Zhang, F.; Chang, D.; You, C.; Zhang, S.; Wang, X. Effects of Cellulose Nanofibrils Treatment on Antioxidant Properties and Aroma of Fresh-Cut Apples. Food Chem. 2023, 415, 135797. [Google Scholar] [CrossRef]
  3. Yoruk, R.; Marshall, M.R. Physicochemical Properties and Function of Plant Polyphenol Oxidase: A Review. J. Food Biochem. 2003, 27, 361–422. [Google Scholar] [CrossRef]
  4. Azevedo, V.M.; Dias, M.V.; De Siqueira Elias, H.H.; Fukushima, K.L.; Silva, E.K.; De Deus Souza Carneiro, J.; De Fátima Ferreira Soares, N.; Borges, S.V. Effect of Whey Protein Isolate Films Incorporated with Montmorillonite and Citric Acid on the Preservation of Fresh-Cut Apples. Food Res. Int. 2018, 107, 306–313. [Google Scholar] [CrossRef]
  5. Chen, C.; Jiang, A.; Liu, C.; Wagstaff, C.; Zhao, Q.; Zhang, Y.; Hu, W. Hydrogen Sulfide Inhibits the Browning of Fresh-Cut Apple by Regulating the Antioxidant, Energy and Lipid Metabolism. Postharvest Biol. Technol. 2021, 175, 111487. [Google Scholar] [CrossRef]
  6. Shrestha, L.; Kulig, B.; Moscetti, R.; Massantini, R.; Pawelzik, E.; Hensel, O.; Sturm, B. Optimisation of Physical and Chemical Treatments to Control Browning Development and Enzymatic Activity on Fresh-Cut Apple Slices. Foods 2020, 9, 76. [Google Scholar] [CrossRef]
  7. Loizzo, M.R.; Tundis, R.; Menichini, F. Natural and Synthetic Tyrosinase Inhibitors as Anti-Browning Agents: An Update. Compr. Rev. Food Sci. Food Saf. 2012, 11, 378–398. [Google Scholar] [CrossRef]
  8. Lyengar, R.; McEvily, A.J. Anti-browning Agents: Alternatives to the Use of Sulfites in Foods. Trends Food Sci. Tech. 1992, 3, 60–64. [Google Scholar] [CrossRef]
  9. Oms-Oliu, G.; Rojas-Graü, M.A.; González, L.A.; Varela, P.; Soliva-Fortuny, R.; Hernando, M.I.H.; Munuera, I.P.; Fiszman, S.; Martín-Belloso, O. Recent Approaches Using Chemical Treatments to Preserve Quality of Fresh-Cut Fruit: A Review. Postharvest Biol. Technol. 2010, 57, 139–148. [Google Scholar] [CrossRef]
  10. Mouzahim, M.E.; Eddarai, E.M.; Eladaoui, S.; Guenbour, A.; Bellaouchou, A.; Zarrouk, A.; Boussen, R. Effect of Kaolin Clay and Ficus carica Mediated Silver Nanoparticles on Chitosan Food Packaging Film for Fresh Apple Slice Preservation. Food Chem. 2023, 410, 135470. [Google Scholar] [CrossRef]
  11. Du, T.; Li, X.; Wang, S.; Su, Z.; Sun, H.; Wang, J.; Zhang, W. Phytochemicals-Based Edible Coating for Photodynamic Preservation of Fresh-Cut Apples. Food Res. Int. 2023, 163, 112293. [Google Scholar] [CrossRef]
  12. Hu, K.; Wang, Q.; Hu, L.; Gao, S.; Wu, J.; Li, Y.; Zheng, J.; Han, Y.; Liu, Y.; Zhang, H. Hydrogen Sulfide Prolongs Postharvest Storage of Fresh-Cut Pears (Pyrus pyrifolia) by Alleviation of Oxidative Damage and Inhibition of Fungal Growth. PLoS ONE 2014, 9, e85524. [Google Scholar] [CrossRef]
  13. Chaisakdanugull, C.; Theerakulkait, C.; Wrolstad, R.E. Pineapple Juice and Its Fractions in Enzymatic Browning Inhibition of Banana [Musa (AAA Group) Gros Michel]. J. Agric. Food Chem. 2007, 55, 4252–4257. [Google Scholar] [CrossRef] [PubMed]
  14. Martín-Diana, A.B.; Rico, D.; Barry-Ryan, C. Green Tea Extract As a Natural Antioxidant to Extend The Shelf-Life of Fresh-Cut Lettuce. Innov. Food Sci. Emerg. Technol. 2008, 9, 593–603. [Google Scholar] [CrossRef]
  15. Yu, Z.; Zhang, Z.; Zeng, W. Investigation of antibrowning activity of pine needle (Cedrus deodara) extract with fresh-cut apple slice model and identification of the primary active components. Eur. Food Res. Technol. 2014, 239, 669–678. [Google Scholar] [CrossRef]
  16. Kim, M.J.; Kim, C.Y.; Park, I. Prevention of Enzymatic Browning of Pear by Onion Extract. Food Chem. 2008, 89, 181–184. [Google Scholar] [CrossRef]
  17. Lee, M.K. Inhibitory Effect of Banana Polyphenol Oxidase During Ripening of Banana by Onion Extract and Maillard Reaction Products. Food Chem. 2007, 102, 146–149. [Google Scholar] [CrossRef]
  18. Sukhontha, S.; Kunwadee, K.; Chockchai, T. Inhibitory Effect of Rice Bran Extracts and Its Phenolic Compounds on Polyphenol Oxidase Activity and Browning in Potato and Apple Puree. Food Chem. 2016, 190, 922–927. [Google Scholar] [CrossRef]
  19. Liu, X.; Yang, Q.; Lu, Y.; Li, Y.; Li, T.; Zhou, B.; Qiao, L. Effect of Purslane (Portulaca oleracea L.) Extract on Anti-Browning of Fresh-Cut Potato Slices during Storage. Food Chem. 2019, 283, 445–453. [Google Scholar] [CrossRef]
  20. Supapvanich, S.; Yimpong, A.; Srisuwanwichan, J. Browning Inhibition on Fresh-Cut Apple by the Immersion of Liquid Endosperm from Mature Coconuts. J. Food Sci. Technol. 2020, 57, 4424–4431. [Google Scholar] [CrossRef]
  21. Qiao, L.; Wang, H.; Shao, J.; Lu, L.; Tian, J.; Liu, X. A Novel Mitigator of Enzymatic Browning—Hawthorn Leaf Extract and its Application in the Preservation of Fresh-Cut Potatoes. Food Qual. Saf. 2021, 5, 1399–2399. [Google Scholar] [CrossRef]
  22. Chen, X.; Ren, L.; Li, M.; Qian, J.; Fan, J.; Du, B. Effects of Clove Essential Oil and Eugenol on Quality and Browning Control of Fresh-Cut Lettuce. Food Chem. 2017, 214, 432–439. [Google Scholar] [CrossRef]
  23. Bin, Y.; Tian, M.; Xie, J.; Wang, M.; Chen, C.; Jiang, A. Bamboo Leaf Extract Treatment Alleviates the Surface Browning of Fresh-Cut Apple by Regulating Membrane Lipid Metabolism and Antioxidant Properties. J. Sci. Food Agric. 2023, 104, 2888–2896. [Google Scholar] [CrossRef] [PubMed]
  24. Landi, M.; Degl’Innocenti, E.; Guglielminetti, L.; Guidi, L. Role of Ascorbic Acid in the Inhibition of Polyphenol Oxidase and the Prevention of Browning in Different Browning-Sensitive Lactuca sativa var. capitata (L.) and Eruca sativa (Mill.) Stored as Fresh-Cut Produce. J. Sci. Food Agric. 2013, 93, 1814–1819. [Google Scholar] [CrossRef]
  25. Zocca, F.; Lomolino, G.; Lante, A. Antibrowning Potential of Brassicacaea Processing Water. Biores. Technol. 2010, 101, 3791–3795. [Google Scholar] [CrossRef]
  26. Bustos, M.C.; Mazzobre, M.F.; Buera, M.P. Stabilization of Refrigerated Avocado Pulp: Chemometrics-Assessed Antibrowning Allium and Brassica Extracts as Effective Lipid Oxidation Retardants. Food Bioprocess Technol. 2017, 10, 1142–1153. [Google Scholar] [CrossRef]
  27. Androudis, E.; Gerasopoulos, A.; Koukounaras, A.; Siomos, A.S.; Gerasopoulos, D. Water Extracts of Cruciferous Vegetable Seeds Inhibit Enzymic Browning of Fresh-Cut Mid Ribs of Romaine Lettuce. Horticulturae 2024, 10, 500. [Google Scholar] [CrossRef]
  28. Wessels, B.; Damm, S.; Kunz, B.; Schulze-Kaysers, N. Effect of Selected Plant Extracts on the Inhibition of Enzymatic Browning in Fresh-Cut Apple. J. Appl. Bot. Food Qual. 2014, 87, 16–23. [Google Scholar] [CrossRef]
  29. Gerasopoulos, A.; Mantzouridou, F.T.; Nenadis, N. Physicochemical Properties of Olive Leaf Powders and Incorporation in Chitosan-Based Edible Films for Improved Functionality. Food Hydrocoll. 2024, 160, 110748. [Google Scholar] [CrossRef]
  30. Diab, T.; Biliaderis, C.G.; Gerasopoulos, D.; Sfakiotakis, E. Physicochemical Properties and Application of Pullulan Edible Films and Coatings in Fruit Preservation. J. Sci. Food Agric. 2001, 81, 988–1000. [Google Scholar] [CrossRef]
  31. Demircan, B.; Velioglu, Y.S. Control of Browning, Enzyme Activity, and Quality in Stored Fresh-cut Fruit Salads through Chitosan Coating Enriched with Bergamot Juice Powder. Foods 2024, 13, 147. [Google Scholar] [CrossRef] [PubMed]
  32. Nair, S.M.; Saxena, A.; Kaur, C. Effect of Chitosan and Alginate Based Coatings Enriched with Pomegranate Peel Extract to Extend the Postharvest Quality of Guava (Psidium guajava L.). Food Chem. 2018, 240, 245–252. [Google Scholar] [CrossRef] [PubMed]
  33. Peng, Y.; Wang, Q.; Shi, J.; Chen, Y.; Zhang, X. Optimization and Release Evaluation for Tea Polyphenols and Chitosan Composite Films with Regulation of Glycerol and Tween. Food Sci. Technol. 2019, 40, 162–170. [Google Scholar] [CrossRef]
  34. AOCS. Official Methods and Recommended Practices of the American Oil Chemists’ Society, 4th ed.; American Oil Chemists’ Society: Champaign, IL, USA, 1990. [Google Scholar]
  35. Scalbert, A.; Monties, B.; Janin, G. Tannins in Wood: Comparison of Different Estimation Methods. J. Agric. Food Chem. 1989, 37, 1324–1329. [Google Scholar] [CrossRef]
  36. Brand-Williams, W.; Cuvelier, M.E.; Berset, C. Use of a Radical Method to Evaluate Antioxidant Activity. LWT Food Sci. Technol. 1995, 28, 25–30. [Google Scholar] [CrossRef]
  37. Nenadis, N.; Kyriakoudi, A.; Tsimidou, M.Z. Impact of Alkaline or Acid Digestion to Antioxidant Activity, Phenolic Content and Composition of Rice Hull Extracts. LWT-Food Sci. Technol. 2013, 54, 207–215. [Google Scholar] [CrossRef]
  38. Ishida, M.; Hara, M.; Fukino, N.; Kakizaki, T.; Morimitsu, Y. Glucosinolate Metabolism, Functionality and Breeding for the Improvement of Brassicaceae Vegetables. Breed. Sci. 2014, 64, 48–59. [Google Scholar] [CrossRef]
  39. Lancaster, J.E.; Lister, C.E.; Reay, P.F.; Triggs, C.M. Influence of Pigment Composition on Skin Color in a Wide Range of Fruit and Vegetables. J. Amer. Soc. Hortic. Sci. 1997, 122, 594–598. Available online: https://journals.ashs.org/downloadpdf/view/journals/jashs/122/4/article-p594.pdf (accessed on 7 March 2025). [CrossRef]
  40. Palou, E.; Lopez-Malo, A.; Barbosa-Canovas, G.V.; Welti-Chanes, J.; Swanson, G.B. Polyphenoloxidase Activity and Colour of Balanced and High Hydrostatic Pressure Treated Banana Puree. J. Food Sci. 1999, 64, 42–45. [Google Scholar] [CrossRef]
  41. Bolin, H.R.; Huxsoll, C.C. Control of Minimally Process Carrot (Daucus carota) Surface Discoloration Caused by Abrasion Peeling. J. Food Sci. 1991, 56, 416–418. [Google Scholar] [CrossRef]
  42. Özdemir, K.S.; Gökmen, V. Effect of Chitosan-Ascorbic Acid Coatings on the Refrigerated Storage Stability of Fresh-Cut Apples. Coatings 2019, 9, 503. [Google Scholar] [CrossRef]
  43. Bustos, M.C.; Agudelo-Laverde, L.M.; Mazzobre, F.; Buera, M.P. The Relationship between Antibrowning, Anti-Radical and Reducing Capacity of Brassica and Allium Extracts. Int. J. Food Stud. 2014, 3, 82–92. [Google Scholar] [CrossRef]
  44. Bustos, M.C.; Pérez, G.; León, A.E. Structure and Quality of Pasta Enriched with Functional Ingredients. RSC Adv. 2015, 5, 30780–30792. [Google Scholar] [CrossRef]
  45. Sarıkamış, G.; Yıldırım, A.; Alkan, D. Glucosinolates in Seeds, Sprouts and Seedlings of Cabbage and Black Radish as Sources of Bioactive Compounds. Can. J. Plant Sci. 2015, 95, 681–687. [Google Scholar] [CrossRef]
  46. Kołodziejski, D.; Piekarska, A.; Hanschen, F.S.; Pilipczuk, T.; Tietz, F.; Kusznierewicz, B.; Bartoszek, A. Relationship between Conversion Rate of Glucosinolates to Isothiocyanates/Indoles and Genotoxicity of Individual Parts of Brassica Vegetables. Eur. Food Res. Technol. 2018, 245, 383–400. [Google Scholar] [CrossRef]
  47. Fan, X. Chemical Inhibition of Polyphenol Oxidase and Cut Surface Browning of Fresh-Cut Apples. Crit. Rev. Food Sci. Nutr. 2022, 63, 8737–8751. [Google Scholar] [CrossRef]
  48. Tappi, S.; Ragni, L.; Tylewicz, U.; Romani, S.; Ramazzina, I.; Rocculi, P. Browning Response of Fresh-Cut Apples of Different Cultivars to Cold Gas Plasma Treatment. Innov. Food Sci. Emerg. Technol. 2017, 53, 56–62. [Google Scholar] [CrossRef]
  49. Eissa, H.A.; Saad, S.M.; El-Aleem, I.M.A.; Ibrahim, W.A.M.; Elmoniem, G.M.A.; Helmy, A.M. Effect of Natural Cabbage and Taro Extracts on Oxidative Enzymes Activity of Frozen and Dried Apple Products. J. Am. Sci. 2010, 6, 454–464. [Google Scholar] [CrossRef]
  50. Incardona, A.; Amodio, M.A.; Derossi, A.; Colelli, G. Investigating the Impact of the Degree of Sharpness on the Microstructure of Fresh-Cut Apples. Foods 2025, 14, 636. [Google Scholar] [CrossRef]
  51. Luo, Z.; Li, G.; Du, Y.; Yi, J.; Hu, X.; Jiang, Y. Enhancing Fresh-Cut Apple Preservation: Impact of Slightly Acidic Electrolyzed Water and Chitosan–Apple Essence Microencapsulation Coating on Browning and Flavor. Foods 2024, 13, 1585. [Google Scholar] [CrossRef]
  52. Moreira, M.R.; Tomadoni, B.; Martín-Belloso, O.; Soliva-Fortuny, R. Preservation of Fresh-Cut Apple Quality Attributes by Pulsed Light in Combination with Gellan Gum-Based Prebiotic Edible Coatings. LWT-Food Sci. Technol. 2015, 64, 1130–1137. [Google Scholar] [CrossRef]
  53. Volden, J.; Borge, G.I.A.; Bengtsson, G.B.; Hansen, M.; Thygesen, I.E.; Wicklund, T. Effect of Thermal Treatment on Glucosinolates and Antioxidant-Related Parameters in Red Cabbage (Brassica oleracea L. ssp. capitata f. rubra). Food Chem. 2008, 109, 595–605. [Google Scholar] [CrossRef]
  54. Volden, J.; Borge, G.I.A.; Hansen, M.; Wicklund, T.; Bengtsson, G.B. Processing (Blanching, Boiling, Steaming) Effects on the Content of Glucosinolates and Antioxidant-Related Parameters in Cauliflower (Brassica oleracea L. ssp. botrytis). LWT-Food Sci. Technol. 2009, 42, 63–73. [Google Scholar] [CrossRef]
  55. Zou, H.; Xiao, G.; Li, G.; Wei, X.; Tian, X.; Zhu, L.; Ma, F.; Li, M. Revisiting the Advancements in Plant Polyphenol Oxidases Research. Sci. Hortic. 2025, 341, 113960. [Google Scholar] [CrossRef]
  56. Karaibrahimoglu, Y.; Fan, Χ.; Sapers, G.M.; Sokorai, K. Effect of pH on the Survival of Listeria innocua in Calcium Ascorbate Solutions and on Quality of Fresh-Cut Apples. J. Food Prot. 2004, 67, 751–757. [Google Scholar] [CrossRef] [PubMed]
  57. Qi, H.; Hu, W.; Jiang, A.; Tian, M.; Li, Y. Extending Shelf-Life of Fresh-Cut ‘Fuji’ Apples with Chitosan-Coatings. Innov. Food Sci. Emerg. Technol. 2011, 12, 62–66. [Google Scholar] [CrossRef]
  58. Shyu, Y.S.; Chen, G.W.; Chiang, S.C.; Sung, W.C. Effect of Chitosan and Fish Gelatin Coatings on Preventing the Deterioration and Preserving the Quality of Fresh-Cut Apples. Molecules 2019, 24, 2008. [Google Scholar] [CrossRef]
  59. Karagöz, Ş.; Demirdöven, A. Effect of Chitosan Coatings with and without Stevia rebaudiana and Modified Atmosphere Packaging on Quality of Cold Stored Fresh-Cut Apples. LWT-Food Sci. Technol. 2019, 108, 332–337. [Google Scholar] [CrossRef]
  60. Eissa, H.A.A. Effect of chitosan coating on shelf life and quality of fresh-cut mushroom. J. Food Qual. 2007, 30, 623–645. [Google Scholar] [CrossRef]
  61. Batkan, A.; Kundakçi, A.; Ergönül, B. Effect of Holding Period prior to Storage on the Chemical Attributes of Starking Delicious Apples during Refrigerated Storage. Food Sci. Technol. 2012, 32, 223–227. [Google Scholar] [CrossRef]
  62. Ackah, S.; Xue, S.; Osei, R.; Kweku-Amagloh, F.; Zong, Y.; Prusky, D.; Bi, Y. Chitosan Treatment Promotes Wound Healing of Apple by Eliciting Phenylpropanoid Pathway and Enzymatic Browning of Wounds. Front. Microbiol. 2022, 13, 828914. [Google Scholar] [CrossRef] [PubMed]
  63. Xiao, Z.; Luo, Y.; Luo, Y.; Wang, Q. Combined Effects of Sodium Chlorite Dip Treatment and Chitosan Coatings on the Quality of Fresh-Cut d’Anjou Pears. Postharvest Biol. Technol. 2011, 62, 319–326. [Google Scholar] [CrossRef]
  64. Zeb, S.; Sajid, M.; Shah, S.T.; Ali, M.; Ali, S.; Nawaz, Z.; Rauf, K.; Khan, A.; Shah, H.; Shah, S.A.A.; et al. Influence of Post-Harvest Application of Chitosan on Physico-Chemical Changes of Apple Fruit during Storage. Pure Appl. Biol. 2020, 9, 2554–2562. [Google Scholar] [CrossRef]
  65. Jiang, Y.; Yin, H.; Wang, D.; Zhong, Y.; Deng, Y. Combination of Chitosan Coating and Heat Shock Treatments to Maintain Postharvest Quality and Alleviate Cracking of Akebia trifoliate Fruit during Cold Storage. Food Chem. 2022, 394, 133330. [Google Scholar] [CrossRef]
  66. Zhu, X.; Wang, Q.; Cao, J.; Jiang, W. Effects of Chitosan Coating on Postharvest Quality of Mango (Mangifera indica L. cv. Tainong) Fruits. J. Food Process. Preserv. 2008, 32, 770–784. [Google Scholar] [CrossRef]
  67. Fernades, S.D.S.; Ribeiro, C.A.d.S.; Raposo, M.F.d.J.; de Morais, R.M.S.; de Morais, A.M.M.B. Polyphenol Oxidase Activity and Colour Changes of ‘Starking’ Apple Cubes Coated with Alginate and Dehydrated with Air. Food Nutr. Sci. 2011, 2, 451–457. [Google Scholar] [CrossRef]
  68. Mishra, B.B.; Gautam, S.; Sharma, A. Free Phenolics and Polyphenol Oxidase (PPO): The Factors Affecting Post-Cut Browning in Eggplant (Solanum melongena). Food Chem. 2013, 139, 105–114. [Google Scholar] [CrossRef]
  69. Piagentini, A.M.; Pirovani, M.E. Total phenolics content, antioxidant capacity, physicochemical attributes, and browning susceptibility of different apple cultivars for minimal processing. Int. J. Fruit Sci. 2017, 17, 102–116. [Google Scholar] [CrossRef]
  70. Cvetković, B.; Bajić, A.; Belović, M.; Pezo, L.; Dragojlović, D.; Šimurina, O.; Djordjević, M.; Korntheuer, K.; Philipp, C.; Eder, R. Assessing Antioxidant Properties, Phenolic Compound Profiles, Organic Acids, and Sugars in Conventional Apple Cultivars (Malus domestica): A Chemometric Approach. Foods 2024, 13, 2291. [Google Scholar] [CrossRef]
  71. Zhang, X.; Meng, W.; Chen, Y.; Peng, Y. Browning Inhibition of Plant Extracts on Fresh-Cut Fruits and Vegetables—A Review. J. Food Process. Preserv. 2022, 46. [Google Scholar] [CrossRef]
  72. Li, Z.; Zhang, W.; Li, X.; Liu, H.; Li, F.; Zhang, X. Combined Effects of 1-methylcyclopropene and Tea Polyphenols Coating Treatment on the Postharvest Senescence and Reactive Oxygen Species Metabolism of Bracken (Pteridium aquilinum var. latiusculum). Postharvest Biol. Technol. 2022, 185, 111813. [Google Scholar] [CrossRef]
  73. Nia, A.E.; Taghipour, S.; Siahmansour, S. Pre-harvest Application of Chitosan and Postharvest Aloe vera Gel Coating Enhances Quality of Table Grape (Vitis vinifera L. cv.‘Yaghouti’) during Postharvest Period. Food Chem. 2021, 347, 129012. [Google Scholar] [CrossRef]
  74. Sabir, F.K.; Unal, S.; Aydın, S.; Sabir, A. Pre- and Postharvest Chitosan Coatings Extend the physicochemical and Bioactive Qualities of Minimally Processed ‘Crimson Seedless’ grapes during Cold Storage. J. Sci. Food Agric. 2024, 104, 7834–7842. [Google Scholar] [CrossRef] [PubMed]
  75. Qiao, J.; Li, D.; Guo, L.; Hong, X.; He, S.; Huo, J.; Sui, X.; Zhang, Y. Enhancing Postharvest Quality and Antioxidant Capacity of Blue Honeysuckle cv. ‘Lanjingling’ with Chitosan and Aloe vera Gel Edible Coatings during Storage. Foods 2024, 13, 630. [Google Scholar] [CrossRef] [PubMed]
  76. Patras, A.; Brunton, N.P.; Downey, G.; Rawson, A.; Warriner, K.; Gernigon, G. Application of Principal Component and Hierarchical Cluster Analysis to Classify Fruits and Vegetables Commonly Consumed in Ireland Based on in vitro Antioxidant Activity. J. Food Compos. Anal. 2010, 24, 250–256. [Google Scholar] [CrossRef]
  77. Minh, T.N.; Van Thinh, P.; Anh, H.L.T.; Anh, L.V.; Khanh, N.H.; Van Nhan, L.; Trung, N.Q.; Dat, N.T. Chemometric Classification of Vietnamese Green Tea (Camellia sinensis) Varieties and Origins Using Elemental Profiling and FTIR Spectroscopy. Int. J. Food Sci. Technol. 2024, 59, 9234–9244. [Google Scholar] [CrossRef]
  78. Hamzah, H.T.; Sridevi, V.; Surya, D.V.; Palla, S.; Yadav, A.; Rao, P.V. Conventional and Microwave-Assisted Acid Pretreatment of Tea Waste Powder: Analysis of Functional Groups Using FTIR. Environ. Sci. Pollut. Res. 2023, 31, 57523–57532. [Google Scholar] [CrossRef]
  79. Rajhard, S.; Hladnik, L.; Vicente, F.A.; Srčič, S.; Grilc, M.; Likozar, B. Solubility of Luteolin and Other Polyphenolic Compounds in Water, Nonpolar, Polar Aprotic and Protic Solvents by Applying FTIR/HPLC. Processes 2021, 9, 1952. [Google Scholar] [CrossRef]
  80. Irchad, A.; Hssaini, L.; Razouk, R.; Chabbi, M.; Charafi, J.; Bouassab, A. Exogenous Salicylic and ascorbic Acids Delay Peel Enzymatic Browning and Improve Quality of Dried Figs under Low-Temperature Storage. Biointerface Res. Appl. Chem. 2021, 12, 8367–8384. [Google Scholar] [CrossRef]
  81. Hssaini, L.; Ouaabou, R.; Charafi, J.; Razouk, R.; Houmanat, K.; Irchad, A. Effects of Pre-Storage Ascorbic and Salicylic Acids Treatments on the Enzymatic Browning and Nutritional Quality of Dried Fig: Combined Use of Biochemical and ATR-FTIR Analyses. Vib. Spectrosc. 2021, 115, 103269. [Google Scholar] [CrossRef]
  82. Ma, S.; Ma, J.; Wang, Q.; Wang, C.; Shi, H.; Shi, J. NaCl Treatment with Low Density Polyethylene Packaging Bags Can Enhance the Aroma of Fresh-Cut Apple, not only Inhibit its Browning. Food Packag. Shelf Life 2023, 39, 101148. [Google Scholar] [CrossRef]
  83. Karseno, N.; Erminawati, N.; Yanto, N.T.; Setyawati, R.; Haryanti, P. Effect of pH and Temperature on Browning Intensity of Coconut Sugar and its Antioxidant Activity. Food Res. 2017, 2, 32–38. [Google Scholar] [CrossRef]
  84. Rojas-Graü, M.A.; Soliva-Fortuny, R.; Martin-Belloso, O. Effect of Natural Antibrowning Agents on Color and Related Enzymes in Fresh-Cut Fuji Apples as an Alternative to the Use of Ascorbic Acid. J. Food Sci. 2008, 73, S267–S272. [Google Scholar] [CrossRef]
Figure 1. Principal component analysis (PCA): biplot of the factor loading (A) and score (B) of PC1 and PC2 after analysis of the effects of pH-adjusted aqueous extracts of cabbage seeds (ACEs) before the coating of the cut apple cubes, followed by preservation for 1 and 6 days at 7 °C. Key of abbreviations (attributes): L* (CIE L* lightness–darkness), a* (CIE a* green–red) and b*(CIE b* yellow), h° (hue angle, C (saturation), BI (browning index), VCS (visual color score), HNS (hardness), WL (weight loss, TPC (phenolic compounds), and DPPH (antioxidant capacity). Key of symbols (samples): ellipses indicate preservation days (1 and 6), dotted lines uncoated treatments (UC), and dashed lines indicate chitosan coating (CH).
Horticulturae 11 00953 g001
Figure 2. FT-IR spectra of uncoated (A) and coated (B) cut apple cubes at 0 and 10 days of preservation at 7 °C. The cubes were previously exposed to aqueous cabbage seed extracts (ACEs) of 0, 5 and 10% (w:v, seed:water) and adjusted to 4.0. The extract was used directly (uncoated) (A) or after the incorporation of 1% chitosan (coating) (B).
Horticulturae 11 00953 g002
Figure 3. Development of enzymatic browning based on the visual color score (VCS) of cut apple cubes during preservation for 14 days at 7 °C, having previously been exposed to pH-adjusted aqueous extracts of cabbage seeds (ACEs). The extract was used directly (uncoated) (A) or after the incorporation of 1% chitosan (coating) (B). Vertical bars in each figure represent the least significant difference method (LSD) at each sampling date and a confidence level of 0.05. Arrows indicate the borderline acceptable/unacceptable color.
Horticulturae 11 00953 g003
Figure 4. Development of enzymatic browning based on the browning index (BI) of cut apple cubes during preservation for 10 days at 7 °C, previously exposed to pH-adjusted aqueous extracts of cabbage seeds (ACE). The extract was used directly (uncoated) (A) or after incorporation of 1% chitosan (coating) (B). Vertical bars in each figure represent the least significant difference method (LSD) at each sampling date and with a confidence level of 0.05. Arrows indicate borderline of acceptable/unacceptable BI level.
Horticulturae 11 00953 g004
Figure 5. Shelf life (average of 3 replications + S.D.) of cut apple cubes based on (A) visual color score (VCS) and (B) browning index (BI). The cubes were previously exposed to pH-adjusted aqueous extracts of cabbage seeds (ACEs). The extract was used directly (uncoated) or after the incorporation of 1% chitosan (coating); all samples were subjected to preservation for 10 day at 7 °C. Different letters on VCS or BI bars represent a statistically significant difference according to the least significant difference method at a confidence level of 0.05 (LSD0.05 = 1.11).
Horticulturae 11 00953 g005
Table 1. Visual color evaluation scores of browning and acceptability of cut apple cubes.
Degree of Browning ScoreAcceptability/Browning DegreeColor Range
1Absolutely acceptable
No sign of browning
Horticulturae 11 00953 i001
2Accepted
Evidence of browning beyond doubt
Horticulturae 11 00953 i002
3Borderline acceptable/unacceptable
Noticeable browning
Horticulturae 11 00953 i003
4Unacceptable
Obvious time wear—inappropriate
Horticulturae 11 00953 i004
5Unacceptable
Decomposition image
Horticulturae 11 00953 i005
Table 2. Means ± standard deviation (n = 3) of total phenolics (TPCs), antioxidant capacity (DPPH), and total glucosinolates (GSLs) of aqueous extracts of cabbage seeds (ACEs) as well as of coating solutions using ACE and chitosan.
ACE %
Coating
TPCDPPHGSL
(mg GA/L)(%Inh)(mg Sin/g Seed FW *)
ACE 5%799.8±15.6C **51.55±1.38C5.41±0.27
ACE 10%1497.0±9.6A78.43±2.03B7.24±0.84
Chitosann.d. *** n.d.11.35±1.97Dn.d. n.d.
Chitosan/ACE 5%792.6±3.6C54.75±1.68Cn.d. n.d.
Chitosan/ACE 10%1443.0±13.2B82.97±2.36An.d. n.d.
* FW: fresh weight basis, ** Different letters within each factor represent statistically significant difference according to Duncan’s multiple range test, *** n.d.: not determined.
Table 3. Main effects and means for the variables L*, a*, b*, hue angle (h°), saturation (C), as well as indices for browning (BI), visual color score (VCS), hardness (HNS), weight loss (WL), phenolic compounds (TPCs, mg GAE/kg FW), and antioxidant capacity (DPPH) obtained during the 10 day/7 °C preservation of cut apple cubes; the cubes were previously exposed to pH-adjusted aqueous extracts of cabbage seeds (ACEs) before coating.
MAIN EFFECTSDFL*a*b*CBIVCSHNSWLTPCDPPH
ACEWater/control68.70B2.06A31.40A90.70A31.71A63.75A3.77A681.5A4.47A344.5B33.85A
5%72.11A0.35B28.27B90.72A28.56B49.96B3.20B703.8A4.08A521.6A46.46B
10%72.02A0.22B27.80B90.35A28.10B50.91B3.18B709.5A4.53A445.1A36.56B
pHpH 4.069.63Β2.57A30.70A86.94B31.13A63.21A3.60A697.8A4.18A434.3A35.33A
pH 6.072.25A−0.81B27.61B94.29A27.78B46.53B3.16B698.7A4.54A439.8A42.58B
CoatingNon-coated/control73.67A−1.10B27.35B93.09A27.44B44.41B2.99B639.9B4.41A500.4A42.47A
Coated, 1% chitosan68.22B2.86A30.97A88.09B31.47A65.33A3.78A756.6A4.31A373.7B35.44B
Preservation (days)074.56A−1.90E25.52D94.78A25.65E38.76E1.75E788.6A0.00C--
174.09A−0.89D27.82C92.81A27.93D45.27D3.01D735.9A2.36B459.7A40.98A
371.28B0.76C29.77B90.01A29.95C54.77C3.70C661.7B5.84A--
667.95C2.47B31.10A86.67A31.46B64.85B4.10B651.1B6.60A414.3A36.93A
1066.83D3.95A31.59A88.68A32.28A70.71A4.34A653.9B7.01A--
Different letters within each factor represent statistically significant differences according to Duncan’s multiple range test.
Table 4. Pearson linear correlation coefficients of the variables L*, a*, b* hue angle (h°), saturation (C), browning index (BI), visual color score (VCS), hardness (HNS), weight loss (WL), phenolic compounds (TPCs), and antioxidant capacity (DPPH).
L*a*b*hoCBIVCSHNSWLTPCDPPH
L*--
a*−0.939 ***--
b*−0.776 ***0.846 ***--
ho0.712 ***−0.76 ***−0.71 ***--
C−0.823 ***0.888 ***0.996 ***−0.733 ***--
BI−0.953 ***0.977 ***0.902 ***−0.758 ***0.937 ***--
VCS−0.74 ***0.782 ***0.82 ***−0.663 ***0.824 ***0.792 ***--
HNS−0.0380.043−0.008−0.0560.0010.021−0.065--
WL−0.345 ***0.371 ***0.375 ***−0.302 **0.375 ***0.365 ***0.601 ***−0.34--
TPC0.554 ***−0.5 ***−0.505 ***0.319−0.514 ***−0.531 ***−0.495 ***−0.205−0.034--
DPPH0.458 ***−0.469 ***−0.4 ***0.345 **−0.419 ***−0.468 ***−0.401 ***−0.1740.0060.797 ***--
** Correlation is significant at the 0.01 level; *** correlation is significant at the 0.001 level.
Table 5. Appearance changes in control or (1%) chitosan-treated cut apple cubes over 10 min following preservation for 10 days at 7 °C. Both uncoated and coated (chitosan) treatments were prepared by using pH-adjusted aqueous extracts of cabbage seeds (ACEs).
UNCOATED (No Chitosan)COATED (1% Chitosan)
PreservationACE 0%ACE 5%ACE 10%ACE 0%ACE 5%ACE 10%
(days)pH 4.0pH 6.0pH 4.0pH 6.0pH 4.0pH 6.0pH 4.0pH 6.0pH 4.0pH 6.0pH 4.0pH 6.0
0Horticulturae 11 00953 i006Horticulturae 11 00953 i007
3
6
10
Disclaimer/Publisher’s Note: The statements, opinions and data contained in all publications are solely those of the individual author(s) and contributor(s) and not of MDPI and/or the editor(s). MDPI and/or the editor(s) disclaim responsibility for any injury to people or property resulting from any ideas, methods, instructions or products referred to in the content.