Article

Transcriptomic and Proteomic Analyses Provide Insight into Sugar Metabolism-Induced Dormancy Release of Flower Buds of Pyrus pyrifolia ‘Cuiguan’

1
College of Horticulture and Forest, Fujian Vocational College of Agriculture, Fuzhou 350303, China
2
College of Horticulture, Fujian Agriculture and Forest University, Fuzhou 350000, China
*
Author to whom correspondence should be addressed.
Horticulturae 2025, 11(7), 813; https://doi.org/10.3390/horticulturae11070813
Submission received: 9 May 2025 / Revised: 18 June 2025 / Accepted: 5 July 2025 / Published: 9 July 2025
(This article belongs to the Section Genetics, Genomics, Breeding, and Biotechnology (G2B2))

Abstract

Pear buds exhibit inherent dormancy, during which carbohydrates play a pivotal role in dormancy release and germination. In this study, Pyrus pyrifolia ‘Cuiguan’ was employed as the experimental material to investigate the molecular mechanisms underlying flower bud dormancy release. The results revealed that the dynamic balance between starch and soluble sugar is critical for promoting dormancy release and germination in P. pyrifolia ‘Cuiguan’ flower buds. Through transcriptomic and proteomic profiling, a total of 4035 differentially expressed genes (DEGs) and 1596 differentially expressed proteins (DEPs) were identified, which were predominantly associated with carbohydrate metabolism, particularly sugar metabolism pathways. Their changes were coordinately regulated at both transcriptional and translational levels. Key structural genes involved in maltose and sucrose biosynthesis, including BAM (LOC103949270), AAM (LOC125479337, LOC103940334, and LOC103941903), SPS (LOC125475683), and INV (LOC125478747), were significantly upregulated during the germination stage, facilitating flower bud sprouting. Integrated multi-omic analysis demonstrated that starch–sugar interconversion may govern dormancy release and sustained bud growth by modulating sugar metabolism-related genes and proteins. These findings provide novel insights into the molecular mechanisms of carbohydrate biosynthesis and associated protein regulation during dormancy release and development of P. pyrifolia ‘Cuiguan’ under natural conditions.

1. Introduction

Pyrus pyrifolia is one of the most extensively cultivated fruit species, possessing dormancy as an adaptive trait that regulates germination timing to avoid environmental stress. This dormancy primarily occurs in buds, ensuring that vegetative growth initiates only under optimal environmental conditions [1]. However, accelerated climate change and increasingly frequent extreme weather events, particularly late spring frosts following bud break, have caused significant yield reductions and plant mortality. Consequently, understanding the regulatory mechanisms governing dormancy–sprouting transitions has become crucial for pear cultivation [2]. Previous research demonstrates that elevated autumn and winter temperatures can compromise freezing tolerance development, disrupt endodormancy progress, and induce premature flowering in pear trees [3]. These physiological disturbances occur more frequently in high-chill cultivars than in low- or mid-chill cultivars and are more prevalent at lower latitudes [4]. Thus, elucidating the mechanisms of dormancy establishment and release is essential for improving pear cultivation and management practices.
Bud dormancy comprises three distinct phases: (i) para-dormancy, where apical dominance inhibits lateral bud growth; (ii) endo-dormancy, requiring chilling accumulation and influenced by internal physiological factors; and (iii) eco-dormancy, where growth begins to resume but with environmental constraint [5,6,7]. Similar to lily bulbs, which undergo cold-induced sweetening during dormancy release [8,9], pear buds experience metabolic shifts where starch reserves decline while soluble sugars (such as sucrose, fructose, maltose, and trehalose) accumulate. The sugar composition serves not only as an energy source but also as a regulator of bud development [10]. For instance, sucrose enhances cytokinin levels and vacuolar invertase activity [11], while also providing carbon for cell wall biosynthesis [12]. In addition, sorbitol is a translocated carbohydrate in pear, which is dominant in the young fruit of most pear varieties [13]. Previous studies reported the possible inhibitory effect of sorbitol on flower bud growth during the dormancy process in Japanese pear (P. pyrifolia ‘Kosui’). So, the role of sorbitol in the bud dormancy process in pear trees may be minor compared to that of other soluble sugars (e.g., fructose, maltose, and sucrose). This suggests that dormancy release induced by sugar metabolism is of great biological importance for survival and reproduction, especially differential contributions of sugar compositions during the dormancy process of pear trees.
Transcriptomics and quantitative proteomics enable accurate identification and quantitation of genes or proteins that are expressed within genomes [14]. Single-layer omics often cannot fully disentangle complex physiological mechanisms, while integrated multi-omic approaches provide comprehensive insights into complex biological systems. These methodologies have significantly advanced our understanding of dormancy regulation in various species, such as Paeonia suffruticosa Andr. [15], Solanum tuberosum L. [16], and Malus domestica [17]. Even so, little is known about the mechanisms governing dormancy and release of dormancy in pear species. While some progress has been made in understanding P. pyrifolia bud dormancy through studies on transcription factors, phytohormones, and chilling requirements [18,19,20,21,22], the precise molecular mechanisms controlling dormancy induction and release in pear species remain largely unclear. Further research is needed to elucidate the regulatory networks and interactions governing these processes. Therefore, the enzyme activities and sugar and starch contents in P. pyrifolia ‘Cuiguan’ flower buds during the dormancy process were measured to investigate the physiological response. And transcriptome and proteome sequencing were performed to further reveal the molecular mechanism underlying bud dormancy release. These findings intend to complement and improve the theory of the molecular mechanism of P. pyrifolia ‘Cuiguan’ flower formation and provide a theoretical basis for breeders to improve pear varieties by molecular methods.

2. Materials and Methods

2.1. Sample Collection

Flower buds of P. pyrifolia ‘Cuiguan’ were collected from Jian Ning County, Fujian Province, China. Dormant bud samples were collected from 12 December 2022 to 3 February 2023. According to previous definitions and assessments of bud dormancy, dormant buds were collected at five different dormancy stages: DS1: 12 October 2022 (endo-dormancy early stage); DS2: 27 December 2022 (endo-dormancy stage); DS3: 3 January 2023 (endo-dormancy release stage); DS4: 9 January 2023 (eco-dormancy stage); DS5: 3 February 2023 (germination stage). The buds of 10-year-old adult trees were sampled, each tree was designed as one replicate, and three biological replicates were set up for each stage. When sampling, full-size flower buds were chosen, and scales and fluffs were removed. Then, these samples were immediately frozen in liquid nitrogen and stored in a refrigerator at −80 °C.

2.2. Determination of Enzyme Activities and Sugar and Starch Contents

Glucose-6-phosphate isomerase (GPI), malic dehydrogenase (MDH), glucose 6 phosphate dehydrogenase (G6PDH), and isocitrate lyase (ICL) activities were determined using a spectrophotometric method in accordance with the methods of Patel et al. [23], Xue [24], Meillon et al. [25], and Bogatek et al. [26]. Detection of total soluble sugar (TSS) content was carried out using the anthrone colorimetric method [27]. Fresh sample (0.2 g) was cut into pieces and boiled in 5 mL of distilled water. After 30 min, the extract was collected and this process was repeated once again. The collected extract was adjusted to 25 mL and mixed well. Then, 0.125 mL extraction solution was suspended with 1.87 mL distilled water, 0.5 mL anthrone ethyl acetate reagent, and 5 mL concentrated sulfuric acid. The mixture was kept in boiling water for 1 min and then cooled to room temperature. The soluble sugar content was detected using a TU-1900 spectrophotometer at 630 nm. The total starch (TS) content was determined by enzymatic hydrolysis [28]. Firstly, low-concentration perchloric acid was used to separate starch from the plant leaves at low temperature. Then, the starch was hydrolyzed into glucose through enzymatic hydrolysis reactions. Finally, the glucose content was detected using a glucose detection kit to calculate the starch content in pear tree leaves. The starch content detection kit was purchased from Nanjing Jiancheng Institute of Bioengineering (Nanjing, China).

2.3. RNA-Sequencing and Analysis

Total RNA was extracted using an RNA isolation kit (Tiangen Biotech, Beijing, China) according to the manufacturer’s protocol. RNA quality assessment and integrity checks were performed using the combination of an Agilent Technologies RNA Nano 6000 Assay Kit (Agilent Technologies, Santa Clara, CA, USA) with the Bioanalyzer 2100 system (Agilent Technologies, Santa Clara, CA, USA). Genomic DNA was removed from total RNA by DNase (Tiangen Biotech, Beijing, China). The first-stand cDNA was synthesized using the PrimerScript™ RT reagent Kit (TaKaRa, Dalian, China) with oligo (dT) and random hexamer primers. Sequencing libraries were prepared, and paired-end reads were generated on the Illumina platform. After quality control and alignment to the reference genome, gene expression was quantified and normalized using the FPKM method. Differential expression analysis of genes was performed by applying thresholds of |log2 fold change| ≥ 1 and FDR < 0.05. The KEGG pathway enrichment and Gene Ontology (GO) classification tools delivered functional information about genes showing differential expression patterns.

2.4. Ultra-Deep Quantitative Proteomics Analysis

Proteins were extracted using acetone precipitation. Samples were homogenized in L3 buffer (1% SDS, 100 mM Tris-HCl, 7 M urea, 2 M thiourea, 1 mM PMSF, and 2 mM EDTA) with liquid nitrogen, sonicated on ice, and centrifuged. Supernatants were mixed with pre-cooled acetone (4:1 v/v), stored at −20 °C overnight, and pellets were washed with cold acetone before solubilization in 8 M urea. Protein concentration was determined via BCA assay. For digestion, samples were reduced with 10 mM DTT (37 °C, 45 min), alkylated with 50 mM iodoacetamide (dark, 15 min), and digested overnight with trypsin at 37 °C. Peptides were desalted using C18 cartridges and vacuum-dried. Samples were analyzed on an Orbitrap Astral mass spectrometer coupled to a Vanquish Neo UHPLC system (Thermo Fisher Scientific, Bremen, Germany). Peptides were trapped on a PepMap Neo cartridge (300 µm × 5 mm) and separated on an EASY-Spray Neo column (150 µm × 15 cm) with a 22 min gradient. DIA was performed at a resolution of 240,000 (380–980 m/z, 500% AGC), with fragment scans at a resolution of 80,000 (3 ms injection time, 25% NCE). Raw data were analyzed using DIA-NN 1.8.1 (library-free mode) with a spectral library generated from the MWXS-24-328-a-pep database. MBR was enabled, and identifications were filtered at 1% FDR (protein/precursor level).

2.5. Integrated Transcriptomic and Proteomic Analysis

To further investigate the key metabolic pathways influencing the dormancy release of flower buds of P. pyrifolia ‘Cuiguan’, we selected pathways with significant enrichment (p < 0.05) in the comparisons of DS2 vs. DS1, DS3 vs. DS2, DS4 vs. DS3, and DS5 vs. DS4 for intersection analysis between transcriptomic and proteomic data. The key KEGG pathways related to bud dormancy and release of P. pyrifolia ‘Cuiguan’ that were significantly enriched across these comparisons were extracted by integrating differentially expressed genes (DEGs) and differentially expressed proteins (DEPs). Finally, the key pathways were visualized.

2.6. Weighted Gene Co-Expression Correlation Network Analysis (WGCNA)

WGCNA (Weighted Gene Co-expression Network Analysis) was carried out using the WGCNA package in R-Studio 3.6.0 Software. The non-expressed or low-expression genes were removed to build a co-expression network. The relative net had a soft threshold strength of 17, a smallest block size of 50, and a maximum combination of a module of 0.25. Lastly, the relationships were evaluated between the sugar-metabolizing enzyme activities, carbohydrate content, and all genes in flower buds of P. pyrifolia ‘Cuiguan’ at five different dormancy stages.

2.7. qRT–PCR Validation

The expression levels of genes were determined using quantitative reverse transcription-PCR (qRT-PCR) with the Applied Biosystems 7500 Real-Time PCR system (Applied Biosystems, USA). The qPCR reaction was performed in a total volume of 20 μL, containing 2 μL of diluted cDNA, 0.4 μL of reverse and forward primers (10 μmol·L−1), 7.2 μL of ddH2O, and 10 μL of 2 × PerfectStart® Green qPCR SuperMix (TransGen Biotech, Beijing, China). The amplification program was performed as follows: 30 s at 94 °C, followed by 40 cycles of 5 s at 94 °C for and 30 s at 60 °C. The cycle threshold (Ct) values were calculated. The relative expression levels of each selected gene in the samples were calculated using the 2−ΔΔCt method [29]. All of the primers of validated genes were designed using Primer 5.0 software. The detailed information on the reference gene and candidate genes is provided in Table S1. All samples were analyzed with three biological replicates.

2.8. Data Analysis

The analysis of variance (ANOVA) was calculated and averages were grouped using Tukey’s test (p < 0.05) using SPSS Statistics 22.0 (SPSS Inc., Chicago, IL, USA). The data are presented as the mean ± standard error (SE) with each SE calculated from three biological repeats. The histograms were constructed using Origin 2022. Bioinformatic analyses and visualization were executed using Metware Cloud Tools (https://cloud.metware.cn, accessed on 18 February 2025) and Adobe Illustrator CC 2019.

3. Results

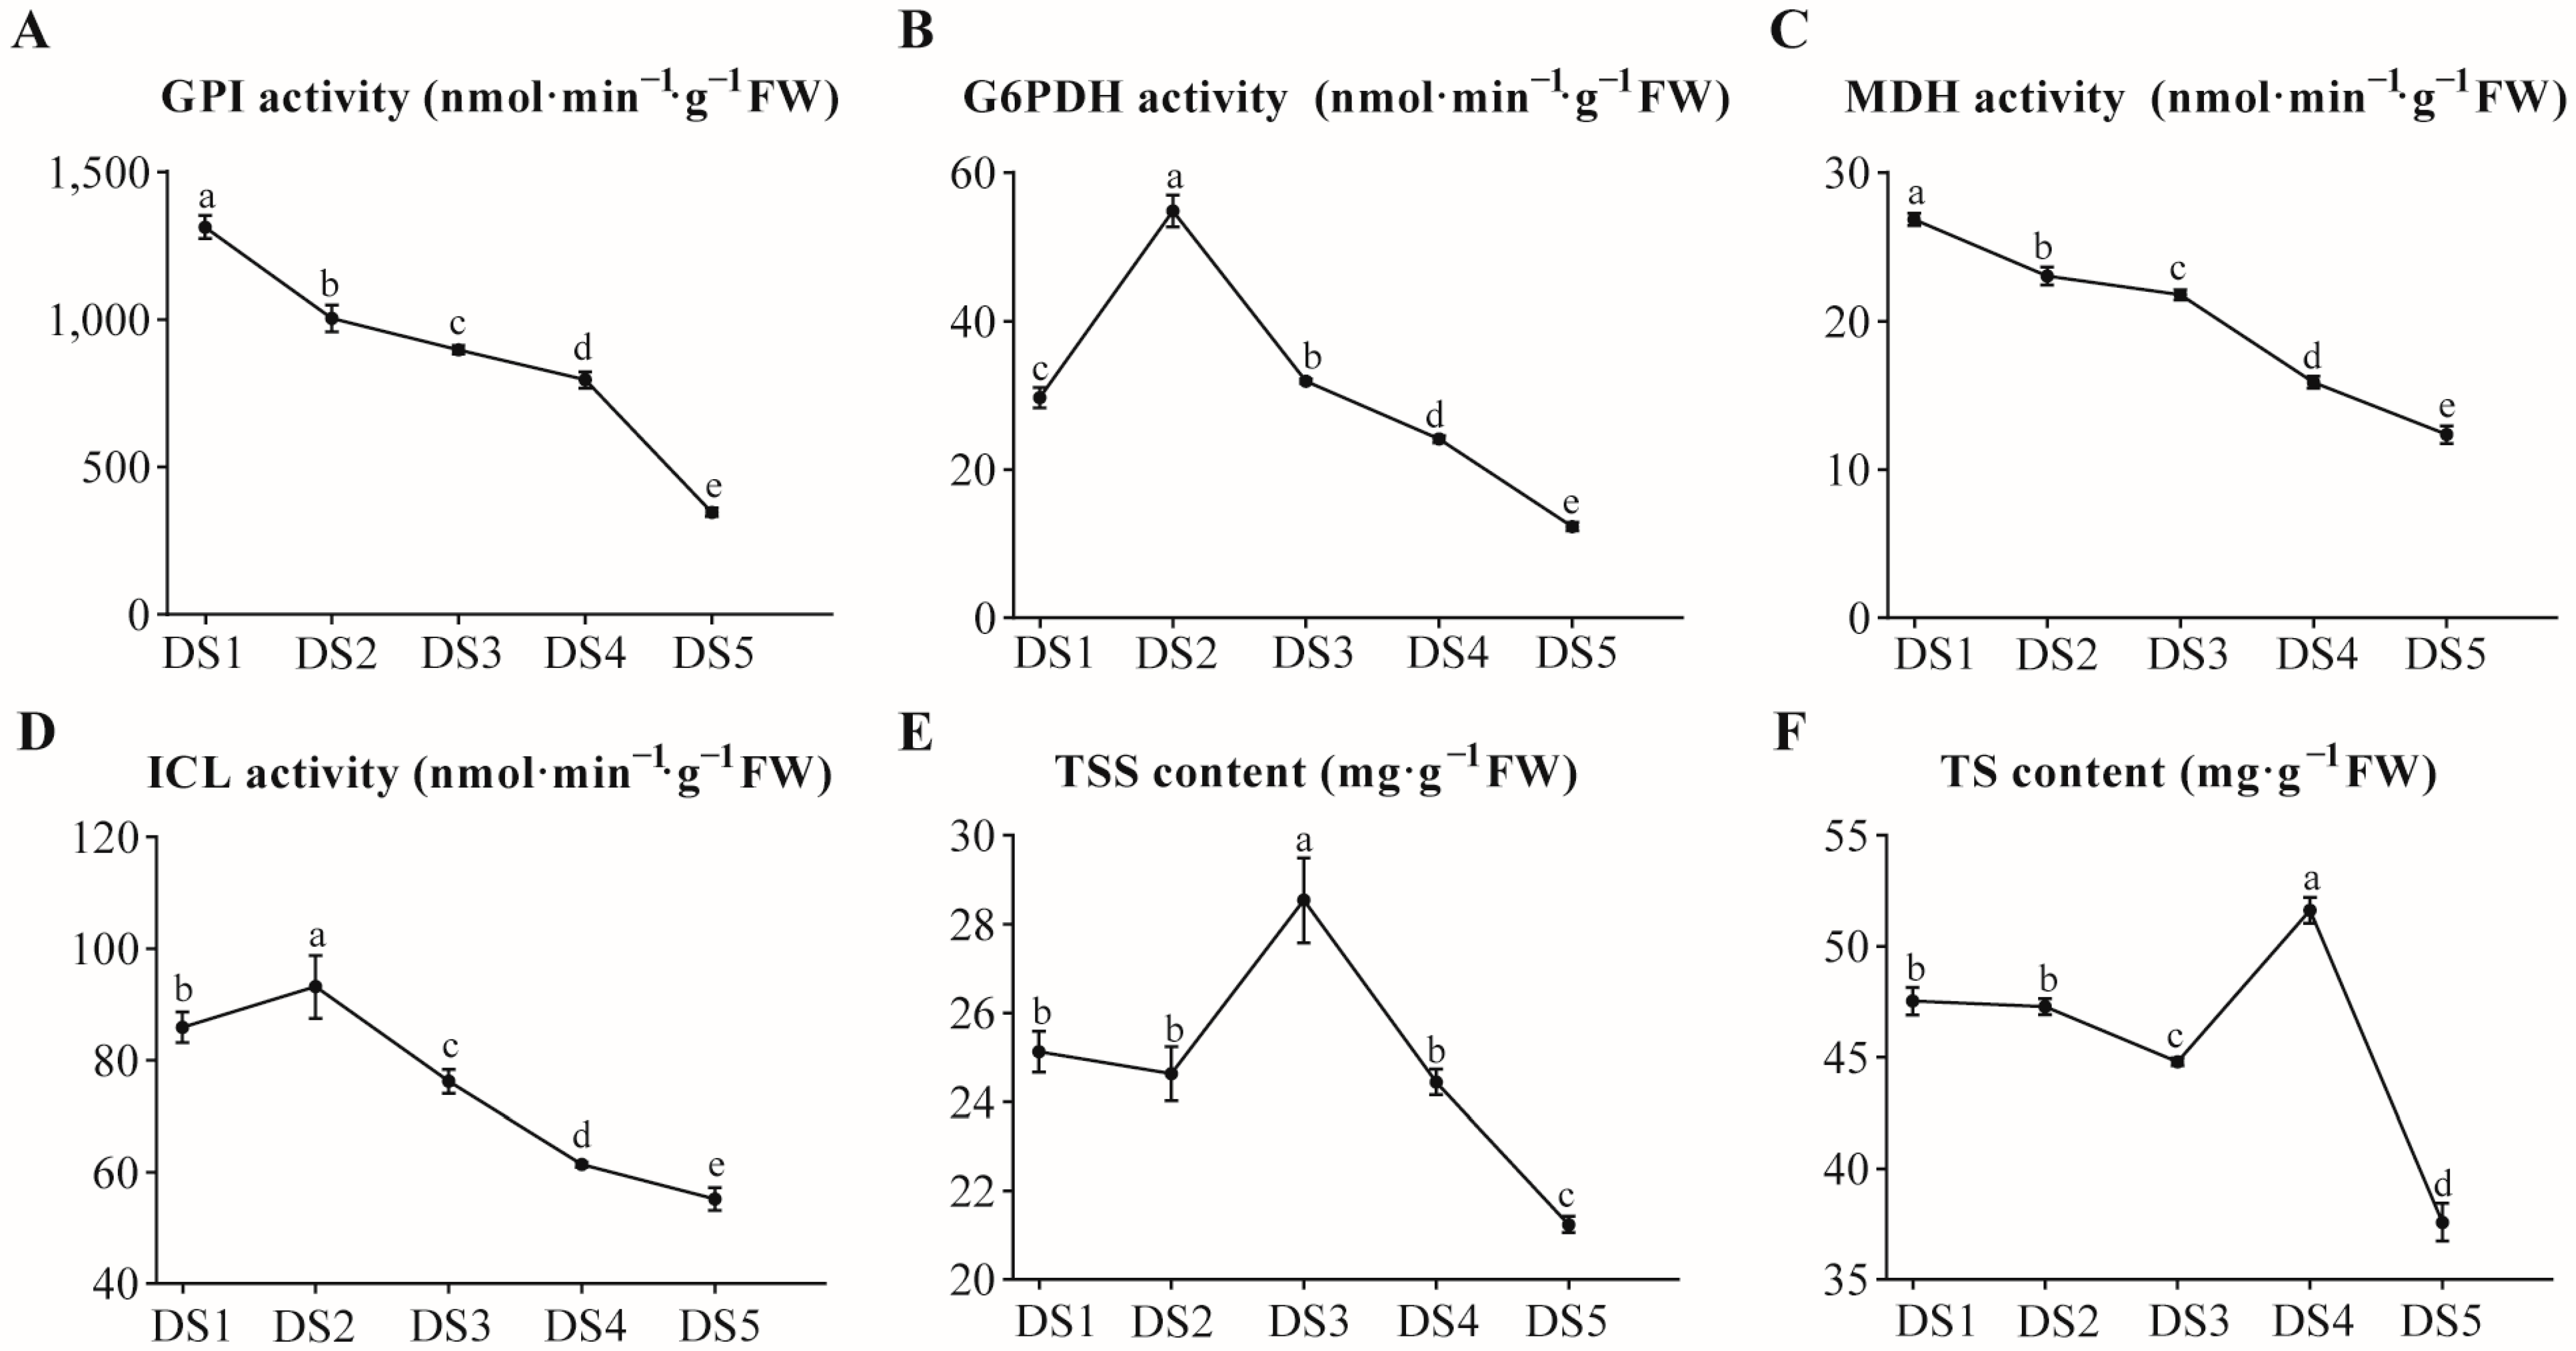
3.1. Physiological Characteristics During Dormancy Process in Flower Buds

To explore the physiological characteristics during the dormancy process in flower buds of P. pyrifolia ‘Cuiguan’, key sugar-metabolizing enzyme activities and carbohydrate contents at five different dormancy stages were measured. During the dormancy progress, both GPI and MDH activities kept decreasing, while both G6PDH and ICL activities showed a trend of first rising and then decreasing, reaching the maximum value in DS2 (endo-dormancy) and then gradually decreasing with the progression of dormancy (Figure 1A–D). These results suggested that GPI, MDH, G6PDH and ICL may play key roles in glucose metabolism during the dormancy process of P. pyrifolia ‘Cuiguan’ flower buds and may play key roles in relieving dormancy and storing energy and substances for growth. G6PDH and ICL had the highest activities at DS2 (endo-dormancy), which indicated that the metabolic activity of the pentose phosphate pathway in flower buds may be more critical at DS2 (endo-dormancy). NADPH and other substances produced by this pathway are of great significance for anti-oxidation defense, nucleic acid synthesis, and other biosynthesis processes in flower bud cells and for coping with environmental stress that may be faced in the late dormancy period. Interestingly, the activities of these four enzymes decreased significantly to the lowest level at DS5 (germination stage), indicating that plants may be in a special physiological regulation state during the germination stage.
Meanwhile, the content of TSS in P. pyrifolia ‘Cuiguan’ flower buds showed a trend of gradually increasing and then decreasing, reaching the maximum value at DS3 and gradually decreasing (Figure 1E). The content of TS showed an irregular trend of change, with the lowest value at DS3, then a sharp rise, reaching the highest level at DS4, and then a sharp drop at DS5 (Figure 1F). This suggested that P. pyrifolia ‘Cuiguan’ flower buds may mainly accumulate sugar before DS4 (eco-dormancy), which then decreases due to various metabolic consumption. The TS content decreased significantly to the lowest level in DS3, possibly because a large amount of starch was decomposed into small molecules such as soluble sugars during DS3 (before eco-dormancy) to provide for the subsequent metabolic activities of flower buds. Subsequently, the level at DS4 (eco-dormancy) rose sharply and then decreased at DS5 (germination stage), reflecting the complex regulatory mechanisms of flower buds in different dormancy stages for energy and material reserves to adapt to the needs of various metabolic activities and environmental changes during the dormancy process.

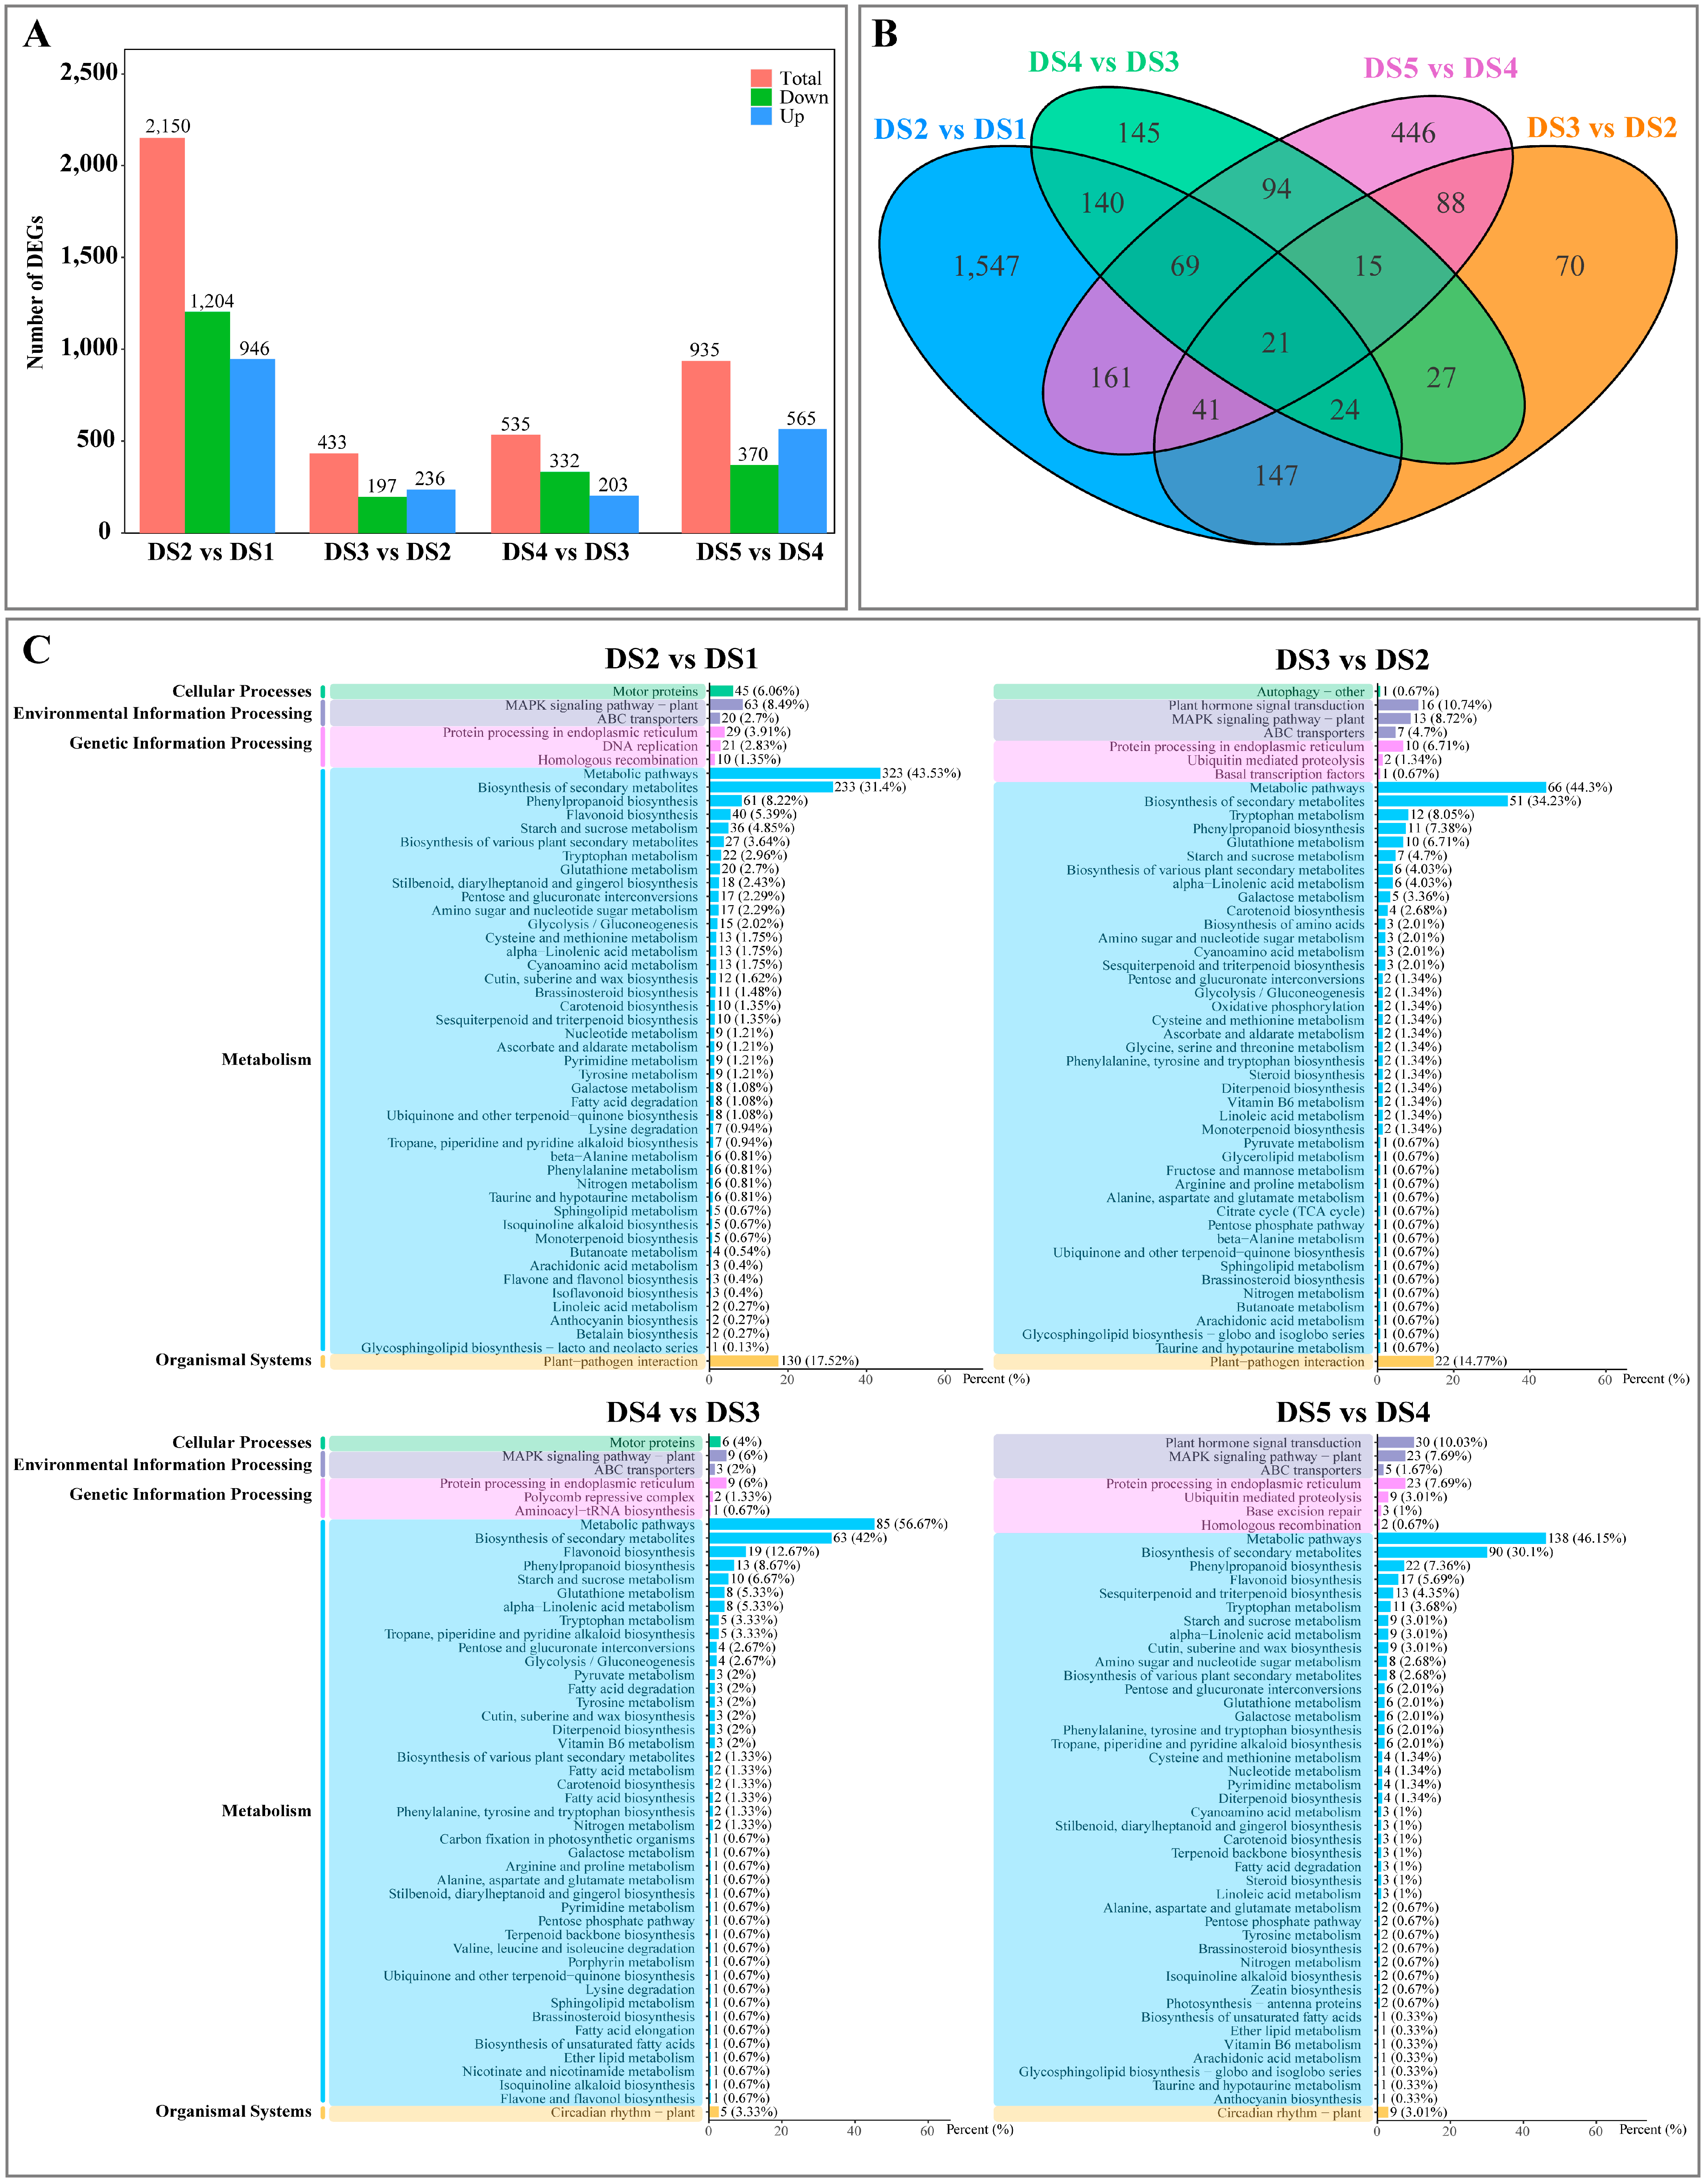
3.2. Transcriptomics Analysis

To study the changes in gene expression levels, transcriptome sequencing was performed on flower buds of P. pyrifolia ‘Cuiguan’ at five different dormancy stages (DS1, DS3, DS3, DS4, and DS5). More than 6 Gb raw data were obtained from the transcriptomes, resulting in 51.92 to 77.33 million total reads for each sample. More than 90% of the total reads for all samples from five stages were concordantly mapped to the sequences of the reference genome (GCF_019419815.1_Pyrus_bretschneideri_v1_genomic.fna.gz) (Table S2). These results indicated that the sequencing results were reliable with high quality. As shown in Figure S1, 15 samples were significantly separated into five clusters corresponding to five groups, indicating that the pear flower buds samples from different development stages had different genetic characteristics. Additionally, compared with the DS1 and DS5 groups, the DS2, DS3, and DS4 groups clustered closer, meaning that they had similar traits in genetic divergence.
The differentially expressed genes (DEGs) were identified under the criteria of |log2 FC| ≥ 1 and FDR < 0.05. A total of 4035 DEGs were found in ten comparison groups. In total, 2150, 433, 535, and 935 DEGs were detected in the comparisons of DS2 vs. DS1, DS3 vs. DS2, DS4 vs. DS3, and DS5 vs. DS4, respectively (Figure 2A, Table S3). Figure 2B presents the Venn diagrams depicting the number of identical or unique DEGs between the different comparison groups. In summary, the number of DEGs decreased first and then increased with the growth and development of flower buds of P. pyrifolia ‘Cuiguan’. The number of downregulated DEGs was less than that of upregulated genes in the DS3 vs. DS2 and DS5 vs. DS4 comparison groups. Compared with DS1, the number of downregulated DEGs at DS2 was higher than the number of upregulated DEGs. Compared with DS3, the number of downregulated DEGs at DS4 was higher than the number of upregulated DEGs. Compared with DS4, the number of upregulated DEGs at DS5 was more than the number of downregulated DEGs. These results indicated the specificity and patterns of gene expression at different developmental stages of flower buds of P. pyrifolia ‘Cuiguan’. The number of DEGs varied with the differentiation, growth, and development of flower buds. The number of DEGs significantly decreased after DS3, indicating that there were significantly differences between DS2 (endo-dormancy) and DS3 (endo-dormancy release stage). This may be related to the change in flower bud development state.
Enrichment analysis was performed to further explore the functional categories and main biological pathways involving these DEGs, and the 20 KEGG terms with the lowest q-values were selected as a showcase based on the KEGG pathway annotation classification. According to the KEGG enrichment results, 4035 DEGs were annotated into 5 broad classes, including cellular processes, environmental information processing, genetic information processing, metabolism, and organismal systems, with 21 subclasses (Figure 2C). It was found that most of the DEGs from different comparison groups were involved in metabolism and genetic information processing. The most enriched pathway was global and overview maps, then biosynthesis of other secondary metabolites, environmental adaptation, signal transduction, carbohydrate metabolism, lipid metabolism, and amino acid metabolism. Many plants generally translocate carbohydrates in the form of sugar, which may play a role in protecting plants during the winter by enhancing their stress tolerance. And this study identified the relevant pathways of carbohydrate metabolism, including “starch and sucrose metabolism” (ko00500), “galactose metabolism” (ko00052), “amino sugar and nucleotide sugar metabolism” (ko00520), “pentose and glucuronate interconversions” (ko00040), “glycolysis/gluconeogenesis” (ko00010), “fructose and mannose metabolism” (ko00051), and “pentose phosphate pathway” (ko00030). The prominent pathways were the first four pathways.

3.3. Proteomics Analysis

To explore the molecular mechanisms underlying the lifting of dormancy and germination of flower buds of P. pyrifolia ‘Cuiguan’, proteomic analysis of flower bub samples of P. pyrifolia ‘Cuiguan’ at five different dormancy stages (DS1, DS2, DS3, DS4, and DS5) was employed. In this study, a total of 140091 peptides were identified, 13730 proteins were identified and quantified (Figure S2A). Most peptides identified were distributed in 7–20 amino acids (Figure S2B), and the values of the Pearson’s correlation coefficient (R) based on the correlation analysis among samples were above 0.8 (Figure S2C), indicating that the proteomic data were of high quality and the identification results were accurate and reliable. Then, the protein expression levels in flower buds of P. pyrifolia ‘Cuiguan’ at different dormancy stages were compared, respectively. The standards of FC ≥ 1.5 or FC ≤ 0.67 and p-value < 0.05 were used to screen differentially expressed proteins (DEPs) among different comparison groups in this study. A total of 1596 DEPs were identified; all DEPs in each stage were quantified and are detailed in Table S4. There were 554 (317 upregulated and 237 downregulated), 346 (115 upregulated and 231 downregulated), 517 (163 upregulated and 354 downregulated), and 510 (364 upregulated and 146 downregulated) DEPs identified in DS2 vs. DS1, DS3 vs. DS2, DS4 vs. DS3, and DS5 vs. DS4, respectively (Figure 3A, Table S5). This suggested the different cold responsiveness of these proteins at the endo-dormancy stage, eco-dormancy stage, and germination stage. Venn diagrams depicted the number of identical or unique DEPs between the different comparison groups (Figure 3B), indicating that some crucial proteins or pathways were induced, potentially contributing to the cold tolerance of flower buds.
With a p-value < 0.05 as the standard, KEGG metabolic pathways with significantly enriched DEPs were screened. The DEPs could be mainly divided into five categories: cellular processes, environmental information processing, genetic information processing, metabolism, and organismal systems (Figure 3C). Especially metabolism was found as the richest category. In the DS2 vs. DS1 group, DEPs were significantly enriched in pentose and glucuronate interconversions, glycolysis/gluconeogenesis, starch and sucrose metabolism, galactose metabolism, and fructose and mannose metabolism. In the DS3 vs. DS2 group, DEPs were significantly enriched in starch and sucrose metabolism, pentose and glucuronate interconversions, and amino sugar and nucleotide sugar metabolism. In the DS4 vs. DS3 group, DEPs were significantly enriched in starch and sucrose metabolism, galactose metabolism, pentose and glucuronate interconversions, glycolysis/gluconeogenesis, fructose and mannose metabolism, biosynthesis of nucleotide sugars, and amino sugar and nucleotide sugar metabolism. In the DS5 vs. DS4 group, DEPs were significantly enriched in starch and sucrose metabolism, pentose and glucuronate interconversions, glycolysis/gluconeogenesis, and galactose metabolism. In a word, during the dormancy release and germination stages of flower buds of P. pyrifolia ‘Cuiguan’, DEPs were significantly enriched in starch and sucrose metabolic pathways involved in carbohydrate metabolism, as well as in oxidative phosphorylation related to energy metabolism.
The subcellular localization of DEPs was predicted, and the parts involved in various life activities in cells were explored using Wolf Psort software (https://wolfpsort.hgc.jp/). As shown in Figure S3, DEPs mostly played a role in the chloroplast, nucleus, cytoplasm, plasma membrane, and others. These DEPs located in different subcellular structures may jointly participate in the complex biological regulatory network of P. pyrifolia ‘Cuiguan’, from breaking dormancy to germination, which is related to signal transduction, gene expression, energy metabolism, and photosynthesis.

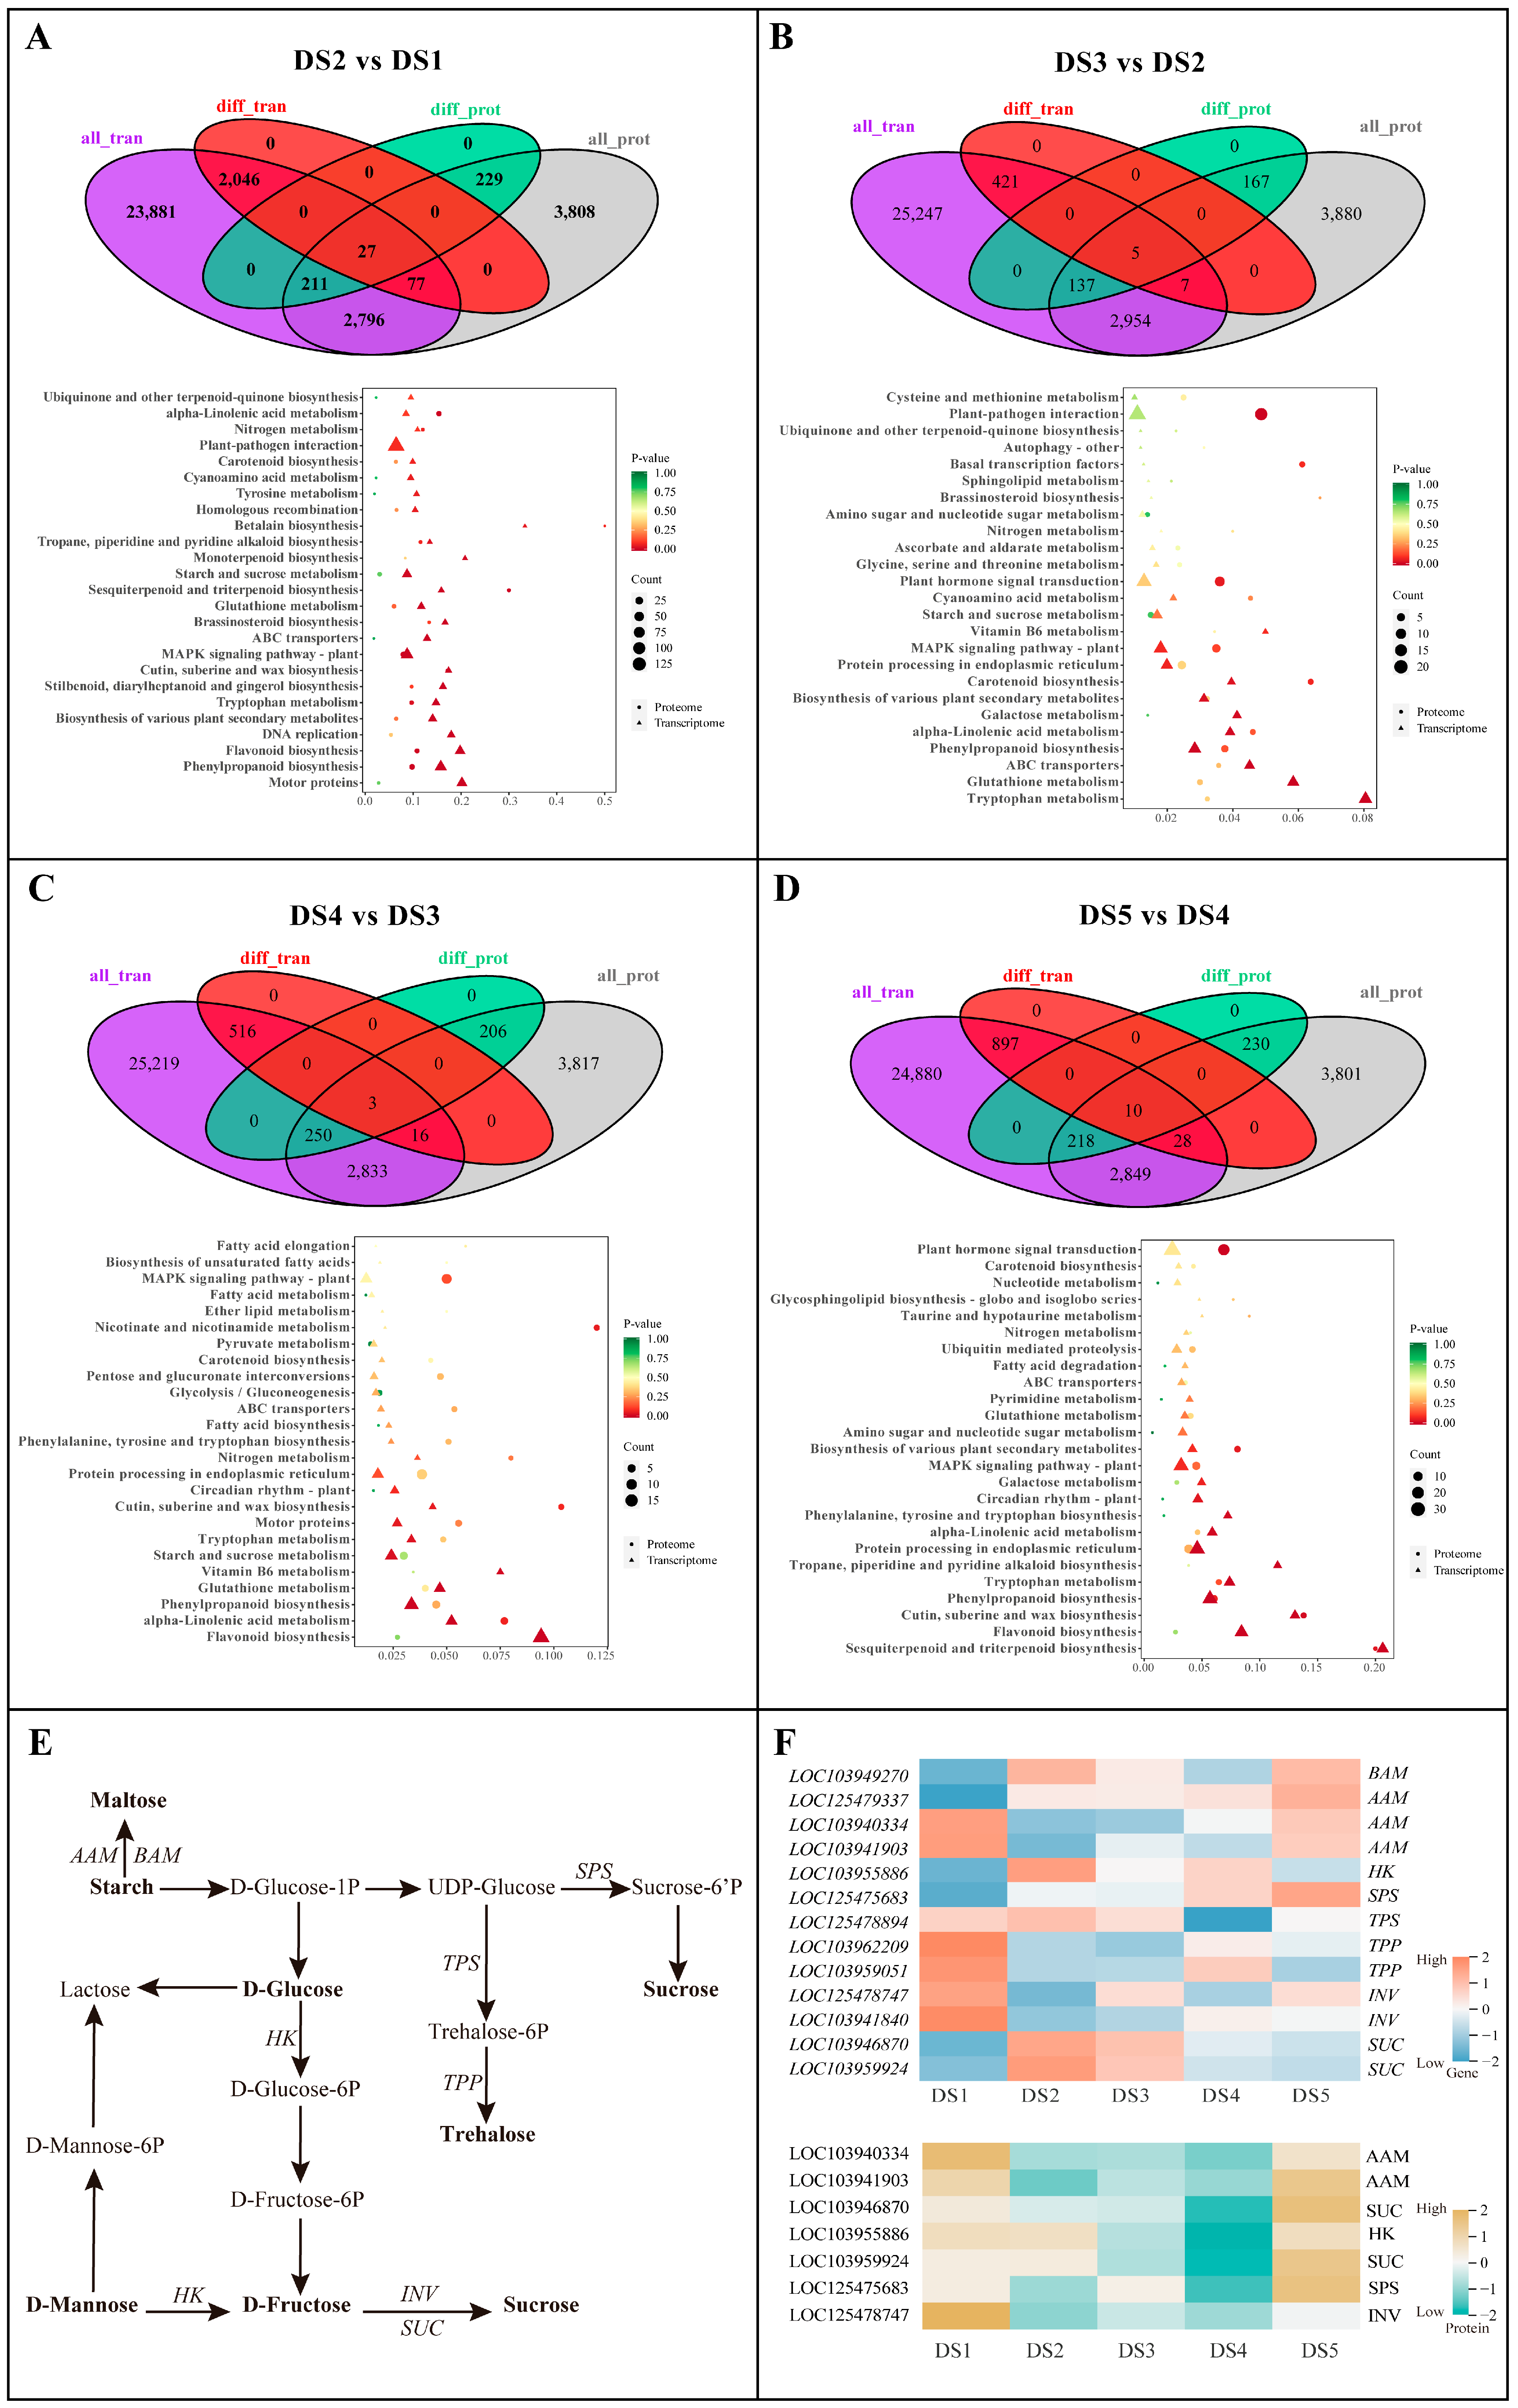
3.4. Multi-Omics Integrative Analysis

The transcriptomic and proteomic data were analyzed based on biological pathways to systematically describe the regulation mechanism of P. pyrifolia ‘Cuiguan’ flower bud dormancy release and germination. In total, 29,038, 28,771, 28,837, and 28,882 genes were quantifiable in the DS2 vs. DS1, DS3 vs. DS2, DS4 vs. DS3, and DS5 vs. DS4 groups, respectively. Meanwhile, there were 7148, 7150, 7125, and 7136 quantified proteins, respectively. Among them, 3111, 3103, 3102, and 3105 proteins had gene expression information. In DS2 vs. DS1, there were 2150 DEGs and 467 DEPs; among them, 27 DEPs had gene expression information (Figure 4A). In DS3 vs. DS2, there were 433 DEGs and 309 DEPs; among them, 5 DEPs had gene expression information (Figure 4B). In DS4 vs. DS3, there were 535 DEGs and 459 DEPs; among them, 3 DEPs had gene expression information (Figure 4C). In DS5 vs. DS4, there were 935 DEGs and 456 DEPs; among them, 10 DEPs had gene expression information (Figure 4D). Then, combined with the KEGG pathway database, the pathways in which the DEGs and DEPs were co-enriched were obtained, aiming to screen the key pathways most significantly related to biological phenomena. As shown in Figure 4A–D, the DEGs and DEPs among the different groups were significantly enriched in starch and sucrose metabolism, galactose metabolism, phenylpropanoid biosynthesis, flavonoid biosynthesis, MAPK signaling pathway—plant, protein processing in endoplasmic reticulum, and others. Carbohydrate metabolism plays a crucial role in the dormancy release and growth of flower buds of fruit plants. These results indicated that relevant pathways of carbohydrate metabolism, especially sugar metabolism, changed significantly during dormancy release and germination in flower buds of P. pyrifolia ‘Cuiguan’, and the changes may be regulated by both gene and protein profiles.
Subsequently, a model for the regulation mechanism of the biosynthesis pathways of sugar metabolism during the process of dormancy release and the germination in P. pyrifolia ‘Cuiguan’ flower buds were comprehensively mapped (Figure 4E). As shown in the Figure 4F, some DEGs, such as BAM (LOC103949270), AAM (LOC125479337, LOC103940334, and LOC103941903), SPS (LOC125475683), and INV (LOC125478747), related to ‘starch and sucrose metabolism’ metabolic pathways were upregulated at DS5, indicating that starch was mainly converted into maltose and sucrose to provide energy for flower bud germination after dormancy release. Whereas HK (LOC103955886), related to ‘glycolysis/gluconeogenesis’, ‘fructose and mannose metabolism’, ‘galactose metabolism’, ‘starch and sucrose metabolism’, ‘amino sugar and nucleotide sugar metabolism’, and ‘biosynthesis of nucleotide sugars’ metabolic pathways, were downregulated. The results of qRT-PCR showed that the HK (LOC103955886) and INV (LOC125478747) genes showed similar expression patterns at DS5 ((Figure S4), which may be involved in the metabolic regulation of sucrose during bud dormancy in P. pyrifolia ‘Cuiguan’.
To investigate the specific molecular regulation mechanism of sugar metabolism-induced dormancy release in flower buds of P. pyrifolia ‘Cuiguan’, the main proteins involved in sugar metabolism are listed in Table S6 (only proteins with gene expression information are listed). Only AAM (LOC103940334 and LOC103941903) related to ‘starch and sucrose metabolism’ were identified as DEPs (Table S4). This finding suggested that changes in their expression levels may play a significant role in this metabolic pathway. Although SUC (LOC103946870 and LOC103959924), HK (LOC103955886), SPS (LOC125475683), and INV (LOC125478747) were not identified as DEPs, they were mainly involved with sugar metabolism, such as ‘starch and sucrose metabolism’ (ko00500), ‘fructose and mannose metabolism’ (ko00051), and ‘galactose metabolism’ (ko00052) (Table S6). These findings illustrate that these 5 proteases may interact with other differentially expressed proteins or genes to maintain basic metabolic functions related to sugar metabolism. Further studies with varying conditions or more detailed analyses might be needed to fully understand their role and regulation in sugar metabolism.

3.5. Co-Expression Analysis Identified Key TFs in Dormancy Process

Pairwise correlations of gene expression between all samples were used to establish gene co-expression networks. After removing low-expression genes, a gene dendrogram was built based on the gene expression in 15 samples (Figure 5A) and major branches of the tree were associated with distinct modules. Each module corresponded to a group of very highly interconnected genes with strong correlation coefficients. A total of 22 separate expression modules were identified, and the number of genes per module ranged from 62 to 4767. The correlation matrix between these modules and physiological indicators was treated as a heatmap, and the visualization is shown in Figure 5B. In Figure 5C, it is shown that the green-yellow module had a strong positive correlation with enzyme activities for GPI, MDH, and ICL (p < 0.05). Correlation with G6PDH activity was strongest in the yellow module (p < 0.05). In addition, TSS content was correlated most with the grey60 module, while TS content was correlated most with the purple module, with p < 0.05. With these results, the key modules for this additional in-depth analysis were decided to be the green-yellow, yellow, grey60, and purple ones.
MADS-box, MYB, and AP2/ERF transcription factors are regarded as crucial genes for the bud dormancy and release process of deciduous fruit trees. In this study, a total of 4 MADS-box TFs, 2 MYBs, and 7 AP2/ERF TFs in the green-yellow module were identified, respectively. A total of 2 MADS-box TFs, 6 MYBs, and 7 AP2/ERF TFs in the yellow module were identified, respectively. A total of 2 MADS-box TFs, 6 MYBs, and 4 AP2/ERF TFs in the grey60 module were identified, respectively. A total of 3 MADS-box TFs, 6 MYBs, and 2 AP2/ERF TFs in the purple module were identified, respectively. The KEGG annotation and GO classification information for these TFs in the green-yellow, yellow, grey60, and purple modules are shown in Table S7. It included many ethylene-responsive transcription factor ERFs (such as LOC103956153, LOC103959049, LOC103960521, LOC103962212, LOC103961582, and LOC125476067) based on the KEGG annotation results. Therefore, these genes may be highly correlated with bud dormancy and release induced by ethylene signal transduction and warrant further study.

4. Discussion

A significant amount of energy is required for pear bud germination to overcome dormancy during bud development. Previous studies have shown that bud dormancy is closely associated with three major energy metabolism pathways in plants: the tricarboxylic cycle (TCA), glycolysis (EMP)/gluconeogenesis (GNG), and the pentose phosphate pathway (PPP) [30]. The key enzymes involved in these pathways include GPI, MDH, G6PDH, and ICL. In EMP, GPI serves as a critical regulatory enzyme, whereas MDH catalyzes the final step of the TCA cycle, converting malic acid to malate; meanwhile, G6PDH acts as the primary regulatory enzyme of the PPP, playing a pivotal role in initiating this pathway [31,32]. One of the key factors contributing to dormancy is the metabolic shift from the EMP-TCA pathway to the PPP [33,34]. Borek et al. [35] also highlighted the critical role of ICL, an essential enzyme in the glyoxylate cycle, in regulating gluconeogenesis derived from lipid metabolism. The metabolic pathways involved undergo dynamic changes in key enzyme activities during dormancy development and release. The findings of this study reveal dynamic changes in key enzyme activities during bud dormancy in ‘Cuiguan’ pear trees. As shown in Figure 1A–D, the activities of GPI and MDH in ‘Cuiguan’ flower buds progressively decreased across dormancy stage, including BS1, BS2, BS3, BS4, and BS5, indicating decreases in the EMP pathway and TCA cycle. Specifically, G6PDH and ICL activities increased in the DS2 stage but decreased with the progression of dormancy. These results suggested distinct patterns in the four key enzyme activities during dormancy and that dormancy release involves coordinated regulation among multiple metabolic pathways. Currently, starch and soluble sugars are considered as an essential factor in the transition from dormancy to germinate in pear buds [36,37]. Therefore, investigating the enzymatic regulation of metabolic processes is critical understanding the underlying mechanisms. In this study, carbohydrate biosynthesis, metabolism, and related proteolytic mechanisms during dormancy were systematically analyzed in P. pyrifolia ‘Cuiguan’ flower buds, aiming to uncover the physiological basis of dormancy breaking and promotion of bud development. Another important observation was the inverse relationship between starch and soluble sugar contents during dormancy progression (Figure 1E,F), suggesting that the accumulation of soluble sugars primarily results from starch breakdown. The observed starch degradation coincided with increasing soluble sugar levels from early endodormancy through dormancy release. Low temperatures promote the conversion of starch to soluble sugars, cold acclimation, and supply of carbohydrates for subsequent growth after release from endodormancy. These results support the point proposed by Sauter [38] and Zhu et al. [39], wherein low temperatures facilitate starch-to-sugar conversion, enabling cold acclimation and providing carbohydrates for post-dormancy growth.
This study revealed significant upregulation of key carbohydrate metabolism genes during the DS5 (germination) stage in P. pyrifolia ‘Cuiguan’ flower buds, including BAM (LOC103949270), AAM (LOC125479337, LOC103940334, LOC103941903), SPS (LOC125475683), and INV (LOC125478747) (Figure 4F, Table S6). This indicated a metabolic shift toward carbohydrate mobilization to support dormancy release and germination of flower buds of ‘Cuiguan’ pears at this stage. Sucrose, as the primary soluble sugar, has been established through previous studies to regulate various physiological processes such as flower bud differentiation and fruit development [40,41,42]. Sucrose synthase (SUS) catalyzes the reversible conversion between UDP-glucose and fructose to form sucrose, while invertase (INV) hydrolyzes sucrose into glucose and fructose during germination [43,44]. In this study, sucrose metabolism might play a central role in bud dormancy release, with distinct regulation patterns observed for sucrose synthase (SUS, LOC103946870 and LOC103959924) and invertase (INV, LOC125478747). The expression levels of LOC103946870 and LOC103959924 (SUS) and LOC125478747 (INV) were higher at the germination stage than at other stages in this study, respectively. Compared with SUS, the expression level of INV was lower at the germination stage, suggesting its crucial role in promoting sucrose accumulation for energy supply. Concurrently, sucrose phosphate synthase (SPS, LOC125475683) showed peak activity at the germination stage (Figure 4F, Table S6), facilitating sucrose synthesis from fructose-6-phosphate [45]. This implied that sucrose synthesis and degradation in P. pyrifolia ‘Cuiguan’ flower buds reached a peak at the germination stage. The results of this research also showed peak activities of β-amylase (BAM) and α-amylase (AAM) at the germination stage (Figure 4F, Table S6), which may lead to an increase in the content of maltose and a decrease in starch content. The TS content did indeed drop to its lowest level at this stage (Figure 1F), supporting this point. Notably, trehalose metabolism was upregulated during dormancy release, with induced expression of trehalose-6-phosphate synthase (TPS, LOC125478894) at DS5 (Figure 4F, Table S6). TPS can synthesize a precursor, trehalose-6P, which has previously been shown to be a critical signaling molecule for sugar metabolism. This suggests that trehalose may coordinate carbon metabolism and stress responses during low temperature-induced dormancy release through its dual roles as a signaling molecule and stress protectant [46,47,48,49]. In pear plants, the primary soluble sugars include sorbitol, glucose, fructose, and sucrose [50]. While sorbitol-6-phosphate dehydrogenase (S6PDH) and sorbitol dehydrogenase (SDH) mediate sorbitol metabolism, their expression remained stable throughout bud dormancy and release progress in present study. Although sorbitol may serve as an important photosynthate, compatible solute, and cryoprotectant in fruit species [51], potentially contributing to low-temperature tolerance in ‘Cuiguan’ pear flower buds, the sorbitol concentration may not serve as a reliable indicator of dormancy release in this cultivar. This preliminary conclusion warrants further experimental validation to clarify sorbitol’s specific role in bud dormancy release regulation in P. pyrifolia ‘Cuiguan’.
Additionally, the proteomic data also revealed significant changes in metabolic pathways during the dormancy release and germination stage in P. pyrifolia ‘Cuiguan’ flower buds. The proteins involved in starch and sucrose metabolism showed a trend of upregulation at the germination stage, such AAM (LOC103940334, LOC103941903), reflecting enhanced metabolic activity for carbohydrate mobilization to support germination energetics. Additionally, five important proteases, including AAM (LOC103940334, LOC103941903), HK (LOC103955886), SPS (LOC125475683), INV (LOC125478747), and SUC (LOC103946870, LOC103959924), displayed increased activities during germination (Figure 4F, Table S6). Although they were not identified as DEPs, their increased activities suggested a metabolic shift toward carbohydrate catabolism and preparation for germination initiation. It was consistent with previous reports emphasizing the critical role of metabolic reprogramming in successful dormancy release and germination [52,53]. The coordinated activation of these metabolic enzymes highlights the complex regulatory network governing dormancy release in pear flower buds.
While sugar metabolism is important for dormancy release, other factors play critical roles. Plant hormones such as abscisic acid and ethylene have been shown to play a role in the regulation of bud dormancy in pears [20,54]. Previous studies have established that MADS-box, MYB, and AP2/ERF TFs play pivotal roles in regulating dormancy transitions in deciduous fruit trees [55,56,57,58]. In the present study, a total of 51 candidate TFs (MADS-boxs, MYBs, AP2/ERFs) in ‘Cuiguan’ pear buds were identified (Table S7), including many ethylene-responsive factors (ERFs). The significant enrichment of these genes in the ethylene signaling pathway suggested their potential role in mediating ethylene-induced dormancy release, which represent valuable candidates for subsequent functional studies. In addition, bud dormancy is regulated by complex biochemical pathways involving phenylpropanoid biosynthesis, stilbenoid, diarylheptanoid and gingerol biosynthesis, zeatin biosynthesis, ether lipid metabolism, endocytosis, and glycerophospholipid metabolism [21]. Future research should integrate these interconnected metabolic networks to systematically elucidate the regulatory mechanisms underlying bud dormancy and release in ‘Cuiguan’ pear plants.

5. Conclusions

The transition from dormancy to germination in pear buds involves complex metabolic processes and substantial energy mobilization. In this study, the dormancy release and germination of flower buds of P. pyrifolia ‘Cuiguan’ were closely related to the dynamic changes of four key sugar-metabolizing enzyme activities across energy metabolism pathways, including glucose-6-phosphate isomerase (GPI), malic dehydrogenase (MDH), glucose-6-phosphate dehydrogenase (G6PDH), and isocitrate lyase (ICL). Notably, we observed that starch–sugar interconversion plays a pivotal role in this process. The degradation of total starch (TS) correlated with increased total soluble sugar (TSS) content, a transition likely facilitated by low-temperature conditions to support cold acclimation and provide metabolic substrates for bud growth. At the molecular level, some key genes (including BAM, AAM, SPS, and INV) involved in carbohydrate metabolism showed significantly upregulated expression at the germination stage, facilitating the transition from dormancy to active growth. Particularly, SUS and INV genes appear to be crucial for sucrose metabolism, while trehalose and its precursor (trehalose-6P) may function in stress response and carbon allocation. A total of 51 critical transcription factors and 5 proteins associated with carbohydrate biosynthesis and degradation were identified through the multi-omics approach. These findings provide comprehensive transcriptomic and proteomic insights into the coordination of dormancy release and germination of flower buds of pear plants.

Supplementary Materials

The following supporting information can be downloaded at: https://www.mdpi.com/article/10.3390/horticulturae11070813/s1, Table S1. All primers used in qRT-PCR analysis. Table S2. Alignment results of transcriptomic data of flower bud samples at different development stages of P. pyrifolia ‘Cuiguan’. Table S3. The number of differentially expressed genes (DEGs) in different comparison groups. Table S4. The detailed information of the differentially expressed proteins (DEPs) in each comparison group. Table S5. The number of differentially expressed proteins (DEPs) in different comparison groups. Table S6. Expressions of selected DEGs and proteins in sugar metabolism of P. pyrifolia ‘Cuiguan’ flower buds at different dormancy stages. Table S7. Information on key transcription factors in green-yellow, yellow, grey60, and purple modules. Figure S1. Systematic analysis of transcriptome data of flower bud samples at different development stages of P. pyrifolia ‘Cuiguan’. Figure S2. Alignment results of proteomic data of flower bud samples at different development stages of P. pyrifolia ‘Cuiguan’. Figure S3. The subcellular localization prediction of DEPs among different comparison groups. Figure S4. qRT-PCR analysis for DEGs associated with the biosynthesis pathways of sugar metabolism at five different dormancy stages. Gene expression levels were estimated with the fragments per kilobase per million fragments (FPKM). Error bars indicate mean ± SEM (n = 3).

Author Contributions

Conceptualization, H.W. and D.H.; Data curation, L.D. and Q.Y.; Formal analysis, L.X.; Funding acquisition, D.H.; Investigation, S.W.; Methodology, X.H.; Project administration, D.H.; Resources, S.W.; Software, X.H.; Validation, L.X.; Visualization, L.D. and Q.Y.; Writing—original draft, H.W.; Writing—review & editing, H.W. and D.H. All authors have read and agreed to the published version of the manuscript.

Funding

This research was funded by Fujian Province Science and Technology Plan Guiding Project (2021N0020), Education and Research Project for Young and Middle aged Teachers in Fujian Province (JZ230079), Key Research Project of Fujian Agricultural Vocational and Technical College (2024JS031), and Fujian Agricultural Vocational and Technical College “Unveiling the List and Leading the Way” Project (2024JS007).

Data Availability Statement

The original contributions presented in this study are included in the article and Supplementary Material. Further inquiries can be directed to the corresponding author.

Conflicts of Interest

The authors declare no conflicts of interest.

References

  1. Chao, W.S.; Doğramacı, M.; Horvath, D.P.; Foley, M.E.; Anderson, J.V. Dormancy Induction and Release in Buds and Seeds; Springer International Publishing: Berlin/Heidelberg, Germany, 2015; pp. 235–256. [Google Scholar]
  2. Zhao, X.H.; Liu, J.T.; Fu, X.L.; Xiao, L.; Wang, Q.J.; Wang, C.R.; Chen, Z.Z.; Li, J.K.; Lu, C.K.; Cao, H.; et al. Whole-genome characterization of CKX genes in Prunus persica and their role in bud dormancy and regrowth. J. Integr. Agric. 2024, 23, 4058–4073. [Google Scholar]
  3. Yi, X.K.; Xu, Y.L.; Gao, Z.H.; Zhang, J.Y.; Pan, H.F.; Qi, Y.J.; Qin, G.H.; Li, B. Warm winter temperature induced changes in the dormant buds of ‘Dangshansuli’ pear (Pyrus bretschneideri Rehd.). Indian J. Hortic. 2020, 77, 273–278. [Google Scholar]
  4. Ito, A.; Sakaue, T.; Fujimaru, O.; Iwatani, A.; Ikeda, T.; Sakamoto, D.; Sugiura, T.; Moriguchi, T. Comparative phenology of dormant Japanese pear (Pyrus pyrifolia) flower buds: A possible cause of ‘flowering disorder’. Tree Physiol. 2018, 38, 825–839. [Google Scholar]
  5. Lang, G.A.; Early, J.D.; Martin, G.C.; Darnell, R.L. Endo-, para-, and ecodormancy: Physiological terminology and classification for dormancy research. HortScience 1987, 22, 371–377. [Google Scholar]
  6. Rohde, A.; Bhalerao, P.R. Plant dormancy in the perennial context. Trends Plant Sci. 2007, 12, 217–223. [Google Scholar]
  7. Singh, R.K.; Svystun, T.; AlDahmash, B.; Jönsson, A.M.; Bhalerao, R.P. Photoperiod-and temperature-mediated control of phenology in trees–a molecular perspective. New Phytol. 2017, 213, 511–524. [Google Scholar]
  8. Shu, P.T.; Ding, M.; Chun, L. The Physiological and biochemical changes of lily bulbs during dormancy release with cold treatment. Acta Agric. Univ. Jiangxiensis 2005, 27, 404–407. [Google Scholar]
  9. Li, X.; Yang, L.Y.; Chen, M.M. Hormone change during dormancy and flower bud differentiation process in Lilium oriental× trumpet hybrid ‘ConcaD Or’. Chin. Agric. Sci. Bull. 2020, 36, 42–47. [Google Scholar]
  10. Patrick, W.J.; Botha, F.C.; Birch, R.G. Metabolic engineering of sugars and simple sugar derivatives in plants. Plant Biotechnol. J. 2013, 11, 142–156. [Google Scholar]
  11. Salam, B.B.; Barbier, F.; Danieli, R.; Teper-Bamnolker, P.; Ziv, C.; Spíchal, L.; Aruchamy, K.; Shnaider, Y.; Leibman, D.; Shaya, F.; et al. Sucrose promotes stem branching through cytokinin. Plant Physiol. 2021, 185, 1708–1721. [Google Scholar]
  12. Mason, M.G.; Ross, J.J.; Babst, B.A.; Wienclaw, B.N.; Beveridge, C.A. Sugar demand, not auxin, is the initial regulator of apical dominance. Proc. Natl. Acad. Sci. USA 2014, 111, 6092–6097. [Google Scholar] [PubMed]
  13. Jiang, S.; Li, S.G.; Luo, J.; Wang, X.Q.; Shi, C.H. QTL mapping and transcriptome analysis of sugar content during fruit ripening of Pyrus pyrifolia. Front. Plant Sci. 2023, 14, 1137104. [Google Scholar]
  14. McWhite, C.D.; Papoulas, O.; Drew, K.; Cox, R.M.; June, V.; Dong, O.X.; Kwon, T.; Wan, C.; Salmi, M.L. A pan-plant protein complex map reveals deep conservation and novel assemblies. Cell 2020, 181, 460–474. [Google Scholar] [PubMed]
  15. Zhang, T.; Yuan, Y.; Zhan, Y.; Cao, X.; Liu, C.; Zhang, Y.; Gai, S. Metabolomics analysis reveals Embden Meyerhof Parnas pathway activation and flavonoids accumulation during dormancy transition in tree peony. BMC Plant Biol. 2020, 20, 484. [Google Scholar]
  16. Zhang, G.; Tang, R.; Niu, S.; Si, H.; Yang, Q.; Rajora, O.P.; Li, X.Q. Heat-stress-induced sprouting and differential gene expression in growing potato tubers: Comparative transcriptomics with that induced by postharvest sprouting. Hortic. Res. 2021, 8, 226. [Google Scholar]
  17. Xu, G.G.; Li, L.J.; Zhou, J.; He, M.Q.; Lyu, D.G.; Zhao, D.Y.; Qin, S.J. Integrated transcriptomics and metabolomics analyses reveal key genes and essential metabolic pathways for the acquisition of cold tolerance during dormancy in apple. Environ. Exp. Bot. 2023, 213, 105413. [Google Scholar]
  18. Li, J.Z.; Yan, X.H.; Ahmad, M.; Yu, W.J.; Song, Z.Z.; Ni, J.B.; Yang, Q.S.; Teng, Y.W.; Zhang, H.G.; Bai, S.L. Alternative splicing of the dormancy-associated MADS-box transcription factor gene PpDAM1 is associated with flower bud dormancy in ‘Dangshansu’ pear (Pyrus pyrifolia white pear group). Plant Physiol. Biochem. 2021, 166, 1096–1108. [Google Scholar]
  19. Tominaga, A.; Ito, A.; Sugiura, T.; Yamane, H. How is global warming affecting fruit tree blooming? “Flowering (dormancy) disorder” in Japanese pear (Pyrus pyrifolia) as a case study. Front. Plant Sci. 2022, 12, 787638. [Google Scholar]
  20. Li, J.Z.; Xu, Y.; Niu, Q.F.; He, L.F.; Teng, Y.W.; Bai, S.L. Abscisic acid (ABA) promotes the induction and maintenance of pear (Pyrus pyrifolia White Pear Group) flower bud endodormancy. Int. J. Mol. Sci. 2018, 19, 310. [Google Scholar]
  21. Liu, G.Q.; Li, W.S.; Zheng, P.H.; Tong, X.; Chen, L.J.; Liu, D.F.; Hussain, S.; Teng, Y.W. Transcriptomic analysis of ‘Suli’pear (Pyrus pyrifolia white pear group) buds during the dormancy by RNA-Seq. BMC Genom. 2012, 13, 700. [Google Scholar]
  22. Hussain, S.; Niu, Q.; Yang, F.; Hussain, N.; Teng, Y. The possible role of chilling in floral and vegetative bud dormancy release in Pyrus pyrifolia. Biol. Plant. 2015, 59, 726–734. [Google Scholar]
  23. Patel, M.S.; Nemeria, N.S.; Furey, W.; Jordan, F. The pyruvate dehydrogenase complexes: Structure-based function and regulation. J. Biol. Chem. 2014, 289, 16615–16623. [Google Scholar] [PubMed]
  24. Xue, Y.L. Plant Physiology Experimentation Handbook; Shanghai Technology Publishing Company: Shanghai, China, 1985; pp. 183–184. (In Chinese) [Google Scholar]
  25. Meillon, S.D.; Small, J.G.C.; Venter, H.A.V.D. The respiratory metabolism of Strelitzia juncea Ait. seeds: The effect of dormancy release through oxygen incubation of the seeds on the activity of glucose-6-phosphate dehydrogenase and 6-phosphogluconate dehydrogenase. J. Exp. Bot. 1990, 41, 709–714. [Google Scholar]
  26. Bogatek, R.; Zarska-Maciejewska, B.; Sińska, I.; Lewak, S. The embryonic axis controls lipid catabolism in cotyledons of apple seeds during germination. Physiol. Plant. 1989, 76, 557–562. [Google Scholar]
  27. Du, Y.L.; Zhao, Q.; Chen, L.R.; Yao, X.D.; Zhang, W.; Zhang, B.; Xie, F.T. Effect of drought stress on sugar metabolism in leaves and roots of soybean seedlings. Plant Physiol. Biochem. 2020, 146, 1–12. [Google Scholar]
  28. Zhao, D.L.; MacKown, C.T.; Starks, P.J.; Kindiger, B.K. Rapid analysis of nonstructural carbohydrate components in grass forage using microplate enzymatic assays. Crop Sci. 2010, 50, 1537–1545. [Google Scholar]
  29. Livak, K.J.; Schmittgen, T.D. Analysis of relative gene expression data using real-time quantitative PCR and the method. Methods 2001, 4, 402–408. [Google Scholar]
  30. Li, X.; Li, X.L.; Gao, D.S.; Yang, X.P. Influence of shading on respiratory metabolism of sweet cherry dormant buds. Chin. J. Eco-Agric. 2005, 13, 57–59. [Google Scholar]
  31. Li, D.M.; Li, L.; Tan, Y.; Chen, X.D.; Zhang, H.S.; Gao, D.S.; Li, J. Effect of photoperiod on key enzyme activities of respiration in nectarine buds during dormancy induction. Agric. Sci. China 2011, 10, 1026–1031. [Google Scholar]
  32. Tan, Y.; Gao, D.S.; Li, L.; Chen, X.D.; Xu, A.H. Respiratory response of dormant nectarine floral buds on chilling deficiency. Agric. Sci. China 2010, 9, 1448–1454. [Google Scholar]
  33. Pu, X.C.; Han, J.G.; Li, M.; Du, G.P.; Ni, X.Q. Studies on respiratory pathways of zoysiagrass seed when breaking dormancy. Acta Prataculturae Sin. 1996, 5, 56–60. [Google Scholar]
  34. Li, X.L.; Yan, T.L.; Ga, D.S.; Yuan, Z.Y. Metabolic changes during low temperature induced dormancy release in ‘NJ72’nectarine (Prunus persica L. Batsch). Chin. J. Eco-Agric. 2002, 10, 27–29. [Google Scholar]
  35. Borek, S.; Nuc, K. Sucrose controls storage lipid breakdown on gene expression level in germinating yellow lupine (Lupinus luteus L.) seeds. J. Plant Physiol. 2011, 168, 1795–1803. [Google Scholar] [PubMed]
  36. Ito, A.; Sakamoto, D.; Moriguchi, T. Carbohydrate metabolism and its possible roles in endodormancy transition in Japanese pear. Sci. Hortic. 2012, 144, 187–194. [Google Scholar]
  37. Horikoshi, H.M.; Sekozawa, Y.; Sugaya, S. Inhibition of carbohydrate metabolism by thermal fluctuations during endodormancy lead to negative impacts on bud burst and incidence of floral necrosis in ‘Housui’ Japanese pear flower buds. Sci. Hortic. 2017, 224, 324–331. [Google Scholar]
  38. Sauter, J.J. Temperature-induced changes in starch and sugars in the stem of Populus× canadensis «robusta». J. Plant Physiol. 1988, 132, 608–612. [Google Scholar]
  39. Zhu, H.R.; Chen, Z.Q.; Zhang, K.Z.; Cui, J.T. The key role of sugar metabolism in the dormancy release and bud development of Lilium brownii var. viridulum Baker bulbs. Sci. Hortic. 2024, 336, 113453. [Google Scholar]
  40. Eveland, A.L.; Jackson, D.P. Sugars, signalling, and plant development. J. Exp. Bot. 2012, 63, 3367–3377. [Google Scholar]
  41. Guo, Y.Y.; An, L.Z.; Yu, H.Y.; Yang, M.M. Endogenous hormones and biochemical changes during flower development and florescence in the buds and leaves of Lycium ruthenicum Murr. Forests 2022, 13, 763. [Google Scholar] [CrossRef]
  42. Xuan, L.J.; Wang, Q.Q.; Liu, Z.G.; Xu, B.; Cheng, S.Y.; Zhang, Y.J.; Lu, D.Y.; Dong, B.; Zhang, D.M.; Zhang, L.; et al. Metabolic analysis of the regulatory mechanism of sugars on secondary flowering in Magnolia. BMC Mol. Cell Biol. 2022, 23, 56. [Google Scholar]
  43. Ruan, Y.L.; Jin, Y.; Yang, Y.J.; Li, G.J.; Boyere, J.S. Sugar input, metabolism, and signaling mediated by invertase: Roles in development, yield potential, and response to drought and heat. Mol. Plant 2010, 3, 942–955. [Google Scholar]
  44. Brill, E.; Thournout, M.; White, R.G.; Llewellyn, D.; Campbell, P.M.; Engelen, S.; Ruan, Y.L.; Arioli, T.; Furbank, R.T. A novel isoform of sucrose synthase is targeted to the cell wall during secondary cell wall synthesis in cotton fiber. Plant Physiol. 2011, 157, 40–54. [Google Scholar]
  45. Tian, X.C.; Zhu, L.C.; Yang, N.X.; Song, J.Y.; Zhao, H.Y.; Zhang, J.; Ma, F.W.; Li, M.G. Proteomics and metabolomics reveal the regulatory pathways of ripening and quality in post-harvest kiwifruits. J. Agric. Food Chem. 2021, 69, 824–835. [Google Scholar] [PubMed]
  46. Kolbe, A.; Tiessen, A.; Schluepmann, H.; Paul, M.; Ulrich, S.; Geigenberger, P. Trehalose 6-phosphate regulates starch synthesis via posttranslational redox activation of ADP-glucose pyrophosphorylase. Proc. Natl. Acad. Sci. USA 2005, 102, 11118–11123. [Google Scholar]
  47. Wingler, A.; Fritzius, T.; Wiemken, A.; Boller, T.; Aeschbacher, R.A. Trehalose induces the ADP-glucose pyrophosphorylase gene, ApL3, and starch synthesis in Arabidopsis. Plant Physiol. 2000, 124, 105–114. [Google Scholar] [PubMed]
  48. Paul, M.J.; Primavesi, L.F.; Jhurreea, D.; Zhang, Y.H. Trehalose metabolism and signaling. Annu. Rev. Plant Biol. 2008, 59, 417–441. [Google Scholar] [PubMed]
  49. Zhang, W.; Wang, Y.; Guo, Y. Research progress of trehalose 6- phosphate signal regulation in higher plants. Plant Physiol. 2016, 52, 394–400. [Google Scholar]
  50. Wu, C.Q.; Jia, L.T.; Fan, J.B.; Zhang, Z.; Ma, M.; Zhang, S.L.; Liu, Z.Q.; Ren, Y.Q.; Wang, L.B.; Zhang, S.L. Research progress of sugar and acid transformation in horticultural fruits. China Fruit Veg. 2020, 40, 39–47. [Google Scholar]
  51. Lloret, A.; Martínez-Fuentes, A.; Agustí, M.; Badenes, M.L.; Ríos, G. Chromatin-associated regulation of sorbitol synthesis in flower buds of peach. Plant Mol. Biol. 2017, 95, 507–517. [Google Scholar]
  52. Michailidis, M.; Karagiannis, E.; Tanou, G.; Sarrou, E.; Adamakis, I.; Karamanoli, K.; Martens, S.; Molassiotis, A. Metabolic mechanisms underpinning vegetative bud dormancy release and shoot development in sweet cherry. Environ. Exp. Bot. 2018, 155, 1–11. [Google Scholar]
  53. George, I.S.; Fennell, A.Y.; Haynes, P.A. Shotgun proteomic analysis of photoperiod regulated dormancy induction in grapevine. J. Proteom. 2018, 187, 13–24. [Google Scholar]
  54. Galimba, K.D.; Denew, M.; Waite, J.M. Application of ABA and ACC in autumn affects dormancy and cold hardiness of pear (Pyrus communis). HortTechnology 2025, 35, 385–391. [Google Scholar]
  55. Moser, M.; Asquini, E.; Miolli, G.V.; Weigl, K.; Hanke, M.V.; Flachowsky, H.; Si-Ammour, A. The MADS-box gene MdDAM1 controls growth cessation and bud dormancy in apple. Front. Plant Sci. 2020, 11, 1003. [Google Scholar]
  56. Niu, Q.F.; Li, J.Z.; Cai, D.Y.; Qian, M.J.; Jia, H.M.; Bai, S.L.; Hussain, S.; Liu, G.Q.; Teng, Y.W.; Zheng, X.Y. Dormancy-associated MADS-box genes and microRNAs jointly control dormancy transition in pear (Pyrus pyrifolia white pear group) flower bud. J. Exp. Bot. 2016, 67, 239–257. [Google Scholar]
  57. Vimont, N.; Fouché, M.; Campoy, J.A.; Tong, M.X.Z.; Arkoun, M.; Yvin, J.; Wigge, P.A.; Dirlewanger, E.; Cortijo, S.; Wenden, B. From bud formation to flowering: Transcriptomic state defines the cherry developmental phases of sweet cherry bud dormancy. BMC Genom. 2019, 20, 974. [Google Scholar]
  58. Zhu, Y.Y.; Liu, X.L.; Gao, Y.D.; Li, K.; Guo, W.D. Transcriptome-based identification of AP2/ERF family genes and their cold-regulated expression during the dormancy phase transition of Chinese cherry flower buds. Sci. Hortic. 2021, 275, 109666. [Google Scholar]
Figure 1. Changes in sugar-metabolizing enzyme activities and carbohydrate contents in flower buds of P. pyrifolia ‘Cuiguan’ at five different dormancy stages. (A) The activities of GPI; (B) The activities of G6PDH; (C) The activities of MDH; (D) The activities of ICL; (E) The content of TSS; (F) The content of TS. GPI: Glucose-6-phosphate isomerase; G6PDH: Glucose-6-phosphate dehydrogenase; MDH: Malic dehydrogenase: ICL: Isocitrate lyase; TSS: Total soluble sugar; TS: Total starch. DS1: 12 October, 2022 (endo-dormancy early stage); DS2: 27 December 2022 (endo-dormancy stage); DS3: 3 January 2023 (endo-dormancy release stage); DS4: 9 January, 2023 (eco-dormancy stage); DS5: 3 February 2023 (germination stage). Different lowercase letters at different dormancy stages indicated significant difference (p < 0.05).
Horticulturae 11 00813 g001
Figure 2. Analysis of transcriptomic data of flower buds of P. pyrifolia ‘Cuiguan’ at different dormancy stages. (A) Screening of DEGs among different comparison groups; (B) Venn diagram of DEGs among different comparison groups; (C) KEGG enrichment analysis of DEGs.
Horticulturae 11 00813 g002
Figure 3. Analysis of proteomic data of flower buds of P. pyrifolia ‘Cuiguan’ at different dormancy stages. (A) Screening of DEPs among different comparison groups; (B) Venn diagram of DEPs among different comparison groups; (C) KEGG enrichment analysis of DEPs.
Horticulturae 11 00813 g003
Figure 4. Integrative analysis of proteomic and transcriptomic data of flower buds of P. pyrifolia ‘Cuiguan’ at different dormancy stages. (AD) Venn diagram and KEGG enrichment bubble diagram of different comparison groups; (E) Model of the pathways of mainly sugar metabolism during the process of dormancy release and germination of P. pyrifolia ‘Cuiguan’ flower buds. (F) Clustering heatmaps of DEGs and key proteins identified in the pathways of carbohydrate biosynthesis. BAM: β-Amylase; AAM: α-Amylase; HK: Hexokinase; SPS: Sucrose phosphate synthase; TPS: Trehalose-6-phosphate synthase; TPP: Trehalose-6-phosphate phosphatase; INV: β-Fructofuranosidase; SUS: Sucrose synthase.
Horticulturae 11 00813 g004
Figure 5. Weighted gene correlation network analysis (WGCNA) of all samples. (A) Hierarchical cluster tree showing correlation modules identified by WGCNA. Each leaf in the tree represents one gene and each major tree branch represents one module, labeled with different colors. (B) Hierarchical cluster tree showing co-expression modules based on the correlation of expression levels among genes. Each leaf, that is a short vertical line, corresponds to a gene. Branches of the dendrogram group together densely interconnected constitute modules and are labeled with different colors. (C) Correlation relationship of physiological indicators with different modules. The x-axis represents sugar-metabolizing enzyme activities and carbohydrate contents; the y-axis represents the name of each module. The correlation coefficient and p-values are presented in each cell, and the color of each cell indicates the correlation coefficient between the module and the physiological indicator.
Horticulturae 11 00813 g005
Disclaimer/Publisher’s Note: The statements, opinions and data contained in all publications are solely those of the individual author(s) and contributor(s) and not of MDPI and/or the editor(s). MDPI and/or the editor(s) disclaim responsibility for any injury to people or property resulting from any ideas, methods, instructions or products referred to in the content.

