
The Effects of Nutrient Solution Concentration and Preharvest Short-Duration Continuous Light on Yield, Quality, and Energy Efficiency in Aeroponic Intercropped Lettuce

 , ,
, ,
Abstract
1. Introduction
- As a non-exhaustive experimental framework, the orthogonal design’s exclusion of NS adjustments without 48 h-PSCL obstructs the systematic evaluation of lighting-driven energy expenditures in sustainable aeroponic systems.
- The lack of attention to the formation processes of yield and quality prevents the provision of critical information for studying intercropping regulation mechanisms, such as identifying key regulation periods, which, in turn, determine sampling time points.
- Although NS adjustments and 48 h-PSCL exhibit synergistic effects in enhancing lettuce yield, the coexistence of fertilizer conservation and electricity consumption makes the changes in production costs per unit yield more complex, necessitating a comprehensive evaluation to determine management modes that are more advantageous for sustainability.
2. Materials and Methods
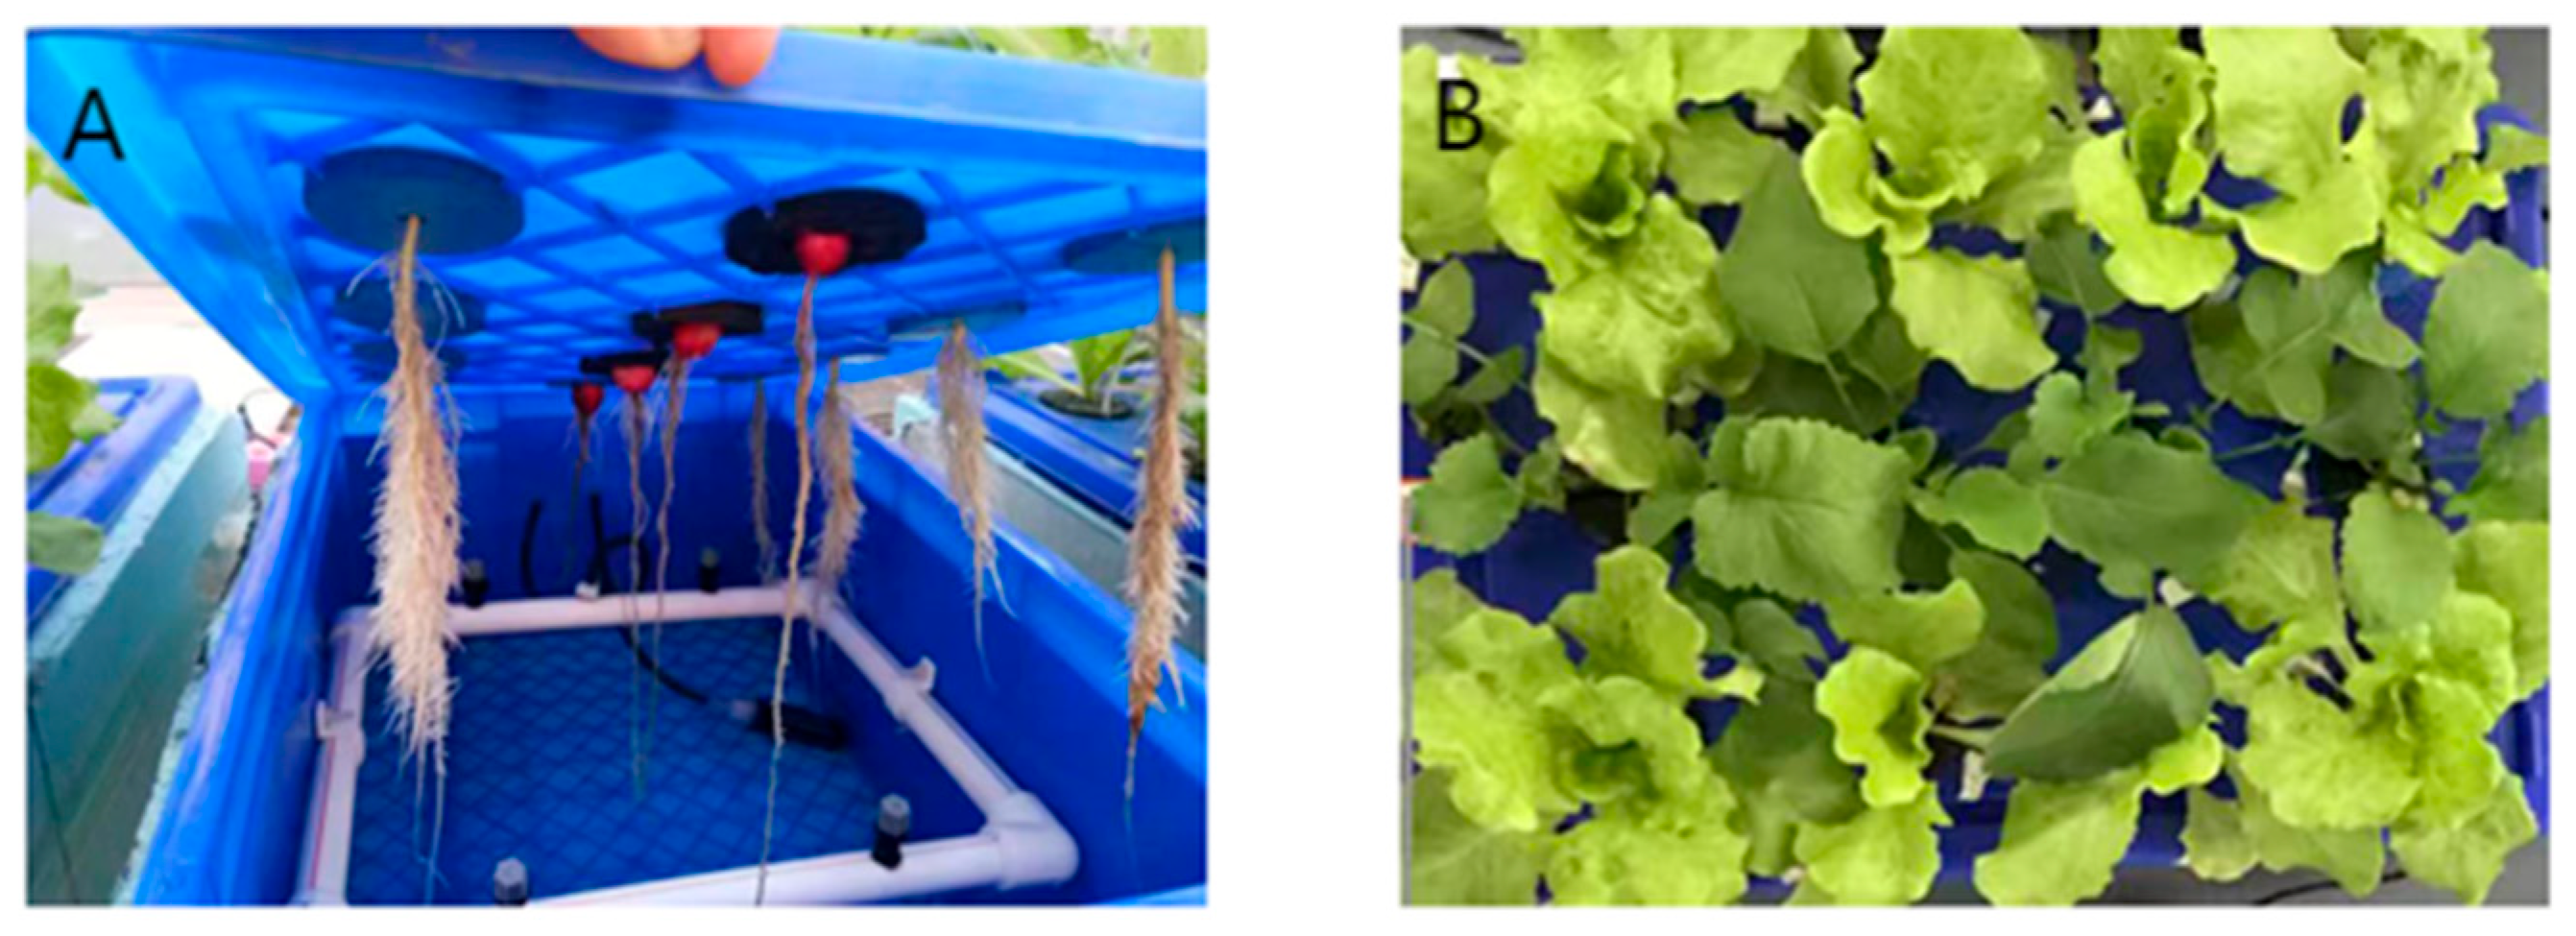
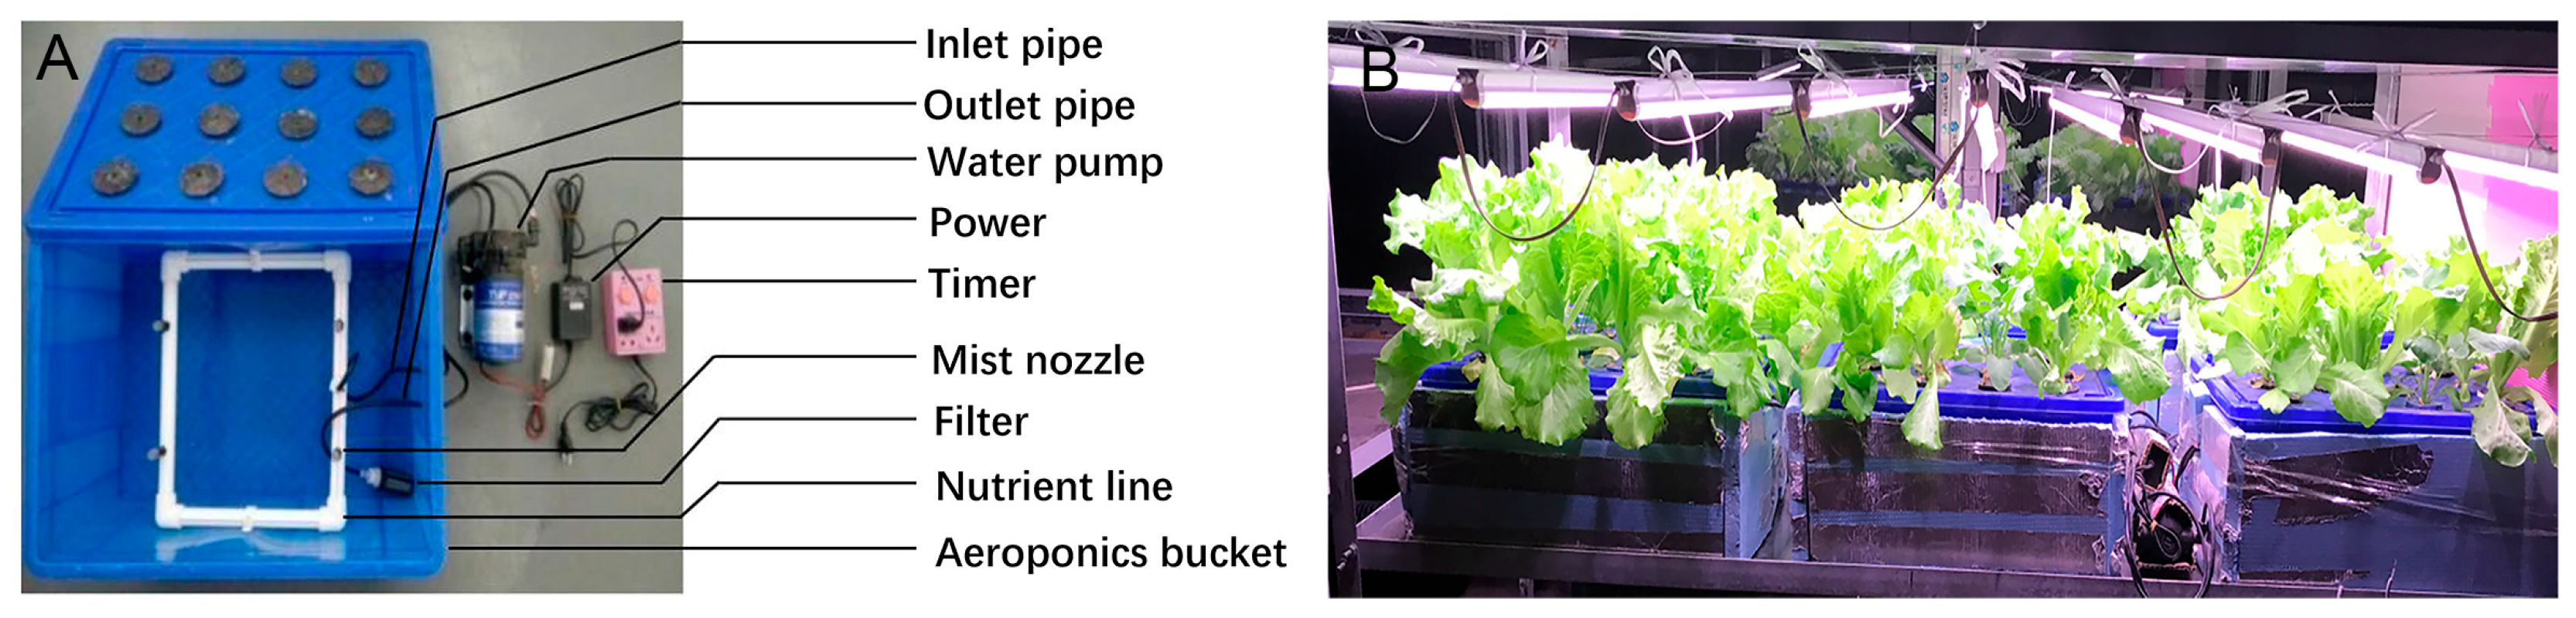
2.1. Experimental Conditions and Plant Materials
2.2. Experimental Treatment
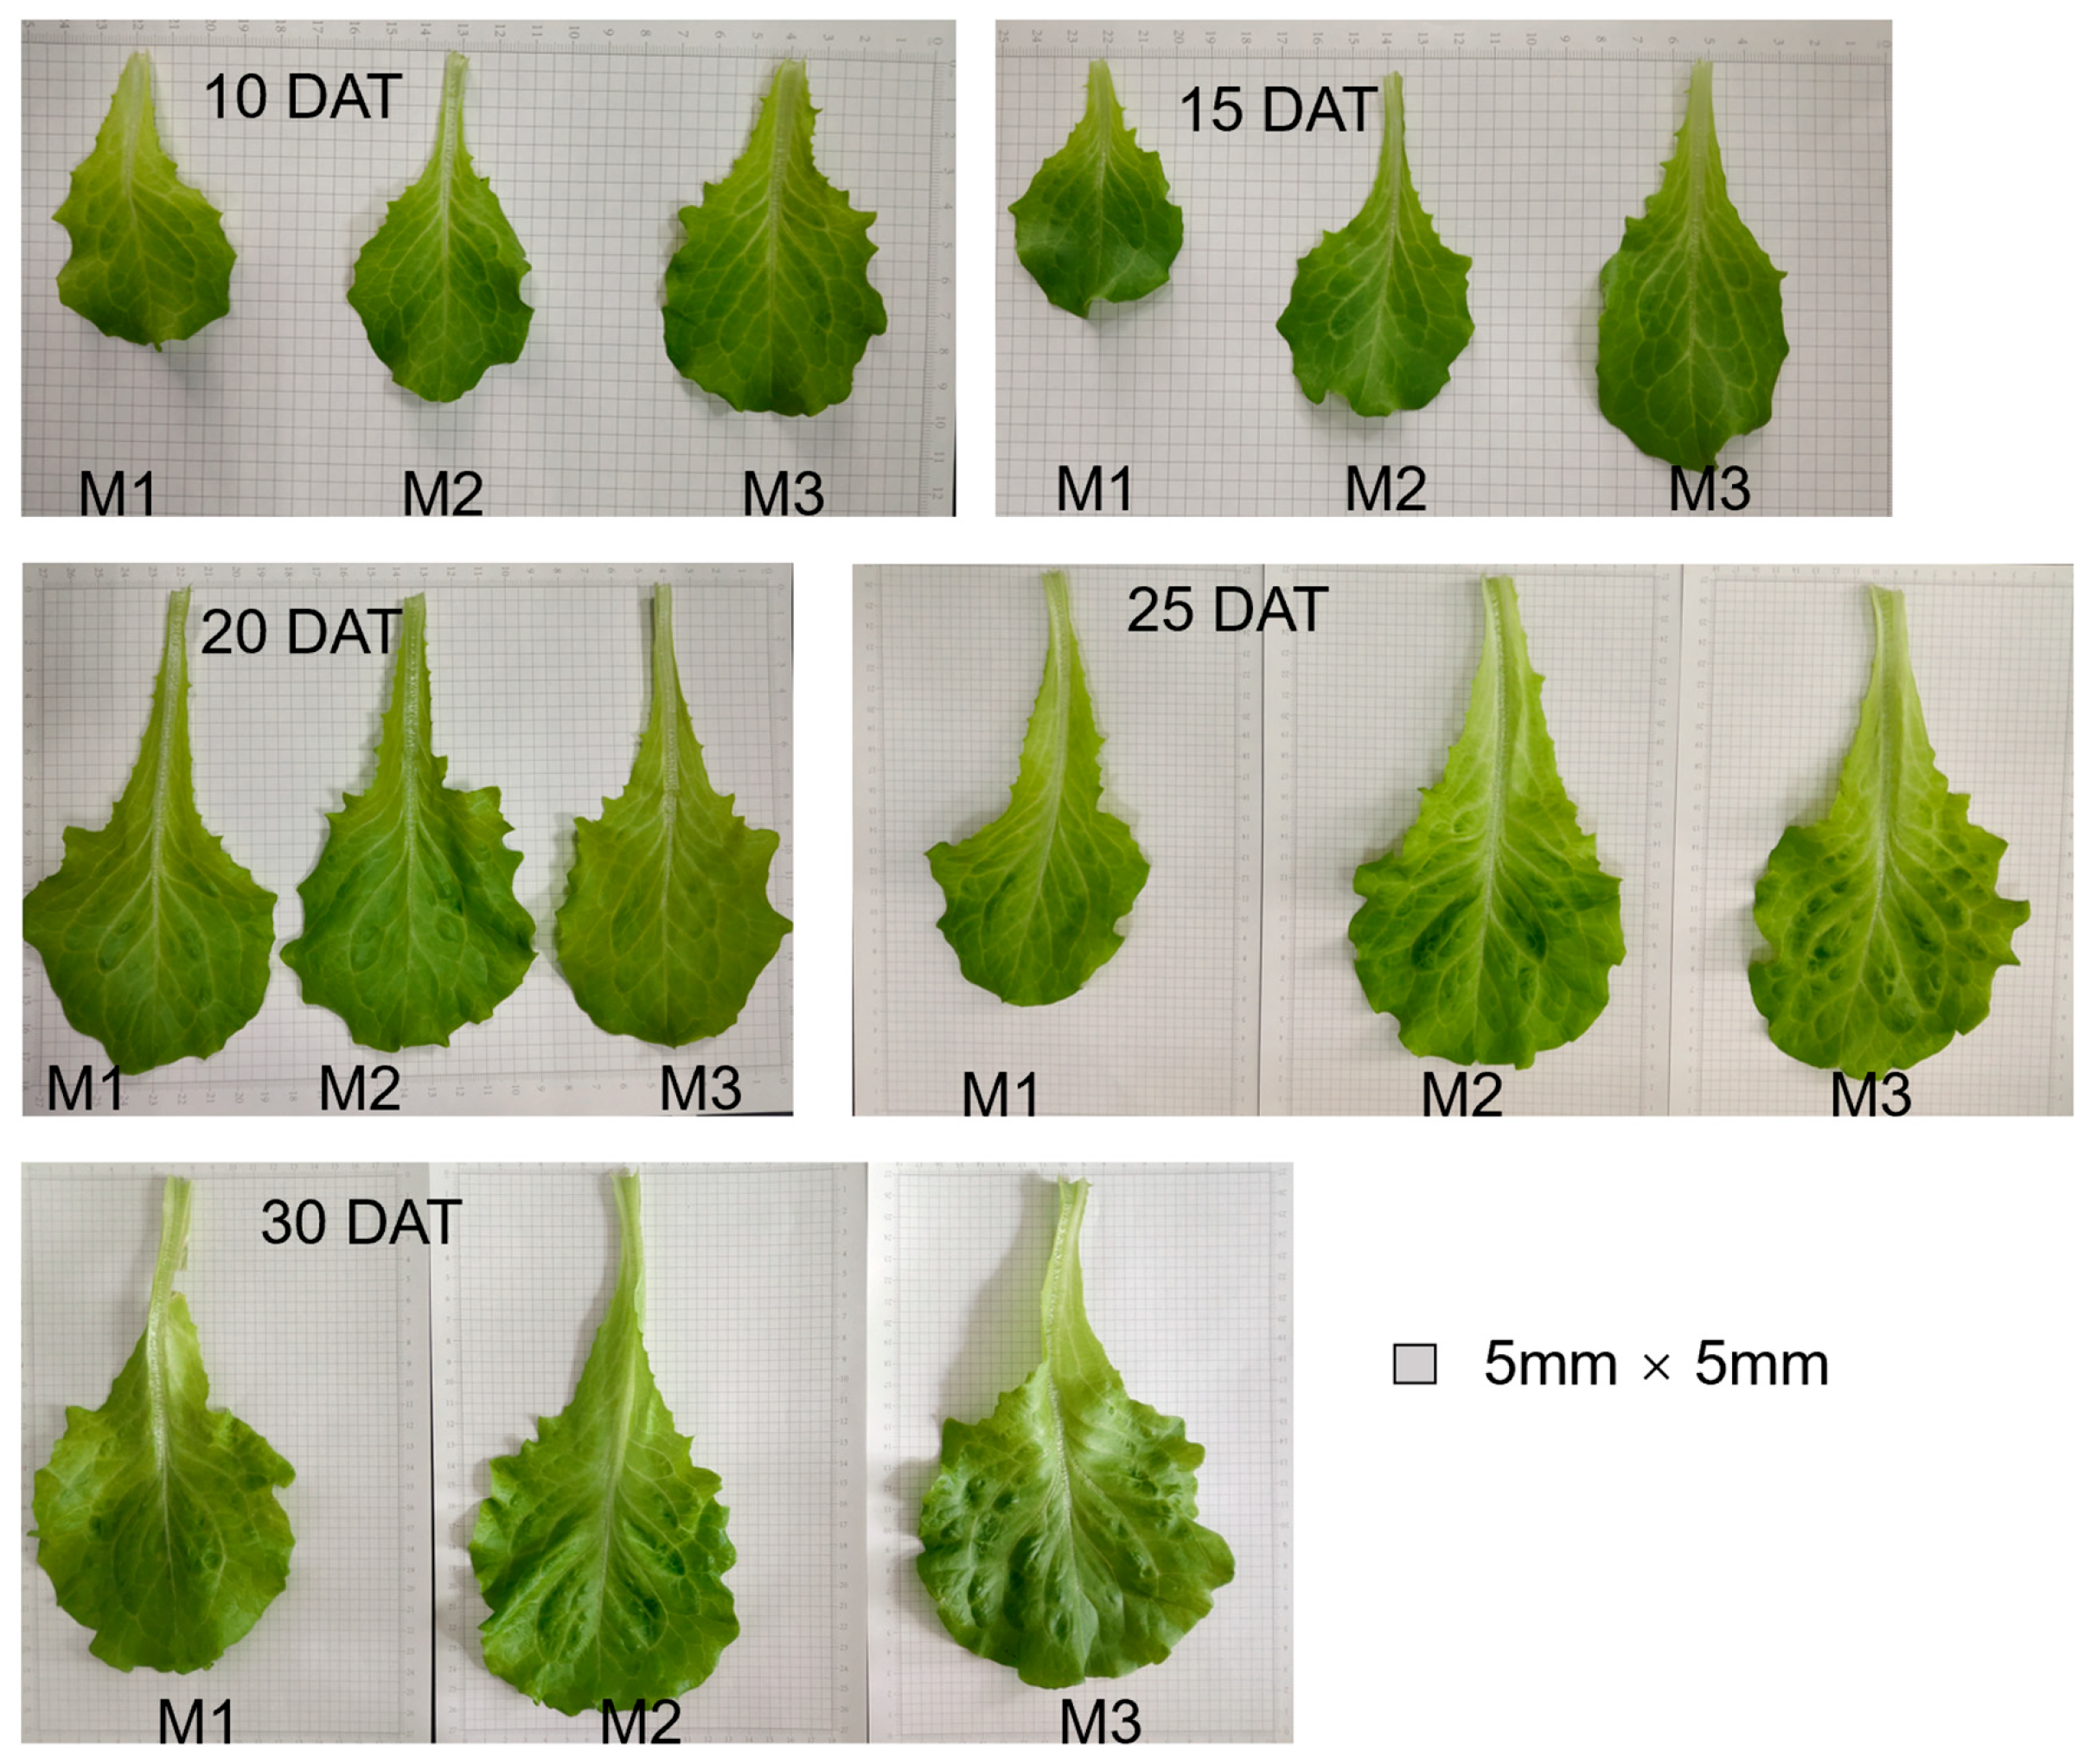
- Treatment M1 (Control): A conventional management mode with a constant NS concentration (1× concentration) across all growth stages without performing additional PSCL.
- Treatment M2: A mode with a variable NS concentration (1/2×, 1×, and 1/2× concentrations for Stages 1–3) optimized through prior trials [19].
- Treatment M3: A mode combining a variable NS concentration (identical to M2) with 48 h-PSCL.
2.3. Sampling and Analytical Methods
2.3.1. Growth and Yield Parameters
2.3.2. SPAD, Photosynthesis Gas Exchange, and Chlorophyll a Fluorescence (CF) Parameters
2.3.3. Quality and Nutrient Parameters
2.3.4. Cost–Benefit Analysis
2.4. Statistical Analysis
3. Results
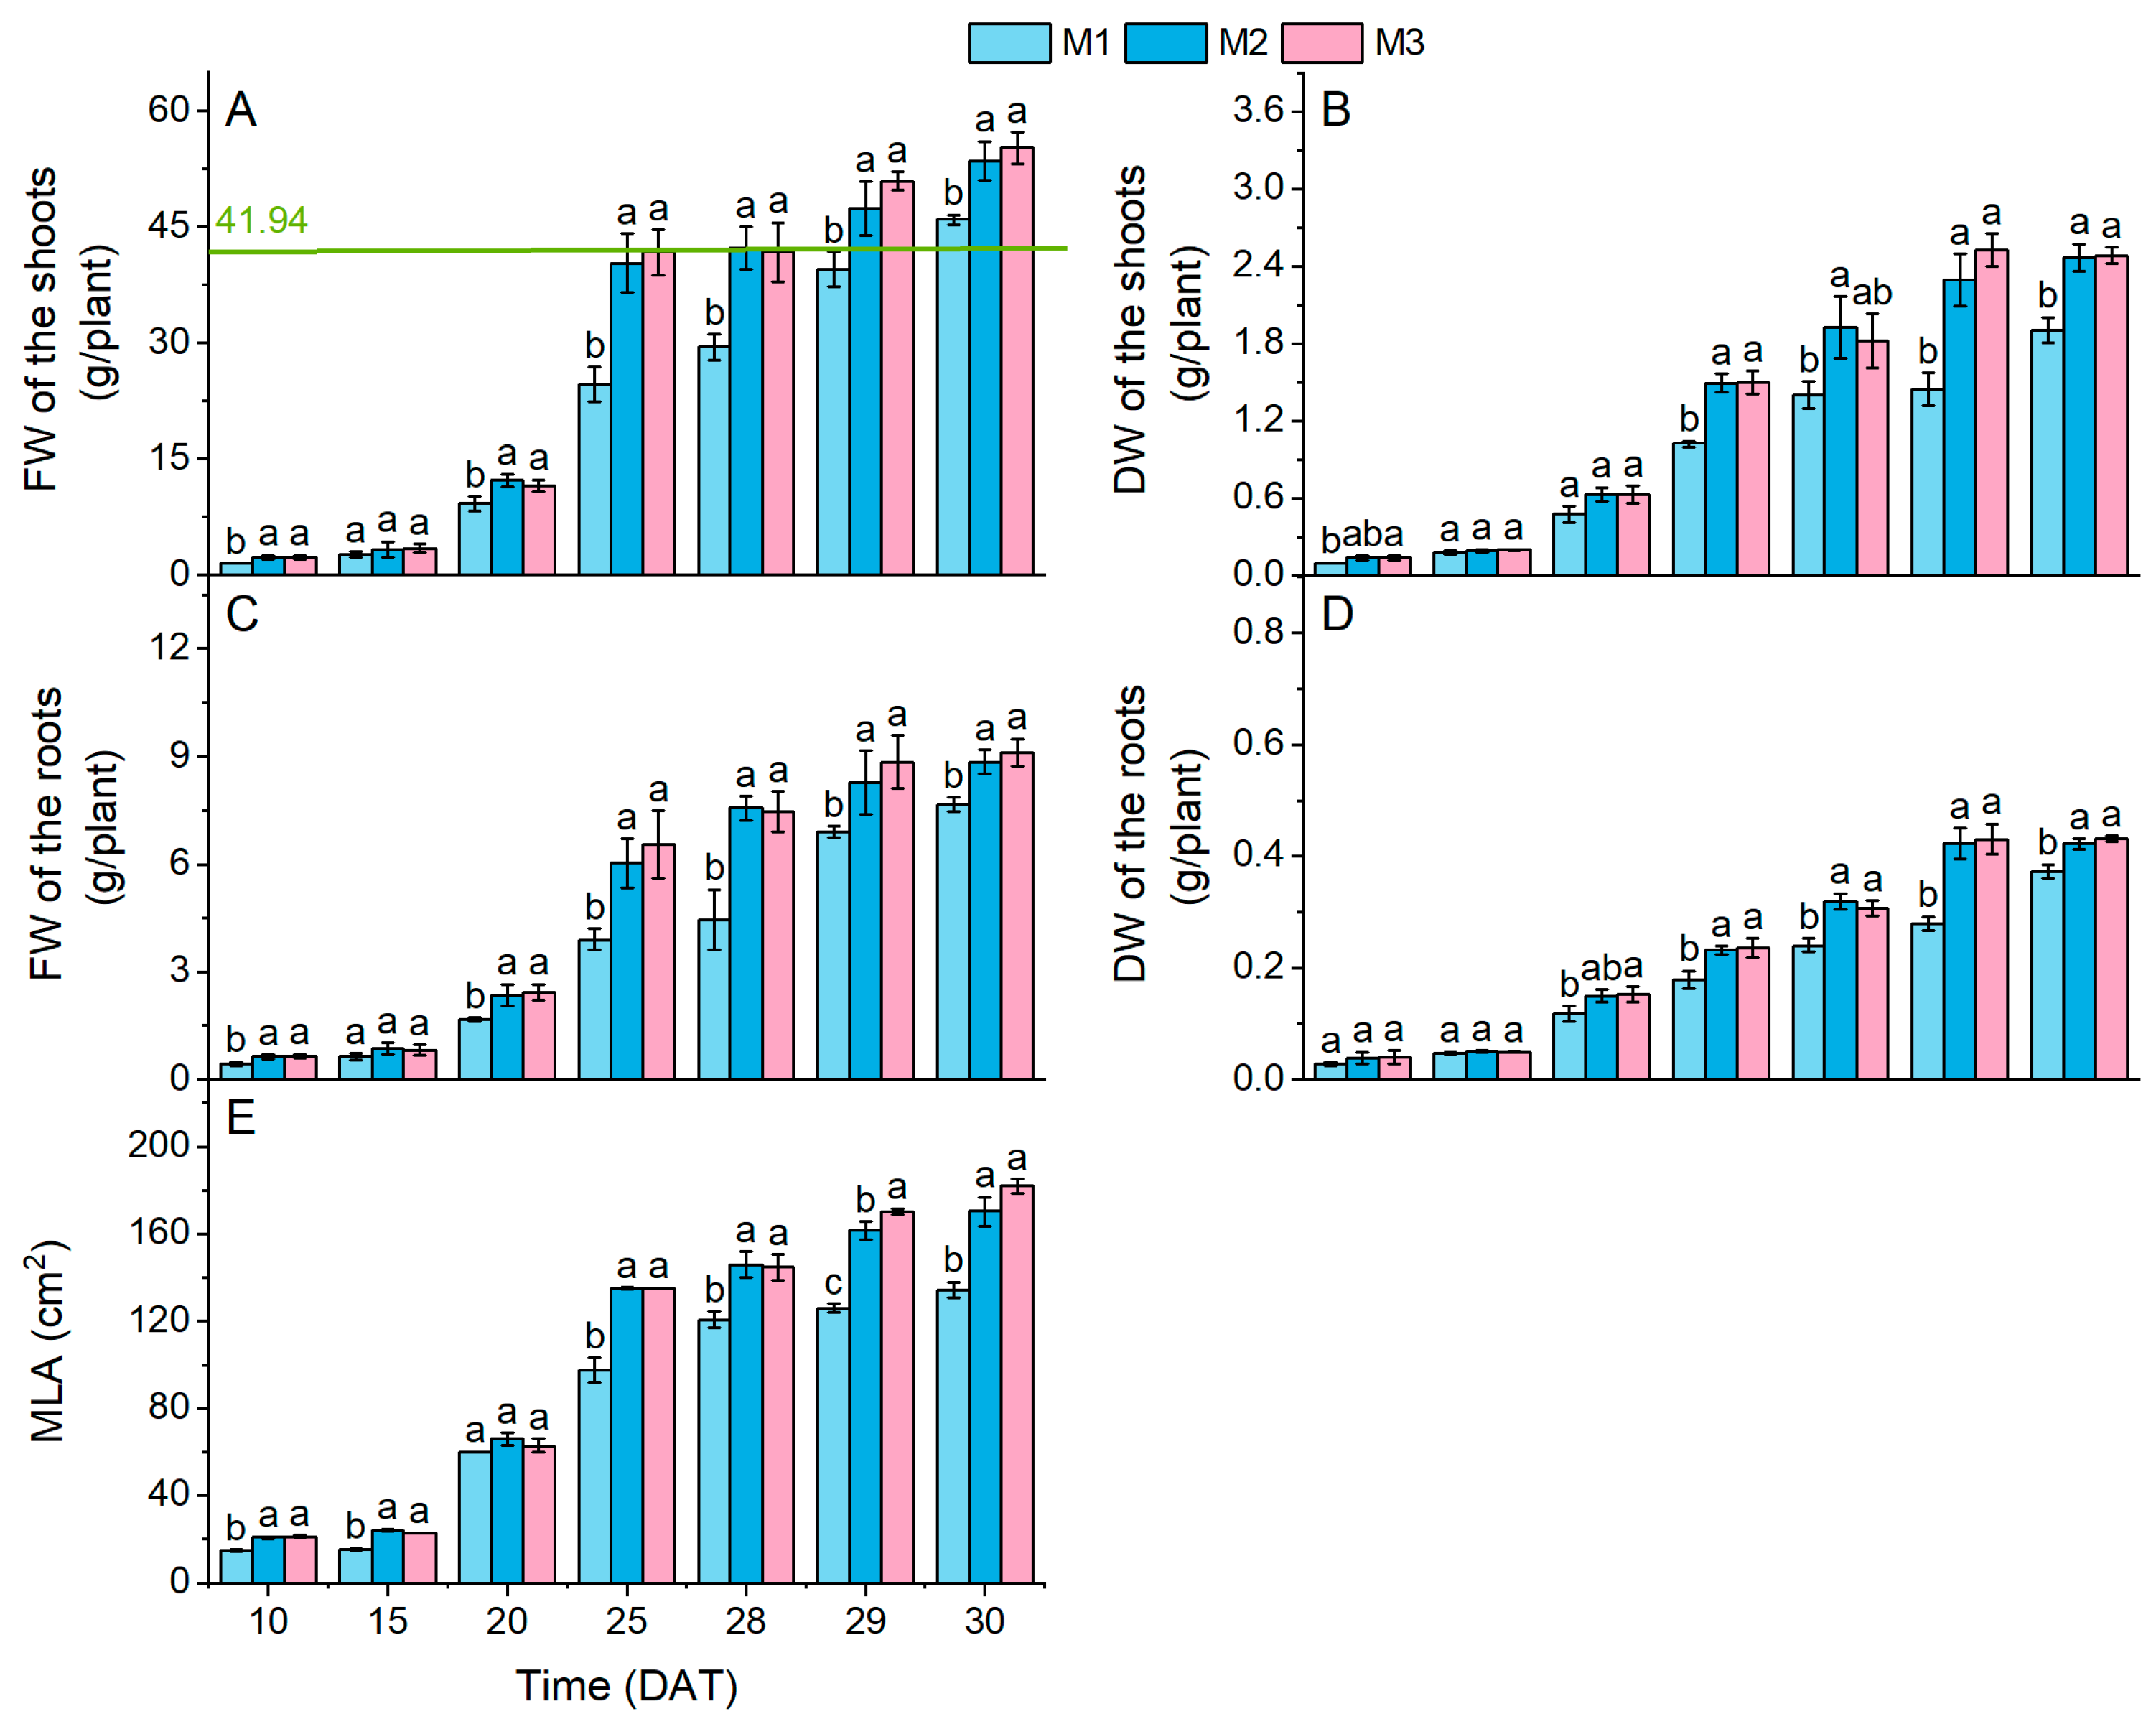
3.1. Growth and Yield
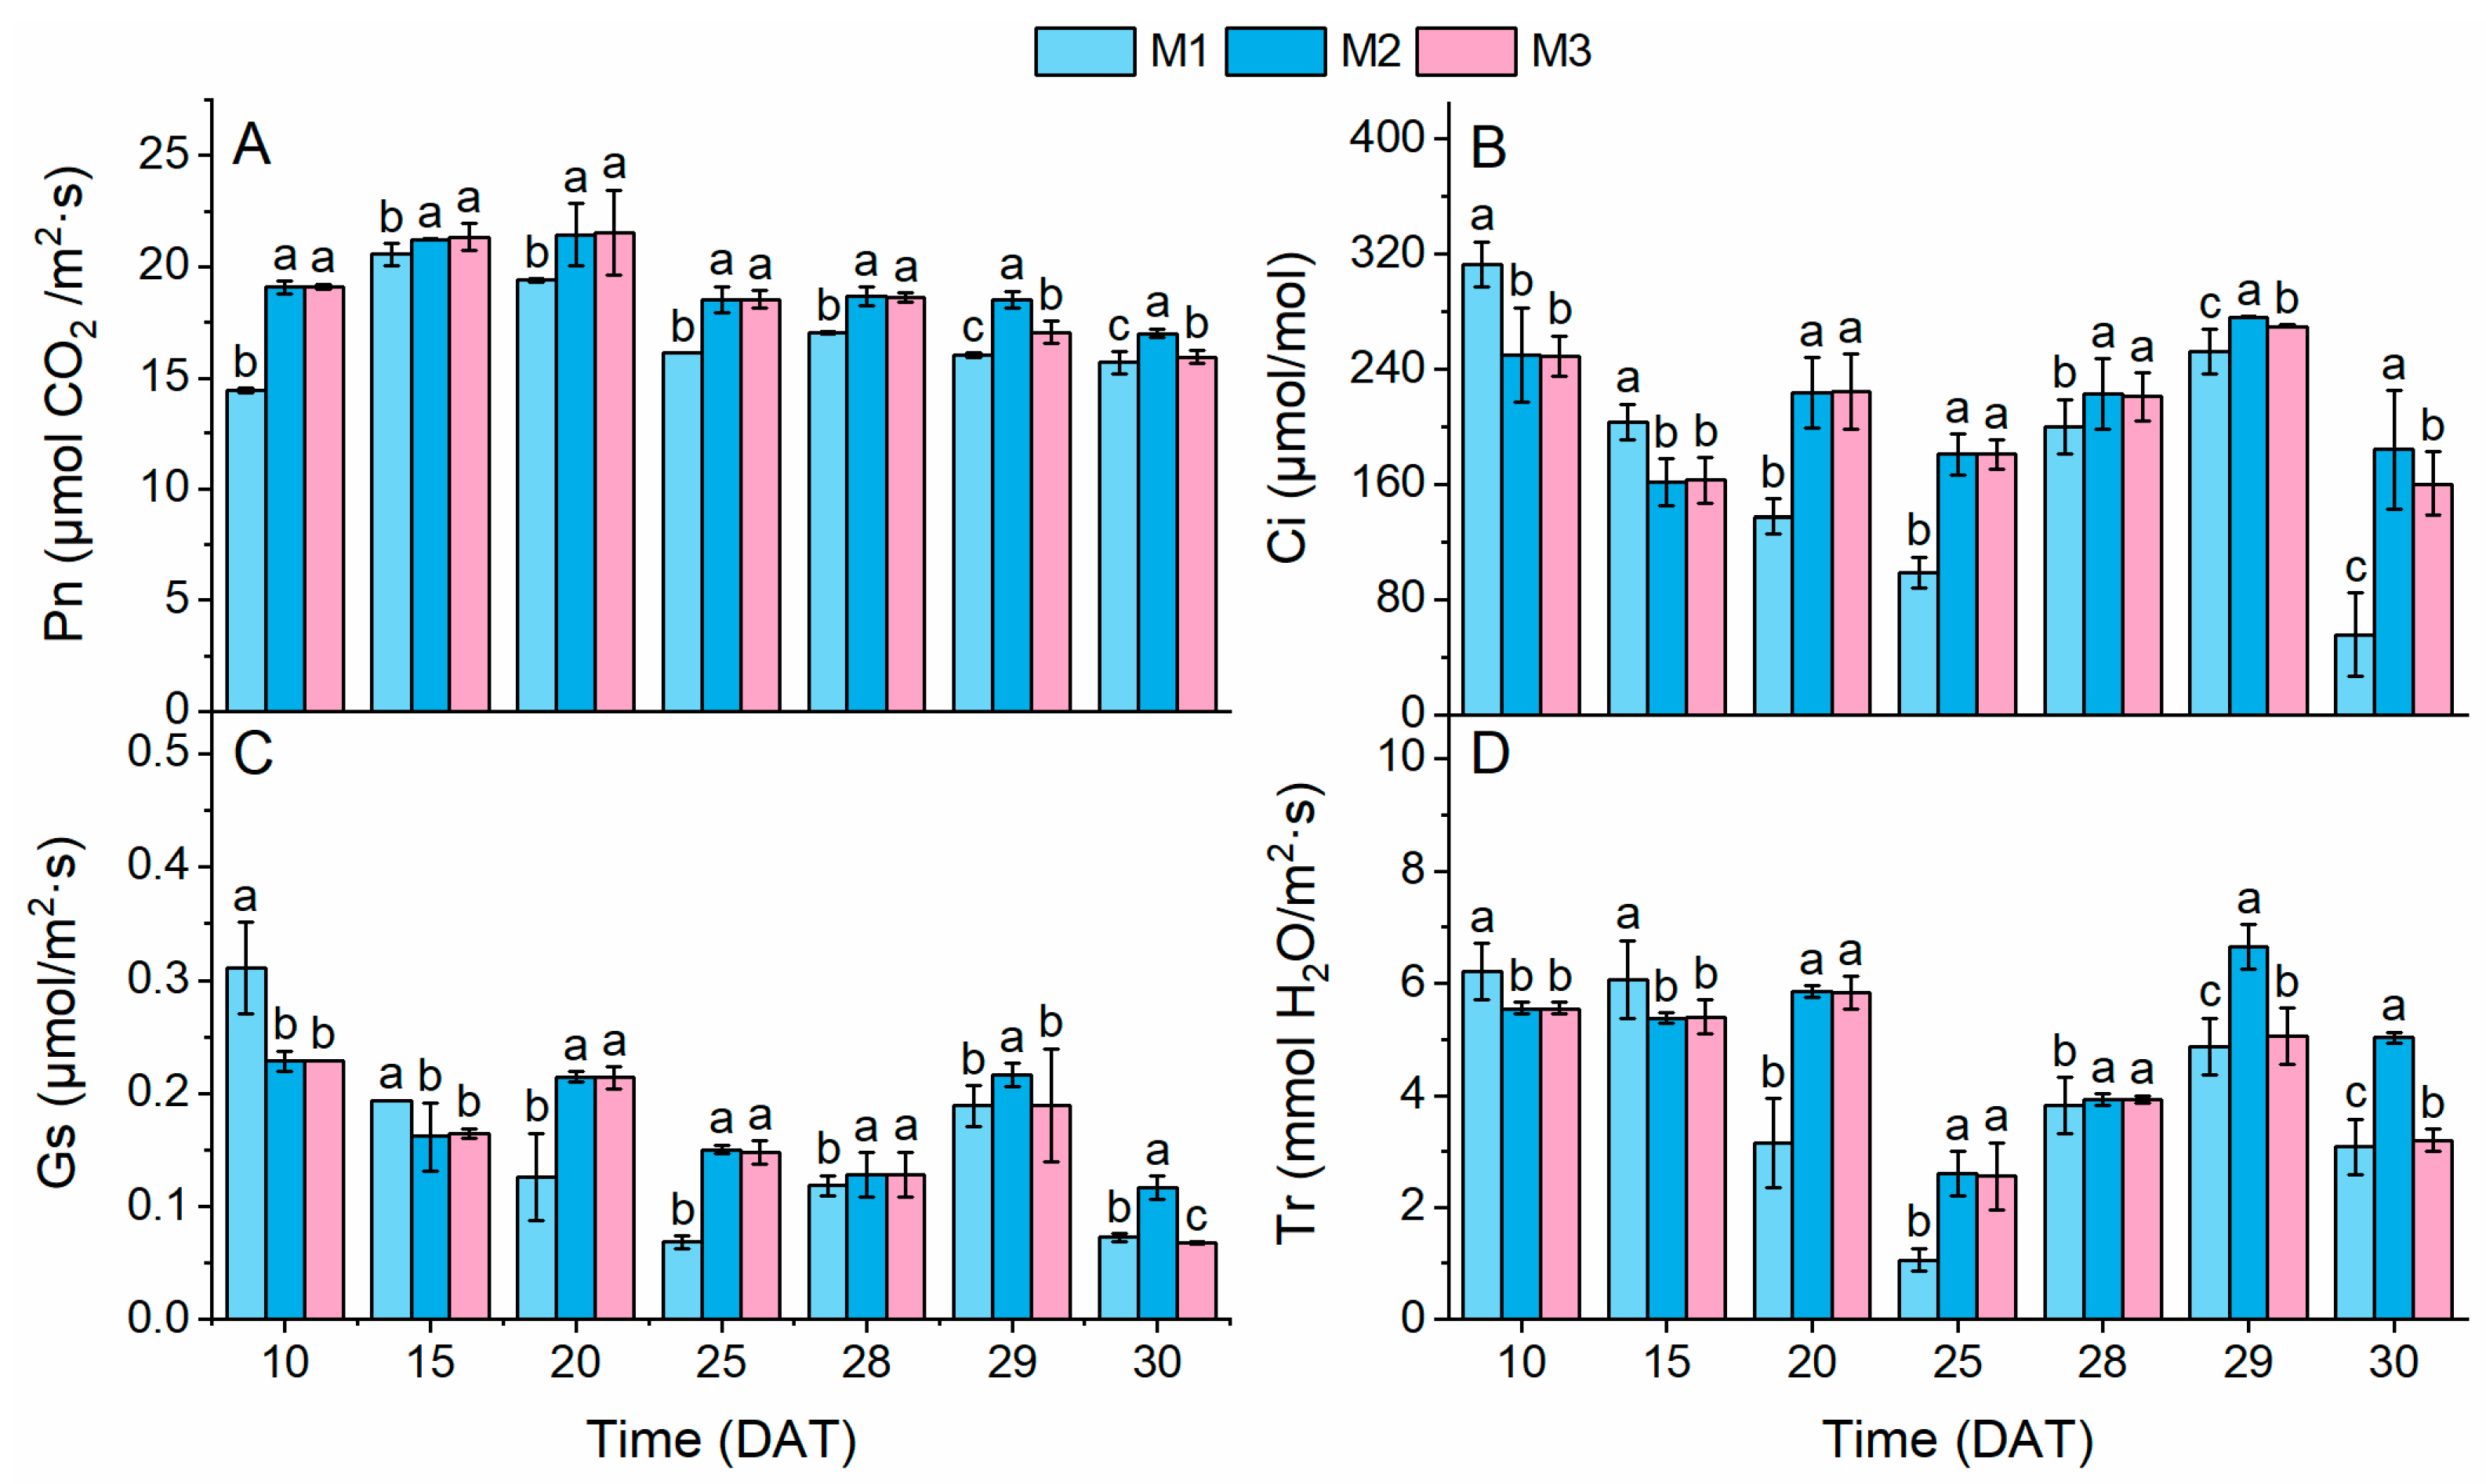
3.2. Photosynthetic Performance
3.3. Relative Chlorophyll Content (SPAD)
3.4. Chlorophyll a Fluorescence
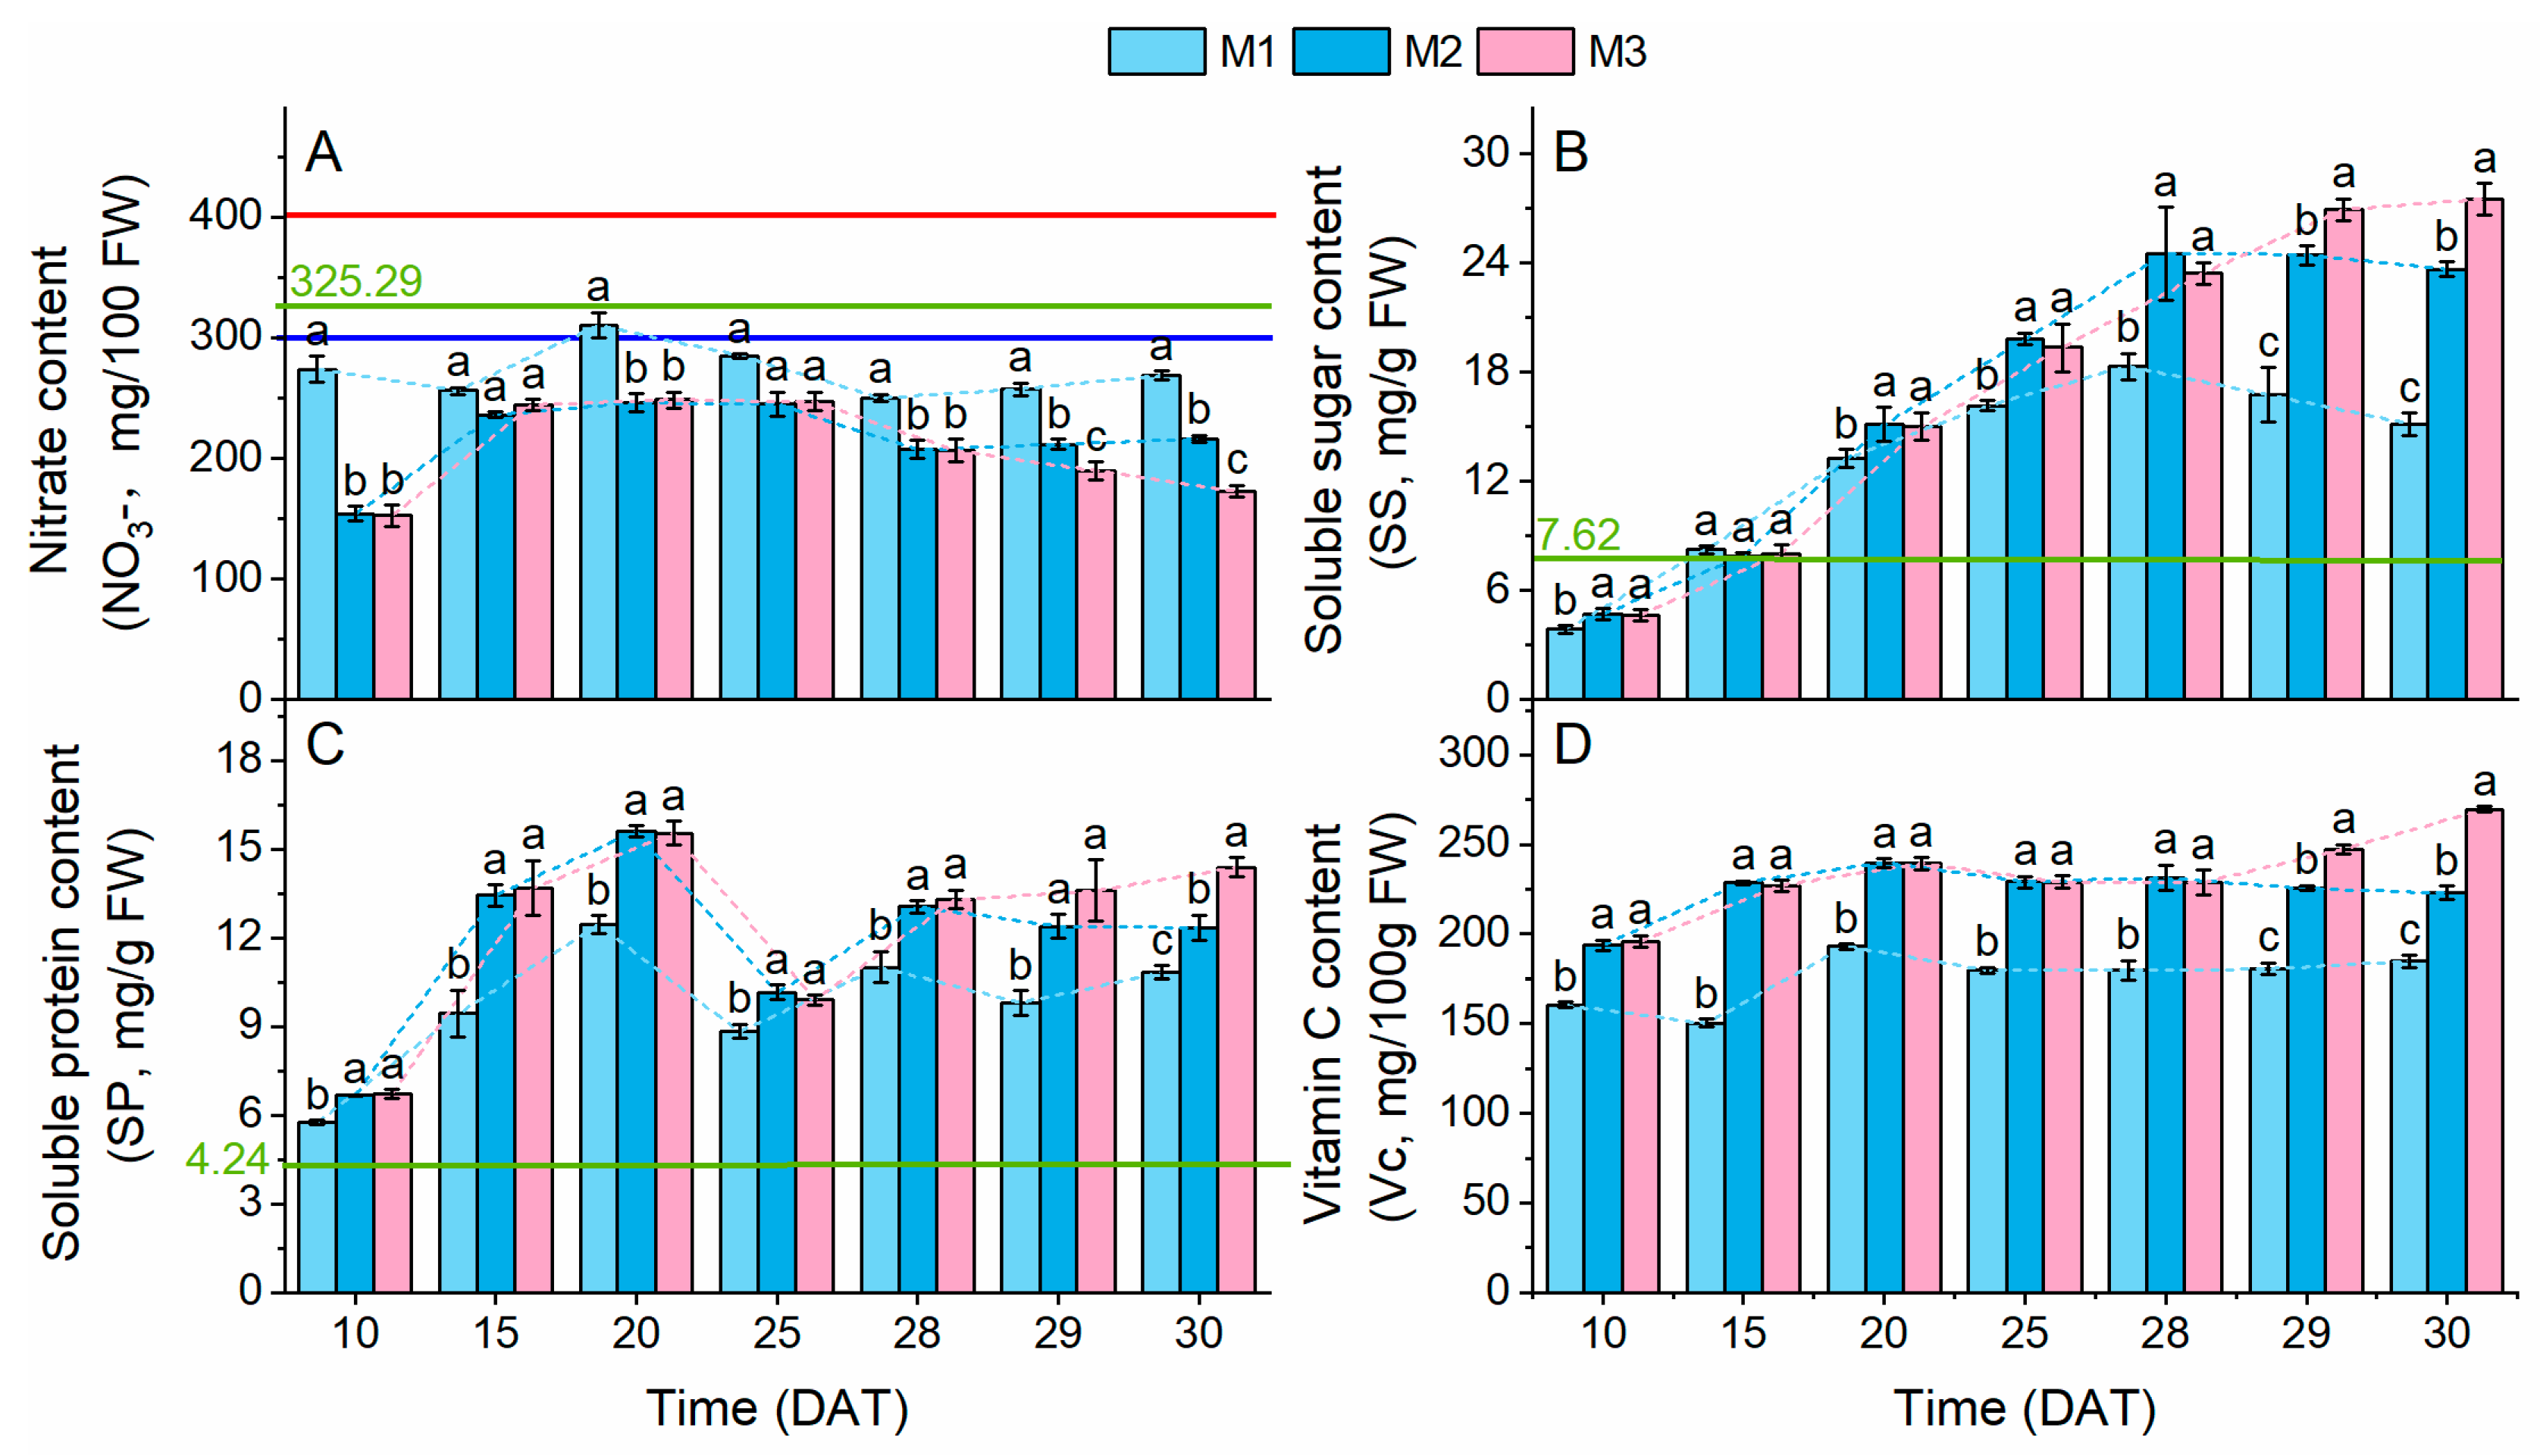
3.5. Quality Attributes and Nutrient Content
3.6. Resource and Energy Consumption from Management Modes
4. Discussion
5. Conclusions
Author Contributions
Funding
Data Availability Statement
Acknowledgments
Conflicts of Interest
Appendix A
Appendix A.1

| Element | Concentration/(mg/L) | |
|---|---|---|
| 1× Concentration (1 C) | 1/2× Concentration (1/2 C) | |
| N | 242.875 | 121.437 |
| P | 41.193 | 20.596 |
| K | 312.877 | 156.439 |
| Ca | 160.395 | 80.197 |
| Mg | 48.626 | 24.313 |
| S | 64.489 | 32.244 |
| Fe | 3.183 | 1.592 |
| Mn | 0.525 | 0.262 |
| B | 0.500 | 0.250 |
| Zn | 0.050 | 0.025 |
| Cu | 0.020 | 0.010 |
| Mo | 0.011 | 0.005 |
Appendix A.2
| Treatment | M1 | M2 | M3 |
|---|---|---|---|
| Radish bulb | 8.39 ± 1.34 b | 11.95 ± 1.11 a | 13.21 ± 1.25 a |
Appendix A.3
| Plant | Shoot FW (g/Plant) | NO3− (mg/100g FW) | SS (mg/g FW) | SP (mg/g FW) |
|---|---|---|---|---|
| Sole-cropped lettuce | 41.94 ± 3.72 | 325.29 ± 26.81 | 7.62 ± 1.31 | 4.24 ± 0.37 |
Appendix B
Appendix B.1
Appendix B.2
References
- Oyinlola, L.A.; Obadina, A.O.; Omemu, A.M.; Oyewole, O.B. Prevention of microbial hazard on fresh-cut lettuce through adoption of food safety and hygienic practices by lettuce farmers. Food Sci. Nutr. 2017, 5, 67–75. [Google Scholar] [CrossRef] [PubMed]
- Food and Agriculture Organization of United Nations. Available online: https://www.fao.org/faostat/en/#data/QCL (accessed on 22 April 2025).
- General Administration of Customs of the People’s Republic of China. Available online: http://stats.customs.gov.cn/ (accessed on 27 April 2025).
- Zrig, A.; Alsherif, E.A.; Aloufi, A.S.; Korany, S.M.; Selim, S.; Almuhayawi, M.S.; Tarabulsi, M.K.; Nhs, M.; Albasri, H.M.; Bouqellah, N.A. The biomass and health-enhancing qualities of lettuce are amplified through the inoculation of arbuscular mycorrhizal fungi. BMC Plant Biol. 2025, 25, 521. [Google Scholar] [CrossRef]
- Mazahar, S.; Umar, S.; Iqbal, M. Genotypic variability of nitrate-accumulating leafy vegetables as affected by nitrogen doses: Morpho-physiological and biochemical approach. Discov. Plants 2025, 2, 122. [Google Scholar] [CrossRef]
- Tei, F.; Neve, S.D.; Haan, J.; Kristensen, H.L. Nitrogen management of vegetable crops. Agric. Water Manag. 2020, 240, 106316. [Google Scholar] [CrossRef]
- Savvas, D.; Gruda, N. Application of soilless culture technologies in the modern greenhouse industry—A review. Eur. J. Hortic. Sci. 2018, 83, 280–293. [Google Scholar] [CrossRef]
- Chen, P.; Zhu, G.; Kim, H.; Brown, P.B.; Huang, J. Comparative life cycle assessment of aquaponics and hydroponics in the Midwestern United States. J. Clean. Prod. 2020, 275, 122888. [Google Scholar] [CrossRef]
- Velazquez-Gonzalez, R.S.; Garcia-Garcia, A.L.; Ventura-Zapata, E.; Barceinas-Sanchez, J.D.O.; Sosa-Savedra, J.C. A review on hydroponics and the technologies associated for medium- and small-scale operations. Agronomy 2022, 12, 646. [Google Scholar] [CrossRef]
- Gonnella, M.; Renna, M. The evolution of soilless systems towards ecological sustainability in the perspective of a circular economy. Is it really the opposite of organic agriculture? Agronomy 2021, 11, 950. [Google Scholar] [CrossRef]
- Colla, G.; Rouphael, Y.; Fallovo, C.; Cardarelli, M.; Graifenberg, A. Use of Salsola soda as a companion plant to improve greenhouse pepper (Capsicum annuum) performance under saline conditions. N. Z. J. Crop Hortic. Sci. 2006, 34, 283–290. [Google Scholar] [CrossRef]
- Li, C.; Hoffland, E.; Kuyper, T.W.; Yu, Y.; Zhang, C.; Li, H.; Zhang, F.; Van der Werf, W. Syndromes of production in intercropping impact yield gains. Nat. Plants 2020, 6, 653–660. [Google Scholar] [CrossRef]
- Wang, L.L.; Yu, H.Y.; Zhang, L.; Tian, D.X.; Zhang, Y.Q.; Zhao, G. Evaluation of intercropping pattern based on Niche-fitness model and TOPSIS model. Trans. CSAM 2017, 4, 291–297. [Google Scholar] [CrossRef]
- Wang, L.L.; Yu, H.Y.; Zhang, L.; Yao, N.N.; Lu, X.L.; Zhao, H.X.; Fu, Q.; Sui, Y.Y. Soilless Cultivation of Lettuce Leaves for Nitrate Reduction. China Patent No. 201510125427.9, 4 January 2017. [Google Scholar]
- Yu, H.; Wang, L.; Zhang, L.; Liu, S.; Zhang, Y. Effects of intercropping on growth and nitrate accumulation of lettuce in aeroponics. Trans. Chin. Soc. Agric. Eng. 2017, 33, 228–234. [Google Scholar] [CrossRef]
- Kang, Z.; Jiang, Z.; Liu, Z.; Wang, P.; Zhang, C.; Yuan, M.; Bai, M.; Hu, X. Optimal combination of substrate supply amount coupled with nutrient solution management program for cucumber planting. Hortic. Plant J. 2024, in press. [CrossRef]
- Papadimitriou, D.M.; Daliakopoulos, I.N.; Lydakis-Simantiris, N.; Cheiladaki, I.; Manios, T.; Savvas, D. Nitrogen source and supply level impact water uptake, yield, and nutrient status of golden thistle in a soilless culture. Sci. Hortic. 2024, 336, 113384. [Google Scholar] [CrossRef]
- An, X.; Liu, S.; He, C.; Yang, R.; Guo, B.; Li, X.; Chen, C.; Wang, H. Nutrient dynamics during the growth period of Epimedium pubescens and its impact on growth and Icar-iin-Flavonoids composition. Ind. Crops Prod. 2025, 225, 120520. [Google Scholar] [CrossRef]
- Zhang, L.; Li, F.Q.W.; Yao, L.J.; Xiao, F.; Yu, H.Y. Optimization of management modes for intercropping aeroponics of lettuce and cherry radish. Trans. Chin. Soc. Agric. Mach. 2020, 51, 337–343. [Google Scholar] [CrossRef]
- Zhang, L.; Wang, L.; Li, F.; Xiao, F.; Yu, H. Effect of divalent manganese (Mn 2+) concentration on the growth and nitrate nitrogen content of lettuce during aeroponic intercropping with cherry radish. Hortic. Environ. Biotechnol. 2021, 62, 243–251. [Google Scholar] [CrossRef]
- Cataldo, D.A.; Haroon, M.; Schrader, L.E.; Youngs, V.L. Rapid colorimetric determination of nitrate in plant tissue by nitration of salicylic acid. Commun. Soil Sci. Plant Anal. 1975, 6, 71–80. [Google Scholar] [CrossRef]
- Leng, F.F.; Sun, S.; Jing, Y.; Wang, F.; Wei, Q.; Wang, X.; Zhu, X.L. A rapid and sensitive method for determination of trace amounts of glucose by anthrone-sulfuric acid method. Bulg. Chem. Commun 2016, 48, 109–113. [Google Scholar]
- Bradford, M.M. A rapid and sensitive method for the quantitation of microgram quantities of protein utilizing the principle of protein-dye binding. Anal. Biochem. 1976, 72, 248–254. [Google Scholar] [CrossRef]
- Colla, G.; Kim, H.J.; Kyriacou, M.C.; Rouphael, Y. Nitrate in fruits and vegetables. Sci. Hortic. 2018, 237, 221–238. [Google Scholar] [CrossRef]
- Ministry of Health of the People’s Republic of China. GB 19338-2003; Maximum Levels of Nitrate and Nitrite in Foods. Standardization Administration of China: Beijing, China, 2003.
- Cho, Y.Y.; Cha, M.K.; Ku, Y.G.; Kim, H.C.; Bae, J.H. Effect of different culture nutrient solution EC on carrot top growth and nutritional contents in a closed-type plant factory system. Hortic. Sci. Technol. 2018, 36, 37–45. [Google Scholar] [CrossRef]
- Martínez-Moreno, A.; Carmona, J.; Martínez, V.; Garcia-Sánchez, F.; Mestre, T.C.; Navarro-Pérez, V.; Cámara-Zapata, J.M. Reducing nitrate accumulation through the management of nutrient solution in a floating system lettuce (Lactuca sativa, L.). Sci. Hortic. 2024, 336, 113377. [Google Scholar] [CrossRef]
- Murakami, K.; Yamamoto, T.; Fujimoto, K.; Okabe, K.; Masuda, M.; Abe, T.; Maeda, K. Low-pungent sweet pepper selected under continuous fluorescent illumination. In Proceedings of the VI International Symposium on Light in Horticulture, Tsukuba, Japan, 15 November 2009; Volume 907, pp. 243–246. [Google Scholar] [CrossRef]
- Zha, L.; Zhang, Y.; Liu, W. Dynamic responses of ascorbate pool and metabolism in lettuce to long-term continuous light provided by red and blue LEDs. Environ. Exp. Bot. 2019, 163, 15–23. [Google Scholar] [CrossRef]
- Liu, J.Y.; Zhang, Y.B.; Liu, W.K. Effects of preharvest red and blue continuous light intensity on growth, quality and AsA metabolism of hydroponics lettuce. J. Agric. Sci. Technol. 2022, 24, 76–84. [Google Scholar] [CrossRef]
- Zhang, X.H.; Xia, J.H.; Chen, Z.R.; Zhu, J.X.; Wang, H. A nutrient optimization method for hydroponic lettuce based on multi-strategy improved grey wolf optimizer algorithm. Comput. Electron. Agric. 2024, 224, 109167. [Google Scholar] [CrossRef]
- Shen, W.; Zhang, W.; Li, J.; Huang, Z.; Tao, Y.; Hong, J.; Zhou, Y. Pre-harvest short-term continuous LED lighting improves the nutritional quality and flavor of hydroponic purple-leaf lettuce. Sci. Hortic. 2024, 334, 113304. [Google Scholar] [CrossRef]
- Yang, X.; Hu, J.; Wang, Z.; Huang, T.; Ang, Y.; Zhang, L.; Yang, Q. Pre-harvest nitrogen limitation and continuous lighting improve the quality and flavor of lettuce (Lactuca sativa L.) under hydroponic conditions in greenhouse. J. Agric. Food Chem. 2022, 71, 710–720. [Google Scholar] [CrossRef]
- Zhang, Y.; Zha, L.; Liu, W.; Zhou, C.; Shao, M.; Yang, Q. LED light quality of continuous light before harvest affects growth and AsA metabolism of hydroponic lettuce grown under increasing doses of nitrogen. Plants 2021, 10, 176. [Google Scholar] [CrossRef]
- Fang, S.L.; Hu, X.T.; Wang, W.; Li, X.J.; Yang, X.; Wang, R. Effects of light intensity and nutrient solution concentration on yield and quality of hydroponic lettuce. Northern Hortic. 2017, 214, 97–102. [Google Scholar] [CrossRef]
- Lin, Y.; Zhang, J.; Gao, W.; Chen, Y.; Li, H.; Lawlor, D.W.; Paul, M.J.; Pan, W. Exogenous trehalose improves growth un-der limiting nitrogen through upregulation of nitrogen metabolism. BMC Plant Biol. 2017, 17, 247. [Google Scholar] [CrossRef] [PubMed]
- Ahmed, H.A.; Yu-Xin, T.; Qi-Chang, Y. Optimal control of environmental conditions affecting lettuce plant growth in a controlled environment with artificial lighting: A review. S. Afr. J. Bot. 2020, 130, 75–89. [Google Scholar] [CrossRef]
- Guidi, L.; Lo Piccolo, E.; Landi, M. Chlorophyll fluorescence, photoinhibition and abiotic stress: Does it make any difference the fact to be a C3 or C4 species? Front. Plant Sci. 2019, 10, 174. [Google Scholar] [CrossRef]
- Ye, Z.P.; Hu, W.H.; Yan, X.H. Comparison on light-response models of actual photochemical efficiency in photosystem II. Chin. J. Plant Ecol. 2016, 40, 1208. [Google Scholar] [CrossRef]
- AbdElgawad, H.; Avramova, V.; Baggerman, G.; Van Raemdonck, G.; Valkenborg, D.; Van Ostade, X.; Guisez, Y.; Prinsen, E.; Asard, H.; Ende, W.V.; et al. Starch biosynthesis contributes to the maintenance of photosynthesis and leaf growth under drought stress in maize. Plant Cell Environ. 2020, 43, 2254–2271. [Google Scholar] [CrossRef]
- Ates, F.; Kaya, O. The relationship between iron and nitrogen concentrations based on Kjeldahl method and SPAD-502 readings in grapevine (Vitis vinifera L. cv. ‘Sultana Seedless’). Erwerbs-Obstbau 2021, 63 (Suppl. S1), 53–59. [Google Scholar] [CrossRef]
- Xu, J.P.; Yu, Y.C.; Zhang, T.; Ma, Q.; Yang, H.B. Effects of ozone water irrigation and spraying on physiological characteristics and gene expression of tomato seedlings. Horticult. Res. 2021, 8, 180–190. [Google Scholar] [CrossRef]
- Simkin, A.J.; Kapoor, L.; Doss, C.G.P.; Hofmann, T.A.; Lawson, T.; Ramamoorthy, S. The role of photosynthesis related pigments in light harvesting, photoprotection and enhancement of photosynthetic yield in planta. Photosynth. Res. 2022, 152, 23–42. [Google Scholar] [CrossRef]
- Velez-Ramirez, A.I.; Vreugdenhil, D.; Millenaar, F.F.; Van Ieperen, W. Phytochrome A protects tomato plants from injuries induced by continuous light. Front. Plant Sci. 2019, 10, 19. [Google Scholar] [CrossRef]
- Mankiw, N.G. Principles of Economics, 8th ed.; Beijing University: Beijing, China, 2020; pp. 6–7. [Google Scholar]
- Kabir, M.H.; Nur-e-Alam, S.M.; Datta, A.; Tan, M.L.; Rahman, M.S. Understanding vegetable farmers’ adoption, dis-adoption, and non-adoption decisions of pest management by pheromone trapping. PLoS ONE 2023, 18, e0292254. [Google Scholar] [CrossRef]


| Compounds | Concentration/(mg/L) | |
|---|---|---|
| 1× Concentration (1 C) | 1/2× Concentration (1/2 C) | |
| Ca(NO3)2·4H2O | 945 | 477 |
| KNO3 | 809 | 404.5 |
| NH4H2PO4 | 153 | 76.5 |
| MgSO4·7H2O | 493 | 246.5 |
| H3BO3 | 2.86 | 1.43 |
| MnSO4·4H2O | 2.13 | 1.065 |
| ZnSO4·7H2O | 0.22 | 0.11 |
| CuSO4·5H2O | 0.08 | 0.04 |
| NH4Mo7O24·4H2O | 0.02 | 0.01 |
| EDTA-2NaFe | 24 | 12 |
| Treatment | NS Supply (Stage 1: Stage 2: Stage 3) | PSCL | |
|---|---|---|---|
| Volume (L) | Concentration | ||
| M1(control) | 4:10:6 | 1 C:1 C:1 C | No |
| M2 | 1/2 C:1 C:1/2 C | No | |
| M3 | 1/2 C:1 C:1/2 C | 48 h | |
| Treatment | Increase Rate (%) | ||||
|---|---|---|---|---|---|
| Yl | Resource/Energy Inputs | ||||
| Pw × Qw | Pe × Qe | Pf × Qf | Pt | ||
| M1 (control) | 9.59 | 0.00 | 0.00 | 0.00 | −8.75 |
| M2 | 27.83 | 0.00 | 0.00 | −25.00 | −21.88 |
| M3 | 31.66 | 0.00 | 3.33 | −25.00 | −22.52 |
Disclaimer/Publisher’s Note: The statements, opinions and data contained in all publications are solely those of the individual author(s) and contributor(s) and not of MDPI and/or the editor(s). MDPI and/or the editor(s) disclaim responsibility for any injury to people or property resulting from any ideas, methods, instructions or products referred to in the content. |
© 2025 by the authors. Licensee MDPI, Basel, Switzerland. This article is an open access article distributed under the terms and conditions of the Creative Commons Attribution (CC BY) license (https://creativecommons.org/licenses/by/4.0/).
Share and Cite
Zhang, L.; Wang, L.; Pan, Z.; Fu, H.; Yang, Y.; Yu, H.; Sui, Y.; Xu, Y.; Li, F. The Effects of Nutrient Solution Concentration and Preharvest Short-Duration Continuous Light on Yield, Quality, and Energy Efficiency in Aeroponic Intercropped Lettuce. Horticulturae 2025, 11, 815. https://doi.org/10.3390/horticulturae11070815
Zhang L, Wang L, Pan Z, Fu H, Yang Y, Yu H, Sui Y, Xu Y, Li F. The Effects of Nutrient Solution Concentration and Preharvest Short-Duration Continuous Light on Yield, Quality, and Energy Efficiency in Aeroponic Intercropped Lettuce. Horticulturae. 2025; 11(7):815. https://doi.org/10.3390/horticulturae11070815
Chicago/Turabian StyleZhang, Lei, Lingshuang Wang, Zhihao Pan, Hanbing Fu, Yaping Yang, Haiye Yu, Yuanyuan Sui, Yan Xu, and Faqinwei Li. 2025. "The Effects of Nutrient Solution Concentration and Preharvest Short-Duration Continuous Light on Yield, Quality, and Energy Efficiency in Aeroponic Intercropped Lettuce" Horticulturae 11, no. 7: 815. https://doi.org/10.3390/horticulturae11070815
APA StyleZhang, L., Wang, L., Pan, Z., Fu, H., Yang, Y., Yu, H., Sui, Y., Xu, Y., & Li, F. (2025). The Effects of Nutrient Solution Concentration and Preharvest Short-Duration Continuous Light on Yield, Quality, and Energy Efficiency in Aeroponic Intercropped Lettuce. Horticulturae, 11(7), 815. https://doi.org/10.3390/horticulturae11070815