Article

Identification of Glucose-6-Phosphate Dehydrogenase Family Members Associated with Cold Stress in Pepper (Capsicum annuum L.)

1
Key Laboratory of Molecular Breeding and Variety Creation of Horticultural Plants for Mountain Features in Guizhou Province, School of Life and Health Science, Kaili University, Kaili 556011, China
2
College of Horticulture, Sichuan Agricultural University, Chengdu 611130, China
*
Authors to whom correspondence should be addressed.
These authors contributed equally to this work.
Horticulturae 2025, 11(7), 719; https://doi.org/10.3390/horticulturae11070719
Submission received: 13 May 2025 / Revised: 10 June 2025 / Accepted: 17 June 2025 / Published: 20 June 2025
(This article belongs to the Section Biotic and Abiotic Stress)

Abstract

:
Glucose-6-phosphate dehydrogenase (G6PDH) is a critical enzyme in the pentose phosphate pathway, playing an essential role in plant growth, development, and adaptation to abiotic stress. In this study, we identified four members of the G6PDH gene family in the ‘Zunla-1’ genome, designating them as CaG6PDH1-CaG6PDH4. Multiple sequence alignment revealed that the four protein sequences of pepper contain three unique binding sites characteristic of G6PDH: the substrate binding site, the NADP binding site and the Rossmann fold. The phylogenetic tree, motifs, and gene structure analysis indicate that the CaG6PDH gene sequence is relatively conserved and structurally similar, with a close relationship to the sequence of Solanaceae G6PDH members. The collinearity analysis showed that there were two pairs of collinearity between the CaG6PDH genes and the AtG6PDH genes, as well as the SiG6PDH genes. Additionally, numerous cis-elements associated with stress responses, hormone regulation, development, and light responses were identified in the promoter region of the CaG6PDH gene. Furthermore, the various members of the pepper CaG6PDH gene family exhibit specific expression patterns across different tissues and demonstrate significant variations in response to abiotic stress and phytohormone treatments, particularly the CaG6PDH1 and CaG6PDH2 genes. Subcellular localization studies indicate that CaG6PDH2 is located in chloroplasts. We conducted further investigations into the role of CaG6PDH2 in response to cold stress using Virus-Induced Gene Silencing (VIGS) technology. The tissues of seedlings with silenced CaG6PDH2 exhibited significant damage and displayed a more pronounced cold damage phenotype. This observation is further supported by the accumulation of reactive oxygen species (ROS), the activity of antioxidant enzymes, and a reduction in the expression of cold-responsive genes. In conclusion, the findings of this study indicate that CaG6PDH2 plays an important role in cold stress response and may serve as a potential gene for cultivating cold-tolerant pepper varieties.

1. Introduction

The pentose phosphate pathway (OPPP), as the primary pathway of sugar metabolism, plays a crucial role in plant growth, development, and stress response [1,2]. As the first rate-limiting enzyme of the OPPP, glucose-6-phosphate dehydrogenase (G6PDH) utilizes NADP+ as a cofactor to convert glucose-6-phosphate (G6P) into pentose and NADPH, thereby regulating the NADPH/NADP+ redox balance and the reaction rate of the OPPP [3]. Based on its subcellular localization, G6PDH is categorized into cytoplasmic and chloroplast isoforms, with the chloroplast isoforms further classified into P0, P1, and P2 types according to their biochemical characteristics, specific antibodies, and amino acid sequences [4,5]. Multiple studies have indicated that Cy-G6PDH and P-G6PDH are regulated by distinct factors, and may exhibit different response patterns under stress [6].
At present, G6PDH family genes have been identified in numerous species, including Arabidopsis thaliana [7,8,9], Nicotiana tabacum [10], Fragaria × ananassa [11], Hordeum vulgare [12], and Hevea brasiliensis [13]. Numerous studies have demonstrated that the G6PDH gene is involved in growth and development, such as through seed germination [14], oil and lipid accumulation [7], and fruit maturity [15,16]. Moreover, G6PDH plays a crucial role in responding to biotic and abiotic stress. Wei et al. [17] found that G6PDH enhances resistance to Penicillium expansum by regulating reactive oxygen species (ROS) metabolism and NADPH production. The wheat protein TaG6PDH2, which is targeted to the chloroplast, enhances resistance to stripe rust by modulating ROS production [18]. In Arabidopsis, root infection by root-knot nematodes (RKNs) significantly increased both the total activity and protein abundance of G6PDH in wild-type plants, although there was no significant difference in G6PDH transcription level. Furthermore, during the early stages of RKN infection, the G6PD5/6 mutant, which lacks isoforms, inhibited ROS production, thereby reducing resistance to RKNs [19]. Additionally, Yang et al. [6] found that both Arabidopsis G6PD5 and G6PD6 mutants responded to salt stress, with a significant reduction in the germination rates and root elongation of the double mutant seeds, as well as the increased accumulation of ROS in the seedlings. Reduced G6PDH activity has also been associated with damage caused by salt stress in wheat and rice [20,21]. Enzyme activity and gene expression analyses indicate that HvG6PDH1 to HvG6PDH4 in barley are involved in responses to both salt and drought stress [12]. Exposure to high aluminum concentrations significantly increased the activity of total G6PDH and cytoplasmic G6PDH in soybean roots. Additionally, G6PDH inhibitors mitigated aluminum-induced root growth inhibition and oxidative stress [22]. In response to temperature stress, G6PDH maintains a stable level of H2O2 by regulating NADPH oxidase activity under high-temperature conditions, thereby protecting plants from oxidative damage [10]. The overexpression of PsG6PDH in tobacco enhances cold resistance by increasing the activity of antioxidant enzymes and the expression levels of stress-related genes [23]. In strawberry fruit, cold stress induces FaG6PDH-CY to produce increased levels of NADPH, which plays a crucial role in the defense response. This includes enhancing the activity of antioxidant enzymes and enzymes related to the ascorbate–glutathione cycle, thereby facilitating the clearance of excess ROS [24]. Additionally, cold stress leads to alterations in the redox levels of NADPH, ascorbic acid, and glutathione pools in the ZmG6PDH1 mutant of maize, which heightens the plant’s sensitivity to cold stress [25]. Although there has been some progress in understanding the role of G6PDH in response to environmental stress, there are still limited reports on its function in pepper, particularly concerning cold stress.
Pepper (Capsicum annuum L.), a member of the Solanaceae family, is indigenous to the tropical and subtropical regions of Central and South America and was introduced to China in the late 16th century. Currently, the cultivation area of pepper in China exceeds 2.1 million hectares, with a total output of 64 million tons, making it the world’s largest producer and consumer of pepper [26]. However, in many regions of China, inadequate insulation measures result in significant cold damage to pepper plants during early spring and winter, leading to substantial economic losses. Therefore, it is essential to investigate the cold response genes of pepper and enhance the cold response network. In this study, we aimed to identify and characterize CaG6PDH genes in pepper using bioinformatics methods, and then explore the biological function of CaG6PDH2 in response to cold stress. Our data not only provide new insights into the cold response mechanisms of pepper plants but also identify potential targets for breeding cold-tolerant pepper.

2. Materials and Methods

2.1. Data Sources

The genomes and annotation files of pepper (Zunla-1) and tomato were downloaded from the Solanaceae genome database (https://solgenomics.sgn.cornell.edu/ (accessed on 6 January 2025)). The Arabidopsis genome and annotation files were downloaded from the TAIR database (https://www.arabidopsis.org/ (accessed on 7 January 2025)). The G6PDH protein sequences of rice, corn, and tobacco were downloaded from the NCBI database (https://www.ncbi.nlm.nih.gov/ (accessed on 6 January 2025)).

2.2. Identification of G6PDH Genes in Pepper

The G6PDH protein sequences from Arabidopsis were utilized as references to identify the G6PDH protein sequences in pepper through a local BLASTP search, employing a cutoff value of 1 × 10⁻¹⁰. Redundant sequences were manually removed using the CD-search website (https://www.ncbi.nlm.nih.gov/Structure/cdd/wrpsb.cgi (accessed on 7 January 2025)). The molecular weight, isoelectric point, and physicochemical properties of the CaG6PDH proteins were analyzed using the ProtParam tool on the ExPASy website (https://web.expasy.org/protparam/ (accessed on 11 January 2025)). The subcellular localization of the pepper CaG6PDHs was predicted using CELLO (https://cello.life.nctu.edu.tw/ (accessed on 11 January 2025)) [27].

2.3. Sequence Analysis and Evolutionary Tree Construction of CaG6PDH Members

We utilized ClustalX software (version 2.1) and NCBI’s BlastP program (https://blast.ncbi.nlm.nih.gov/Blast.cgi (accessed on 15 January 2025)) to conduct comparative mapping and a similarity analysis of the structural domains between pepper and Arabidopsis [28]. A multiple sequence alignment was performed on G6PDH protein sequences from pepper, tomato, tobacco, soybean, maize, and Arabidopsis using MEGA 11 software. The maximum likelihood method was employed to construct an evolutionary tree with a bootstrap value of 1000; the threshold was set to 8 and the Poisson model was applied. The constructed evolutionary tree was output in Newick format, and the EvolView website (https://www.evolgenius.info/evolview-v2/#login (accessed on 21 January 2025)) was used to modify the tree.

2.4. Conservative Motif and Gene Structure Analysis of G6PDH in Solanaceae

Using the G6PDH amino acid sequences from Solanaceae crops (pepper, tomato, and tobacco) as input files, the highly conserved motifs of the G6PDH protein were identified using the MEME Suite website (version 5.5.7, https://meme-suite.org/meme/ (accessed on 21 January 2025)). The analysis was conducted under the condition of an E-value < 0.01, with the maximum number of motifs set to 10 and all other parameters maintained at their default values [29]. Additionally, the exon/intron structures of these G6PDH genes were constructed using the GSDS website (version 2.0, https://gsds.gao-lab.org/ (accessed on 10 February 2025)) [30].

2.5. Analysis of Cis-Acting Elements of CaG6PDH Gene Family in Pepper

We extracted the promoter sequences (2000 bp upstream of the ATG start codon) of the pepper G6PDH genes from the genome database and utilized Plant CARE (https://bioinformatics.psb.ugent.be/webtools/plantcare/html/ (accessed on 10 February 2025)) and TBtools software [31] for the analysis and visualization of the cis-acting elements.

2.6. Analysis of Gene Collinearity and Selective Pressure

Using TBtools and MCScanX software [32], we calculated and analyzed the collinear gene pairs of the G6PDH proteins among pepper, tomato, and Arabidopsis. The results were visualized using a Circos plot. The non-synonymous substitution rate (Ka), synonymous substitution rate (Ks), and the ratio of non-synonymous to synonymous nucleotide substitutions (Ka/Ks) were determined using DnaSP 6 software [33]. The evolutionary replication time (T) was calculated using the formula T = (Ks × 10−6)/(2λ) (in million years ago, Mya), where the λ for pepper is 7.85 × 10⁻⁹ [34].

2.7. G6PDH Gene Expression Analysis of RNA-Seq Data Under Different Phytohormone and Stresses Treatments

To analyze the tissue specificity and expression levels of the CaG6PDHs under phytohormone and stress conditions, we downloaded RNA-seq data from the NCBI database. This dataset includes samples from roots, stems, leaves, flowers, flower buds, immature fruits, green ripe fruits, color-changing fruits, and mature fruits (PRJNA193077) [35]; treatments with MeJA, SA, ET, and ABA at 0, 3, 12, and 24 h (PRJNA634831) [36]; and responses to salt, drought, cold, and heat at 0, 3, 12, and 24 h (PRJNA525913) [37]. We utilized FPKM values to estimate the expression levels of the assembled transcripts.

2.8. RNA Extraction and Quantitative Reverse Transcription Polymerase Chain Reaction (RT-qPCR)

We used the FastPure Cell/Tissue Total RNA Extraction Kit V2 (Vazyme, Nanjing, China) to extract total RNA from various pepper samples, and measured RNA concentration using an ultra-micro-spectrophotometer (West Coast, Shanghai, China). According to the manufacturer’s instructions, we used the Hiscript III RT Super Mix Kit (Vazyme, Nanjing, China) to remove gDNA and synthesize the first-strand cDNA. Subsequently, qRT-PCR analysis was performed using the CFX96 real-time PCR system (Bio Rad, Hercules, CA, USA) and the chamQ universal SYBR qPCR main mixture kit (Vazyme, Nanjing, China). The relative expression levels of genes were calculated using the 2−∆∆ct method [38] with reference to the CaUbi3 (LOC107873556) gene [39]. All primer sequences are shown in Table S2.

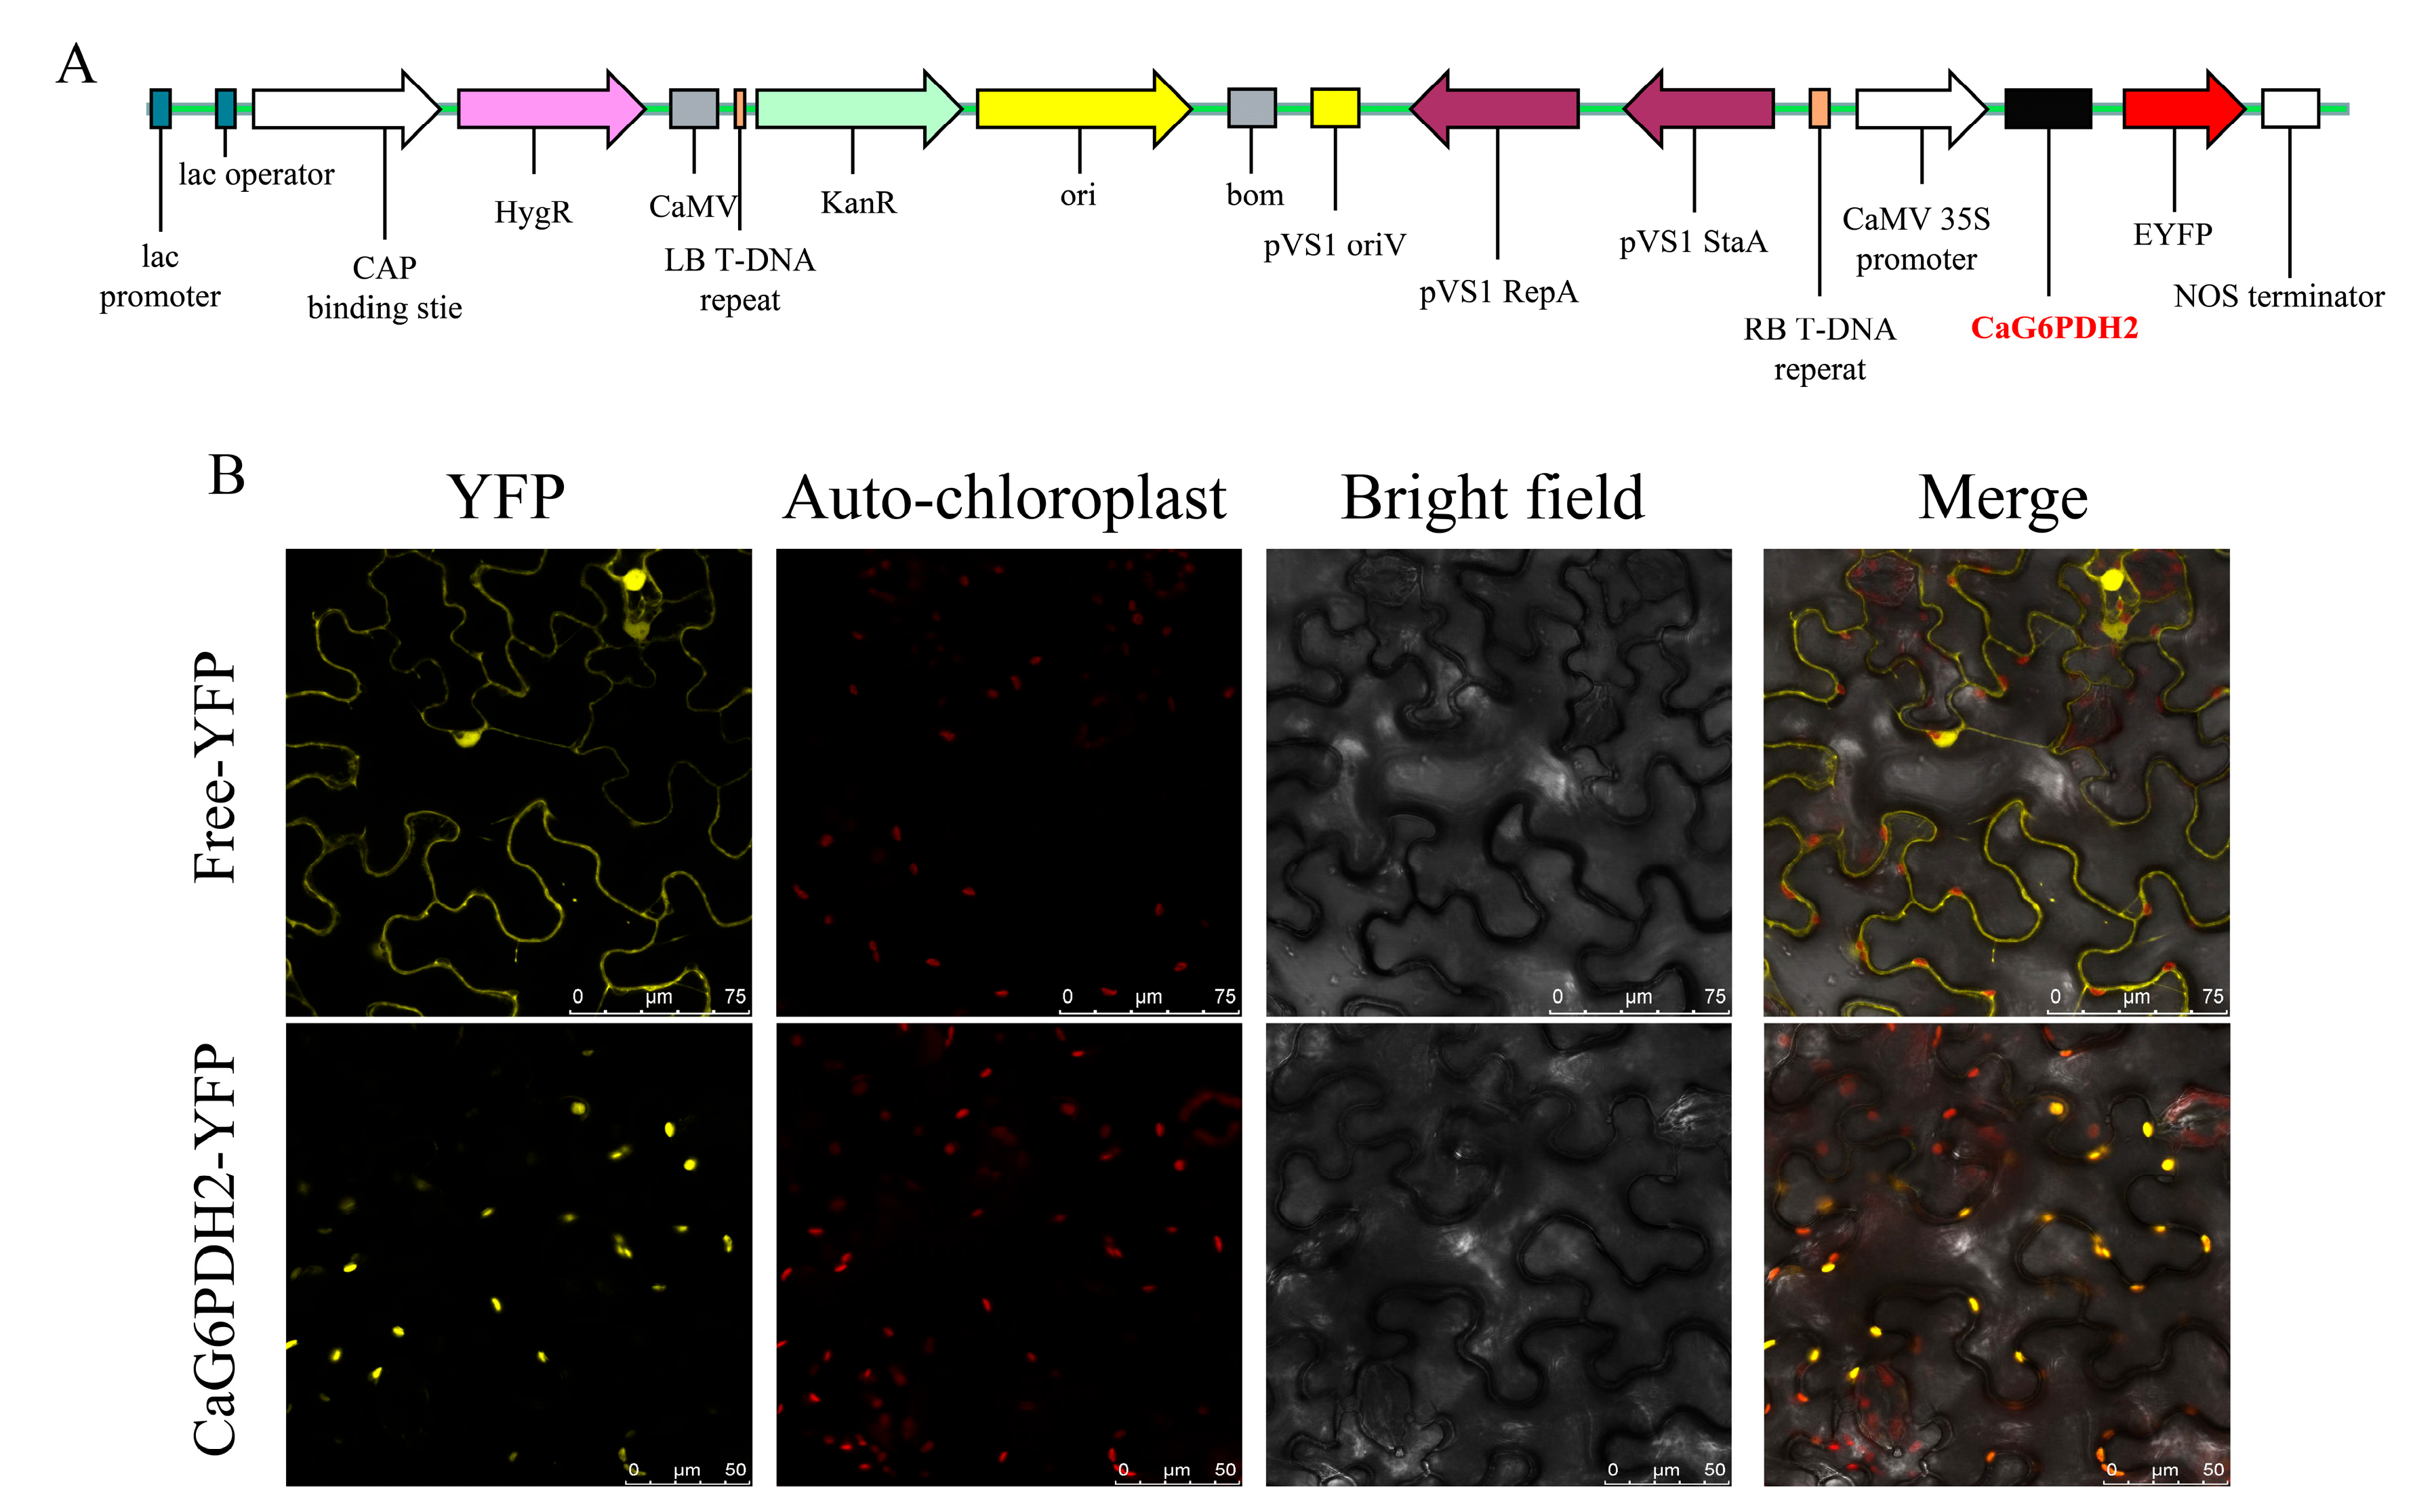
2.9. Subcellular Localization of CaG6PDH2

The subcellular localization experiment was conducted by Shanghai Zhishuo Biotechnology Co., Ltd. (Shanghai, China). Initially, the full-length sequence of the CaG6PDH2 gene, with the stop codon removed, was amplified and subsequently inserted into the 1300-35S-YFP vector through homologous recombination. The insertion site was cleaved using the EcoRI and SpeI enzymes. Following this, the fusion plasmid was transformed into Agrobacterium tumefaciens (GV3101) using a freeze–thaw method. Finally, Agrobacterium was used to infect tobacco (Nicotiana benthamiana) leaves. After 48 h of dark incubation at 25 °C, green fluorescence was observed using a laser scanning confocal microscope (Olympus FV3000, Tokyo, Japan).

2.10. VIGS of CaG6PDH2 Genes in Pepper

The PTRV1, PTRV2, and recombinant vector PTRV2:PDS utilized in this experiment were provided by Professor Huanxiu Li from the College of Horticulture at Sichuan Agricultural University.
To enhance the silencing efficiency of the target genes, we first designed specific fragments of the CaG6PDH2 gene using the SGN VIGS software [40]. Subsequently, we constructed a recombinant vector, TRV2:CaG6PDH2, utilizing XbaI and BamHI double enzyme digestion methods, and transformed it into the Agrobacterium strain GV3101 using the heat shock method. The experimental protocol for VIGS was based on the work of Velásquez et al. [41]. In brief, the Agrobacterium strains PTRV1, PTRV2, PTRV2:PDS, and PTRV2:CaG6PDH2 were activated using standard methods and incubated in the dark for 3 h. Following this, the PTRV1 bacterial solution was mixed with PTRV2, PTRV2:PDS, and PTRV2:CaG6PDH2 in a 1:1 ratio and injected into the cotyledons of pepper seedlings. The injection was performed when the cotyledons were fully expanded, prior to the emergence of true leaves. After being kept in a dark environment for 48 h, the plants were transferred to room temperature conditions and allowed to grow for an additional 3 weeks. The silencing efficiency of CaG6PDH2 was then assessed using RT-qPCR.

2.11. Pepper Materials and Stress Treatment

The ‘Ganzi’ pepper variety was provided by Professor Huanxiu Li from the College of Horticulture at Sichuan Agricultural University. The pepper seeds were germinated and sown in trays filled with a 1:1 mixture of peat and perlite. They were placed in an artificial climate chamber under conditions of 25/20 °C (photoperiod, 16/8 h) until four true leaves developed. We selected seedlings with uniform growth and transplanted them into nutrient bowls with a 1:1 mixture of peat and perlite, continuing to grow them under the same conditions until they produced 6-8 true leaves for stress treatment.
For RT-qPCR and G6PDH activity analysis, leaf samples were collected at 3, 6, 12, and 24 h under cold stress at 4 °C. Heat stress was applied at 39 °C, with leaf samples collected at 3, 6, 12, and 24 h, respectively. Drought stress was induced by withholding water, and leaf samples were collected at 1, 2, 3, and 4 days (d), respectively. Salt stress was induced by applying 250 mmol/L sodium chloride, with leaf samples collected at 6, 12, 24, and 48 h, respectively. Untreated seedlings served as the control group (CK, 0 h). Each treatment included three biological replicates, and leaf samples were immediately frozen in liquid nitrogen and stored at −80 °C.
To analyze the response of CaG6PDH2 to cold stress, PTRV2:00 and PTRV2:CaG6PDH2 plants were subjected to treatment at 4 °C for 12 h, followed by a 15 min transient exposure to 0 °C, and then returned to 4 °C for an additional 12 h. Fresh samples needed to be collected for tissue staining, and for the other indicators, pepper leaf samples were gathered according to the specified instructions. These samples were then frozen in liquid nitrogen and stored at −80 °C.

2.12. Measurement of Biochemical Indicators

The biochemical indicators measured in this experiment were assessed using various biological assay kits, including the G6PDH activity assay kit (AKCO013M), hydrogen peroxide (H2O2) content assay kit (AKAO009C), superoxide anion (O2•−) content assay kit (AKAO008C), malondialdehyde (MDA) content assay kit (AKFA013C), proline (Pro) content assay kit (AKAM003C), superoxide dismutase (SOD) activity assay kit (AKAO001C-50s), peroxidase (POD) activity assay kit (AKAO005C), and catalase (CAT) activity assay kit (AKAO003-2C). All kits were purchased from Beijing Boxbio Science & Technology Co., Ltd. (Beijing, China). It is important to note that the determination of G6PDH activity requires the use of UV detection enzyme-linked immunosorbent assay plates. The methods for measuring the aforementioned indicators were conducted according to the instructions provided with the reagent kits.
Tissue staining for H2O2 and O2•− followed established protocols from previous research [42]. The safranin green staining experiment was performed by Sevier Biotechnology Co., Ltd. (Hubei, China). In brief, young chili leaves from each treatment group were collected and promptly immersed in FAA fixative. Subsequently, the leaf samples underwent paraffin sectioning, safranin O staining, decolorization, fast green staining, transparent sealing, and photography.

2.13. Statistical Analysis

The data was organized using Excel 2019 software (Microsoft, Washington, DC, USA), and the analysis of variance was completed using SPSS 21.0 (IBM, Armonk, NY, USA). All experiments were conducted using three replicates, and Duncan’s test was used to compare the means (‘*’ represents p < 0.05, significant; ‘**’ represents p < 0.01, highly significant). We drew bar charts using Origin 2019b (Electronic Arts, Redwood City, CA, USA). We processed RNA-seq data using the Hisat2 (version 2.2.1), Stringtie (version 2.1.7), and balltown (version 4.4.0) software packages, and constructed heatmaps using TBtools (version 2.119) software.

3. Results

3.1. Identification and Characterization of CaG6PDHs in Pepper Genome

Using the G6PDH from Arabidopsis as a reference for protein BLAST, we identified four G6PDH genes in the ‘Zunla-1’ genome and designated them as CaG6PDH1-CaG6PDH4 based on their chromosomal positions (Table S1, Figure S1). CaG6PDH1-CaG6PDH4 are located on chromosome (Ch.) 2, 4, 7, and 8, respectively. The full-length coding sequences of the CaG6PDH genes vary among the members, ranging from 1530 to 1773 bp and encoding between 510 and 591 deduced amino acids. The molecular weights and stability coefficients of the four CaG6PDH proteins range from 41.69 to 46.79 kDa and 5.89 to 8.69, respectively. Subcellular localization predictions indicate that CaG6PDH1 is localized in the cytoplasm, while the other CaG6PDH proteins are localized in chloroplasts.

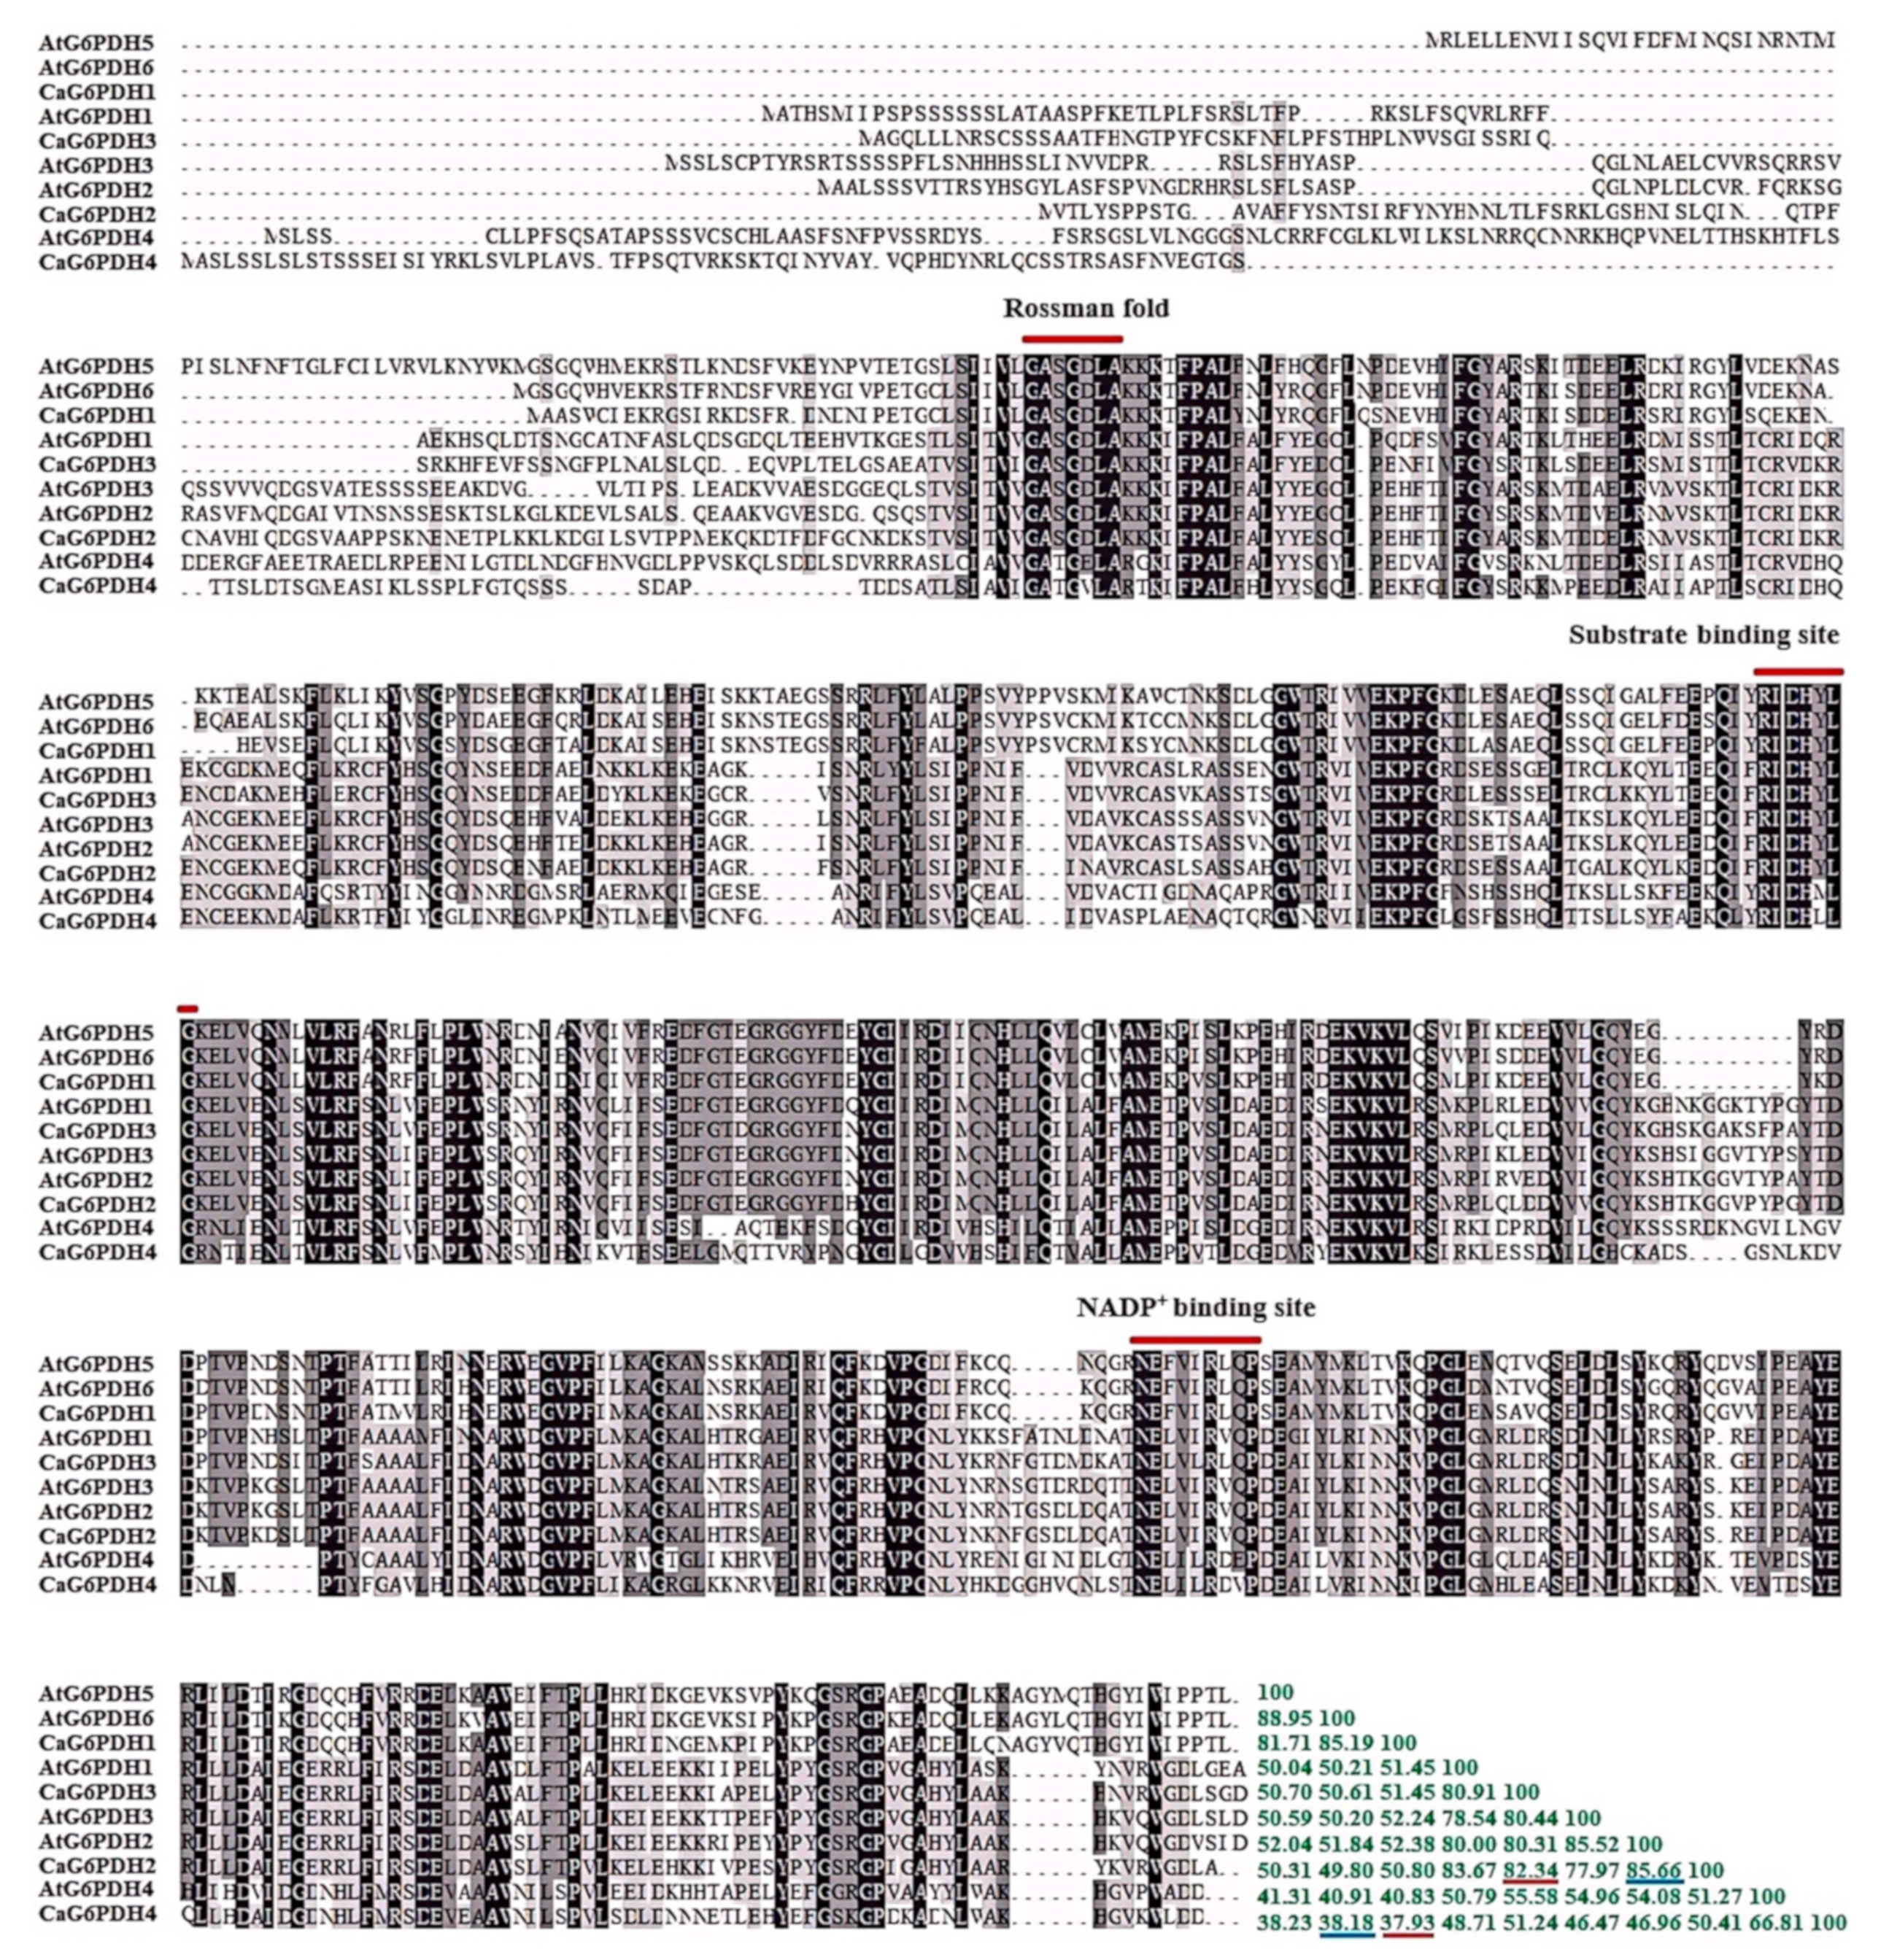
3.2. Sequence Alignment and Conserved Domain Analysis

To analyze the conservation of G6PDH sequences, we utilized ClustalW to perform a multiple sequence alignment of CaG6PDH and AtG6PDH members (Figure 1). The results indicated a high degree of homology among the pepper G6PDH sequences (CaG6PDH1, CaG6PDH2, and CaG6PDH3) and the Arabidopsis AtG6PDH sequences. Specifically, CaG6PDH2 and AtG6PDH2 exhibited a homology of 85.66%, followed closely by CaG6PDH1 and AtG6PDH6 at 85.19% and CaG6PDH2 and AtG6PDH1 at 83.67%. In contrast, significant differences were observed in the sequence of CaG6PDH4 compared to Arabidopsis AtG6PDH, with homology ranging from 66.81% to 38.18%. Among the four CaG6PDH sequences, CaG6PDH2 and CaG6PDH3 displayed the highest homology at 82.34%, while the homology of the other pepper CaG6PDH sequences fell below 55%. Notably, the homology between CaG6PDH1 and CaG6PDH4 was only 37.93%, indicating low conservation between these two sequences. Nevertheless, three conserved sites of the G6PDH gene family were identified across all sequences—the Rossmann fold (GASGDLAKK), the substrate binding site (IDHYLG), and the NADP binding site (NEVVIRLQP)—which were relatively conserved.

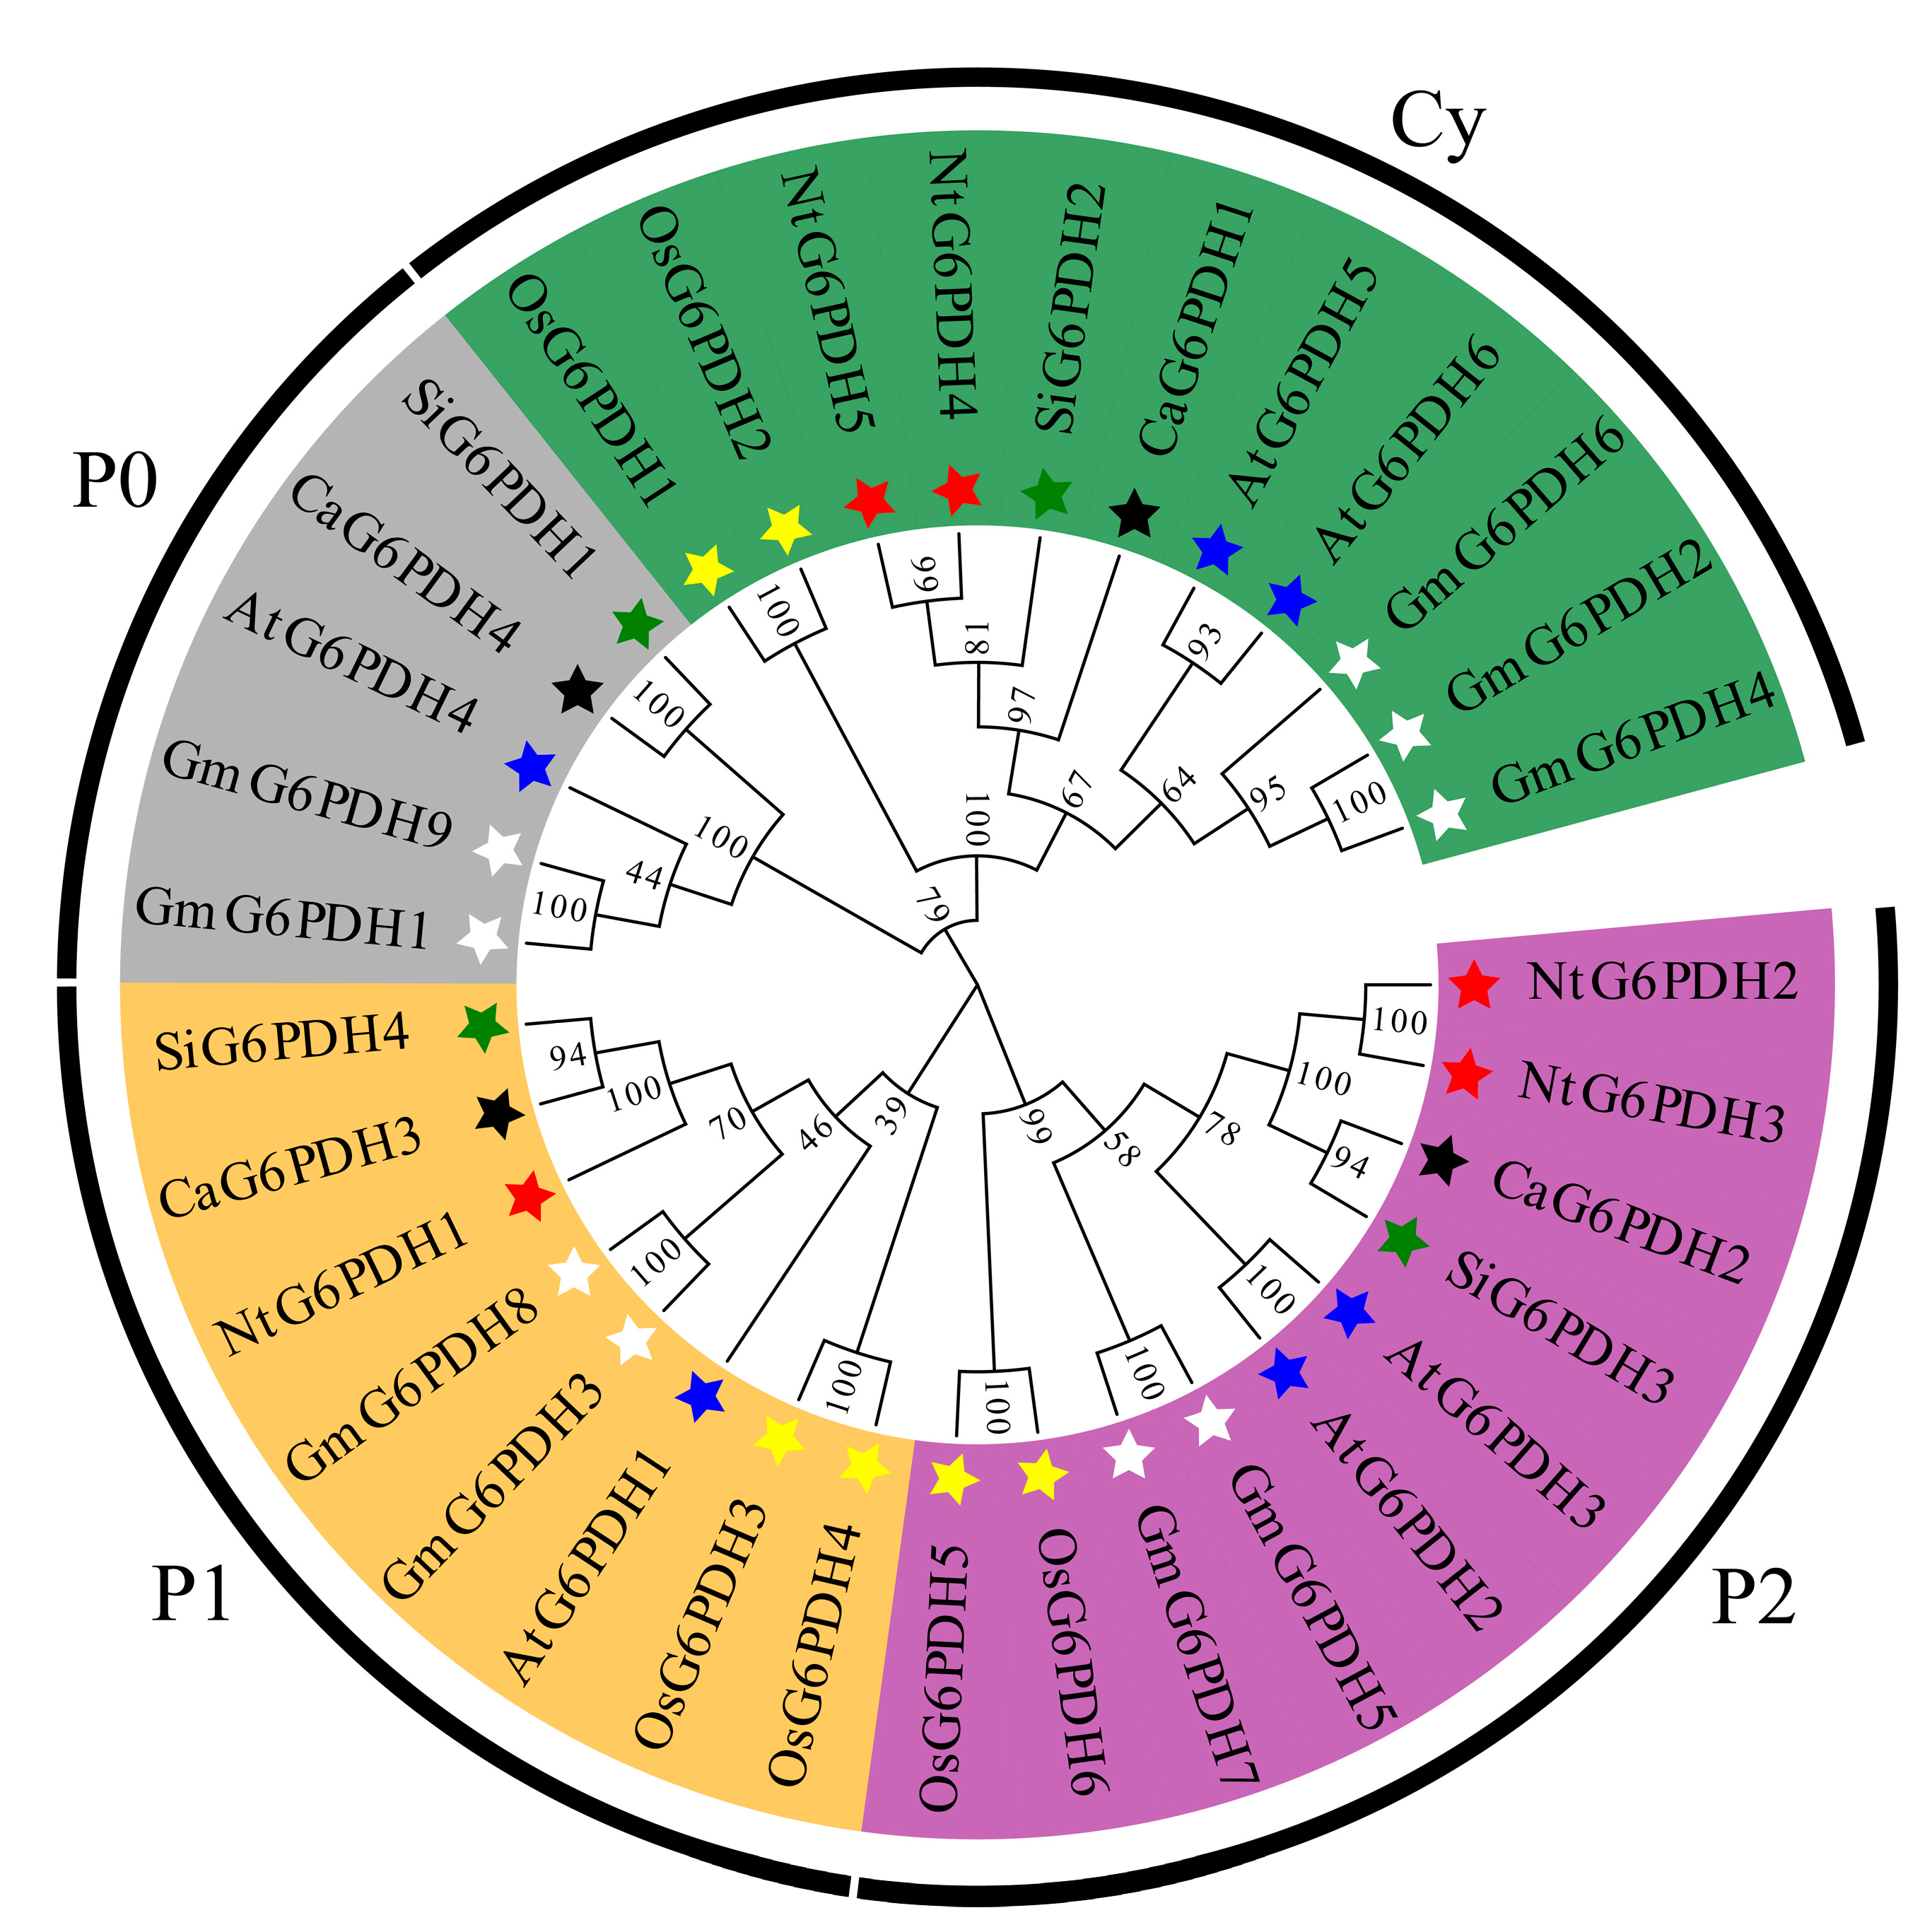
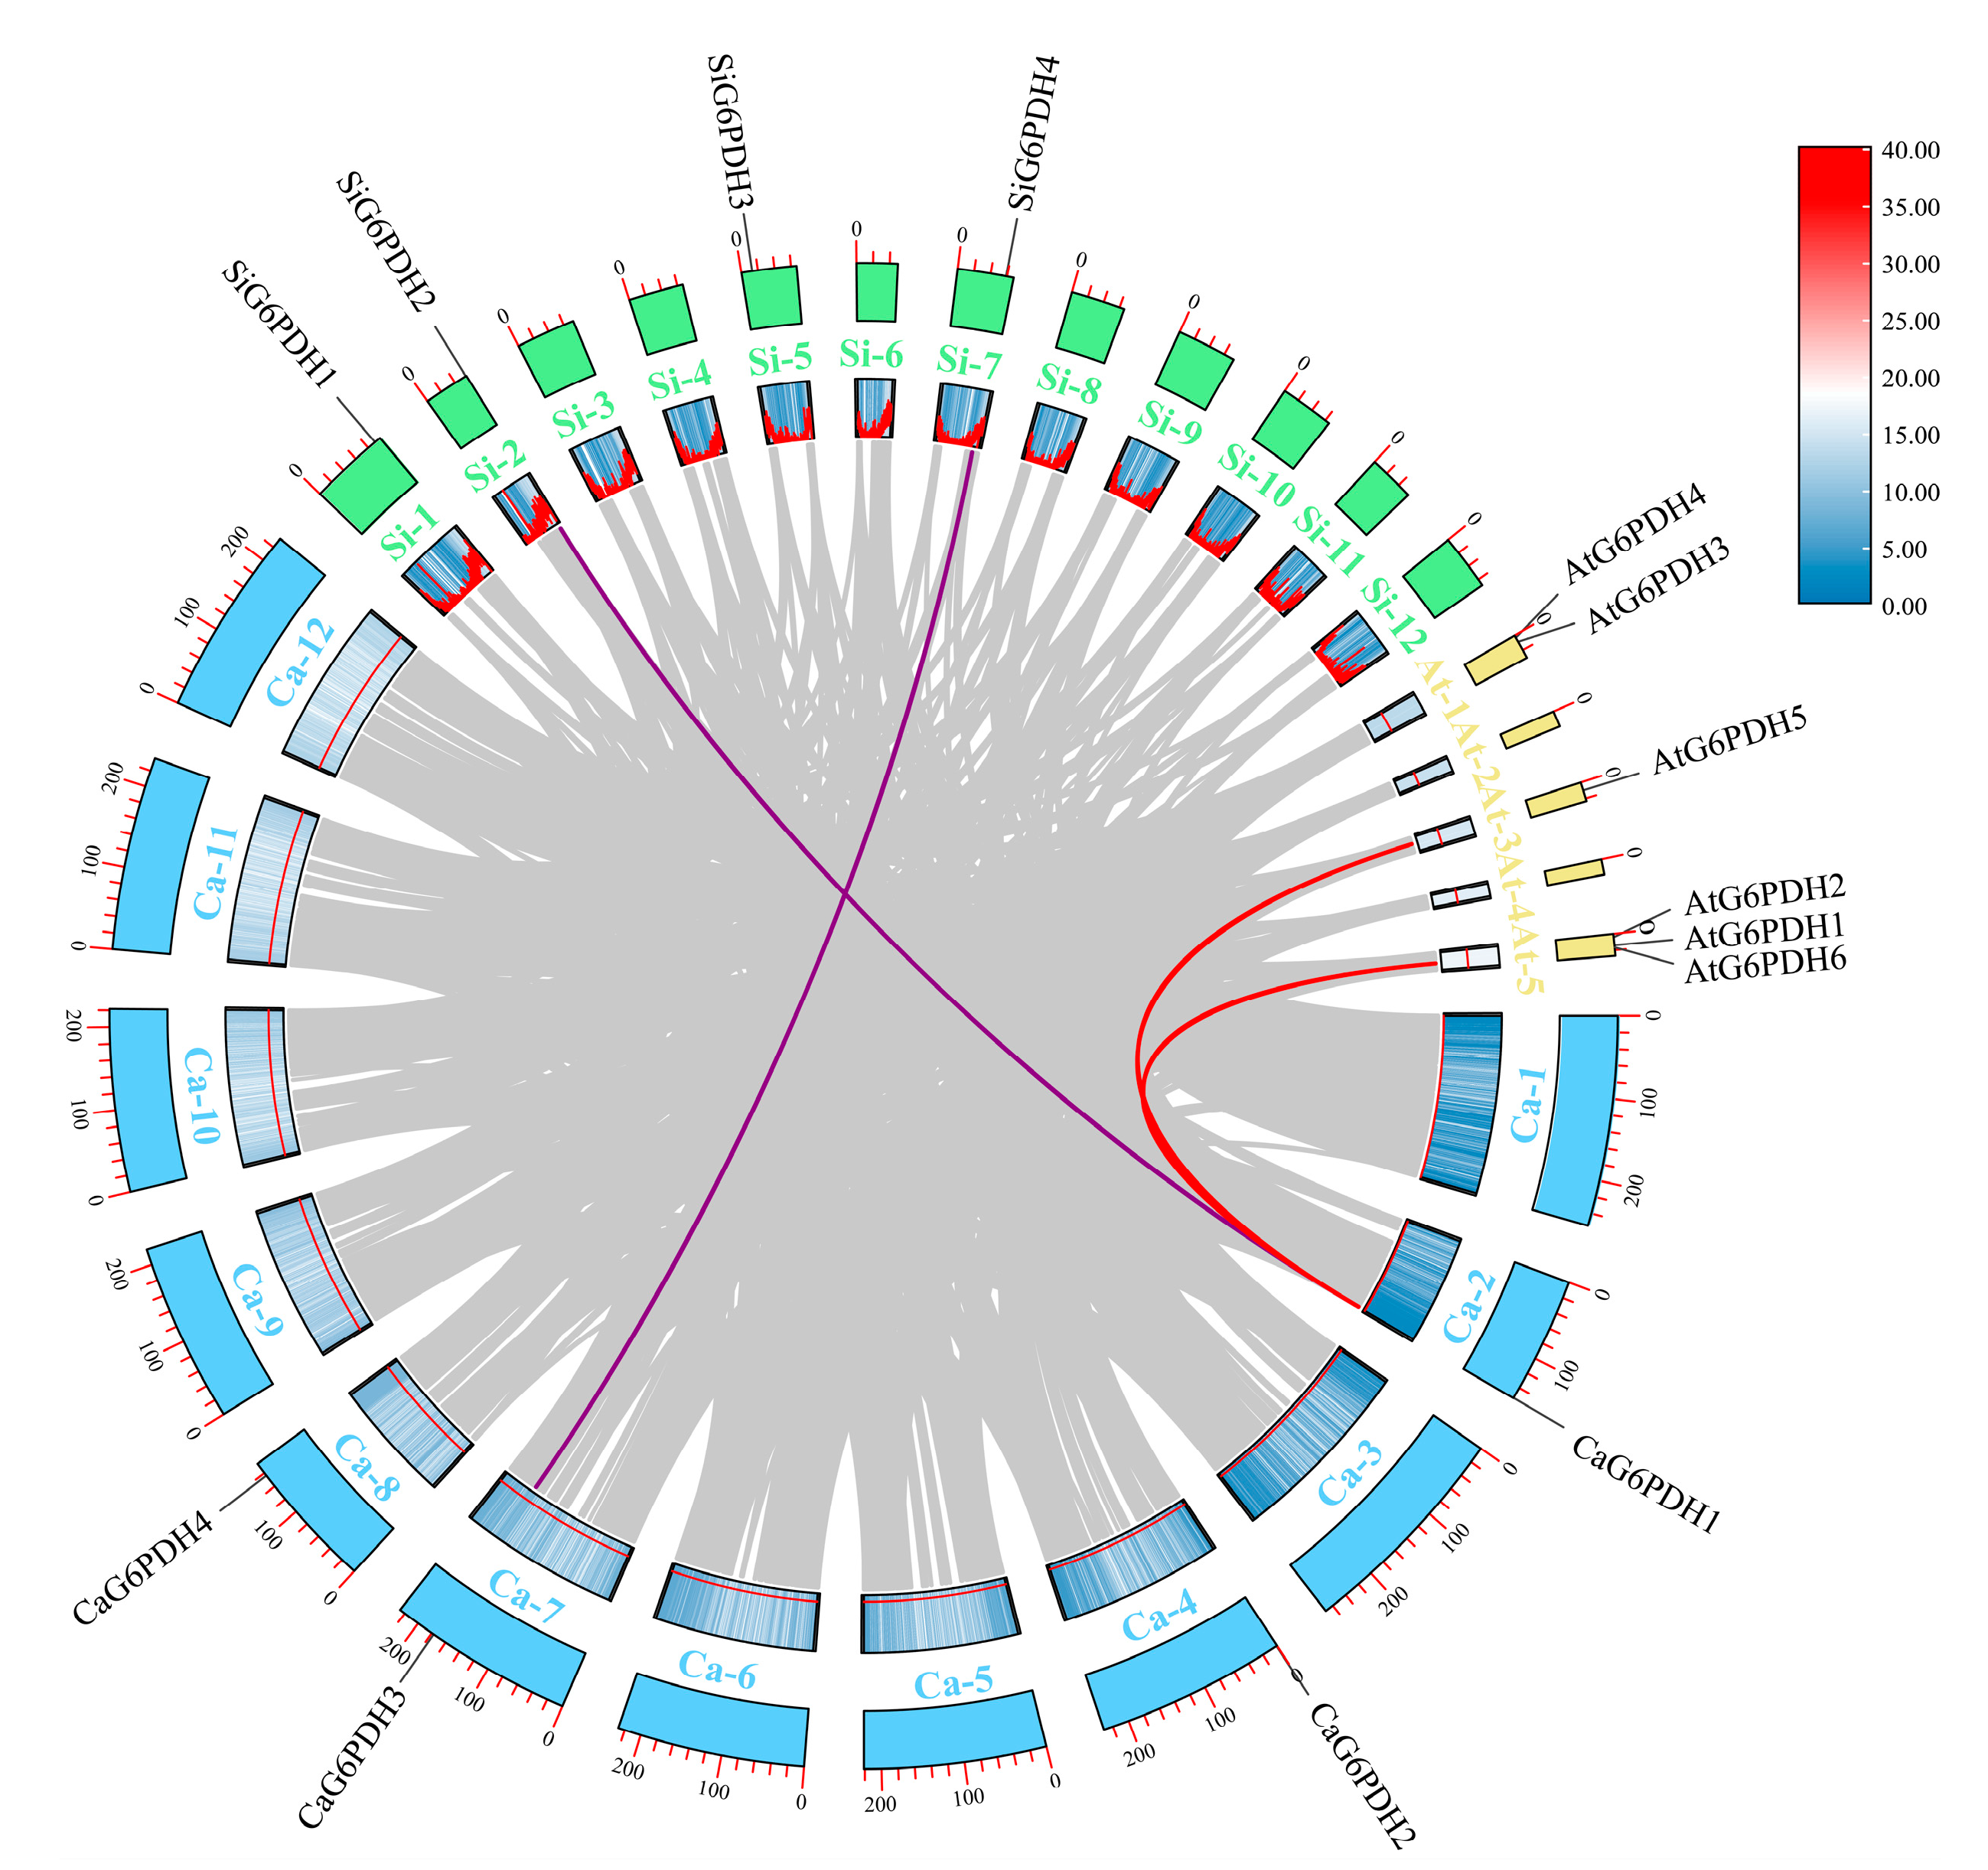
3.3. Phylogenetic and Collinearity Analysis

A phylogenetic tree was constructed based on a multiple sequence alignment of CaG6PDH and 30 other identified G6PDH proteins from various species, including Arabidopsis, tobacco, tomato, soybean, and rice (Figure 2). The results indicate that G6PDHs can be categorized into four subgroups: Cy, P0, P1, and P2. The four CaG6PDH members from pepper are distributed across different subgroups. Specifically, CaG6PDH1 is classified in the Cy subgroup, CaG6PDH2 is placed in the P2 subgroup, CaG6PDH3 is located in the P1 subgroup, and the P0 subgroup includes CaG6PDH4. Notably, the CaG6PDHs exhibit high homology with SiG6PDHs and NtG6PDHs, as they belong to the Solanaceae family and share a distant evolutionary relationship with the monocotyledonous plant rice.
The TBtools software was used for collinearity analysis. We found no fragment duplication pairs among the four CaG6PDH genes in pepper (Figure 3). However, two homologous G6PDH pairs were identified between pepper and Arabidopsis: CaG6PDH1/AtG6PDH5 and CaG6PDH1/AtG6PDH6. Additionally, the linear pairs CaG6PDH1/SiG6PDH2 and CaG6PDH3/SiG6PDH4 were observed between pepper and tomato. The ratio of Ka/Ks is a critical indicator for evaluating selection pressure. Among these four collinear pairs, the Ks values are significantly larger than the Ka values, resulting in a ratio much smaller than 1. This suggests that the differentiation of G6PDH members among pepper, Arabidopsis, and tomato is under strong purifying selection. In the case of pepper and Arabidopsis, the differentiation time for CaG6PDH1/AtG6PDH5 is estimated at 116.15 Mya, while the differentiation time for CaG6PDH1/AtG6PDH6 is 141.35 Mya (Table 1). The differentiation times between pepper and tomato are considerably shorter than those with Arabidopsis, with differentiation times of 13.75 Mya for CaG6PDH1/SiG6PDH2 and 10.26 Mya for CaG6PDH3/SiG6PDH4, respectively.

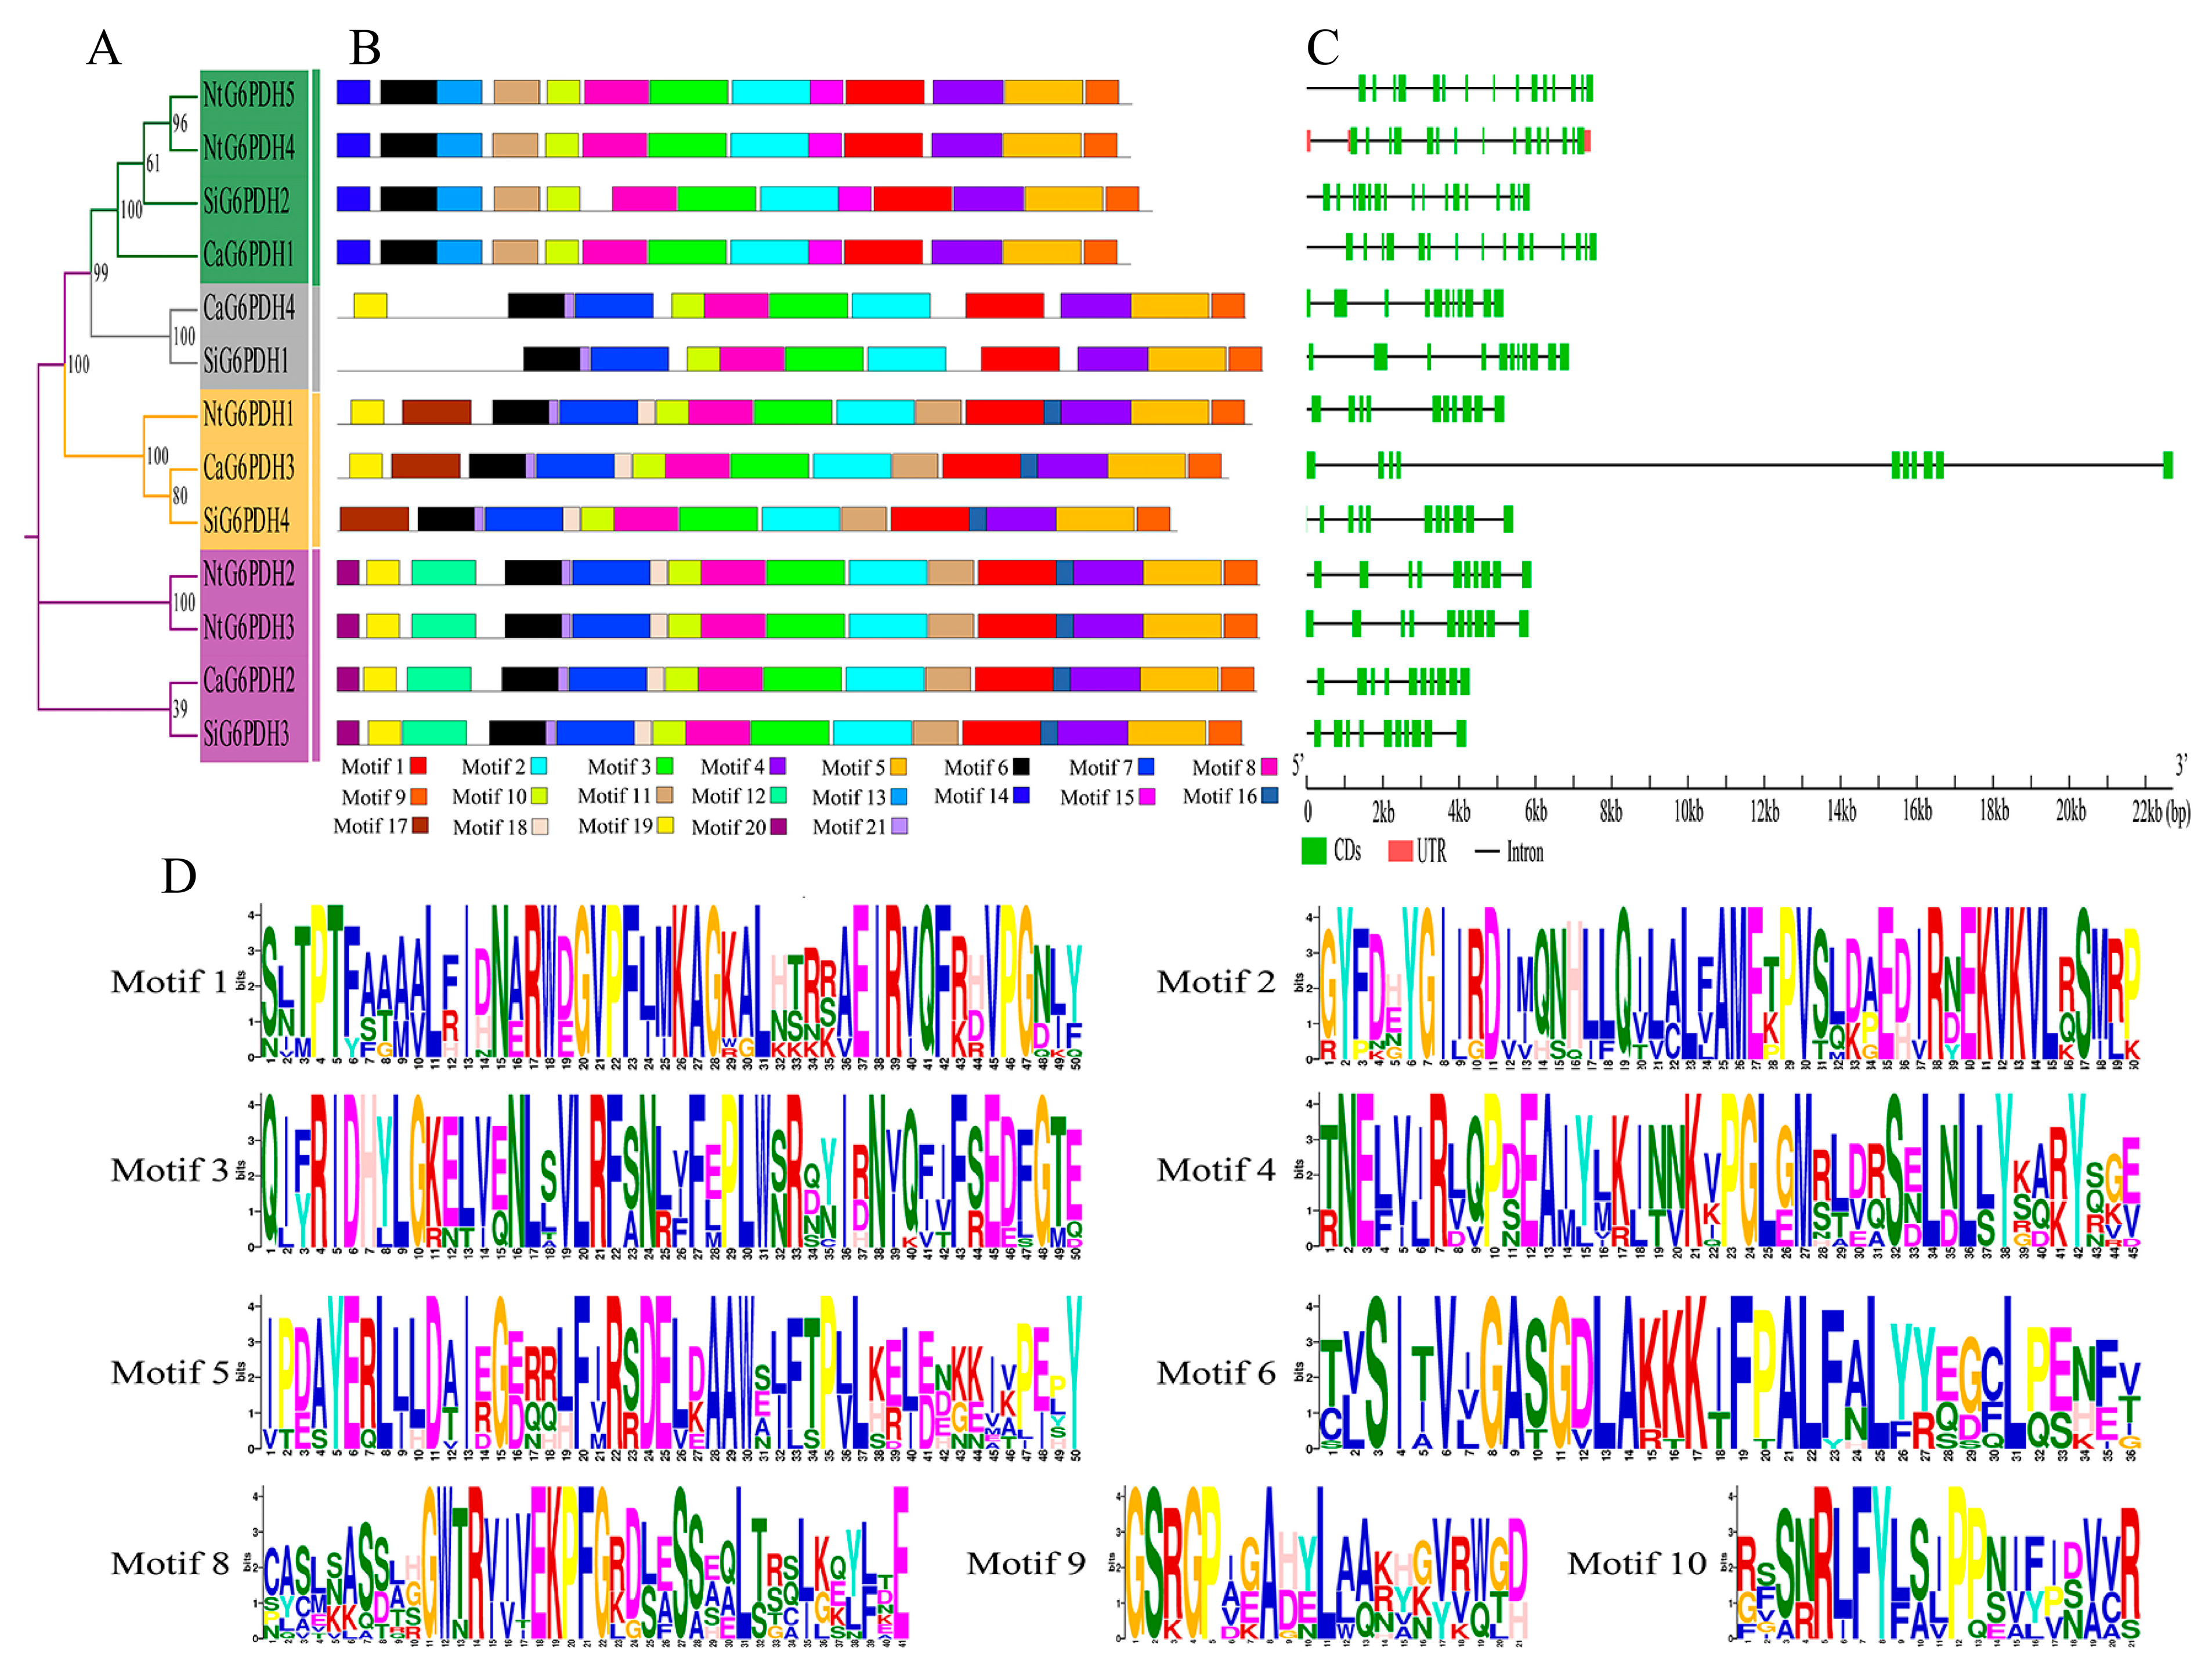
3.4. Motifs and Gene Structure Analysis of G6PDH in Solanaceae

To further investigate the evolutionary relationships among G6PDH in Solanaceae crops, we analyzed the phylogenetic relationships (Figure 4A), conserved motifs (Figure 4B,D), and gene structures (Figure 4C) of G6PDH proteins in pepper, tomato, and tobacco. We set the motif search number to 30 and used a threshold of an E-value < 10−3 as the screening criterion, resulting in the identification of a total of 21 conserved motifs. Notably, all G6PDH members contain motifs 1 through 10, which are located at similar positions within the sequences. Additionally, some specific motifs, such as motifs 13, 14, and 15, are exclusive to the Cy subfamily, suggesting that these conserved motifs may serve specific functions in the cytoplasm. Furthermore, motif 17 is unique to the P1 subfamily, while motifs 12 and 20 are found only in the P2 subfamily. The P0 subfamily members exhibit the fewest conserved motifs, with CaG6PDH4 containing 12 motifs and SiG6PDH1 having only 11 motifs (Figure 4B). It is noteworthy that motif 21 is present in all P0, P1, and P2 subfamilies, with members predicted to be localized in chloroplasts. From a genetic structural perspective, the gene architecture of each subfamily is generally comparable. For instance, SiG6PDH2 in the Cy subfamily comprises 16 exons, while all other members contain 15 exons. In the P1 subfamily, NtG6PDH1 and CaG6PDH3 each have 10 exons, whereas SiG6PDH4 contains 11 exons. In the P0 and P2 subfamilies, the members exhibit 11 and 10 exons, respectively. Furthermore, the gene lengths of all the G6PDH members are similar, with the exception of CaG6PDH3, which is significantly longer than the other members (Figure 4C). Overall, the members of each subfamily display similar conserved motifs and gene structures, suggesting that they may share analogous functions; however, further research is necessary to elucidate their specific roles.

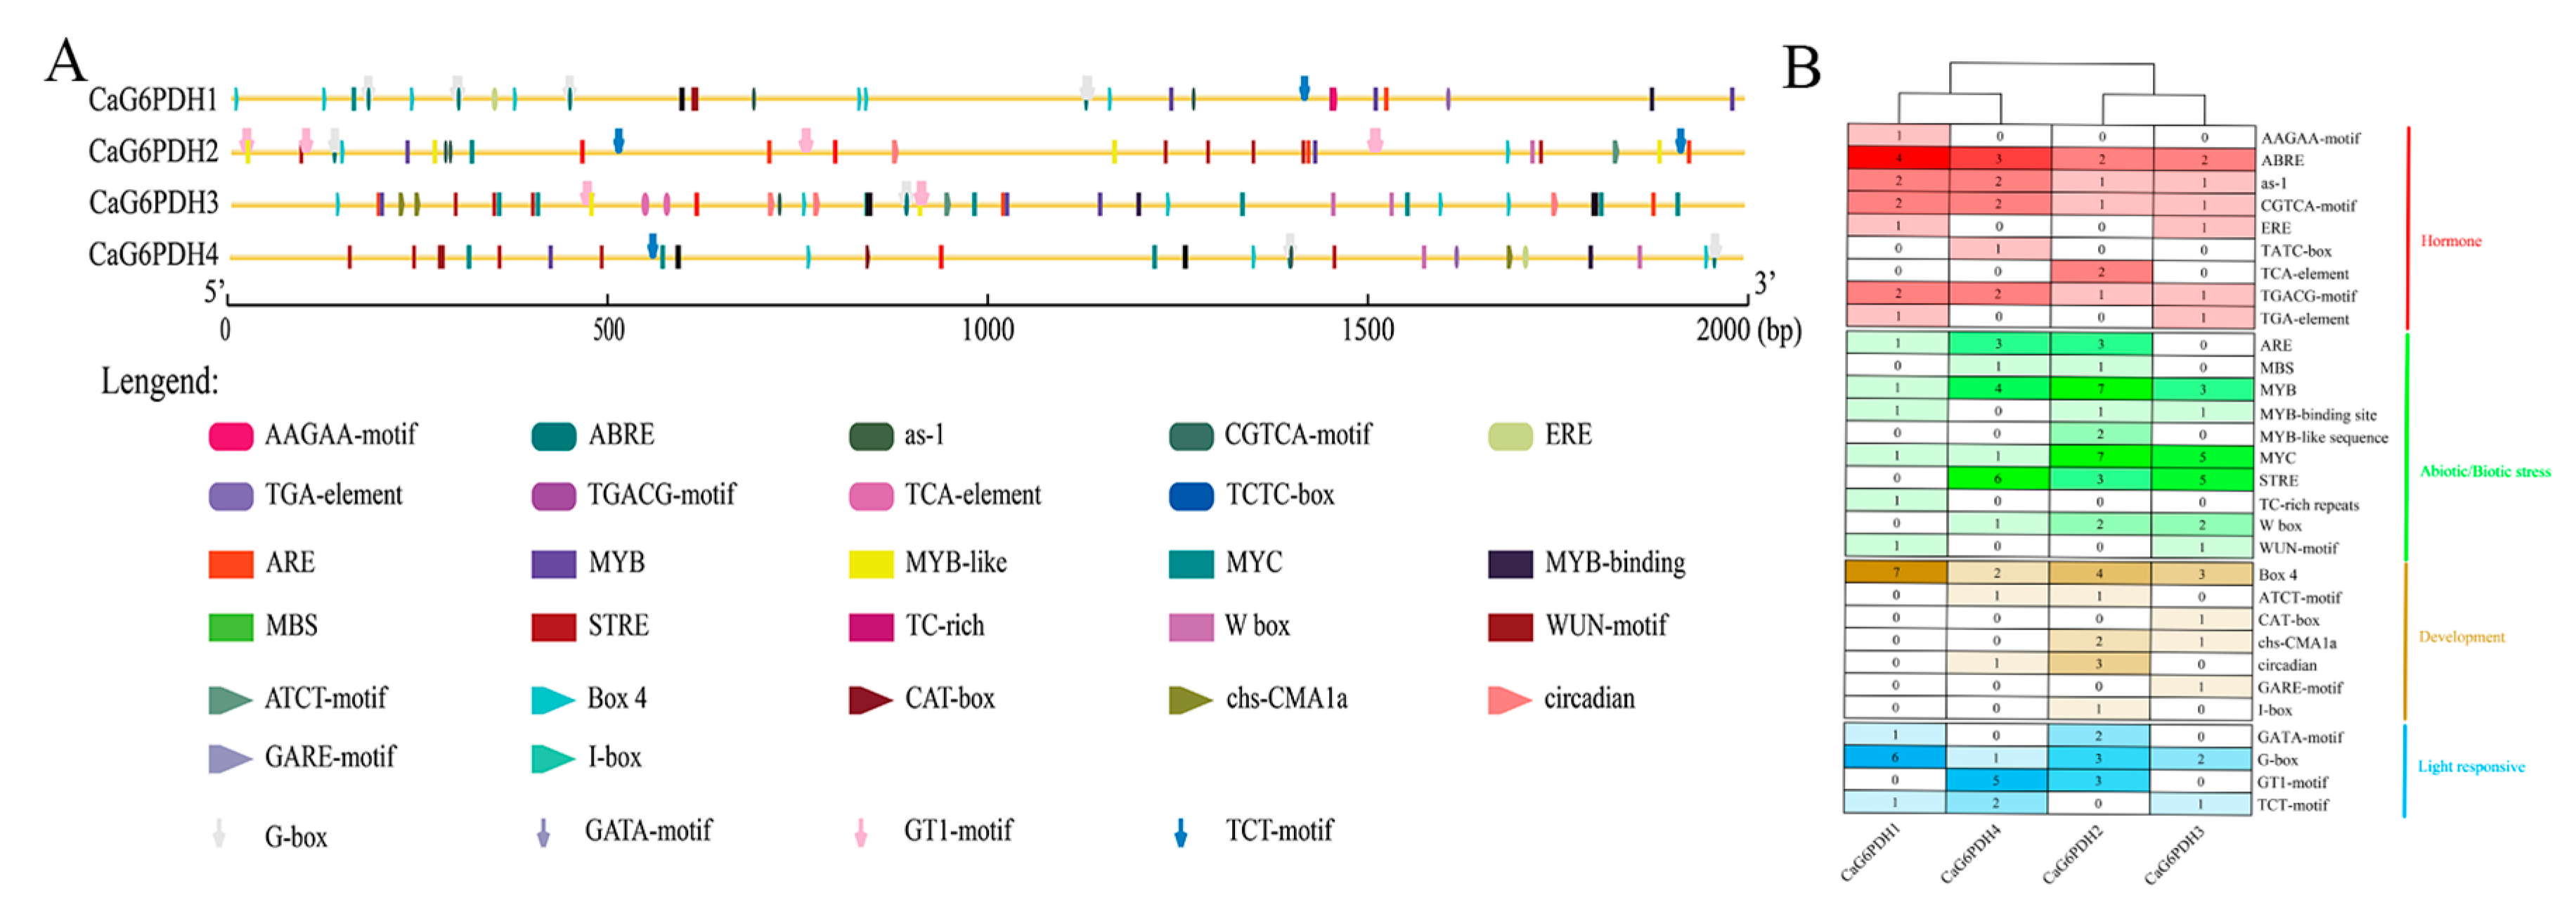
3.5. Cis-Acting Element Analysis of CaG6PDH in Pepper

Using online software, we predicted transient action elements located 2000 bp upstream of the promoters of four CaG6PDH genes. We identified a total of 30 hypothesized functional elements, which could be classified into four categories: plant hormone elements, biotic/abiotic response elements, growth and development elements, and photoresponsive elements, comprising 9, 10, 7, and 4 types of functional elements, respectively. It is evident that the cis-acting elements are unevenly distributed within the promoter regions of the four CaG6PDH genes (Figure 5A).
All four CaG6PDH genes contain several plant hormone response elements, including ABRE, as-1, CGTCA motifs, and TGACG motifs. ERE and TGA motif elements are found in CaG6PDH1 and CaG6PDH3, while the AAGAA motif, TCTC box, and TCA elements are unique to CaG6PDH1, CaG6PDH4, and CaG6PDH2, respectively. In the CaG6PDH gene family, biotic and abiotic stress cis-acting elements are primarily associated with MYB, MYC, STRE, and ARE, with counts of 15, 14, 14, and 7 elements, respectively. The number of MBS elements is two, located in CaG6PDH4 and CaG6PDH2, while WUN motifs are present in CaG6PDH1 and CaG6PDH3. MYB-like sequences and TC-rich repeats are found in CaG6PDH2 and CaG6PDH1, respectively. Regarding growth and light-responsive elements, Box4 and G-box motifs are present in each CaG6PDH gene, with the highest counts in CaG6PDH1, which has 7 and 6 occurrences, respectively, followed by CaG6PDH2, CaG6PDH3, and CaG6PDH4. Most cis-acting elements, such as the ATCT motif, chs-CMA1a, circadian elements, GATA motifs, GT1 motifs, and TCT motifs, are typically found in 2–3 CaG6PDH genes, while the remaining elements are exclusive to a single gene (Figure 5B).

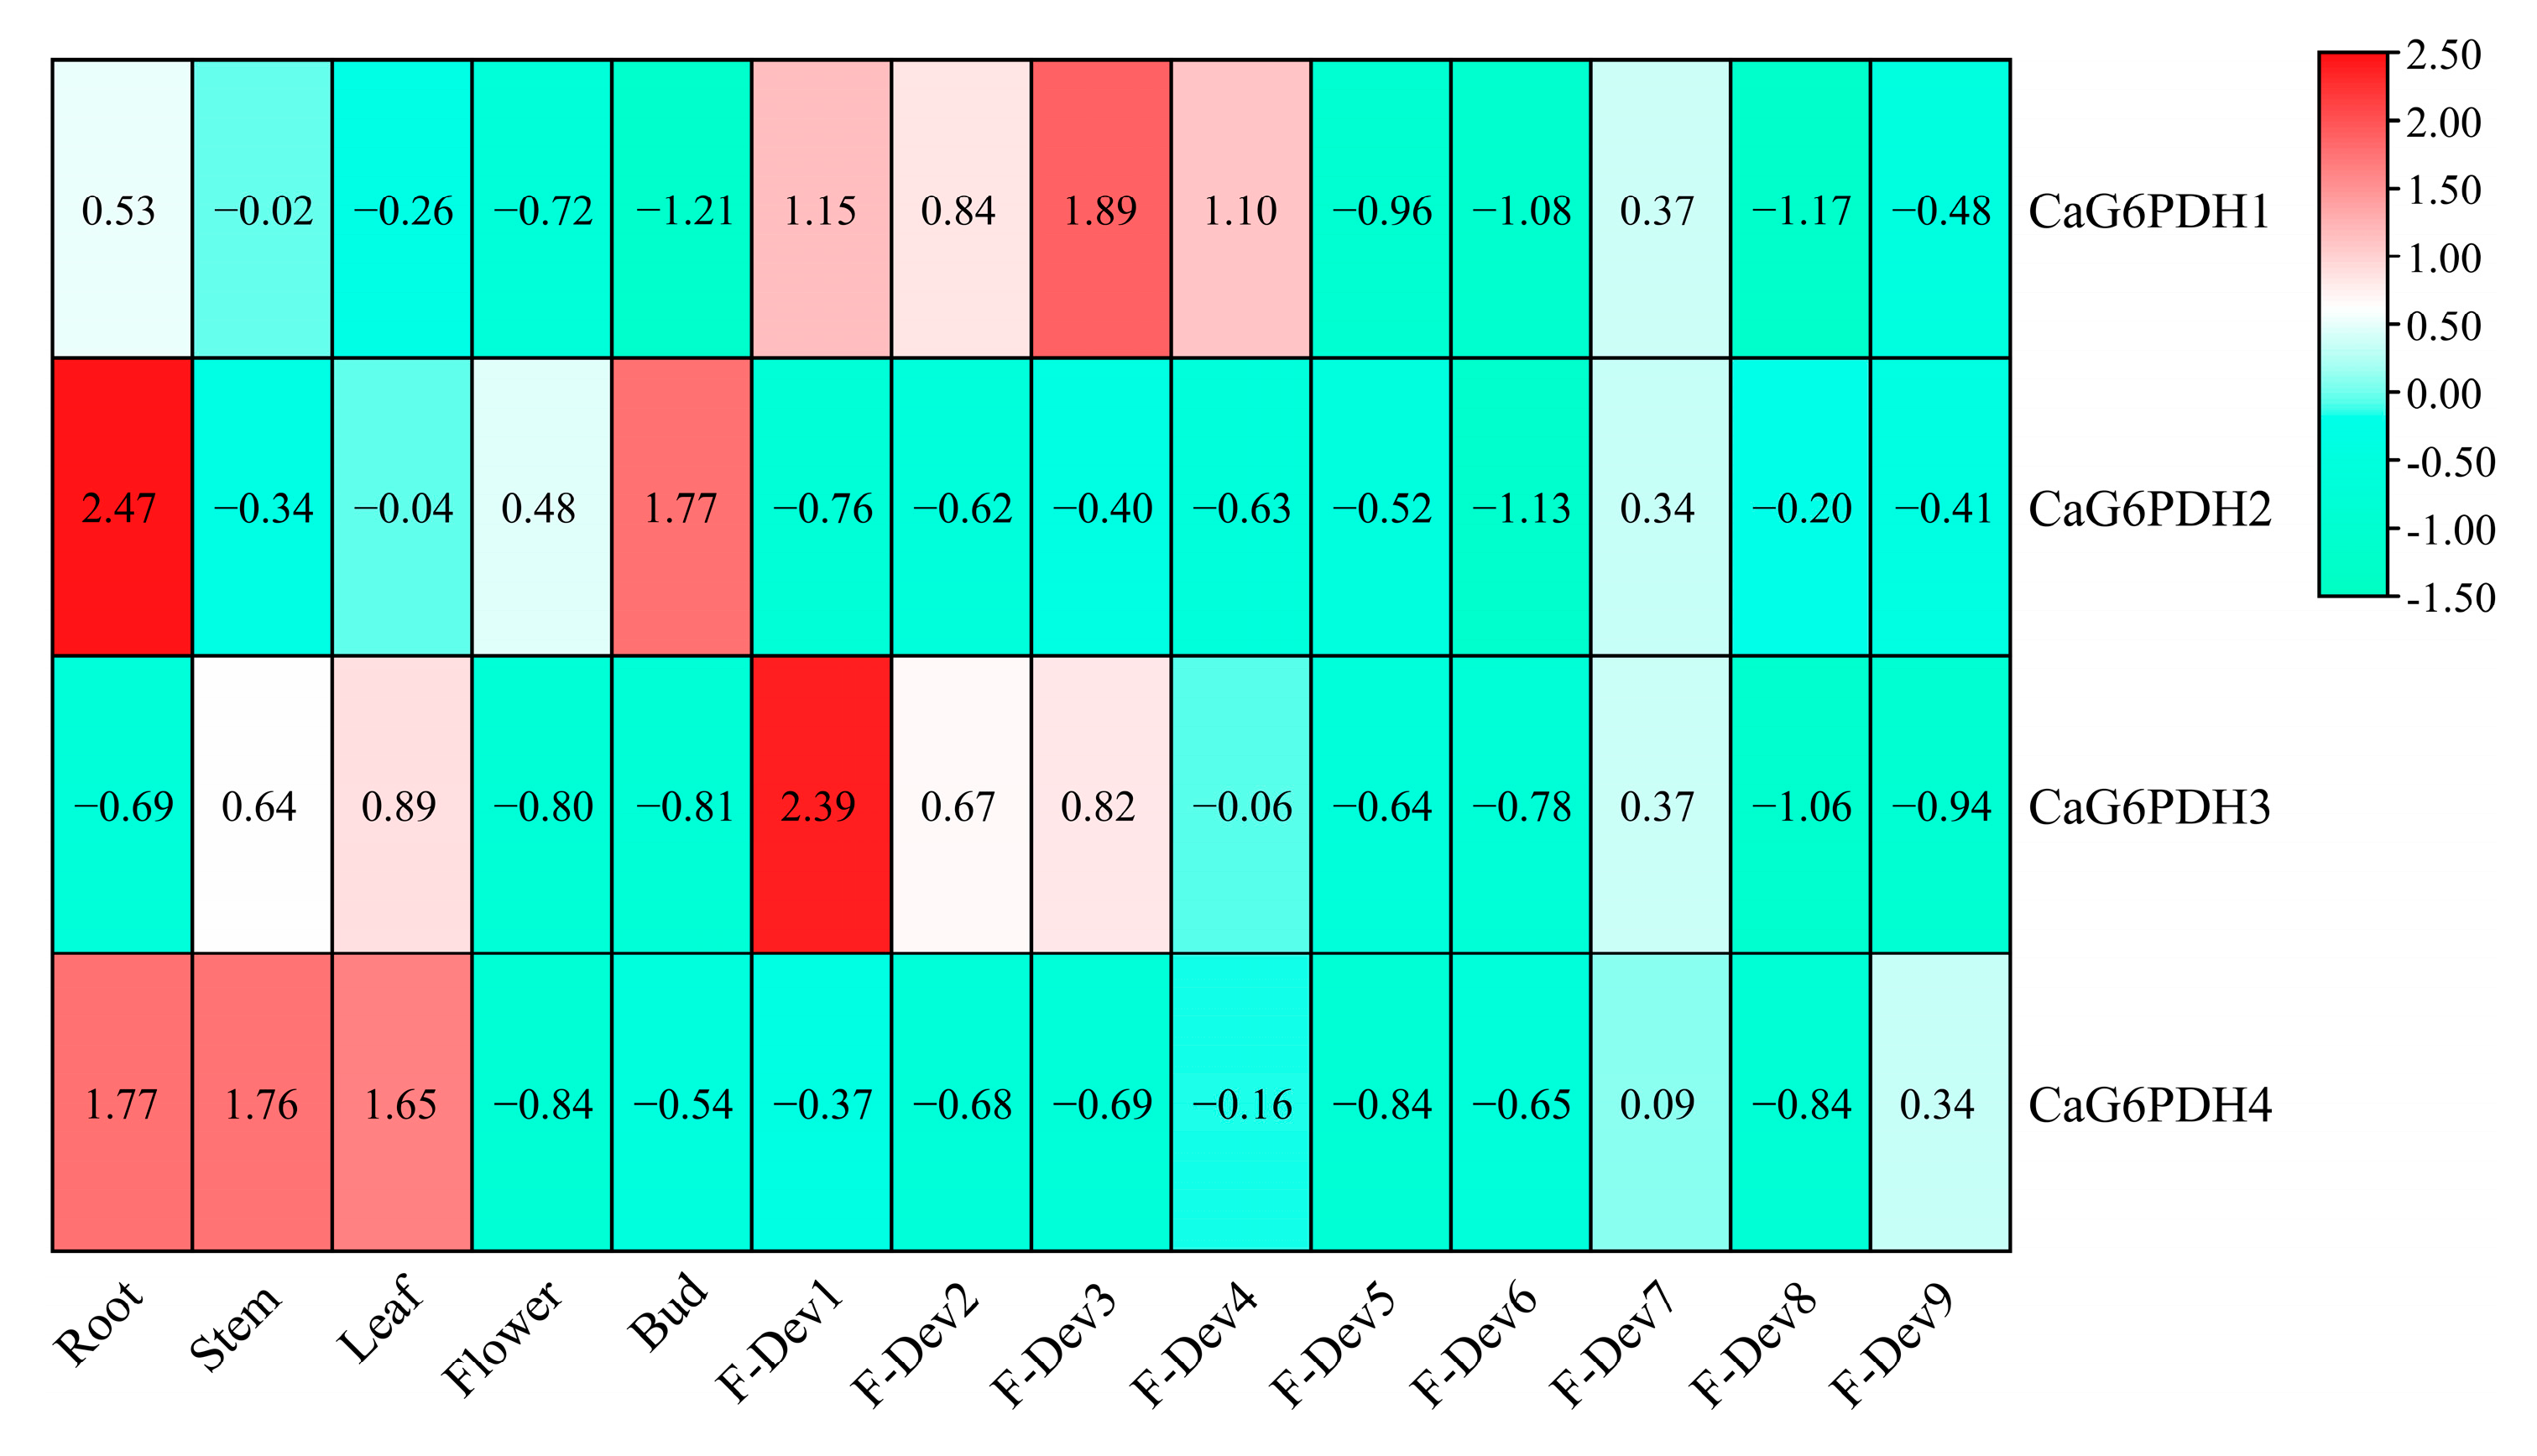
3.6. Expression Profile of CaG6PDHs in Different Tissues

The expression of genes in different tissues reveals their biological functions during growth and development. An analysis of transcriptome data from ‘Zunla-1’ showed that CaG6PDH1 is predominantly expressed in the young fruits of pepper (F-Dev1 to F-Dev4), while CaG6PDH3 exhibits high expression levels in stems, leaves, and young fruits, with reduced expression in mature fruits. In contrast, CaG6PDH2 is primarily expressed in roots, followed by flower buds, and is not expressed in fruits. Another member of the pepper G6PDH family, CaG6PDH4, shows high expression in roots, stems, and leaves, but lower levels in flowers, buds, and fruits. Overall, the expression levels of the four G6PDH members in mature fruits of pepper are relatively low, suggesting a weak correlation between the functions of G6PDH members and the later stages of fruit ripening (Figure 6).

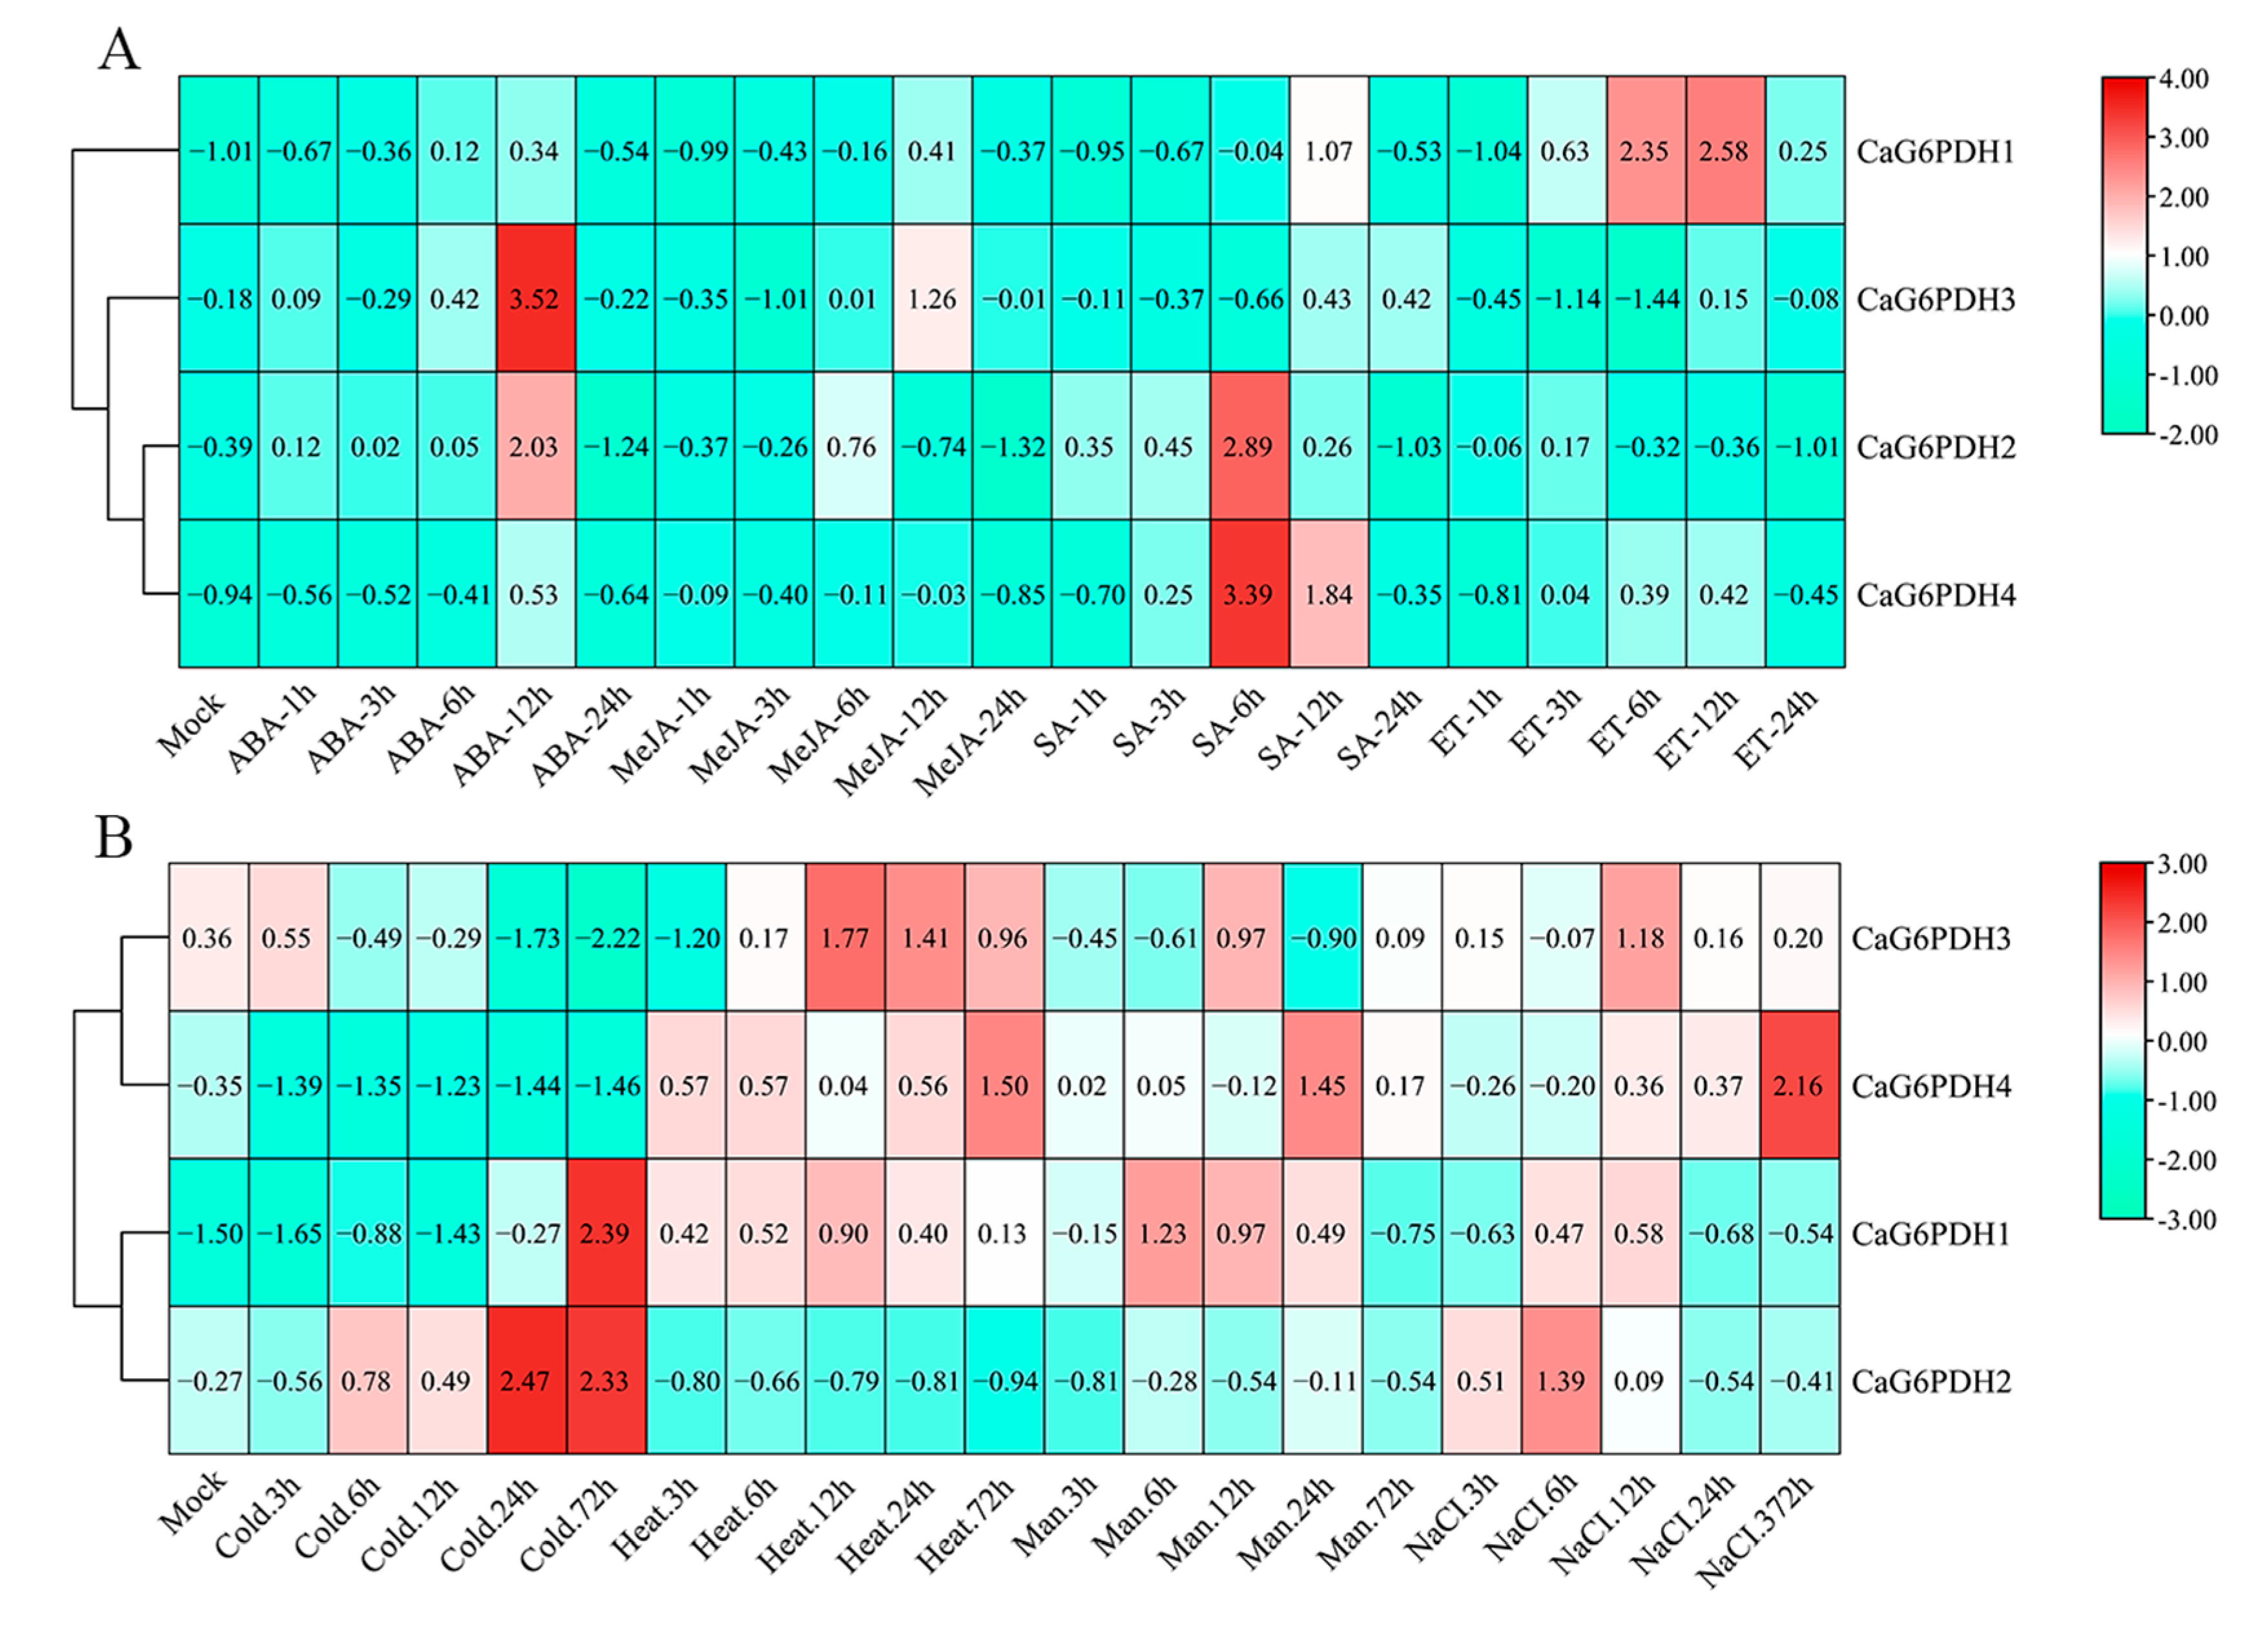
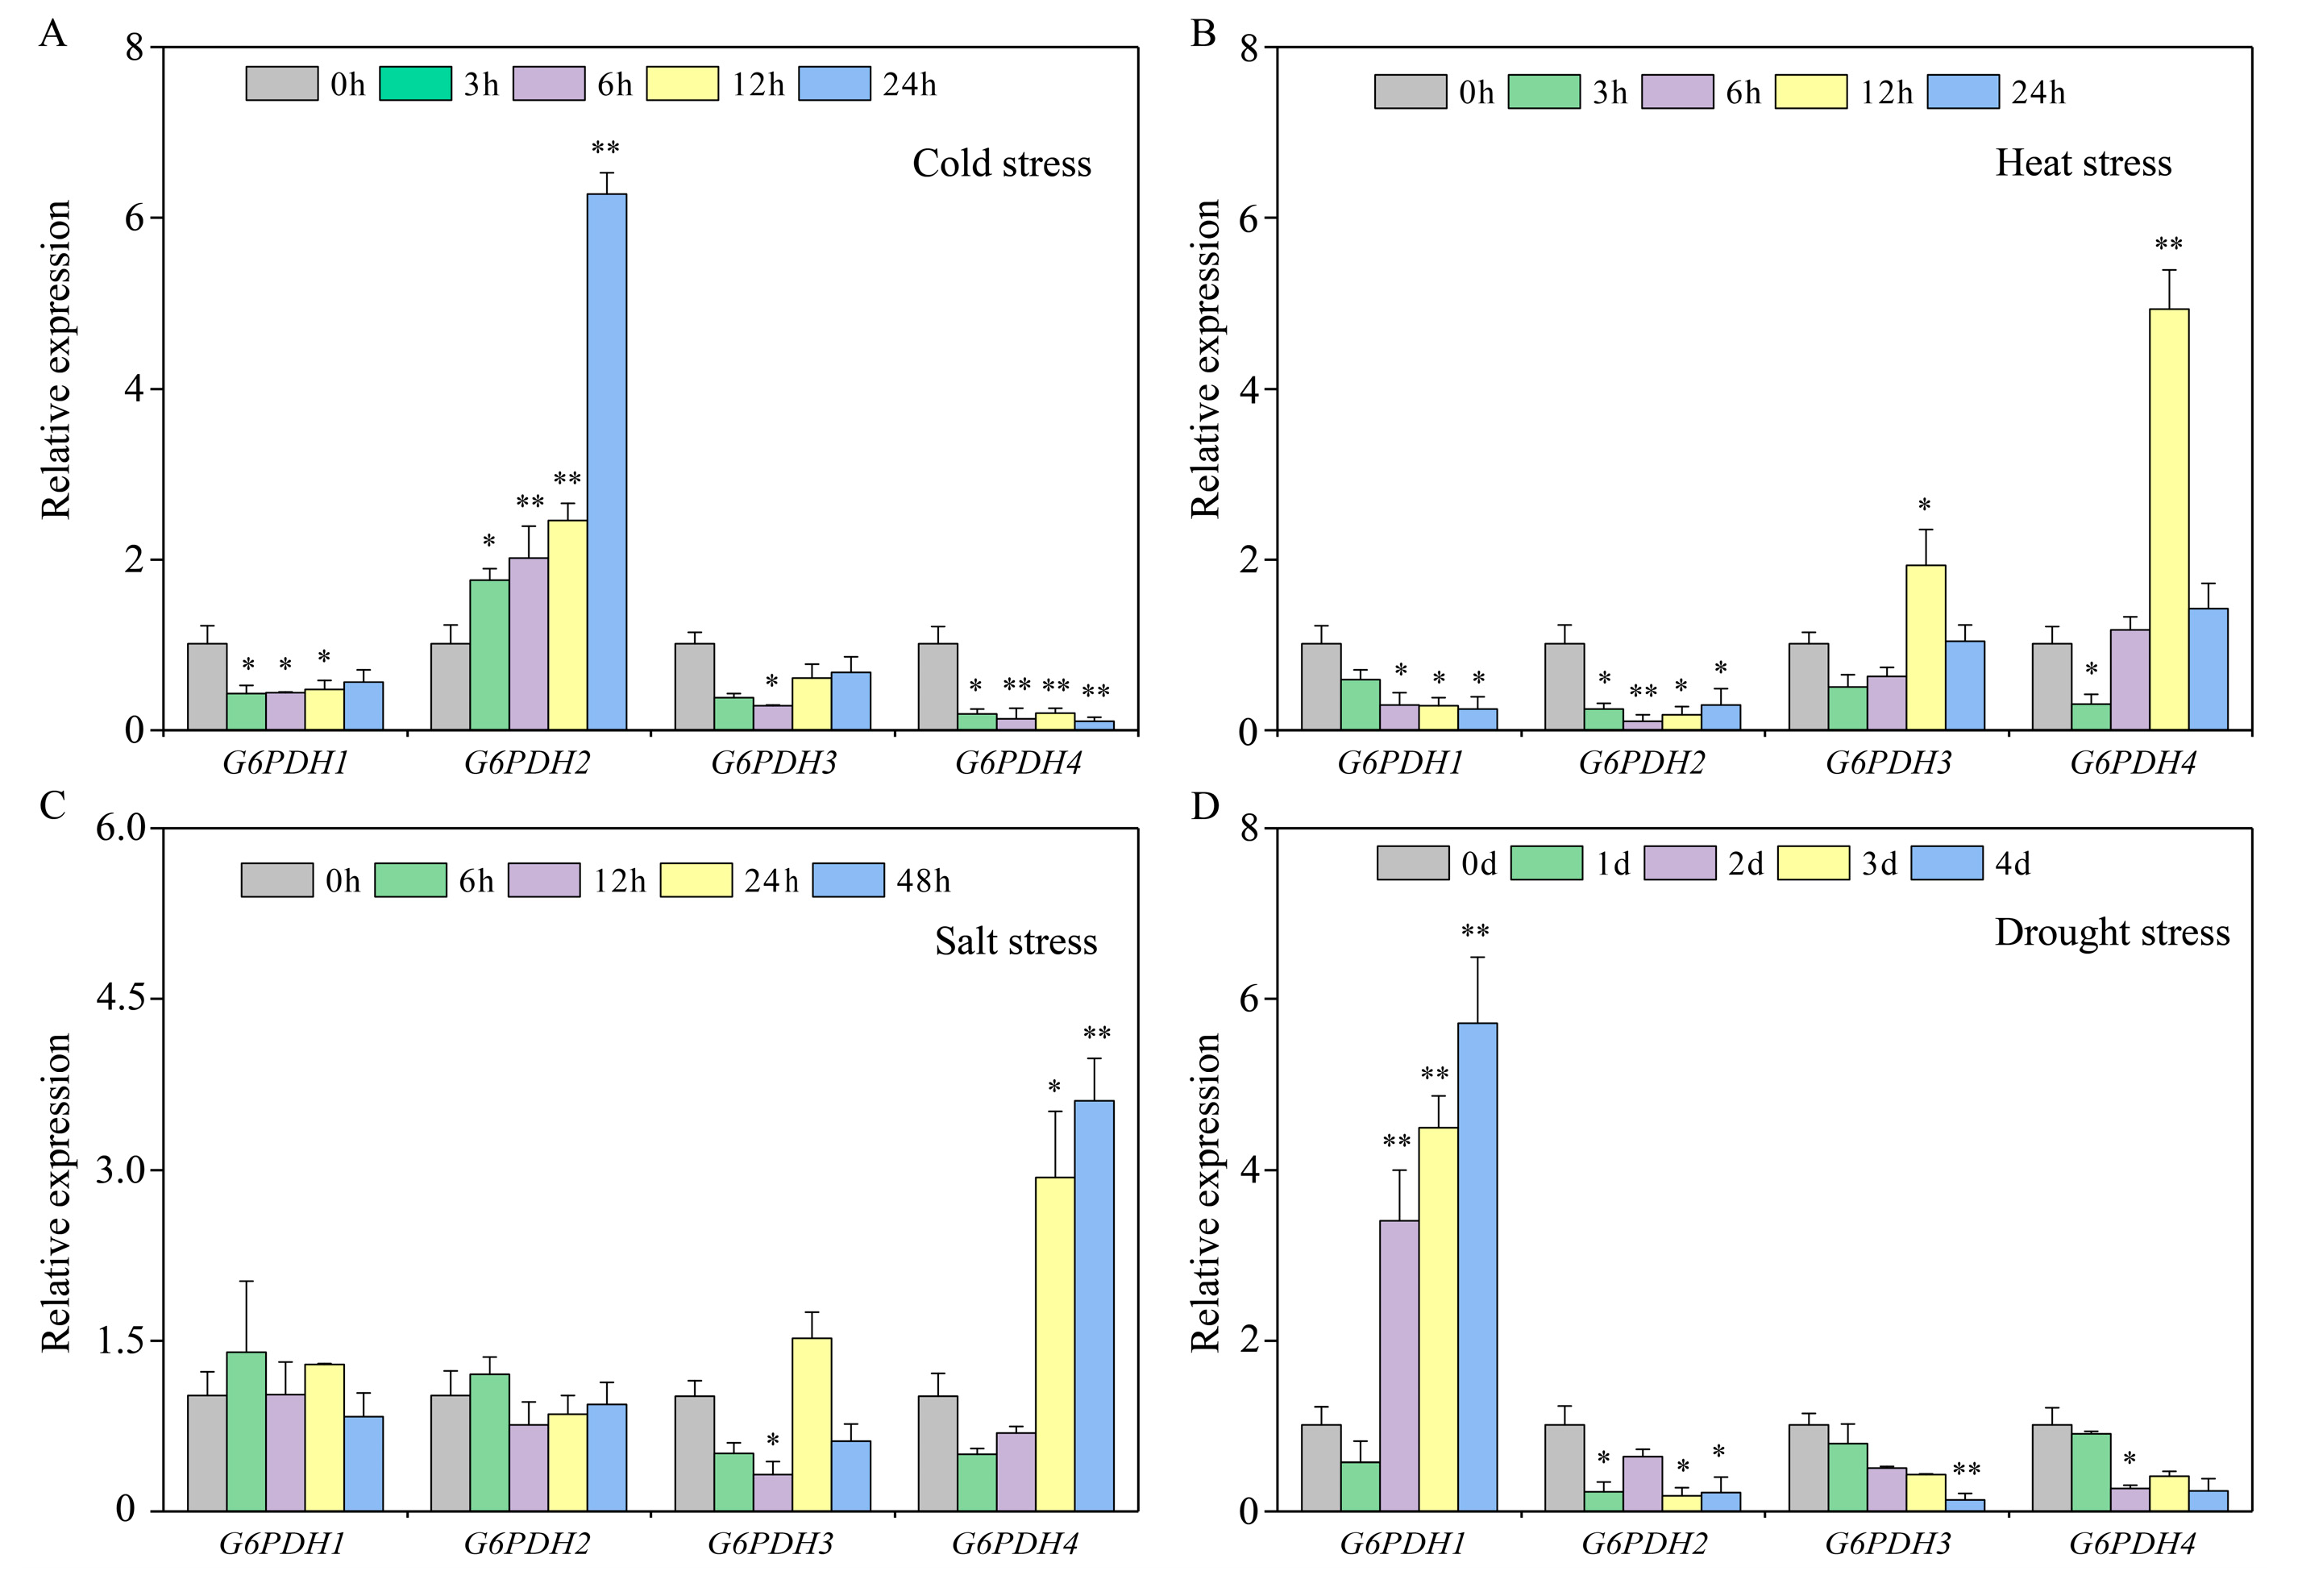
3.7. Expression Profiles of CaG6PDHs Under Different Phytohormone and Stresses Treatments

We analyzed the expression profiles of G6PDH family genes in response to phytohormones (Figure 7A) and abiotic stress (Figure 7B) using transcriptome data from the GEO database. The results indicate that under exogenous hormone treatment, the expression trends of G6PDH family genes in pepper are not significant. Notably, CaG6PDH1 was up-regulated during the later stages of ethylene treatment (at 6 and 12 h), while the transcription levels of CaG6PDH2 and CaG6PDH4 exhibited a pattern of initial increase followed by a decrease under salicylic acid treatment (Figure 7A). Compared to the control group, the expression trends of the four CaG6PDH genes under abiotic stress exhibited notable differences. The transcription level of CaG6PDH2 increased significantly, with the highest expression appearing at 24 and 72 h under cold stress. CaG6PDH1 was only up-regulated after 72 h of treatment, while the CaG6PDH4 displayed a decreasing trend throughout the entire period. Heat treatment induced the expression of CaG6PDH3, CaG6PDH4, and CaG6PDH1, but had no significant effect on the expression of CaG6PDH2. In response to drought stress, the expression levels of CaG6PDH1, CaG6PDH3, and CaG6PDH4 initially increased and then decreased, reaching their maximum expression at 6, 12, and 24 h of treatment, respectively. Similarly to heat stress, drought stress did not induce the expression of CaG6PDH2. Salt stress induced the expression of all four G6PDH genes to varying degrees; specifically, the expression trends of CaG6PDH2, CaG6PDH3, and CaG6PDH4 initially increased and then decreased, while the transcription level of CaG6PDH4 increased, rising with prolonged treatment time (Figure 7B).
In addition, we further analyzed the transcription levels of the G6PDH gene in pepper under stress conditions using RT-qPCR (Figure 8). Consistent with the RNA-seq data, significant differences were observed in the expression levels of CaG6PDH1, CaG6PDH2, and CaG6PDH3 under cold stress. Among these, CaG6PDH2 exhibited an upward trend, reaching its maximum expression at 24 h post-treatment, while CaG6PDH1 and CaG6PDH3 displayed a decreasing trend (Figure 8A). Under heat stress, the transcription levels of CaG6PDH1 and CaG6PDH2 were significantly reduced (Figure 8B). In response to salt stress, the expression of the four G6PDH genes in pepper fluctuated, but no significant differences were noted, except for the expression level of CaG6PDH3 after 12 h of treatment, as well as its expression levels after 24 and 48 h (Figure 8C). Under drought stress, the expression level of CaG6PDH1 significantly increased in the later stages of treatment, while the expression level of CaG6PDH2 significantly decreased (Figure 8D). To investigate the potential function of the G6PDH genes in pepper under cold conditions, we further focused on CaG6PDH2, which experiences a marked increase in transcription levels under cold stress.

3.8. Analysis of CaG6PDH2 Subcellular Localization

Using online software for prediction and phylogenetic tree analysis, we identified CaG6PDH2 as being located in chloroplasts. To further verify whether CaG6PDH2 was expressed in the nucleus, we constructed the pCambia1300-CaG6PDH2-eYFP fusion expression vector (Figure 9A). Following transient expression in tobacco leaves, we observed subcellular localization through fluorescence microscopy. The results indicated that the empty vector was distributed throughout the cell, while the vector carrying the target gene was specifically expressed in chloroplasts (Figure 9B). This finding confirms the accuracy of the results obtained from previous online predictions.

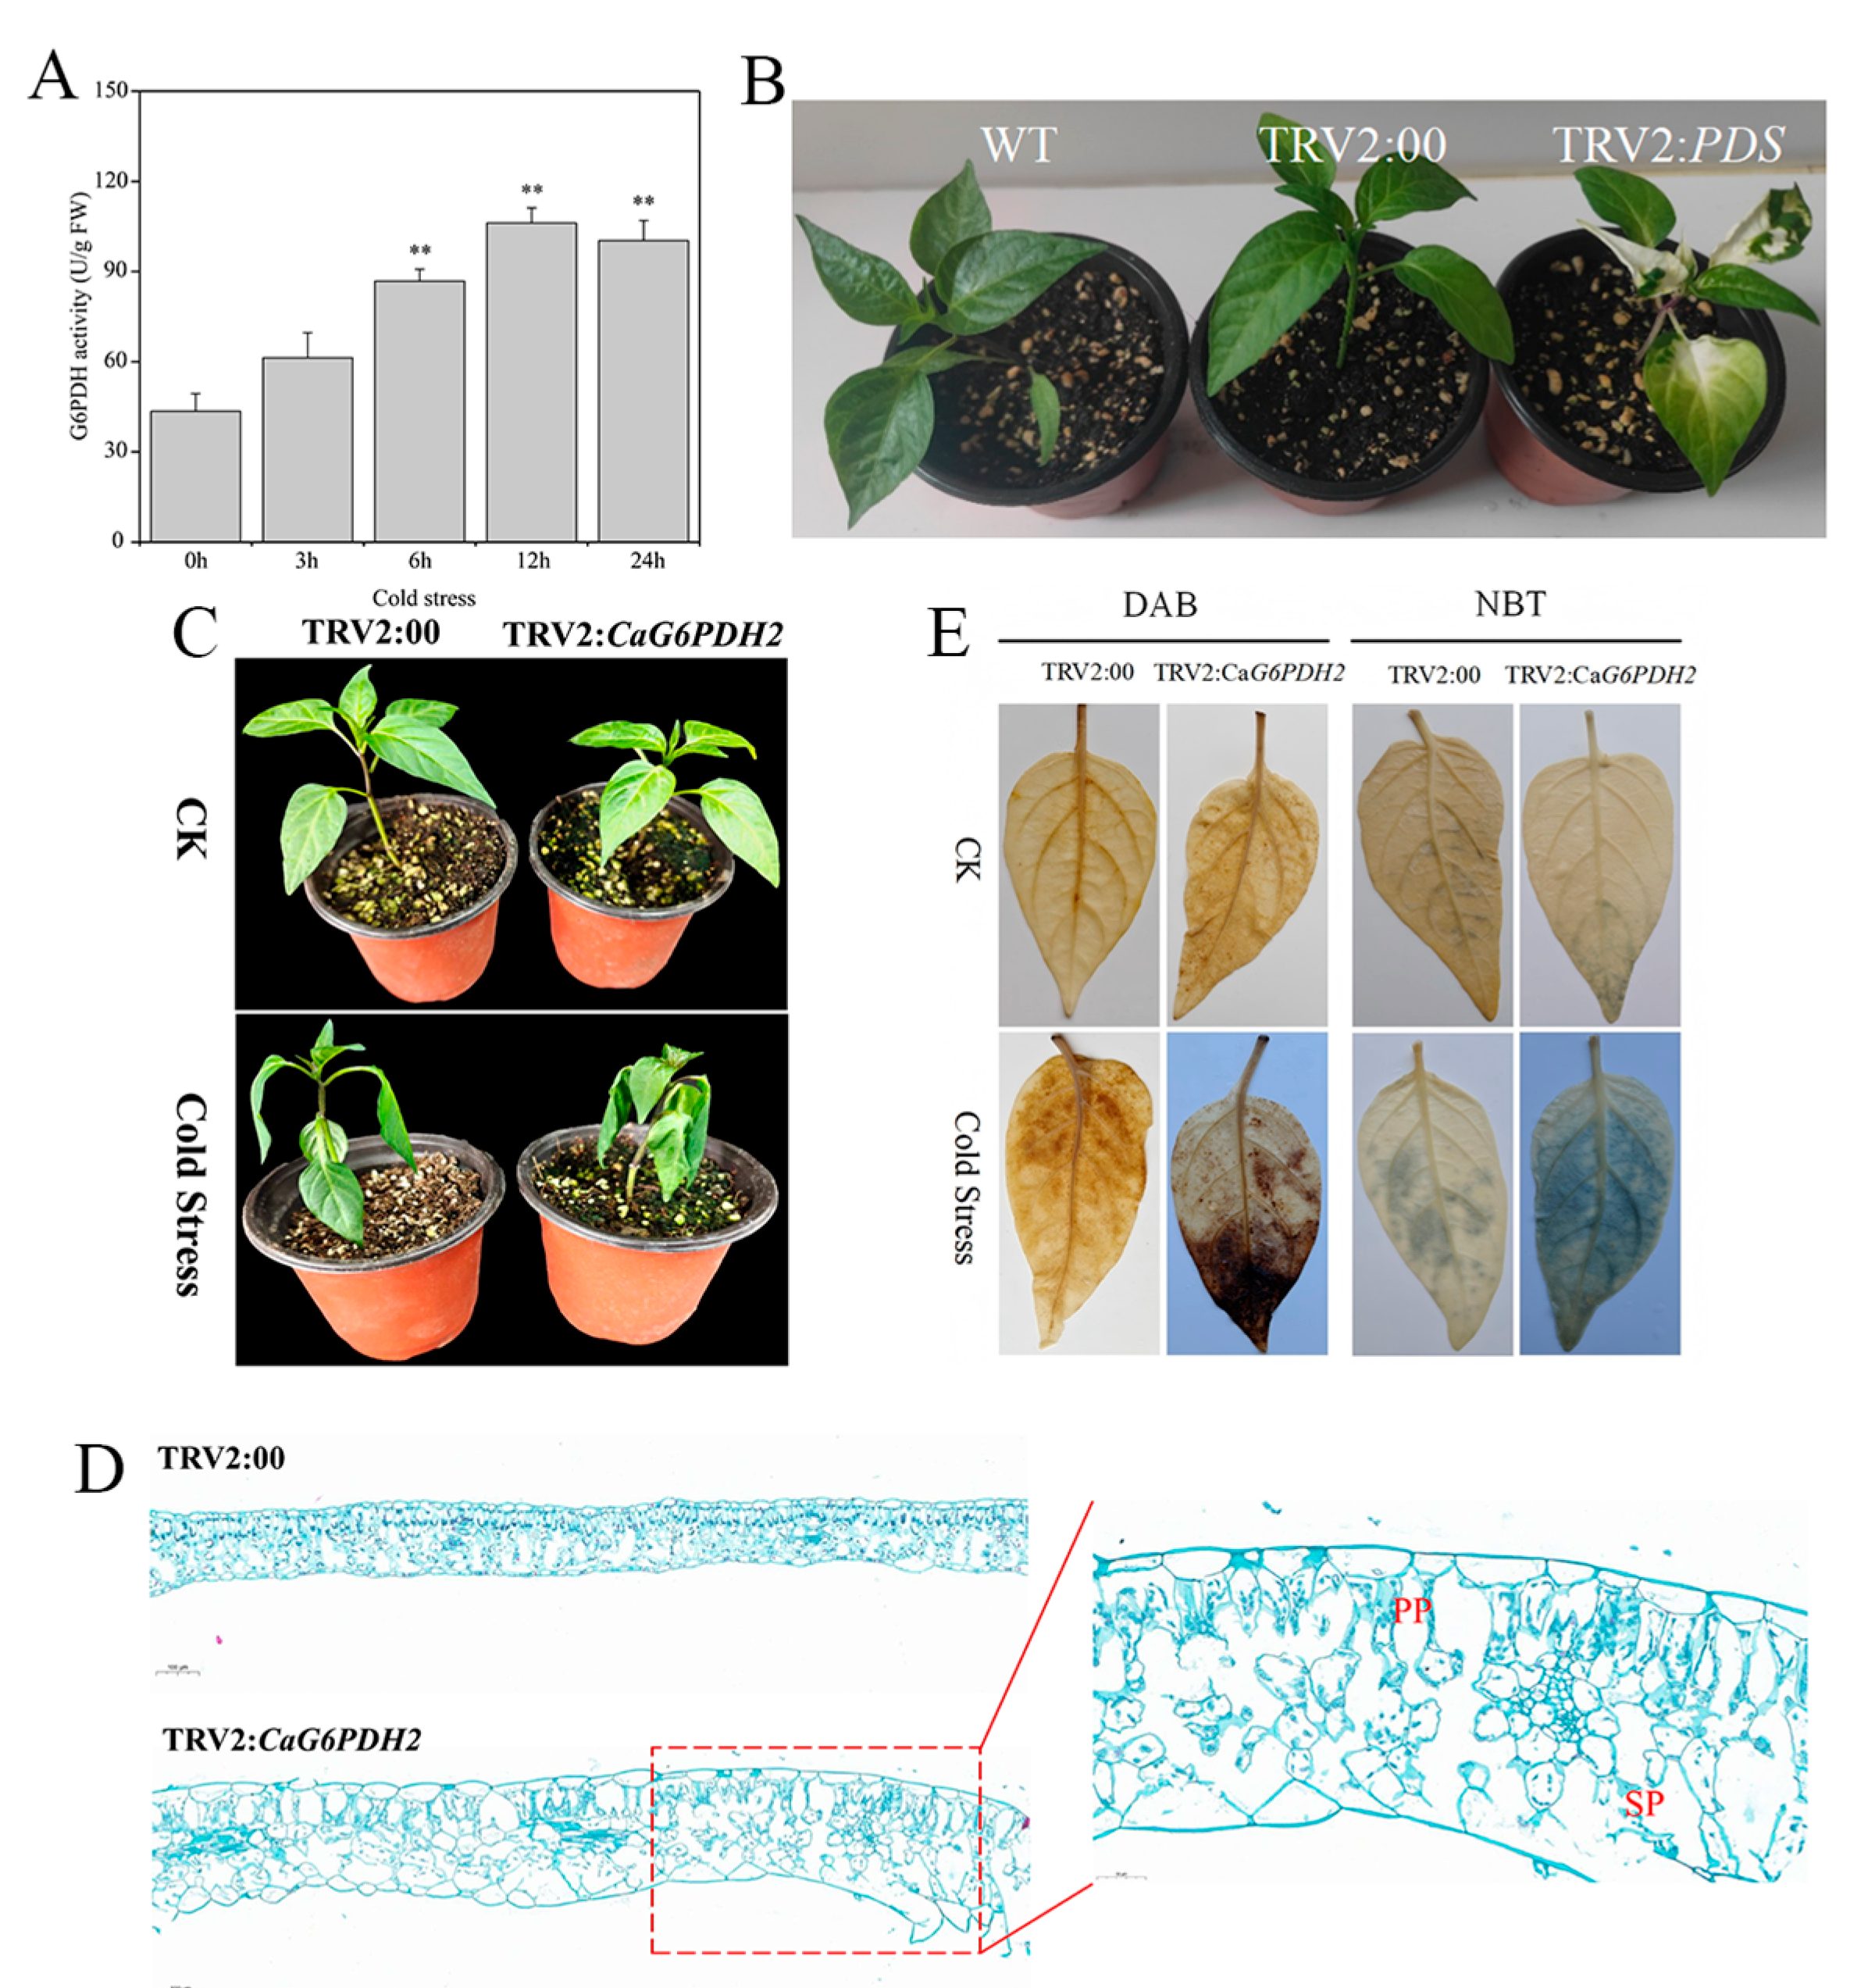
3.9. Identification of Tolerance of Pepper to Cold Stress Treatment

To investigate the role of the CaG6PDH genes, we measured the activity of G6PDH enzyme. Under cold stress, the G6PDH activity in pepper exhibited an initial increase followed by a decrease, peaking at 12 h of treatment, which was 243.83% of the control level (Figure 10A). This finding suggests that the protein encoded by the CaG6PDH gene plays a crucial role in the response to cold stress. Based on the transcription levels of the four CaG6PDH genes under cold stress, we further evaluated the function of CaG6PDH2 using VIGS. After 8–10 d of transient transformation, TRV2:PDS plants (positive control) displayed whitening, which persisted for three weeks and remained clearly visible. In contrast, TRV2:00 plants (negative control) did not exhibit whitening, confirming the successful and stable silencing of the PDS gene (Figure 10B). Subsequently, the accuracy of constructing the CaG6PDH2 recombinant vector (TRV2:CaG6PDH2) was verified through double enzyme digestion, and the expression of CaG6PDH2 in silenced plants was assessed using RT-qPCR (Figure S2). Compared to the controls, the expression of this gene in TRV2:CaG6PDH2 plants was significantly lower than in TRV2:00 plants, indicating that successful gene silencing could be utilized for subsequent experiments (Figure S3).
Under normal temperature conditions, the growth of TRV2:CaG6PDH2 is comparable to that of TRV2:00, with no significant differences in phenotype. However, under cold stress, TRV2:CaG6PDH2 plants exhibited more severe cold damage phenotypes, such as leaf sagging and wilting, compared to the control group (Figure 10C). Additionally, the anatomical structure of TRV2:CaG6PDH2 plant leaves was examined using safranin green staining. Under cold treatment, the leaves of the TRV2:CaG6PDH2 plants displayed a looser cell arrangement, and their palisade and spongy tissues were significantly damaged, resulting in larger intercellular gaps. In contrast, TRV2:00 plants maintained relatively intact tissue structures, further indicating substantial leaf damage in TRV2:CaG6PDH2 plants (Figure 10D). To investigate changes in reactive oxygen species (ROS), we performed staining with 3,3′-diaminobenzidine (DAB) and nitroblue tetrazolium (NBT). The results showed that, compared to those on TRV2:00 plants, TRV2:CaG6PDH2 leaves exhibited a greater number of staining points under cold conditions, indicating a higher accumulation of H2O2 and O2•− (Figure 10E).

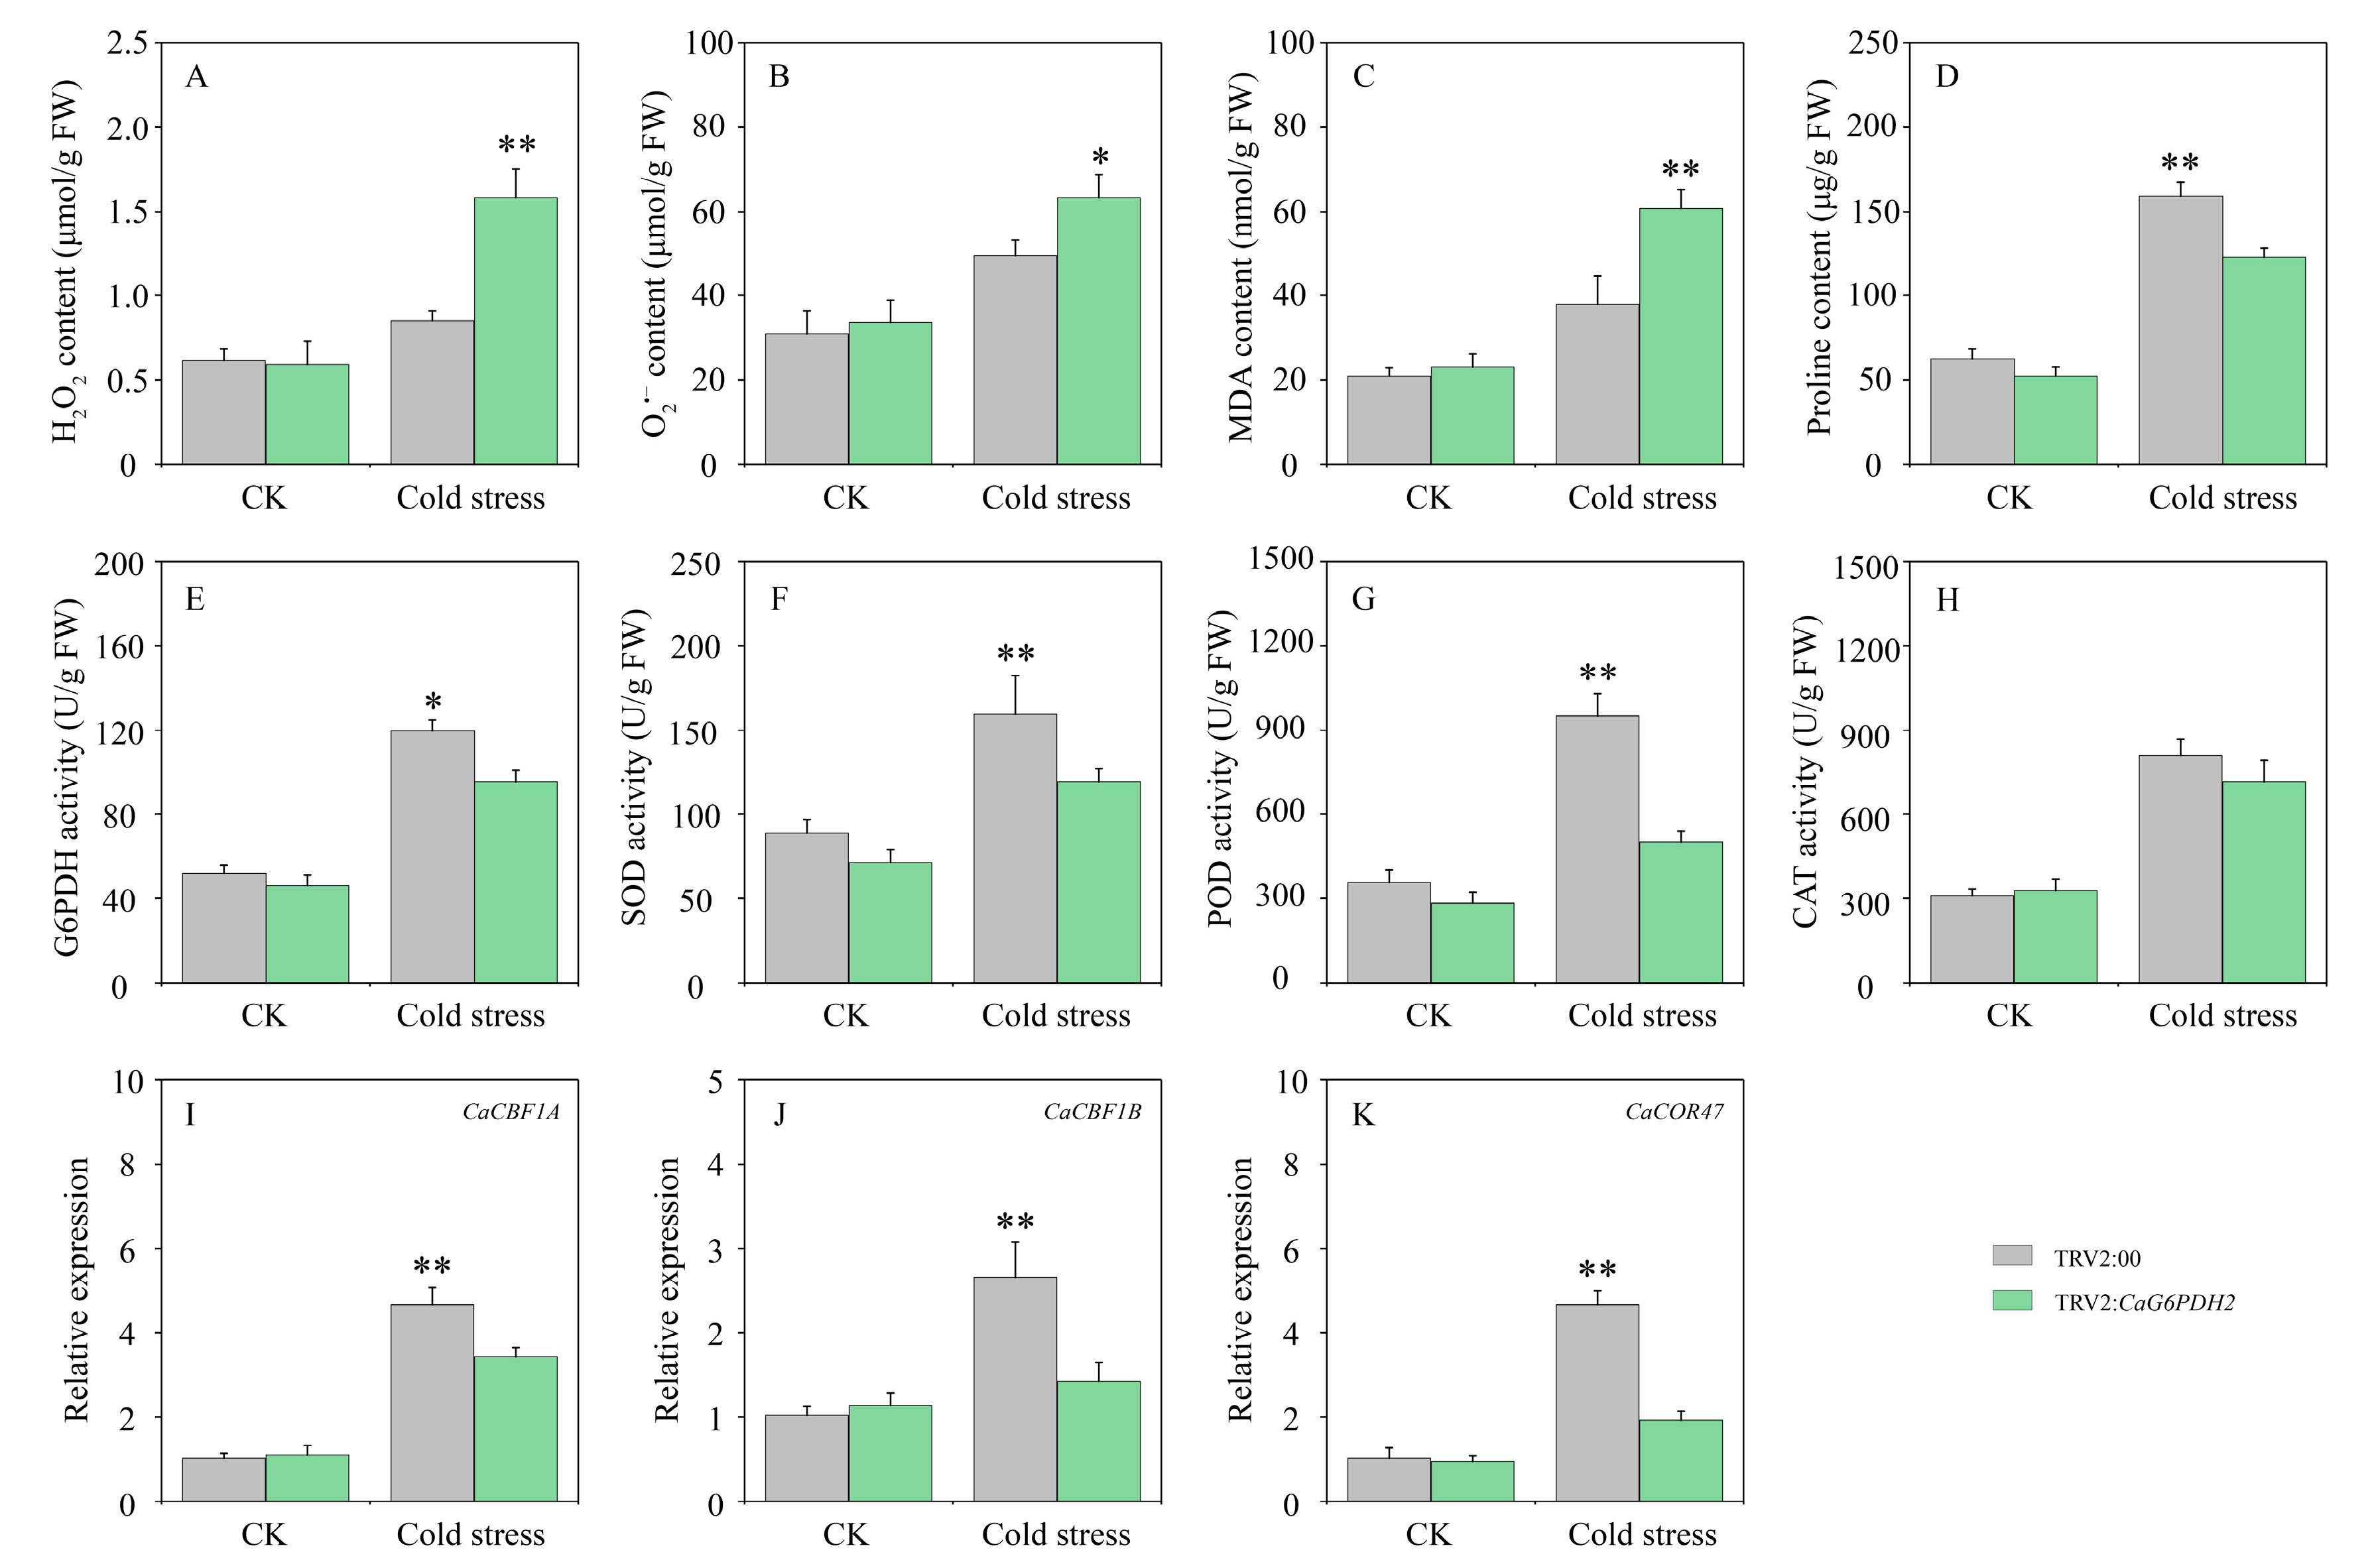
3.10. Determination of Physiological and Biochemical Indicators of Pepper Under Cold Stress

The quantitative analysis of H2O2, O2•−, MDA, and Pro content is commonly employed to assess stress resistance under abiotic stress conditions. Under cold stress, TRV2:CaG6PDH2 plants exhibited a significant increase in H2O2 and O2•− levels compared to control plants, which aligns with the staining results using DAB and NBT (Figure 11A,B). The alterations in ROS content were accompanied by a notable increase in MDA levels and a significant decrease in Pro content (Figure 11C,D). Although the cold environment induced an increase in G6PDH activity in TRV2:CaG6PDH2 plants, this activity was significantly lower than that observed in TRV2:00 plants (Figure 11E). Furthermore, under cold stress, the activities of SOD and POD in TRV2:CaG6PDH2 plants were significantly lower than those in TRV2:00 plants, while CAT activity showed no significant difference compared to control plants (Figure 11F–H). Subsequently, the expression levels of cold-response-related (COR) genes were analyzed using RT-qPCR, and the results indicated that silencing CaG6PDH2 resulted in a significant decrease in the expression levels of CaCBF1A, CaCBF1B, and CaCOR47 (Figure 11I–K). These findings suggest that silencing CaG6PDH2 elevates ROS levels, diminishes antioxidant capacity and the expression of COR genes, and increases the sensitivity of pepper plants to cold stress.

4. Discussion

G6PDH, one of the key enzymes in the PPP pathway, plays a crucial role in the growth, development, and response to abiotic stress of higher plants. The G6PDH gene, which belongs to a small gene family, has been identified in various plant species (such as 11, 4, 6, 19, 5, 9, 4, and 4 members in Arabidopsis thaliana [8], Solanum lycopersicum [43], Oryza sativa [21], Fragaria × ananassa [11], Hordeum vulgare [12], Glycine max [22,44,45], Hevea brasiliensis [13], and Triticum aestivum [20]). However, there is limited information regarding the G6PDH gene family in pepper. Therefore, we conducted a bioinformatics analysis of this gene family to investigate its potential role in responses to abiotic stress, particularly cold stress.
In this article, we identified four G6PDH genes in the ‘Zunla-1’ genome, which are distributed across four chromosomes. These sequences all contain three conserved sites: the substrate binding site, the NADP binding site, and the Rossman fold. However, the similarity among these genes is relatively low, with only 37.93% homology observed between CaG6PDH1 and CaG6PDH4 and the homology of the other sequences generally being less than 55% (Figure 1). Phylogenetic analysis indicates that G6PDH can be divided into four subgroups, with pepper G6PDH members distributed across each subgroup. This distribution is consistent with that of G6PDH in Arabidopsis [8], tomato [43], and soybean [44]. In contrast, G6PDH members from tobacco and rice are only found in the Cy, P1, and P2 subgroups [10,21]. Tandem duplication is one of the primary evolutionary patterns observed in plants, characterized by the presence of multiple gene family members within the same intergenic region or in adjacent intergenic regions. In this study, no tandem duplication events were identified among the members of the G6PDH gene family in pepper. The collinearity analysis revealed that CaG6PDH1 exhibited collinearity with AtG6PDH5 and AtG6PDH6 in Arabidopsis, as well as with SiG6PDH2 in tomato. This suggests that these genes may have originated from a common ancestor and been highly conserved throughout evolution (Figure 3). The Ka, Ks, and Ka/Ks provide a framework for analyzing the positive and negative selection of G6PDH protein sequences, as well as their divergence times among different species [46]. The collinearity analysis of pepper with Arabidopsis and tomato revealed that all four collinearity comparison rates were less than 1. Notably, the ratio between pepper and Arabidopsis was below 0.1, indicating that the G6PDH family has undergone strong purifying selection. Additionally, the G6PDH sequence differentiation times for pepper and Arabidopsis were 116.15 and 141.35 Mya, respectively, while the differentiation times for pepper and tomato were 13.75 and 10.26 Mya, respectively (Table 1). These values are consistent with the species formation times reported in previous studies [35,47]. Furthermore, an analysis of the conserved domains and gene structures of CaG6PDHs, SiG6PDHs, and NtG6PDHs revealed that nearly all the subgroups possess the same number of conserved domains, exons, and introns, which aligns with findings from studies on Arabidopsis [8] and soybean [44]. This further supports the notion that G6PDH is highly conserved throughout the evolutionary process.
Cis-acting elements play a crucial role in the regulation of gene expression by binding to transcription factors [48]. In this study, the promoter regions of the CaG6PDH genes are characterized by four types of elements: stress response, plant hormone response, development, and light response (Figure 5). Notably, the types and quantities of elements present in each member vary, indicating that the CaG6PDH gene exhibits different levels of response to hormones and stress conditions. Therefore, it is hypothesized that there are functional differences among the CaG6PDH genes.
Understanding the expression patterns of gene families in plant tissues is essential for investigating gene function and biological development [49]. Data analysis from public databases has revealed that the CaG6PDH gene exhibits significant tissue specificity during the growth and development of pepper. For instance, CaG6PDH1 is highly expressed in the early stages of fruit development, CaG6PDH2 shows high expression in roots and flower buds, and CaG6PDH3 is significantly more abundant in roots, stems, and leaves compared to other tissues. Furthermore, the expression levels of the four CaG6PDH genes are lower during the fruit color transition and late ripening stages (Figure 6). In strawberries, FaG6PDH12, FaG6PDH13, and FaG6PDH16 are nearly undetectable throughout the entire fruit development stage, while FaG6PDH18 and FaG6PDH1 exhibit higher expression levels [11]. In soybean, the transcripts of GmG6PDH3, GmG6PDH5, and GmG6PDH9 are predominantly found in leaves, whereas the GmG6PDH7 gene is primarily expressed in fruits [44]. In rubber trees, the expression levels of HbG6PDH3 and HbG6PDH4 in latex are significantly higher than in other tissues [13]. These results indicate that the expression patterns of G6PDH genes vary across different plant tissues, suggesting their respective roles in plant development. Consistent with tissue-specific expression findings, the expression of CaG6PDH1 was induced by ethylene treatment, while the expression of CaG6PDH4 was elevated during the mid-stage of salicylic acid treatment. The expression patterns of CaG6PDH2 and CaG6PDH3 were similar, as both were induced by ABA treatment (Figure 7). Previous studies have shown that the overexpression of AtG6PD5 in plants leads to the inactivation of the ABA signaling pathway, which negatively regulates the growth of meristematic tissues and primary roots in the elongation zone of Arabidopsis [14]. Additionally, the overexpression of G6PDH1 in soybean cytoplasm promotes the accumulation of ROS under aluminum stress and triggers programmed cell death by enhancing G6PDH activity, with ABA playing an upstream role in this process [44].
Further integration with RT-qPCR data revealed that the CaG6PDH genes exhibit specific expression patterns under abiotic stresses. The expression levels of CaG6PDH4 and CaG6PDH1 were significantly reduced under cold treatment, while their transcription levels significantly increased under drought and salt treatments, respectively. In contrast, the expression level of CaG6PDH2 significantly increased under cold treatment, which aligns with RNA-seq data (Figure 8). The expression level of CaG6PDH3 did not fluctuate significantly under various treatments, suggesting that it may not be the primary gene responding to abiotic stresses; however, further research is needed to draw definitive conclusions.
Currently, studies have demonstrated that plant G6PDH genes play a crucial role in the response to cold stress. In Arabidopsis, P1-G6PDH mutants enhance cold tolerance by up-regulating photosynthetic efficiency and the expression of COR genes [50]. Research has also indicated that the G6PDH gene positively regulates cold stress resistance in maize and strawberries [24,25]. In this study, we hypothesized that CaG6PDH2 is involved in the response of pepper plants to cold stress. To test this hypothesis, we generated CaG6PDH2-silenced plants using double enzyme digestion followed by RT-qPCR identification (Figure 10). The results revealed that exposure to cold stress caused the leaves of the TRV2:CaG6PDH2 plants to droop and wilt, with significant damage to the cell tissue, exhibiting a pronounced cold damage phenotype. MDA serves as a biomarker for oxidative stress, allowing for the measurement of membrane lipid peroxidation [51]. H2O2 and O2•− are the primary components of ROS. When plants experience severe cold stress, elevated levels of ROS are produced, leading to oxidative stress and tissue deterioration [52]. Of course, the antioxidant enzyme systems (SOD, POD, CAT) evolved by plants can effectively eliminate excessive ROS, and their activity is generally believed to be positively correlated with plant resistance [53]. Consistent with the phenotypic results, elevated levels of ROS and MDA indicate that CaG6PDH2-silenced plants experience greater stress than the control group, accompanied by significant reductions in Pro content, antioxidant enzyme activity, and the expression levels of COR genes (Figure 11). Additionally, under cold stress, the G6PDH activity in TRV2:CaG6PDH2 plants was significantly reduced, which aligns with findings in wheat [54]. It can be inferred that silencing CaG6PDH2 leads to the accumulation of excessive ROS, a reduction in the activity of antioxidant enzymes and G6PDH, and a decrease in the expression of COR genes, thereby making the plants more susceptible to cold stress. However, current research on the response of plant G6PDH to cold stress primarily focuses on gene function, and its regulatory network remains unclear, necessitating further investigation.

5. Conclusions

This study identified four CaG6PDH family genes within the pepper genome. Phylogenetic analysis indicates that these four G6PDH genes are categorized into four distinct subfamilies, which aligns with classification based on conserved motifs and gene structures. Collinearity analysis revealed two collinear pairs between the CaG6PDH genes in pepper and the G6PDH genes in Arabidopsis and tomato, respectively, and that the evolution of these sequences was driven by purifying selection. The identification of cis-acting elements in the promoter implies that the CaG6PDH genes may play a crucial role in plants’ response to various stresses and hormones. Gene expression analysis demonstrated that CaG6PDH members exhibit tissue-specific expression, and treatments with abiotic stresses induced the expression of these genes to varying extents. Subcellular localization indicated that CaG6PDH2 is situated in chloroplasts. Research utilizing VIGS technology showed that CaG6PDH2 regulates the response of pepper to cold stress by influencing ROS balance, antioxidant enzyme activity, and the expression of COR genes. These findings suggest that CaG6PDH2 plays a significant role in the response to cold stress.

Supplementary Materials

The following supporting information can be downloaded at: https://www.mdpi.com/article/10.3390/horticulturae11070719/s1, Figure S1: Chromosomal distribution of CaG6PDH genes in pepper; Figure S2: The recombinant vector double enzyme digestion of the silenced fragments of CaG6PDH2 in pepper. a represents the amplification of the target gene, while b represents double enzyme digestion validation; Figure S3: Analysis of silencing efficiency of CaG6PDH2 by RT-qPCR; Table S1: Details of G6PDH gene family in pepper; Table S2: Primers used for VIGS and RT-qPCR in pepper.

Author Contributions

Conceptualization, J.Z., Q.Y. and H.L.; supervision, Q.Y. and H.L.; methodology, J.F., Q.Y. and H.L.; software, X.C. and Q.Y.; guidance for experimental, Q.Y.; test sample processing and collection—J.F. and Z.T.; experimental operation—J.F. and Z.T.; writing—original draft preparation, J.Z., Y.J. and H.L.; writing—review and editing, J.Z., Q.Y. and H.L.; funding acquisition—J.Z. All authors have read and agreed to the published version of the manuscript.

Funding

This work was supported by the Growth of Young Scientific and Technological Talents of Guizhou Educational Commission (Qian Jiaoji [2024] 233), the Qiandongnan Science and Technology Plan Project (Qiandongnan kehejichu [2024] 0009), the Specialized Fund for the Doctoral of Kaili University (grant no. BS20240213), the Key Laboratory of the Department of Education of Guizhou Province (no. Qianjiaoji [2022] 053), and the Guizhou Provincial Basic Research Program (Natural Science) (Qiankehejichu MS [2025] 050).

Data Availability Statement

The original contributions presented in this study are included in the article. Further inquiries can be directed to the corresponding author(s).

Conflicts of Interest

The authors declare no conflicts of interest.

References

  1. Krüger, A.; Grüning, N.M.; Wamelink, M.M.; Kerick, M.; Kirpy, A.; Parkhomchuk, D.; Bluemlein, K.; Schweiger, M.R.; Soldatov, A.; Lehrach, H. The pentose phosphate pathway is a metabolic redox sensor and regulates transcription during the antioxidant response. Antioxid. Redox Signal. 2011, 15, 311–324. [Google Scholar] [CrossRef] [PubMed]
  2. Caretto, S.; Linsalata, V.; Colella, G.; Mita, G.; Lattanzio, V. Carbon fluxes between primary metabolism and phenolic pathway in plant tissues under stress. Int. J. Mol. Sci. 2015, 16, 26378–26394. [Google Scholar] [CrossRef] [PubMed]
  3. Wood, T. Physiological functions of the pentose phosphate pathway. Cell Biochem. Funct. 1986, 4, 241–247. [Google Scholar] [CrossRef]
  4. von Schaewen, A.; Langenkamper, G.; Graeve, K.; Wenderoth, I.; Scheibe, R. Molecular characterization of the plastidic glucose-6-phosphate-dehydrogenase from potato in comparison to its cytosolic counterpart. Plant Physiol. 1995, 109, 1327–1335. [Google Scholar] [CrossRef] [PubMed]
  5. Kruger, N.J.; von Schaewen, A. The oxidative pentose phosphate pathway: Structure and organisation. Curr. Opin. Plant Biol. 2003, 6, 236–246. [Google Scholar] [CrossRef]
  6. Yang, L.; Wang, X.; Chang, N.; Nan, W.; Wang, S.; Ruan, M.; Bi, Y. Cytosolic glucose-6-phosphate dehydrogenase is involved in seed germination and root growth under salinity in Arabidopsis. Front. Plant Sci. 2019, 10, 182. [Google Scholar] [CrossRef]
  7. Wakao, S.; Andre, C.; Benning, C. Functional analyses of cytosolic glucose-6-phosphate dehydrogenases and their contribution to seed oil accumulation in Arabidopsis. Plant Physiol. 2008, 146, 277–288. [Google Scholar] [CrossRef]
  8. Wakao, S.; Benning, C. Genome-wide analysis of glucose-6-phosphate dehydrogenases in Arabidopsis. Plant J. 2005, 41, 243–256. [Google Scholar] [CrossRef]
  9. Siddappaji, M.H.; Scholes, D.R.; Bohn, M.; Paige, K.N. Overcompensation in response to herbivory in Arabidopsis thaliana: The role of glucose-6-phosphate dehydrogenase and the oxidative pentose-phosphate pathway. Genetics 2013, 195, 589–598. [Google Scholar] [CrossRef]
  10. Gong, H.; Chen, G.; Li, F.; Wang, X.; Hu, Y.; Bi, Y. Involvement of G6PDH in heat stress tolerance in the calli from Przewalskia tangutica and Nicotiana tabacum. Biol. Plant. 2012, 56, 422–430. [Google Scholar] [CrossRef]
  11. Lei, D.Y.; Lin, Y.X.; Luo, M.W.; Zhao, B.; Tang, H.L.; Zhou, X.; Yao, W.T.; Zhang, Y.T.; Wang, Y.; Li, M.Y.; et al. Genome-wide investigation of G6PDH gene in strawberry: Evolution and expression analysis during development and stress. Int. J. Mol. Sci. 2022, 23, 4728. [Google Scholar] [CrossRef] [PubMed]
  12. Feng, R.J.; Wang, X.M.; He, L.; Wang, S.W.; Li, J.J.; Jin, J.; Bi, Y.R. Identification, characterization, and stress responsiveness of glucose-6-phosphate dehydrogenase genes in highland barley. Plants 2020, 9, 1800. [Google Scholar] [CrossRef] [PubMed]
  13. Long, X.Y.; He, B.; Fang, Y.J.; Tang, C.R. Identification and Characterization of the Glucose-6-Phosphate dehydrogenase gene family in the para rubber tree, Hevea brasiliensis. Front. Plant Sci. 2016, 7, 215. [Google Scholar] [CrossRef]
  14. Yang, L.; Wang, S.W.; Sun, L.L.; Ruan, M.J.; Li, S.F.; He, R.; Zhang, W.Y.; Liang, C.F.; Wang, X.M.; Bi, Y.R. Involvement of G6PD5 in ABA response during seed germination and root growth in Arabidopsis. BMC Plant Biol. 2019, 19, 44. [Google Scholar] [CrossRef]
  15. Kong, W.F.; Chen, J.Y.; Hou, Z.X.; Wen, P.F.; Zhan, J.C.; Pan, Q.H.; Huang, W.D. Activity and subcellular localization of glucose-6-phosphate dehydrogenase in peach fruits. J. Plant Physiol. 2007, 164, 934–944. [Google Scholar] [CrossRef]
  16. Muñoz-Vargas, M.A.; González-Gordo, S.; Taboada, J.; Palma, J.M.; Corpas, F.J. In Silico RNAseq and Biochemical Analyses of Glucose-6-Phosphate Dehydrogenase (G6PDH) from Sweet Pepper Fruits: Involvement of Nitric Oxide (NO) in Ripening and Modulation. Plants 2023, 12, 3408. [Google Scholar] [CrossRef] [PubMed]
  17. Wei, M.L.; Ge, Y.H.; Li, C.Y.; Han, X.; Qin, S.C.; Chen, Y.R.; Tang, Q.; Li, J.R. G6PDH regulated NADPH production and reactive oxygen species metabolism to enhance disease resistance against blue mold in apple fruit by acibenzolar-S-methyl. Postharvest Biol. Technol. 2019, 148, 228–235. [Google Scholar] [CrossRef]
  18. Wei, X.B.; Huang, X.L.; Yang, W.L.; Wang, X.R.; Guan, T.; Kang, Z.S.; Liu, J. A chloroplast-localized Glucose-6-Phosphate dehydrogenase positively regulates stripe rust resistance in wheat. Int. J. Mol. Sci. 2022, 24, 459. [Google Scholar] [CrossRef]
  19. Hu, Y.F.; You, J.; Li, J.S.; Wang, C.L. Loss of cytosolic glucose-6-phosphate dehydrogenase increases the susceptibility of Arabidopsis thaliana to root-knot nematode infection. Ann. Bot. 2019, 123, 37–46. [Google Scholar] [CrossRef]
  20. Nemoto, Y.; Sasakuma, T. Specific expression of glucose-6-phosphate dehydrogenase (G6PDH) gene by salt stress in wheat (Triticum aestivum L.). Plant Sci. 2000, 158, 53–60. [Google Scholar] [CrossRef]
  21. Zhang, L.; Liu, J.; Wang, X.M.; Bi, Y.R. Glucose-6-phosphate dehydrogenase acts as a regulator of cell redox balance in rice suspension cells under salt stress. Plant Growth Regul. 2013, 69, 139–148. [Google Scholar] [CrossRef]
  22. Wang, H.H.; Hou, J.J.; Li, Y.; Zhang, Y.Y.; Huang, J.J.; Liang, W.H. Nitric oxide-mediated cytosolic glucose-6-phosphate dehydrogenase is involved in aluminum toxicity of soybean under high aluminum concentration. Plant Soil 2017, 416, 39–52. [Google Scholar] [CrossRef]
  23. Lin, Y.; Lin, S.; Guo, H.; Zhang, Z.; Chen, X. Functional analysis of PsG6PDH, a cytosolic glucose-6-phosphate dehydrogenase gene from Populus suaveolens, and its contribution to cold tolerance improvement in tobacco plants. Biotechnol. Lett. 2013, 35, 1509–1518. [Google Scholar] [CrossRef] [PubMed]
  24. Zhang, Y.T.; Luo, M.W.; Cheng, L.J.; Lin, Y.X.; Chen, Q.; Sun, B.; Gu, X.J.; Wang, Y.; Li, M.Y.; Luo, Y.; et al. Identification of the cytosolic Glucose-6-Phosphate dehydrogenase gene from strawberry involved in cold stress response. Int. J. Mol. Sci. 2020, 21, 7322. [Google Scholar] [CrossRef]
  25. Li, X.; Cai, Q.; Yu, T.; Li, S.J.; Li, S.N.; Li, Y.L.; Sun, Y.; Ren, H.L.; Zhang, J.J.; Zhao, Y.; et al. ZmG6PDH1 in glucose-6-phosphate dehydrogenase family enhances cold stress tolerance in maize. Front Plant Sci. 2023, 14, 1116237. [Google Scholar] [CrossRef]
  26. Zou, Z.Y.; Zou, X.X. Geographical and ecological differences in pepper cultivation and consumption in China. Front. Nutr. 2021, 8, 718517. [Google Scholar] [CrossRef]
  27. Yu, C.S.; Chen, Y.C.; Lu, C.H.; Hwang, J.K. Prediction of protein subcellular localization. Proteins-Struct. Funct. Bioinform. 2006, 64, 643–651. [Google Scholar] [CrossRef]
  28. Thompson, J.D.; Gibson, T.J.; Higgins, D.G. Multiple sequence alignment using ClustalW and ClustalX. Curr. Protoc. Bioinform. 2002, 2, 2.3.1–2.3.22. [Google Scholar] [CrossRef]
  29. Bailey, T.L.; Johnson, J.; Grant, C.E.; Noble, W.S. The MEME Suite. Nucleic Acids Res. 2015, 43, W39–W49. [Google Scholar] [CrossRef]
  30. Hu, B.; Jin, J.P.; Guo, A.Y.; Zhang, H.; Luo, J.C.; Gao, C. GSDS 2.0: An upgraded gene feature visualization server. Bioinformatics 2015, 31, 1296–1297. [Google Scholar] [CrossRef]
  31. Chen, C.; Chen, H.; Zhang, Y.; Thomas, H.R.; Frank, M.H.; He, Y.; Xia, R. TBtools: An integrative Toolkit developed for interactive analyses of big biological data. Mol. Plant 2020, 13, 1194–1202. [Google Scholar] [CrossRef] [PubMed]
  32. Wang, Y.P.; Tang, H.B.; DeBarry, J.D.; Tan, X.; Li, J.P.; Wang, X.Y.; Lee, T.H.; Jin, H.Z.; Marler, B.; Guo, H.; et al. MCScanX: A toolkit for detection and evolutionary analysis of gene synteny and collinearity. Nucleic Acids Res. 2012, 40, e49. [Google Scholar] [CrossRef] [PubMed]
  33. Rozas, J.; Ferrer-Mata, A.; Sánchez-DelBarrio, J.C.; Guirao-Rico, S.; Librado, P.; Ramos-Onsins, S.E.; Sánchez-Gracia, A. DnaSP 6: DNA sequence polymorphism analysis of large datasets. Mol. Biol. Evol. 2017, 34, 3299–3302. [Google Scholar] [CrossRef] [PubMed]
  34. Kim, S.; Park, M.; Yeom, S.; Kim, Y.M.; Lee, J.M.; Lee, H.A.; Seo, E.; Choi, J.; Cheong, K.; Kim, K.T.; et al. Genome sequence of the hot pepper provides insights into the evolution of pungency in Capsicum species. Nat. Genet. 2014, 46, 270–278. [Google Scholar] [CrossRef]
  35. Qin, C.; Yu, C.S.; Shen, Y.O.; Fang, X.D.; Chen, L.; Min, J.M.; Cheng, J.W.; Zhao, S.C.; Xu, M.; Luo, Y.; et al. Whole-genome sequencing of cultivated and wild pepper provides insights into capsicum domesti-cation and specialization. Proc. Natl. Acad. Sci. USA 2014, 111, 5135–5140. [Google Scholar] [CrossRef]
  36. Lee, J.; Nam, J.Y.; Jang, H.; Kim, N.; Kim, Y.M.; Kang, W.H.; Yeom, S.I. Comprehensive transcriptome resource for response to phytohormone-induced signaling in Capsicum annuum L. BMC Res. Notes 2020, 13, 440. [Google Scholar] [CrossRef]
  37. Kang, W.H.; Sim, Y.M.; Koo, N.; Nam, J.Y.; Lee, J.; Kim, N.; Jang, H.; Kim, Y.M.; Yeom, S.I. Transcriptome profiling of abiotic responses to heat, cold, salt, and osmotic stress of Capsicum annuum L. Sci. Data 2020, 7, 17. [Google Scholar] [CrossRef]
  38. Yin, Y.X.; Wang, S.B.; Xiao, H.J.; Zhang, H.X.; Zhang, Z.; Jing, H.; Zhang, Y.L.; Chen, R.G.; Gong, Z.H. Overexpression of the CaTIP1-1 pepper gene in tobacco enhances resistance to osmotic stresses. Int. J. Mol. Sci. 2014, 15, 20101–20116. [Google Scholar] [CrossRef]
  39. Livak, K.J.; Schmittgen, T.D. Analysis of relative gene expression data using real-time quantitative PCR and the 2−ΔΔCT Method. Methods 2001, 25, 402–408. [Google Scholar] [CrossRef]
  40. Fernandez-Pozo, N.; Rosli, H.G.; Martin, G.B.; Mueller, L.A. The SGN VIGS Tool: User-friendly software to design virus-induced gene silencing (VIGS) constructs for functional genomics. Mol. Plant 2014, 8, 486–488. [Google Scholar] [CrossRef]
  41. Velásquez, A.; Chakravarthy, S.; Martin, G. Virus-induced gene silencing (VIGS) in Nicotiana benthamiana and tomato. J. Vis. Exp. 2009, 28, e1292. [Google Scholar] [CrossRef]
  42. Zhang, J.W.; Chen, Y.; He, J.; Wang, D.; Jiang, Y.; Chen, X.J.; Yang, Q.; Li, H.X. Genome-wide identification of LACS family genes and functional characterization of CaLACS6/9 in response to cold stress in pepper (Capsicum annuum L.). Agronomy 2025, 15, 970. [Google Scholar] [CrossRef]
  43. Landi, S.; Nurcato, B.; Lillo, A.D.; Lentini, M.; Grillo, S.; Esposito, S. Glucose-6-phosphate dehydrogenase plays a central role in the response of tomato (Solanum lycopersicum) plants to short and long-term drought. Plant Physiol. Biochem. 2016, 105, 79–89. [Google Scholar] [CrossRef] [PubMed]
  44. Huang, J.J.; Han, R.Z.; Ji, F.; Yu, Y.Y.; Wang, R.Y.; Hai, Z.X.; Liang, W.H.; Wang, H.H. Glucose-6-phosphate dehydrogenase and abscisic acid mediate programmed cell death induced by aluminum toxicity in soybean root tips. J. Hazard. Mater. 2022, 425, 127964. [Google Scholar] [CrossRef]
  45. Jin, J.; Li, K.K.; Qin, J.; Yan, L.L.; Wang, S.W.; Zhang, G.H.; Wang, X.M.; Bi, Y.R. The response mechanism to salt stress in Arabidopsis transgenic lines over-expressing of GmG6PD. Plant Physiol. Biochem. 2021, 162, 74–85. [Google Scholar] [CrossRef]
  46. Ito, T.M.; Trevizan, C.B.; Santos, T.B.D.; Souza, S.G.H.D. Genome-wide identification and characterization of the Dof transcription factor gene family in Phaseolus vulgaris L. Am. J. Plant Sci. 2017, 8, 3233–3257. [Google Scholar] [CrossRef]
  47. Consortium, T.G. The tomato genome sequence provides insights into fleshy fruit evolution. Nature 2012, 485, 635–641. [Google Scholar] [CrossRef] [PubMed]
  48. Hernandez-Garcia, C.M.; Finer, J.J. Identification and validation of promoters and cis-acting regulatory elements. Plant Sci. 2014, 217, 109–119. [Google Scholar] [CrossRef]
  49. Islam, T.; Manna, M.; Kaul, T.; Pandey, S.; Reddy, C.S.; Reddy, M. Genome-wide dissection of Arabidopsis and rice for the identification and expression analysis of glutathione peroxidases reveals their stress-specific and overlapping response patterns. Plant Mol. Biol. Rep. 2015, 33, 1413–1427. [Google Scholar] [CrossRef]
  50. Esposito, S. Nitrogen assimilation, abiotic stress and Glucose 6-Phosphate dehydrogenase: The full circle of reductants. Plants 2016, 5, 24. [Google Scholar] [CrossRef]
  51. Dimitrios, T. Assessment of lipid peroxidation by measuring malondialdehyde (MDA) and relatives in biological samples: Analytical and biological challenges. Anal. Biochem. 2017, 524, 13–30. [Google Scholar] [CrossRef]
  52. Baxter, A.; Suzuki, N.; Mittler, R. ROS as key players in plant stress signalling. J. Exp. Bot. 2014, 65, 1229–1240. [Google Scholar] [CrossRef] [PubMed]
  53. Huchzermeyer, B.; Menghani, E.; Khardia, P.; Shilu, A. Metabolic pathway of natural antioxidants, antioxidant enzymes and ROS providence. Antioxidants 2022, 11, 761. [Google Scholar] [CrossRef]
  54. Tian, Y.; Peng, K.K.; Bao, Y.Z.; Zhang, D.; Meng, J.; Wang, D.J.; Wang, X.N.; Cang, J. Glucose-6-phosphate dehydrogenase and 6-phosphogluconate dehydrogenase genes of winter wheat enhance the cold tolerance of transgenic Arabidopsis. Plant Physiol. Biochem. 2021, 161, 86–97. [Google Scholar] [CrossRef] [PubMed]
Figure 1. Multiple alignment of pepper and Arabidopsis G6PDH protein sequences. Conserved areas of Rossman fold, substrate binding site, and NADP binding site marked with red lines. Black and gray backgrounds represent identical and similar residues, respectively. Similarity of each protein sequence is shown at end of alignment, with red lines indicating maximum and minimum values of consistency between pepper sequences and blue lines indicating consistency between pepper and Arabidopsis sequences.
Horticulturae 11 00719 g001
Figure 2. Phylogenetic tree of G6PDH proteins. Proteins in pepper, tomato, tobacco, soybean, rice, and Arabidopsis labeled in black, green, red, white, yellow, and blue stars, respectively. Species abbreviations: Ca, Capsicum annuum; Si, Solanum lycopersicum; Nt, Nicotiana tabacum; Gm, Glycine max; Os, Oryza sativa; At, Arabidopsis thaliana.
Horticulturae 11 00719 g002
Figure 3. The collinearity analysis of the G6PDH genes in pepper, tomato, and Arabidopsis. The red line represents the collinear gene pairs of G6PDH in pepper and Arabidopsis, the purple line represents the collinear gene pairs of G6PDH in pepper and tomato, and the gray lines represent all the collinear blocks between genomes. The inner circle represents gene density.
Horticulturae 11 00719 g003
Figure 4. Conserved motifs and gene structure of Solanaceae G6PDH members. (A) Phylogenetic tree of G6PDH protein sequences in pepper, tomato, and tobacco. (B) Distributions of conserved motifs among G6PDH proteins. (C) Analysis of G6PDH gene structures. (D) Pattern identification of ten conserved sequences.
Horticulturae 11 00719 g004
Figure 5. Analysis of cis-elements in CaG6PDH gene promoter. (A) Distribution of cis-elements in CaG6PDH gene promoter. (B) Number statistics and element classification of cis-elements.
Horticulturae 11 00719 g005
Figure 6. Expression profiles of pepper CaG6PDH genes in different organs. F-Dev1 to F-Dev9 represent stages 1–9 of fruit development, among which F-Dev1, F-Dev2, F-Dev3, and F-Dev4 are immature stages; F-Dev5 is mature green stage; F-Dev6 is break stage; and F-Dev7, F-Dev8, and F-Dev9 are maturity stages. Fragments per kilobase of exon model per million mapped reads (FPKM) values were used for expressions.
Horticulturae 11 00719 g006
Figure 7. Expression profiles of pepper CaG6PDH genes under different phytohormones (A) and abiotic stress (B). Phytohormone treatments included abscisic acid (ABA), methyl jasmonate (MeJA), salicylic acid (SA), and ethylene (ET). Abiotic stresses included cold, heat, drought (D-mannitol), and salt (NaCl). Mock represents control group. FPKM values were used for expression.
Horticulturae 11 00719 g007
Figure 8. CaG6PDH gene expression under abiotic stress by RT-qPCR. (A) Cold stress, (B) heat stress, (C) salt stress, (D) drought stress. ‘*’ represents p < 0.05, significant; ‘**’ represents p < 0.01, highly significant.
Horticulturae 11 00719 g008
Figure 9. Subcellular localization of CaG6PDH2. (A) pCambia1300-CaG6PDH2-eYFP fusion vector construction. (B) Subcellular localization of CaG6PDH2 in tobacco leaves. Localization of eYFP and its fusion proteins shown in yellow and chloroplast fluorescence shown in red. Scale bars = 50 μm.
Horticulturae 11 00719 g009
Figure 10. Analysis of function of CaG6PDH2 under cold stress by VIGS. (A) G6PDH activity, (B) PDS albino phenotype, (C) phenotype, (D) tissue staining of H2O2 and O2•−, (E) tissue staining of safranine and fast green. PP: palisade tissue; SP: spongy tissue. ‘**’ indicates significant differences at p < 0.01.
Horticulturae 11 00719 g010
Figure 11. Determination of physiological, biochemical, and COR expression in TRV2:CaG6PDH2 plants under cold stress. (A) H2O2 content, (B) O2•− content, (C) MDA content, (D) proline content, (E) G6PDH activity, (F) SOD activity, (G) POD activity, (H) CAT activity, (I) CaCBF1A expression, (J) CaCBF1B expression, (K) CaCOR47 expression. ‘*’ shows significant differences at p < 0.05; ‘**’ means significant differences at p < 0.01.
Horticulturae 11 00719 g011
Table 1. Ka, Ks, Ka/Ks, and time calculation of G6PDH pairs.
SpeciesHomologous Gene PairsKaKsKa/KsDivergent Time (Mya)
Pepper/ArabidopsisCaG6PDH1/AtG6PDH50.1151.820.063116.15
CaG6PDH1/AtG6PDH60.0952.220.043141.35
Pepper/TomatoCaG6PDH1/SiG6PDH20.0220.220.1013.75
CaG6PDH3/SiG6PDH40.0180.160.1110.26
Disclaimer/Publisher’s Note: The statements, opinions and data contained in all publications are solely those of the individual author(s) and contributor(s) and not of MDPI and/or the editor(s). MDPI and/or the editor(s) disclaim responsibility for any injury to people or property resulting from any ideas, methods, instructions or products referred to in the content.

