Abstract
Tomato spotted wilt virus (TSWV), belonging to the genus Orthotospovirus, is a significant pathogen through its infection of economically vital crops including tomato, tobacco, pepper, and other species worldwide. Given its substantial influence on the agricultural industry, in-depth research on TSWV is of great necessity. Several studies have been conducted on the dinucleotide preference of TSWV previously; however, the information regarding codon usage bias (CUB) and the virus’s adaptive evolution remains inconclusive. Here, a thorough analysis of TSWV was performed by utilizing five protein-coding sequences in order to investigate the characteristics of CUB. It has been observed that the TSWV protein-coding sequences are AU-rich, and codons ending with A or U are also preferred in these sequences. A consistently stable and preserved genomic composition characterized by a lower codon usage preference was also observed. Principal Component Analysis (PCA), neutrality analysis, and ENC-plot indicated that, in comparison to mutational pressure, natural selection has a more dominant influence on the CUB of TSWV. The codon adaptation index (CAI) demonstrated a more significant correlation between TSWV and Nicotiana tabacum. Meanwhile, the relative codon deoptimization index (RCDI) indicated a stronger correlation between TSWV and Solanum lycopersicum. This study is the first to systematically characterize the CUB of TSWV based on its protein-coding sequences, providing critical insights into viral genetic diversity, evolution mechanisms, and host adaptation. The findings advance understanding of plant-virus coevolution and inform virus-resistant crop breeding and antiviral strategies.
1. Introduction
Tomato spotted wilt virus (TSWV) is classified under the genus Orthotospovirus within the family Tospovirdae [1]. The virus is categorized among the top 10 most damaging plant viruses in global agricultural industries, leading to significant losses due to disease [2]. It exhibits a broad range of hosts, including various economically significant crops like tomato, lettuce, groundnut, and pepper, as well as ornamental plants [2,3,4]. Plants infected by the virus typically exhibit symptoms such as mottling, mosaic patterns, stunting, the appearance of ring spots, or even death, affecting crop yield and quality [1,5,6]. Nevertheless, the symptoms of TSWV-infected plants can differ significantly. This variation is attributed to factors including three principal determinants: (1) virus isolates, (2) host species diversity, and (3) environmental variables [1]. Under natural conditions, TSWV is solely transmitted by thrips in a persistent and propagative manner [7]. The virus demonstrates replication competence in both plant hosts and thrips vectors, establishing these insects as dual-function biological agents that serve as transmission vectors and replication-permissive hosts [2,8,9]. TSWV particles exhibit a membrane-bound spherical structure, measuring 80–120 nm in diameter. The tripartite genome comprises large (L), medium (M), and small (S) RNA segments, collectively encoding five viral proteins [10]. The L segment specifically encodes RNA-dependent RNA polymerase (RdRp), a crucial enzyme with replicase activity that drives the replication of the viral genome [11]. Conversely, the M and S genomic segments employ ambisense coding mechanisms, with each segment containing two open reading frames (ORFs) that undergo bidirectional transcription from both negative-sense genomic RNA and complementary positive-sense strands [12]. The M segment encodes a non-structural protein (NSm) from the positive-sense strand, which is essential for the viral cell-to-cell movement. Additionally, the negative-sense strand of the M segment encodes a Gn/Gc glycoprotein precursor, which functions in virion maturation, assembly, and thrips-mediated transmission [12]. The S segment encodes a non-structural protein (NSs) from the positive-sense strand, which is involved in the suppression of gene silencing, in suppressing host gene silencing, and a negative-sense strand encoding the nucleocapsid (N) protein [11,13].
Amino acids (aa) are determined by codons, which are composed of sets of three nucleotides. In nature, there are a total of 20 amino acids [14]. With the exception of methionine and tryptophan, multiple synonymous codons code for each amino acid. This characteristic is referred to as codon degeneracy. Codons displaying higher usage frequencies are designated as optimal codons, and the non-random selection of synonymous codons is referred to as codon usage bias (CUB) [15,16]. The mutation pressure and natural selection are significant factors that influence CUB [17,18]. CUB is also strongly correlated with evolutionary relationships and genetic characteristics across species [19,20]. Additionally, compositional constraints, protein properties, tRNA levels, G + C content, geographic location, and dinucleotide abundance are among the other factors that can also impact viral CUB [14,21,22,23].
Previous studies have conducted research on the molecular population genetics of TSWV, examining its genetic structure, identifying the evolutionary forces at play, and assessing genetic variation within this viral species [24]. Furthermore, several studies also reported the molecular characterization of TSWV in India [25], as well as the phylogenetic analysis of NSs protein [26], among other findings. Nevertheless, the evolutionary dynamics and the pattern of synonymous codon usage in TSWV have been reported with uncertainties in these studies.
In this study, we performed a comprehensive analysis of codon usage patterns in TSWV using its five protein-coding sequences as the dataset, aiming to elucidate how CUB influences viral evolution. These findings offer novel insights into the genetic divergence mechanisms of TSWV through systematic investigation of selective pressures shaping its codon preference characteristics, thereby advancing comprehension of TSWV evolutionary dynamics and ecological adaptation strategies.
2. Materials and Methods
2.1. Virus Isolates
We retrieved available genomic sequences for five TSWV protein-coding regions (GnGc, N, NSm, NSs, RdRp) from GenBank (accessed on 9 July 2024). Sequences were filtered based on length consistency (retaining those within the expected range for each protein) and coding integrity (excluding sequences with internal stop codons or frameshift mutations). The final curated dataset comprised 213 sequences of GnGc, 770 sequences of N, 293 sequences of NSm, 257 sequences of NSs, and 132 sequences of RdRp. Table S1 presents detailed information about the isolates, including accession numbers, geographical locations, collection dates, and host origins.
2.2. Recombination Analysis
In this study, CLUSTAL X 2.1 [27] was used for multiple sequence alignment of all the TSWV protein-coding sequences. To keep the alignment to preserve codon-aligned amino acid sequences without gaps, the TRANSALIGN software (https://ontosight.ai/glossary/term/transalign-bioinformatics-software-tool--679e9ef438099fda3cffdbbf, accessed on 17 June 2025), a generous provision from Prof. Georg Weiller, was utilized. Subsequently, RDP4 software (version 4.101) [28] was used to carry out recombination analysis of the obtained isolates. Specifically, multiple methods were employed within the RDP4 software [28], including BOOTSCAN [29], RDP, SISCAN [30], MAXCHI [31], GENECONV, CHIMAERA [32] and 3SEQ [33]. The parameter settings for these analyses were set to the default values of the software [28,34,35,36,37,38]. Each method used must have a p value less than 10−6 to confirm the accuracy of RDP analysis results. Additionally, a recombination event is considered verified only when at least five out of seven methods detect it before its actual occurrence.
2.3. Nucleotide (nt) Composition Analysis
Five codons were excluded from nucleotide composition analysis due to their unique biological functions: AUG (exclusively encoding methionine), UGG (exclusively encoding tryptophan), and three stop codons—UAA/UAG/UGA (non-amino-acid-encoding). This exclusion follows standard practice in codon bias studies to avoid skewing analyses of synonymous codon preference. BioEdit software (version 7.2.3) was used to comprehensively calculate the complete nt composition of TSWV protein-coding sequences, encompassing individual base frequencies (adenine [A], uracil [U], guanine [G], and cytosine [C]), along with AU and GC contents. The third codon position nt composition (A3s, U3s, G3s, C3s%) in TSWV coding regions was computationally profiled through the CodonW 1.4.2 package with default nt-composition calculation settings. Additionally, the nt composition at the first, second, and third codons was determined using the CAIcal SERVER (http://genomes.urv.cat/CAIcal) (accessed on 4 November 2024) with standard FASTA format input and default parameters [39]. This analysis aimed to calculate the GC content at the first (GC1), second (GC2), and third (GC3) codon positions. Additionally, it sought to determine GC12, which represents the average of GC1 and GC2.
2.4. Relative Synonymous Codon Usage (RSCU) Analysis
As described in [40], this analysis reflects the probability of a particular codon compared to other synonymous codons for the same aa. Its value is determined by dividing the observed frequency of a given codon by its expected frequency when all synonymous codons are used equally, as shown in the following formula:
Here, denotes the actual count of the j-th codon for the i-th amino acid, while indicates the number of codons that encode for the i-th amino acid. The RSCU value serves as an indicator of codon preference. When RSCU exceeds 1, the codon is considered preferentially utilized. Specifically, an RSCU value of 1.5 or higher denotes a frequently used codon, often classified as a high-frequency codon. Conversely, an RSCU value of exactly 1 suggests that codon usage follows a neutral pattern, indicating no particular preference.
2.5. Effective Number of Codons (ENC) Analysis
Computed with the CodonW v1.4.2 package, the ENC accurately assessed the CUB level in different TSWV protein-coding sequences. Ranging from 20 to 61, ENC values have distinct implications. A value of 20 shows the most restricted usage, with just one codon per amino acid, and 61 signifies uniform codon usage. ENC is widely used to assess the CUB in the analysis of individual genes [41]. An ENC value exceeding 35 typically indicates a weak CUB, whereas a value equal to or below this threshold demonstrates a strong CUB. In general, lower ENC values correspond to a greater preference for specific codons, reflecting stronger selection pressures or mutational constraints on codon usage.
2.6. Principal Component Analysis (PCA)
To explore the connections between various samples and related variables, PCA was utilized. Each of the five datasets, corresponding to the protein-coding regions (GnGc, N, NSm, NSs, RdRp), was transformed into a 59-dimensional vector (after removing the stop codons along with UGG and AUG), where each dimension represented the RSCU value of a sense codon. Prior to analysis, the RSCU values were standardized (z-score normalization). PCA analysis of TSWV protein-coding sequences was carried out using Origin 8.0.
2.7. Neutrality Analysis
This analysis was used to compare the relative impacts of mutational pressure and natural selection on CUB. Initially, the GC content at GC3 and GC12 within the gene codons was determined. Subsequently, GC12 and GC3 were used as the coordinate axes to construct a scatter plot. Scatter points along or near the diagonal line (slope = 1) suggest that mutation pressure dominates CUB. In contrast, a smaller slope in the trend of the scattered points indicates a stronger impact on natural selection pressure on CUB.
2.8. ENC-Plot Analysis
The ENC-plot analysis is used to investigate the decisive factor of codon preference and the abscissa is the GC3s value while the ordinate is the ENC value. The distance of each point in the ENC-plot diagram from the expected curve can reflect that the reason for the formation of codon preference is a base mutation or natural selection. A gene positioned on or near the standard curve indicates mutation pressure as the main driver of CUB. On the contrary, a gene position falling below the standard curve indicates natural selection primarily drives the CUB [42]. The expected ENC was calculated as
where represents the composition of GC3s.
2.9. Codon Adaptation Index (CAI) Analysis
The CAIcal SERVER (http://genomes.urv.cat/CAIcal) (accessed on 4 November 2024) was used to calculate the codon adaptation index (CAI) in order to predict how individual genes of TSWV adapt to their host. The synonymous codon usage patterns for pepper, tomato, and tobacco were taken from the Codon Usage Database (CUD) available at http://www.kazusa.or.jp/codon/ (accessed on 4 November 2024). Generally, a CAI value approaching 1 (from 0 to 1) signifies a superior capacity for adaptation to the host.
2.10. Relative Codon Deoptimization Index (RCDI) Analysis
For analyzing the trends in codon deoptimization, the RCDI/eRCDI server (http://genomes.urv.cat/CAIcal/RCDI/) (accessed on 4 November 2024) was used to calculate RCDI values for the TSWV protein-coding sequences. The RCDI is used to estimate the similarity of the codon frequencies of a specific gene in comparison to a given reference genome. The eRCDI is determined by generating random sequences with similar G + C and amino acid composition to the input sequences and may be used as an indicator of the significance of the RCDI values [39]. To estimate this expected value, 95% of the population was chosen. An RCDI of 1 indicates the virus adopts the host-specific CUB, while values over 1 suggest lower adaptability.
3. Results
3.1. Recombination Analysis
The recombinant analysis of TSWV using RDP showed the presence of five recombinant events based on five coding sequences: (GnGc: OK316998, RdRp: KM076651, KM657122, MF159048, PP632104). With the recombinants eliminated, the datasets relied on time-stamped complete ORF sequences (128 sequences of RdRp, 293 sequences of NSm, 212 sequences of GnGc, 257 sequences of NSs, and 770 sequences of N).
3.2. Nucleotide Composition Analysis
At the level of the TSWV protein-coding sequences, the nucleotides A and U were the most prevalent (Table 1). Additionally, the third-position nt composition of synonymous codons (A3s, U3s, G3s, and C3s%) exhibited a similar pattern (Table 1). The prevalence of AU over GC indicated that the TSWV is AU-rich.

Table 1.
The nt composition of the five protein-coding sequences of TSWV.
3.3. A- and U-Ended Codons Were Preferred in TSWV
Analysis of RSCU values for 59 synonymous codons in TSWV revealed distinct patterns of CUB, as depicted in Figure 1. Among the preferentially utilized codons across TSWV protein-coding sequences, seven codons in RdRp, eight in GnGc, nine in NSm, twelve in NSs, and seven in N were found to have an RSCU value > 1.6. This indicates an over-representation of these codons. In contrast, the remaining preferred codons demonstrated RSCU values within the range of 0.6 to 1.6. Notably, codon AGA emerged as the most highly over-represented across all TSWV coding regions, displaying the highest RSCU values—with the sole exception of the N coding regions, where codon AGG exhibited peak usage (Figure 1). Table S2 illustrates that nearly all 18 preferred codons across the five proteins terminate with A or U. This observation indicates a strong preference for A/U-ending codons in TSWV, suggesting that nt composition constraints likely shape the observed patterns of CUB.
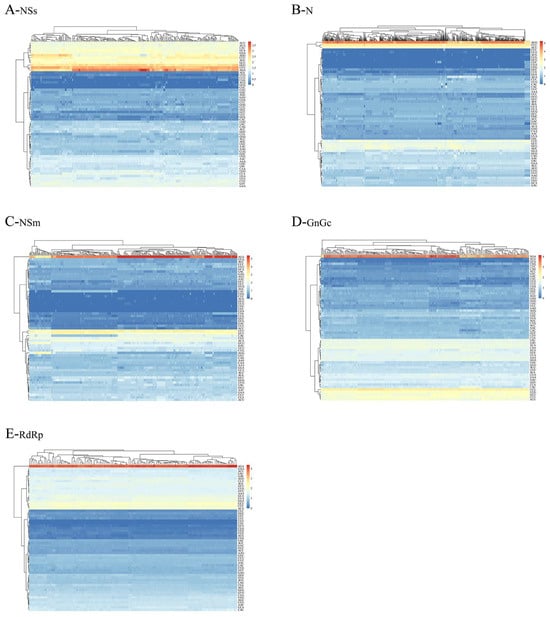
Figure 1.
RSCU analysis of TSWV. Darker red shades in the heatmap correspond to higher RSCU values, directly reflecting increased frequencies of codon usage.
3.4. Codon Usage Analysis
To quantify the CUB in the TSWV genome, we calculated the ENC values. Among the individual protein-coding sequences, NSs exhibited the highest ENC values, while NSm showed the lowest (Figure 2). The average ENC value of the five coding sequences exceeded 40. This finding suggests that the TSWV genome is stable and conserved, characterized by a limited degree of CUB across almost all its protein-coding sequences.
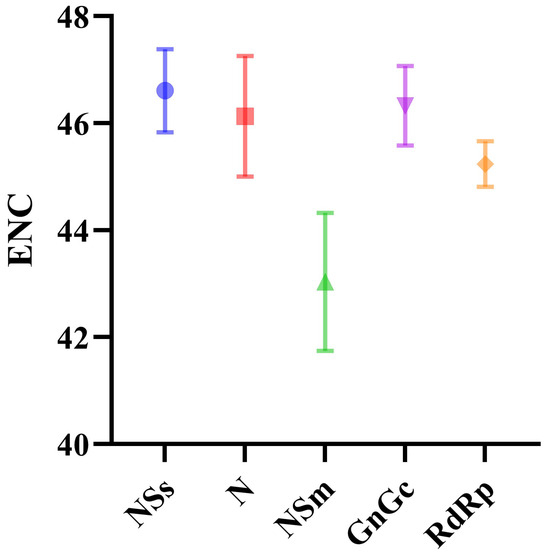
Figure 2.
ENC values for the five protein-coding sequences of TSWV. The NSs, N, NSm, GnGc and RdRp protein coding sequences are represented in blue, red, green, purple and orange, respectively.
3.4.1. Trends in Codon Usage Variations
The PCA was employed to investigate synonymous codon usage variation in TSWV. For the five protein-coding sequences, the first four principal axes (axes 1–4) collectively explained over 50% of the variation: 65.22% for GnGc, 67.59% for N, 56.18% for NSm, 69.64% for NSs, and 63.04% for RdRp, respectively. Notably, axis 1 emerged as the dominant factor influencing codon usage in TSWV, suggesting that natural selection exerts a stronger impact on the virus’s CUB. Using RSCU values, the distribution of the five protein-coding sequences across different hosts was further analyzed based on axe1 and axe2. The PCA analysis revealed significant overlap in the distribution of sequences from different hosts, suggesting conserved codon usage patterns (Figure 3).
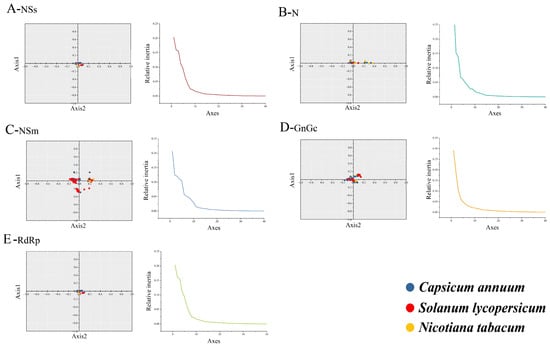
Figure 3.
The relative and cumulative inertia of the 40 axes from a PCA of the RSCU values based on protein-coding sequences of TSWV. The C. annuum, S. lycopersicum, and N. tabacum are represented in blue, red, and yellow, respectively.
3.4.2. Neutrality Plot
To assess how natural selection and mutational pressure affect CUB, a neutrality analysis between GC12 and GC3 of TSWV was conducted. Generally, nt changes at the third position of a codon do not alter the encoded amino acid; thus, such changes are regarded as solely reflecting mutational forces. Conversely, if a change in nt results in a change in amino acid, this is considered a selective force. A positive correlation was observed for GC12 and GC3 from all five TSWV coding sequences. (Figure 4). The slopes of the linear regressions for the NSs, N, NSm, GnGc, and RdRp coding sequences were 0.0299, 0.0185, 0.0505, 0.1937, and 0.1970, respectively. This indicates that mutational pressure accounted for 2.99%, 1.85%, 5.05%, 19.37%, and 19.70% of the factors influencing codon usage. Correspondingly, natural selection accounted for 97.01%, 98.15%, 94.95%, 80.63%, and 80.30%, respectively. These findings suggest that natural selection was the predominant force driving the CUB in TSWV protein-coding sequences.
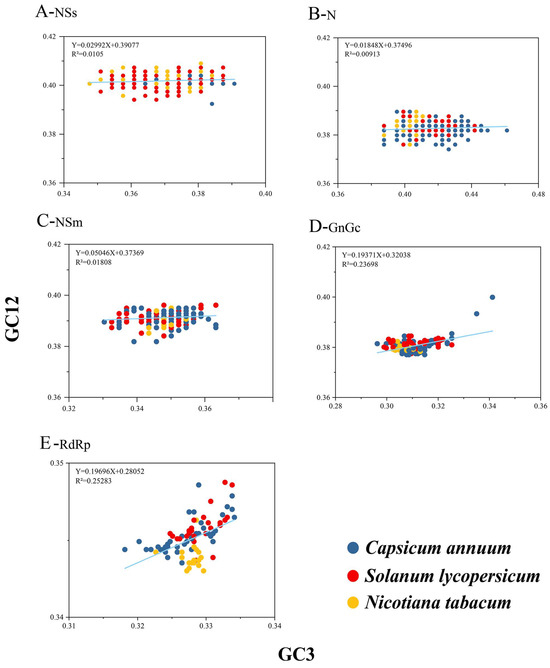
Figure 4.
Neutrality plot analysis of TSWV. Use the GC12s of the gene codons as X-axis and the GC3s of the gene codons as Y-axis. A coordinate value of 0.5 on both the abscissa and ordinate signifies equal usage rates of GC12 and GC3. The C. annuum, S. lycopersicum, and N. tabacum are distinguished by blue, red, and yellow, respectively.
3.4.3. Natural Selection and Mutation Pressure Both Play Roles in CUB of TSWV
To evaluate the effect of mutational pressure on the CUB of TSWV, an ENC-GC3s plot analysis was constructed. The plot’s central point at coordinates (0.5, 0.5)—where A and T are balanced, as are C and G—represents a neutral state without bias from either natural selection or mutational pressure. Typically, when the points are situated below the expected curve, it can be inferred that natural selection has a predominant influence on CUB, whereas points aligning with the expected curve indicate mutational pressure is the primary driving force.
As shown in Figure 5, all TSWV isolates corresponding to different protein-coding sequences and originating from various hosts generally clustered below the expected ENC curve. This clustering pattern suggests that natural selection had a stronger influence on CUB compared to mutation pressure, though mutation pressure still exerted some impact.
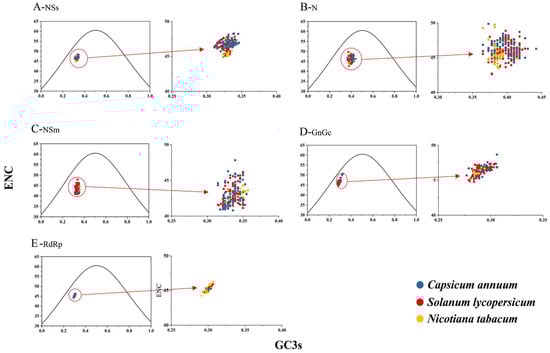
Figure 5.
ENC-plot analysis of the TSWV protein-coding sequences with ENC against GC3s across different hosts. The black solid line represents the standard curve under the assumption that CUB is exclusively determined by GC3 composition. The C. annuum, S. lycopersicum, and N. tabacum are distinguished by blue, red, and yellow, respectively.
3.5. Codon Usage Adaptation in TSWV
To assess the adaptation and optimization of TSWV’s codon usage toward its hosts, CAI values were calculated. Higher CAI values generally indicate greater host adaptability. Among the five protein-coding sequences analyzed, Nicotiana tabacum exhibited the highest CAI values (Figure 6), signifying the optimal adaptation of TSWV to this host species. Furthermore, an RCDI analysis was also performed to evaluate the cumulative effects of CUB on gene expression. The mean RCDI values were most pronounced in Solanum lycopersicum (Figure 6), suggesting the strongest evidence of codon usage deoptimization in this host.
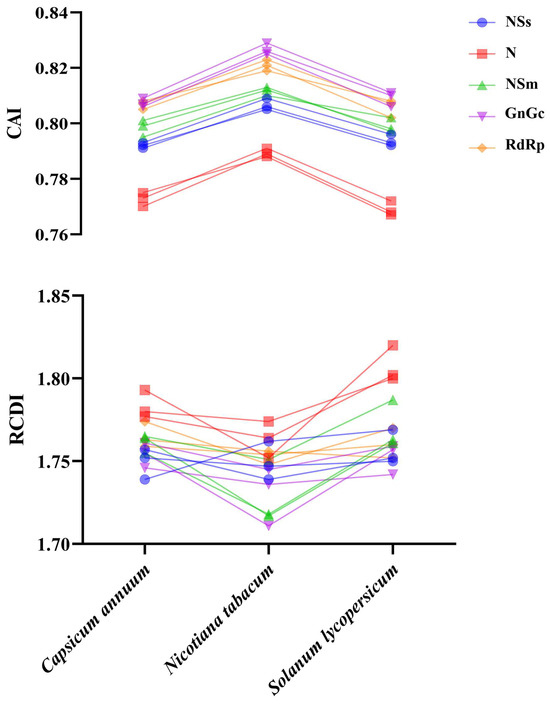
Figure 6.
The CAI analysis and RCDI analysis of TSWV in relation to the natural hosts.
4. Discussion
The codon usage patterns of viruses have evolved through natural selection, mutation pressure, and genetic drift in various organisms. It indicates the presence of evolutionary adaptations, including strategies for evading host defenses, adapting to host immune systems, and enhancing survival capabilities [43,44,45,46,47,48]. Previous studies on the codons of plant viruses, such as prunus necrotic ringspot virus (PNRSV) [49], sugarcane mosaic virus (SCMV) [36], papaya ringspot virus (PRSV) [50], potato virus M (PVM) [34], citrus tristeza virus (CTV) [51], broad bean wilt virus 2 (BBWV2) [35], narcissus yellow stripe virus (NYSV) [37] and rice stripe virus (RSV) [38], have demonstrated that these viruses exhibit a low degree of CUB. This discovery aligns with the results of our analysis.
In this study, the codon usage pattern of five protein-coding sequences encoded by TSWV and the main factors influencing them were discussed and compared. This was accomplished via several types of analyses, such as nucleotide composition analysis, PCA, ENC analysis, RSCU analysis, ENC-Plot analysis, and neutrality analysis. Lower ENC values indicate stronger CUB, as a smaller ENC reflects a more pronounced bias toward specific codons. It is widely acknowledged that ENC values ≤ 35 are indicative of genes exhibiting a significant CUB. Here, the average ENC values of all five protein-coding sequences were observed to be ≥40, suggesting that the degree of TWSV codon bias was relatively low. Analogously, previous research on PRSV [50], CTV [51], and RSV [38] has also revealed low CUB and high genomic stability. RSCU results showed that four protein-coding sequences (NSs, RdRp, GnGc, NSm) shared the optimal codon (AGA), whereas AGG is extremely over-represented with the highest RSCU values only in the N coding sequences.
The nt composition at the third codon position (A3, U3, C3, or G3) is a factor that influences CUB [52]. Previous research has demonstrated that potyvirids and certain other viruses exhibited a tendency to utilize A/U as the terminal nucleotides of their codons [36,53,54]. Consistent with these findings, our analysis revealed that in all five TSWV protein-coding sequences, A/U-ending codons are utilized more frequently than those ending with C or G. This observation indicates that codon base compositions exhibit similarities at the genome level across the different protein-coding sequences encoded by TSWV.
Nucleotide composition revealed that the TSWV is AU-rich. Typically, previous studies [35,36,38] have indicated that the AU- or GC-rich genomic composition of viruses is usually associated with their RSCU patterns. Specifically, genomes with abundant AU nucleotides tend to utilize codons that terminate with A or U, while GC-rich genomes often feature codons ending in G or C. Our results are in line with these observations, as we found that A/U-ending codons are preferentially used in TSWV.
CUB is shaped primarily by both mutation pressure and natural selection [55,56]. To evaluate the relative impacts of these evolutionary forces on the CUB of TSWV, PCA, neutrality analysis, and ENC-plot analysis were employed. The findings revealed that, when contrasted with mutational pressure, natural selection exerts a more dominant influence on the CUB of TSWV, consistent with findings from prior studies [36,49,57]. Nucleotide bias analysis further revealed that compositional constraints—particularly the prevalence of A and U—predominantly determine the usage of favored codons across most protein-coding sequences. This observation further implies the existence of mutation pressure acting on TSWV, as nt composition biases often reflect underlying mutational tendencies. Together, these analyses highlight the complex interplay between natural selection and mutational forces in shaping the CUB of TSWV.
The CAI value is capable of reflecting the gene expression levels within host cells. Through this, it can reveal how natural selection shapes viral evolution. Here, we investigated TSWV’s CUB in relation to its adaptation to hosts. The results showed that TSWV exhibited the greatest adaptation to N. tabacum, implying that the virus may achieve the highest gene expression efficiency in this plant species. Among the hosts studied, S. lycopersicum had the highest RCDI value, which indicated that TSWV underwent more intense selection pressure from S. lycopersicum. The results of CAI and RCDI present different preferences, and they exhibit similar trends to those of previous studies [35,36,53,58,59,60,61].
5. Conclusions
Overall, our findings indicate that TSWV protein-coding sequences exhibit relatively stable and conserved genomic compositions, accompanied by a low CUB. Both mutation pressure and natural selection influenced the CUB of these sequences, with natural selection playing a predominant role. A notable correlation between TSWV and N. tabacum or S. lycopersicum was found through the CAI and RCDI analyses. Our research holds substantial importance for advancing the understanding of TSWV’s structural characteristics, which can provide deep insight into TSWV genetic changes and adaptability to hosts.
Supplementary Materials
The following supporting information can be downloaded at https://www.mdpi.com/article/10.3390/horticulturae11070721/s1, Table S1: The details of TSWV isolates such as accession numbers, geographic locations, collection times, and host origins; Table S2: The RSCU value of 59 codons encoding 18 amino acids according to protein-coding sequences of TSWV.
Author Contributions
H.Z.: Writing—original draft, Visualization, Formal analysis, Investigation, Data curation, Methodology, Validation. L.Q.: Conceptualization, Methodology. X.D.: Writing—review, and editing. S.R.: Project administration, Writing—review, and editing. S.W.: Project administration, Writing—review, and editing. Z.H.: Visualization, Formal analysis, Conceptualization, Methodology, Funding acquisition, Project administration, Writing—review, and editing. All authors have read and agreed to the published version of the manuscript.
Funding
This work was supported by grants from the key intergovernmental special projects for the National Key R&D Program of China (2022YFE0130900), the National Natural Science Foundation of China (No. 32272485), the High-Level Talent Support Program of Yangzhou University, Yangzhou University interdisciplinary high-level young talent Cultivation project.
Data Availability Statement
Data is contained within the article and Supplementary Materials.
Conflicts of Interest
The authors declare that they have no known competing financial interests or personal relationships that could have appeared to influence them.
References
- Nilon, A.; Robinson, K.; Pappu, H.R.; Mitter, N. Current Status and Potential of RNA Interference for the Management of Tomato Spotted Wilt Virus and Thrips Vectors. Pathogens 2021, 10, 320. [Google Scholar] [CrossRef] [PubMed]
- Scholthof, K.-B.G.; Adkins, S.; Czosnek, H.; Palukaitis, P.; Jacquot, E.; Hohn, T.; Hohn, B.; Saunders, K.; Candresse, T.; Ahlquist, P.; et al. Top 10 Plant Viruses in Molecular Plant Pathology. Mol. Plant Pathol. 2011, 12, 938–954. [Google Scholar] [CrossRef] [PubMed]
- Pappu, H.R.; Jones, R.A.C.; Jain, R.K. Global Status of Tospovirus Epidemics in Diverse Cropping Systems: Successes Achieved and Challenges Ahead. Virus Res. 2009, 141, 219–236. [Google Scholar] [CrossRef] [PubMed]
- Oliver, J.E.; Whitfield, A.E. The Genus Tospovirus: Emerging Bunyaviruses That Threaten Food Security. Annu. Rev. Virol. 2016, 3, 101–124. [Google Scholar] [CrossRef]
- Loebenstein, G.; Lawson, R.H.; Brunt, A. Virus and Virus-like Diseases of Bulb and Flower Crops. Plant Pathology 1995, 47, 801. [Google Scholar]
- Asano, S.; Hirayama, Y.; Matsushita, Y. Distribution of Tomato Spotted Wilt Virus in Dahlia Plants. Lett. Appl. Microbiol. 2017, 64, 297–303. [Google Scholar] [CrossRef]
- Whitfield, A.E.; Ullman, D.E.; German, T.L. Tospovirus-Thrips Interactions. Annu. Rev. Phytopathol. 2005, 43, 459–489. [Google Scholar] [CrossRef]
- Ullman, D.E.; German, T.L.; Sherwood, J.L.; Westcot, D.M.; Cantone, F.A. Tospovirus Replication in Insect Vector Cells: Immunocytochemical Evidence That the Nonstructural Protein Encoded by the S RNA of Tomato Spotted Wilt Tospovirus Is Present in Thrips Vector Cells. Phytopathology 1993, 83, 456–463. [Google Scholar] [CrossRef]
- Wijkamp, I.; van Lent, J.; Kormelink, R.; Goldbach, R.; Peters, D. Multiplication of Tomato Spotted Wilt Virus in Its Insect Vector, Frankliniella Occidentalis. J. Gen. Virol. 1993, 74 Pt 3, 341–349. [Google Scholar] [CrossRef]
- Lee, J.-S.; Cho, W.K.; Kim, M.-K.; Kwak, H.-R.; Choi, H.-S.; Kim, K.-H. Complete Genome Sequences of Three Tomato Spotted Wilt Virus Isolates from Tomato and Pepper Plants in Korea and Their Phylogenetic Relationship to Other TSWV Isolates. Arch. Virol. 2011, 156, 725–728. [Google Scholar] [CrossRef]
- de Haan, P.; Kormelink, R.; de Oliveira Resende, R.; van Poelwijk, F.; Peters, D.; Goldbach, R. Tomato Spotted Wilt Virus L RNA Encodes a Putative RNA Polymerase. J. Gen. Virol. 1991, 72 Pt 9, 2207–2216. [Google Scholar] [CrossRef] [PubMed]
- Kormelink, R.; de Haan, P.; Meurs, C.; Peters, D.; Goldbach, R. The Nucleotide Sequence of the M RNA Segment of Tomato Spotted Wilt Virus, a Bunyavirus with Two Ambisense RNA Segments. J. Gen. Virol. 1993, 74 Pt 4, 790. [Google Scholar] [CrossRef] [PubMed]
- Bucher, E.; Sijen, T.; de Haan, P.; Goldbach, R.; Prins, M. Negative-Strand Tospoviruses and Tenuiviruses Carry a Gene for a Suppressor of Gene Silencing at Analogous Genomic Positions. J. Virol. 2003, 77, 1329–1336. [Google Scholar] [CrossRef] [PubMed]
- Hasegawa, M.; Yasunaga, T.; Miyata, T. Secondary Structure of MS2 Phage RNA and Bias in Code Word Usage. Nucleic Acids Res. 1979, 7, 2073–2079. [Google Scholar] [CrossRef][Green Version]
- Iriarte, A.; Lamolle, G.; Musto, H. Codon Usage Bias: An Endless Tale. J. Mol. Evol. 2021, 89, 589–593. [Google Scholar] [CrossRef]
- Plotkin, J.B.; Kudla, G. Synonymous but Not the Same: The Causes and Consequences of Codon Bias. Nat. Rev. Genet. 2011, 12, 32–42. [Google Scholar] [CrossRef]
- Hershberg, R.; Petrov, D.A. Selection on Codon Bias. Annu. Rev. Genet. 2008, 42, 287–299. [Google Scholar] [CrossRef]
- Moutinho, A.F.; Eyre-Walker, A. No Evidence That Selection on Synonymous Codon Usage Affects Patterns of Protein Evolution in Bacteria. Genome Biol. Evol. 2024, 16, evad232. [Google Scholar] [CrossRef]
- Wang, L.; Xing, H.; Yuan, Y.; Wang, X.; Saeed, M.; Tao, J.; Feng, W.; Zhang, G.; Song, X.; Sun, X. Genome-Wide Analysis of Codon Usage Bias in Four Sequenced Cotton Species. PLoS ONE 2018, 13, e0194372. [Google Scholar] [CrossRef]
- Wang, J.; Lin, Y.; Xi, M. Analysis of Codon Usage Patterns of Six Sequenced Brachypodium Distachyon Lines Reveals a Declining CG Skew of the CDSs from the 5?-Ends to the 3?-Ends. Genes 2021, 12, 1467. [Google Scholar] [CrossRef]
- Buchan, J.R.; Aucott, L.S.; Stansfield, I. tRNA Properties Help Shape Codon Pair Preferences in Open Reading Frames. Nucleic Acids Res. 2006, 34, 1015–1027. [Google Scholar] [CrossRef] [PubMed]
- Duret, L.; Mouchiroud, D. Expression Pattern and, Surprisingly, Gene Length Shape Codon Usage in Caenorhabditis, Drosophila, and Arabidopsis. Proc. Natl. Acad. Sci. USA 1999, 96, 4482–4487. [Google Scholar] [CrossRef] [PubMed]
- Sueoka, N. Translation-Coupled Violation of Parity Rule 2 in Human Genes Is Not the Cause of Heterogeneity of the DNA G+C Content of Third Codon Position. Gene 1999, 238, 53–58. [Google Scholar] [CrossRef] [PubMed]
- Tsompana, M.; Abad, J.; Purugganan, M.; Moyer, J.W. The Molecular Population Genetics of the Tomato Spotted Wilt Virus (TSWV) Genome. Mol. Ecol. 2005, 14, 53–66. [Google Scholar] [CrossRef]
- Aravintharaj, R.; Asokan, R.; Prasad Babu, K.; Manamohan, M.; Nagendran, K. Molecular Characterization of the Indian Isolate (Ka-To) of Tomato Spotted Wilt Virus (TSWV) Infecting Tomato (Solanum lycopersicum L.). 3 Biotech 2023, 13, 169. [Google Scholar] [CrossRef]
- Almási, A.; Csilléry, G.; Csömör, Z.; Nemes, K.; Palkovics, L.; Salánki, K.; Tóbiás, I. Phylogenetic Analysis of Tomato Spotted Wilt Virus (TSWV) NSs Protein Demonstrates the Isolated Emergence of Resistance-Breaking Strains in Pepper. Virus Genes. 2015, 50, 71–78. [Google Scholar] [CrossRef]
- Larkin, M.A.; Blackshields, G.; Brown, N.P.; Chenna, R.; McGettigan, P.A.; McWilliam, H.; Valentin, F.; Wallace, I.M.; Wilm, A.; Lopez, R.; et al. Clustal W and Clustal X Version 2.0. Bioinformatics 2007, 23, 2947–2948. [Google Scholar] [CrossRef]
- Martin, D.P.; Murrell, B.; Golden, M.; Khoosal, A.; Muhire, B. RDP4: Detection and Analysis of Recombination Patterns in Virus Genomes. Virus Evol. 2015, 1, vev003. [Google Scholar] [CrossRef]
- Salminen, M.O.; Carr, J.K.; Burke, D.S.; McCutchan, F.E. Identification of Breakpoints in Intergenotypic Recombinants of HIV Type 1 by Bootscanning. AIDS Res. Hum. Retroviruses 1995, 11, 1423–1425. [Google Scholar] [CrossRef]
- Boni, M.F.; Posada, D.; Feldman, M.W. An Exact Nonparametric Method for Inferring Mosaic Structure in Sequence Triplets. Genetics 2007, 176, 1035–1047. [Google Scholar] [CrossRef]
- Smith, J.M. Analyzing the Mosaic Structure of Genes. J. Mol. Evol. 1992, 34, 126–129. [Google Scholar] [CrossRef] [PubMed]
- Posada, D.; Crandall, K.A. Evaluation of Methods for Detecting Recombination from DNA Sequences: Computer Simulations. Proc. Natl. Acad. Sci. USA 2001, 98, 13757–13762. [Google Scholar] [CrossRef] [PubMed]
- Gibbs, M.J.; Armstrong, J.S.; Gibbs, A.J. Sister-Scanning: A Monte Carlo Procedure for Assessing Signals in Recombinant Sequences. Bioinformatics 2000, 16, 573–582. [Google Scholar] [CrossRef] [PubMed]
- He, Z.; Gan, H.; Liang, X. Analysis of Synonymous Codon Usage Bias in Potato Virus M and Its Adaption to Hosts. Viruses 2019, 11, 752. [Google Scholar] [CrossRef]
- He, Z.; Dong, Z.; Qin, L.; Gan, H. Phylodynamics and Codon Usage Pattern Analysis of Broad Bean Wilt Virus 2. Viruses 2021, 13, 198. [Google Scholar] [CrossRef]
- He, Z.; Dong, Z.; Gan, H. Genetic Changes and Host Adaptability in Sugarcane Mosaic Virus Based on Complete Genome Sequences. Mol. Phylogenetics Evol. 2020, 149, 106848. [Google Scholar] [CrossRef]
- He, Z.; Ding, S.; Guo, J.; Qin, L.; Xu, X. Synonymous Codon Usage Analysis of Three Narcissus Potyviruses. Viruses 2022, 14, 846. [Google Scholar] [CrossRef]
- He, M.; Guan, S.-Y.; He, C.-Q. Evolution of Rice Stripe Virus. Mol. Phylogenet Evol. 2017, 109, 343–350. [Google Scholar] [CrossRef]
- Puigbò, P.; Aragonès, L.; Garcia-Vallvé, S. RCDI/eRCDI: A Web-Server to Estimate Codon Usage Deoptimization. BMC Res. Notes 2010, 3, 87. [Google Scholar] [CrossRef]
- Sharp, P.M.; Li, W.H. An Evolutionary Perspective on Synonymous Codon Usage in Unicellular Organisms. J. Mol. Evol. 1986, 24, 28–38. [Google Scholar] [CrossRef]
- Belalov, I.S.; Lukashev, A.N. Causes and Implications of Codon Usage Bias in RNA Viruses. PLoS ONE 2013, 8, e56642. [Google Scholar] [CrossRef] [PubMed]
- Behura, S.K.; Singh, B.K.; Severson, D.W. Antagonistic Relationships between Intron Content and Codon Usage Bias of Genes in Three Mosquito Species: Functional and Evolutionary Implications. Evol. Appl. 2013, 6, 1079–1089. [Google Scholar] [CrossRef] [PubMed]
- Parvathy, S.T.; Udayasuriyan, V.; Bhadana, V. Codon Usage Bias. Mol. Biol. Rep. 2022, 49, 539–565. [Google Scholar] [CrossRef] [PubMed]
- Li, G.; Wang, H.; Wang, S.; Xing, G.; Zhang, C.; Zhang, W.; Liu, J.; Zhang, J.; Su, S.; Zhou, J. Insights into the Genetic and Host Adaptability of Emerging Porcine Circovirus 3. Virulence 2018, 9, 1301–1313. [Google Scholar] [CrossRef]
- Yan, Z.; Wang, R.; Zhang, L.; Shen, B.; Wang, N.; Xu, Q.; He, W.; He, W.; Li, G.; Su, S. Evolutionary Changes of the Novel Influenza D Virus Hemagglutinin-Esterase Fusion Gene Revealed by the Codon Usage Pattern. Virulence 2019, 10, 1–9. [Google Scholar] [CrossRef]
- Butt, A.M.; Nasrullah, I.; Qamar, R.; Tong, Y. Evolution of Codon Usage in Zika Virus Genomes Is Host and Vector Specific. Emerg. Microbes Infect. 2016, 5, e107. [Google Scholar] [CrossRef]
- He, W.; Zhao, J.; Xing, G.; Li, G.; Wang, R.; Wang, Z.; Zhang, C.; Franzo, G.; Su, S.; Zhou, J. Genetic Analysis and Evolutionary Changes of Porcine Circovirus 2. Mol. Phylogenet Evol. 2019, 139, 106520. [Google Scholar] [CrossRef]
- Zhang, W.; Zhang, L.; He, W.; Zhang, X.; Wen, B.; Wang, C.; Xu, Q.; Li, G.; Zhou, J.; Veit, M.; et al. Genetic Evolution and Molecular Selection of the HE Gene of Influenza C Virus. Viruses 2019, 11, 167. [Google Scholar] [CrossRef]
- Wang, L.; Zhao, H.; Wang, Z.; Ding, S.; Qin, L.; Jiang, R.; Deng, X.; He, Z.; Li, L. An Evolutionary Perspective of Codon Usage Pattern, Dinucleotide Composition and Codon Pair Bias in Prunus Necrotic Ringspot Virus. Genes 2023, 14, 1712. [Google Scholar] [CrossRef]
- Chakraborty, P.; Das, S.; Saha, B.; Sarkar, P.; Karmakar, A.; Saha, A.; Saha, D.; Saha, A. Phylogeny and Synonymous Codon Usage Pattern of Papaya Ringspot Virus Coat Protein Gene in the Sub-Himalayan Region of North-East India. Can. J. Microbiol. 2015, 61, 555–564. [Google Scholar] [CrossRef]
- Biswas, K.K.; Palchoudhury, S.; Chakraborty, P.; Bhattacharyya, U.K.; Ghosh, D.K.; Debnath, P.; Ramadugu, C.; Keremane, M.L.; Khetarpal, R.K.; Lee, R.F. Codon Usage Bias Analysis of Citrus Tristeza Virus: Higher Codon Adaptation to Citrus Reticulata Host. Viruses 2019, 11, 331. [Google Scholar] [CrossRef] [PubMed]
- Chen, L.; Liu, T.; Yang, D.; Nong, X.; Xie, Y.; Fu, Y.; Wu, X.; Huang, X.; Gu, X.; Wang, S.; et al. Analysis of Codon Usage Patterns in Taenia Pisiformis through Annotated Transcriptome Data. Biochem. Biophys. Res. Commun. 2013, 430, 1344–1348. [Google Scholar] [CrossRef] [PubMed]
- Khandia, R.; Singhal, S.; Kumar, U.; Ansari, A.; Tiwari, R.; Dhama, K.; Das, J.; Munjal, A.; Singh, R.K. Analysis of Nipah Virus Codon Usage and Adaptation to Hosts. Front. Microbiol. 2019, 10, 886. [Google Scholar] [CrossRef] [PubMed]
- Qin, L.; Ding, S.; He, Z. Compositional Biases and Evolution of the Largest Plant RNA Virus Order Patatavirales. Int. J. Biol. Macromol. 2023, 240, 124403. [Google Scholar] [CrossRef] [PubMed]
- Sharp, P.M.; Emery, L.R.; Zeng, K. Forces That Influence the Evolution of Codon Bias. Philos. Trans. R. Soc. Lond. B Biol. Sci. 2010, 365, 1203–1212. [Google Scholar] [CrossRef]
- Rao, Y.; Wu, G.; Wang, Z.; Chai, X.; Nie, Q.; Zhang, X. Mutation Bias Is the Driving Force of Codon Usage in the Gallus Gallus Genome. DNA Res. 2011, 18, 499–512. [Google Scholar] [CrossRef]
- Lu, M.; Wan, W.; Li, Y.; Li, H.; Sun, B.; Yu, K.; Zhao, J.; Franzo, G.; Su, S. Codon Usage Bias Analysis of the Spike Protein of Human Coronavirus 229E and Its Host Adaptability. Int. J. Biol. Macromol. 2023, 253, 127319. [Google Scholar] [CrossRef]
- Li, G.; Zhang, W.; Wang, R.; Xing, G.; Wang, S.; Ji, X.; Wang, N.; Su, S.; Zhou, J. Genetic Analysis and Evolutionary Changes of the Torque Teno Sus Virus. Int. J. Mol. Sci. 2019, 20, 2881. [Google Scholar] [CrossRef]
- Sun, J.; Zhao, W.; Wang, R.; Zhang, W.; Li, G.; Lu, M.; Shao, Y.; Yang, Y.; Wang, N.; Gao, Q.; et al. Analysis of the Codon Usage Pattern of HA and NA Genes of H7N9 Influenza A Virus. Int. J. Mol. Sci. 2020, 21, 7129. [Google Scholar] [CrossRef]
- Zeng, L.; Chen, M.; Wang, M.; Zhu, L.; Yan, J.; Zhang, X.; Xu, J.; Zhang, S. Enterovirus A Shows Unique Patterns of Codon Usage Bias in Conventional Versus Unconventional Clade. Front. Cell Infect. Microbiol. 2022, 12, 941325. [Google Scholar] [CrossRef]
- Pan, S.; Mou, C.; Wu, H.; Chen, Z. Phylogenetic and Codon Usage Analysis of Atypical Porcine Pestivirus (APPV). Virulence 2020, 11, 916–926. [Google Scholar] [CrossRef]
Disclaimer/Publisher’s Note: The statements, opinions and data contained in all publications are solely those of the individual author(s) and contributor(s) and not of MDPI and/or the editor(s). MDPI and/or the editor(s) disclaim responsibility for any injury to people or property resulting from any ideas, methods, instructions or products referred to in the content. |
© 2025 by the authors. Licensee MDPI, Basel, Switzerland. This article is an open access article distributed under the terms and conditions of the Creative Commons Attribution (CC BY) license (https://creativecommons.org/licenses/by/4.0/).