Article

Integration of Green and Far-Red Light with Red-Blue Light Enhances Shoot Multiplication in Micropropagated Strawberry

1
Institute of Remote Sensing and Digital Agriculture, Sichuan Academy of Agricultural Sciences, Chengdu 610066, China
2
Institute of Urban Agriculture, Chinese Academy of Agricultural Sciences, Chengdu 610213, China
3
Agricultural Science Research Institute of Ganzi Tibetan Autonomous Prefecture, Kangding 626000, China
*
Author to whom correspondence should be addressed.
Horticulturae 2025, 11(6), 701; https://doi.org/10.3390/horticulturae11060701
Submission received: 22 May 2025 / Revised: 12 June 2025 / Accepted: 14 June 2025 / Published: 17 June 2025
(This article belongs to the Section Propagation and Seeds)

Abstract

:
Light spectral composition critically regulates plant morphogenesis and molecular adaptation in controlled environments. This study investigated the synergistic effects of three light spectra, red-blue (RB, 7:3), red-blue-green (RGB, 7:3:1), and red-blue-far-red (RBFR, 7:3:1), on multiplication, morphogenesis, physiological traits, and transcriptomic dynamics in tissue-cultured strawberry (Fragaria × ananassa cv. ‘Benihoppe’). After 28 days of cultivation under controlled conditions (25 °C/22 °C day/night, 50 μmol·m−2·s−1 PPFD), RBFR and RGB treatments significantly enhanced shoot multiplication (38.8% and 24.2%, respectively), plant height, and callus biomass compared to RB light. RGB elevated chlorophyll a and b by 1.8- and 1.6-fold, respectively, while RBFR increased soluble protein content by 16%. Transcriptome analysis identified 144 and 376 differentially expressed genes (DEGs) under RGB and RBFR, respectively, enriched in pathways linked to circadian rhythm, auxin transport, and photosynthesis. Far-red light upregulated light signaling and photomorphogenesis genes, whereas green light enhanced chlorophyll biosynthesis while suppressing stress-responsive genes. These findings elucidate the spectral-specific regulatory mechanisms underlying strawberry micropropagation and provide a framework for optimizing multispectral LED systems in controlled-environment horticulture.

1. Introduction

Strawberry (Fragaria × ananassa Duch.), a perennial herbaceous plant in the Rosaceae family, is native to the Americas and has been widely cultivated worldwide for its vibrant color, aromatic flavor, and nutritional richness, known as the “queen of fruits”. Strawberry is highly valued as a fresh-consumption fruit. However, conventional propagation via stolons (also called runners) poses significant challenges, as viral pathogens (such as strawberry mild yellow edge virus and strawberry crinkle virus) accumulate over generations, leading to genetic degradation and reduced yields [1]. To mitigate this, regular virus elimination through tissue culture techniques, such as meristem tip culture combined with thermotherapy, is essential to maintain clonal fidelity and productivity [2].
Virus-free strawberries are first regenerated through tissue culture and validated via molecular diagnostics. Once confirmed as virus-free, these plantlets undergo mass propagation in subculture media. In this process, axillary buds of the sterilized explants are induced to proliferate continuously under optimized conditions, forming clusters of adventitious shoots (clump shoots). The multiplication of clump shoots enables rapid scaling of virus-free plantlets [3]. Therefore, an optimal in vitro culture environment, including light quality, nutrient composition, and hormonal balance, is critical to accelerate plant growth and shorten the production cycle of virus-free strawberries.
Light quality is a critical environmental factor regulating plant morphogenesis, photosynthesis, and secondary metabolism. Red and blue light are widely recognized as the most efficient spectra for photosynthesis and are commonly used to enhance plant growth [4]. Studies have demonstrated that combined red-blue light treatments increase leaf area, root vigor, biomass, and soluble sugar content in various plant species [5,6,7]. For instance, Nhut et al. [8] reported optimal growth of strawberry tissue-cultured plants under a 70% red + 30% blue light ratio. Beyond red and blue light, green and far-red light also play critical roles in plant development. Although green light is often perceived as growth-inhibitory, its combination with red-blue light significantly improves leaf expansion and biomass accumulation in lettuce (Lactuca sativa L.) [9], likely due to its deeper penetration into leaf tissues, enhancing carbon fixation. Green light further regulates developmental processes such as seed germination [10], underscoring its ecological significance as a component of solar radiation. Far-red light, on the other hand, modulates plant morphology such as stem elongation, petiole angle, and flowering time [11], while enhancing photosynthetic efficiency through improved light harvesting, electron transport rates, and photophosphorylation activity, thereby boosting biomass production [12,13]. These findings highlight the necessity of exploring synergistic effects of combined light spectra to optimize in vitro plant growth. Green and far-red light might potentially become important artificial light for promoting the growth and development of micropropagated strawberries. This study aimed to evaluate the effects of integrating green and far-red light with conventional red-blue light on shoot multiplication and morphogenesis in strawberry plants, which is critical for enhancing the efficiency of micropropagation systems in strawberry production.

2. Materials and Methods

2.1. Plant Materials and Light Treatments

Uniform tissue-cultured transplants of the strawberry cultivar ‘Benihoppe’ were selected as experimental materials. Shoots with three leaves and consistent growth vigor were inoculated onto Murashige and Skoog (MS) medium supplemented with 2.22 µM 6-benzylaminopurine (BA) and 0.54 µM naphthaleneacetic acid (NAA). The cultures were then transferred to LED plant growth chambers (RQH-1000(H), Shengyuanyiqi Co., Ltd., Zhengzhou, China) under three light treatments: red-blue (RB, R:B = 7:3), red-blue-green (RGB, R:B:G = 7:3:1), and red-blue-far-red (RBFR, R:B:FR = 7:3:1). The peak wavelengths of blue, green, red, and far-red light were 450, 530, 660, and 730, respectively. The spectral profiles of the three light treatments are illustrated in Figure 1. The chambers were maintained at 25 °C/22 °C (day/night) with a 16 h photoperiod, a total photosynthetic photon flux density (PPFD) of 50 μmol·m−2·s−1 around plantlets’ canopy, and 60% ± 3% relative humidity. Each treatment consisted of three replicates, with three culture bottles per replicate and 3 plants in each bottle. After 28 days of cultivation, the number of new shoots, plant height, fresh weight, leaf weight, and callus weight for every shoot were measured. Leaves of the strawberries were immediately frozen in liquid nitrogen and stored at −80 °C for subsequent physiological and transcriptomic analysis.

2.2. Chlorophyll and Carotenoid Determination

The content of chlorophyll and carotenoid was measured according to Xiao et al. [14]. Strawberry leaves were homogenized into a fine powder using liquid nitrogen. A 0.1 g sample was transferred to a 15 mL centrifuge tube. Subsequently, 10 mL of 95% ethanol was added to each tube, and the samples were incubated in the dark at 4 °C for 24 h until complete chlorophyll extraction (indicated by tissue bleaching). The extracts were centrifuged at 12,000 rpm for 10 min at 4 °C. A 200 μL supernatant was transferred to a 96-well microplate, and absorbance values were measured at 665, 649, and 470 nm using a spectrophotometer (Multiskan SkyHigh, Thermo Scientific, Wilmington, NC, USA). Chlorophyll and carotenoid concentrations were calculated as follows:
Chlorophyll a (mg·L−1) = 13.95 × A665 − 6.88 × A649
Chlorophyll b (mg·L−1) = 24.96 × A649 − 7.32 × A665
Carotenoid (mg·L−1) = (1000 × A470 − 2.05 × Chl a−114 × Chl b)/245

2.3. Soluble Sugars and Proteins Determination

Soluble sugar content was determined using the anthrone colorimetric method. Briefly, 0.1 g of fresh sample was homogenized in a 15 mL centrifuge tube with 5 mL of distilled water and incubated in a boiling water bath for 1 h. After cooling to room temperature, the extract was centrifuged at 12,000 rpm for 15 min at 4 °C. A 20 μL aliquot of the supernatant was mixed with anthrone-sulfuric acid reagent, vortexed thoroughly, and immediately placed in a boiling water bath for 10 min. The reaction mixture was then cooled under running water, and 200 μL was transferred to a microplate. Absorbance was measured at 620 nm using a spectrophotometer.
Soluble protein content was quantified using the Coomassie Brilliant Blue G-250 method. Fresh leaves (0.1 g) were homogenized in 1.5 mL of distilled water and centrifuged at 12,000 rpm for 15 min at 4 °C. A 100 μL aliquot of the supernatant was mixed with Coomassie Brilliant Blue G-250 reagent (Thermo Fisher Scientific, Rockford, IL, USA), vortexed, and incubated for 2 min. Absorbance was measured at 595 nm.

2.4. RNA Extraction and cDNA Library Construction

Total RNA was extracted using the cetyltrimethylammonium bromide (CTAB) method. Residual genomic DNA was removed using DNase I (Takara Bio, Beijing, China). RNA concentration and purity were measured using a NanoDrop 2000 spectrophotometer (Thermo Scientific, Wilmington, NC, USA), and RNA integrity was verified via 1.5% agarose gel electrophoresis. High-quality RNA samples were used to construct cDNA libraries with the NEBNext Ultra II RNA Library Prep Kit (New England BioLabs, Ipswich, MA, USA) following the manufacturer’s protocol. The quality and size distribution of the libraries were assessed using an Agilent 2100 Bioanalyzer (Agilent Technologies, Santa Clara, CA, USA). Qualified cDNA libraries were subsequently used for RNA sequencing (RNA-seq) analysis.

2.5. RNA-Seq and Differential Gene Enrichment Analysis

Paired-end sequencing of all strawberry samples was performed using the HiSeq 2500 sequencer (Illumina, San Diego, CA, USA), generating approximately 6 GB of raw data per sample. Raw reads were subjected to quality control using the NGS QC Toolkit to remove low-quality bases (Phred score < 20) and reads containing ambiguous “N” nucleotides. High-quality clean reads were aligned to the diploid Fragaria vesca reference genome (downloaded from the Genome Database for Rosaceae, GDR: http://www.rosaceae.org, accessed on 12 October 2024) using HISAT2. Differentially expressed genes (DEGs) were identified using Cufflinks software by comparing transcript abundance across samples. Read counts per gene were calculated using HTSeq-Count, and statistical significance was assessed with the negative binomial test (nbinomTest) in DESeq2. Genes with a p-value < 0.05 and |log2(Foldchange)| > 1 were defined as DEGs.
Functional annotation of DEGs was performed using BLAST (https://blast.ncbi.nlm.nih.gov/Blast.cgi, accessed on 25 October 2024) against the NCBI non-redundant (nr) protein database. Enrichment analysis was conducted for Gene Ontology (GO) terms, Kyoto Encyclopedia of Genes and Genomes (KEGG) pathways, and Pfam protein domains. Visualization of enriched terms was generated using ggplot2 in R.

2.6. Validation of Gene Expression Profiles by qRT-PCR

To validate the reliability of RNA-seq data. A total of 8 candidate genes were selected for qRT-PCR analysis. All primers were designed using Primer Premier 5.0 (Table 1), ensuring the exclusion of conserved regions and amplification of products spanning 180–300 bp. Actin 2 was selected as the housekeeping gene for data normalization. The qRT-PCR was conducted with the SYBR® Premix Ex TaqTM II kit (Takara, Kyoto, Japan) following the manufacturer’s protocol. The thermal cycling parameters included an initial denaturation at 95 °C for 3 min, followed by 40 cycles of 95 °C for 20 s, 58 °C for 20 s, and 72 °C for 30 s, and concluded with a melting curve analysis (60–95 °C). Relative gene expression levels were calculated using the 2−ΔΔCT method. Correlation between qRT-PCR and RNA-seq results was assessed by plotting log2 (RGB/RB) and log2 (RBFR/RB).

2.7. Statistical Analysis

Data were analyzed using SPSS 23.0 (IBM, Ammonk, NY, USA) with one-way ANOVA followed by Duncan’s multiple range test (p ≤ 0.05). Graphs were generated using OriginPro 9.0 (OriginLab, Northampton, MA, USA).

3. Results

3.1. Growth Parameters

The morphology of the strawberries affected by different light combinations is shown in Figure 2. RBFR and RGB increased shoot numbers by 38.8% and 24.2%, respectively, compared to RB (Table 2). Plant height under RBFR (6.03 cm) exceeded RB (5.11 cm) and RGB (5.24 cm). Callus weight was highest under RBFR (0.059 g/plant), while shoot fresh weights and leaf weights showed no significant differences.

3.2. Chlorophyll and Carotenoid Contents

Compared to RB treatment, RGB illumination significantly increased chlorophyll a and b levels by 1.8-fold and 1.6-fold, respectively, whereas RBFR showed no significant effect on chlorophyll content (Figure 3A,B). The ratio of chlorophyll a to b remained consistent across all treatments (Figure 3C). The contents of carotenoids also showed no significant difference among treatments (Figure 3D).

3.3. Soluble Sugar and Protein Contents

Soluble protein content increased by 16% under both RBFR and RGB compared to RB (Figure 4A); the contents of soluble protein were around 2.9 mg·g−1 fresh weight under RBFR and RGB, while this content was only 2.5 mg·g−1 under RB. The contents of soluble sugars remained stable across light treatments, with values ranging from 18.4 (RB) to 19.3 (RBFR) mg·g−1 fresh weight (Figure 4B).

3.4. Transcriptomic Analysis

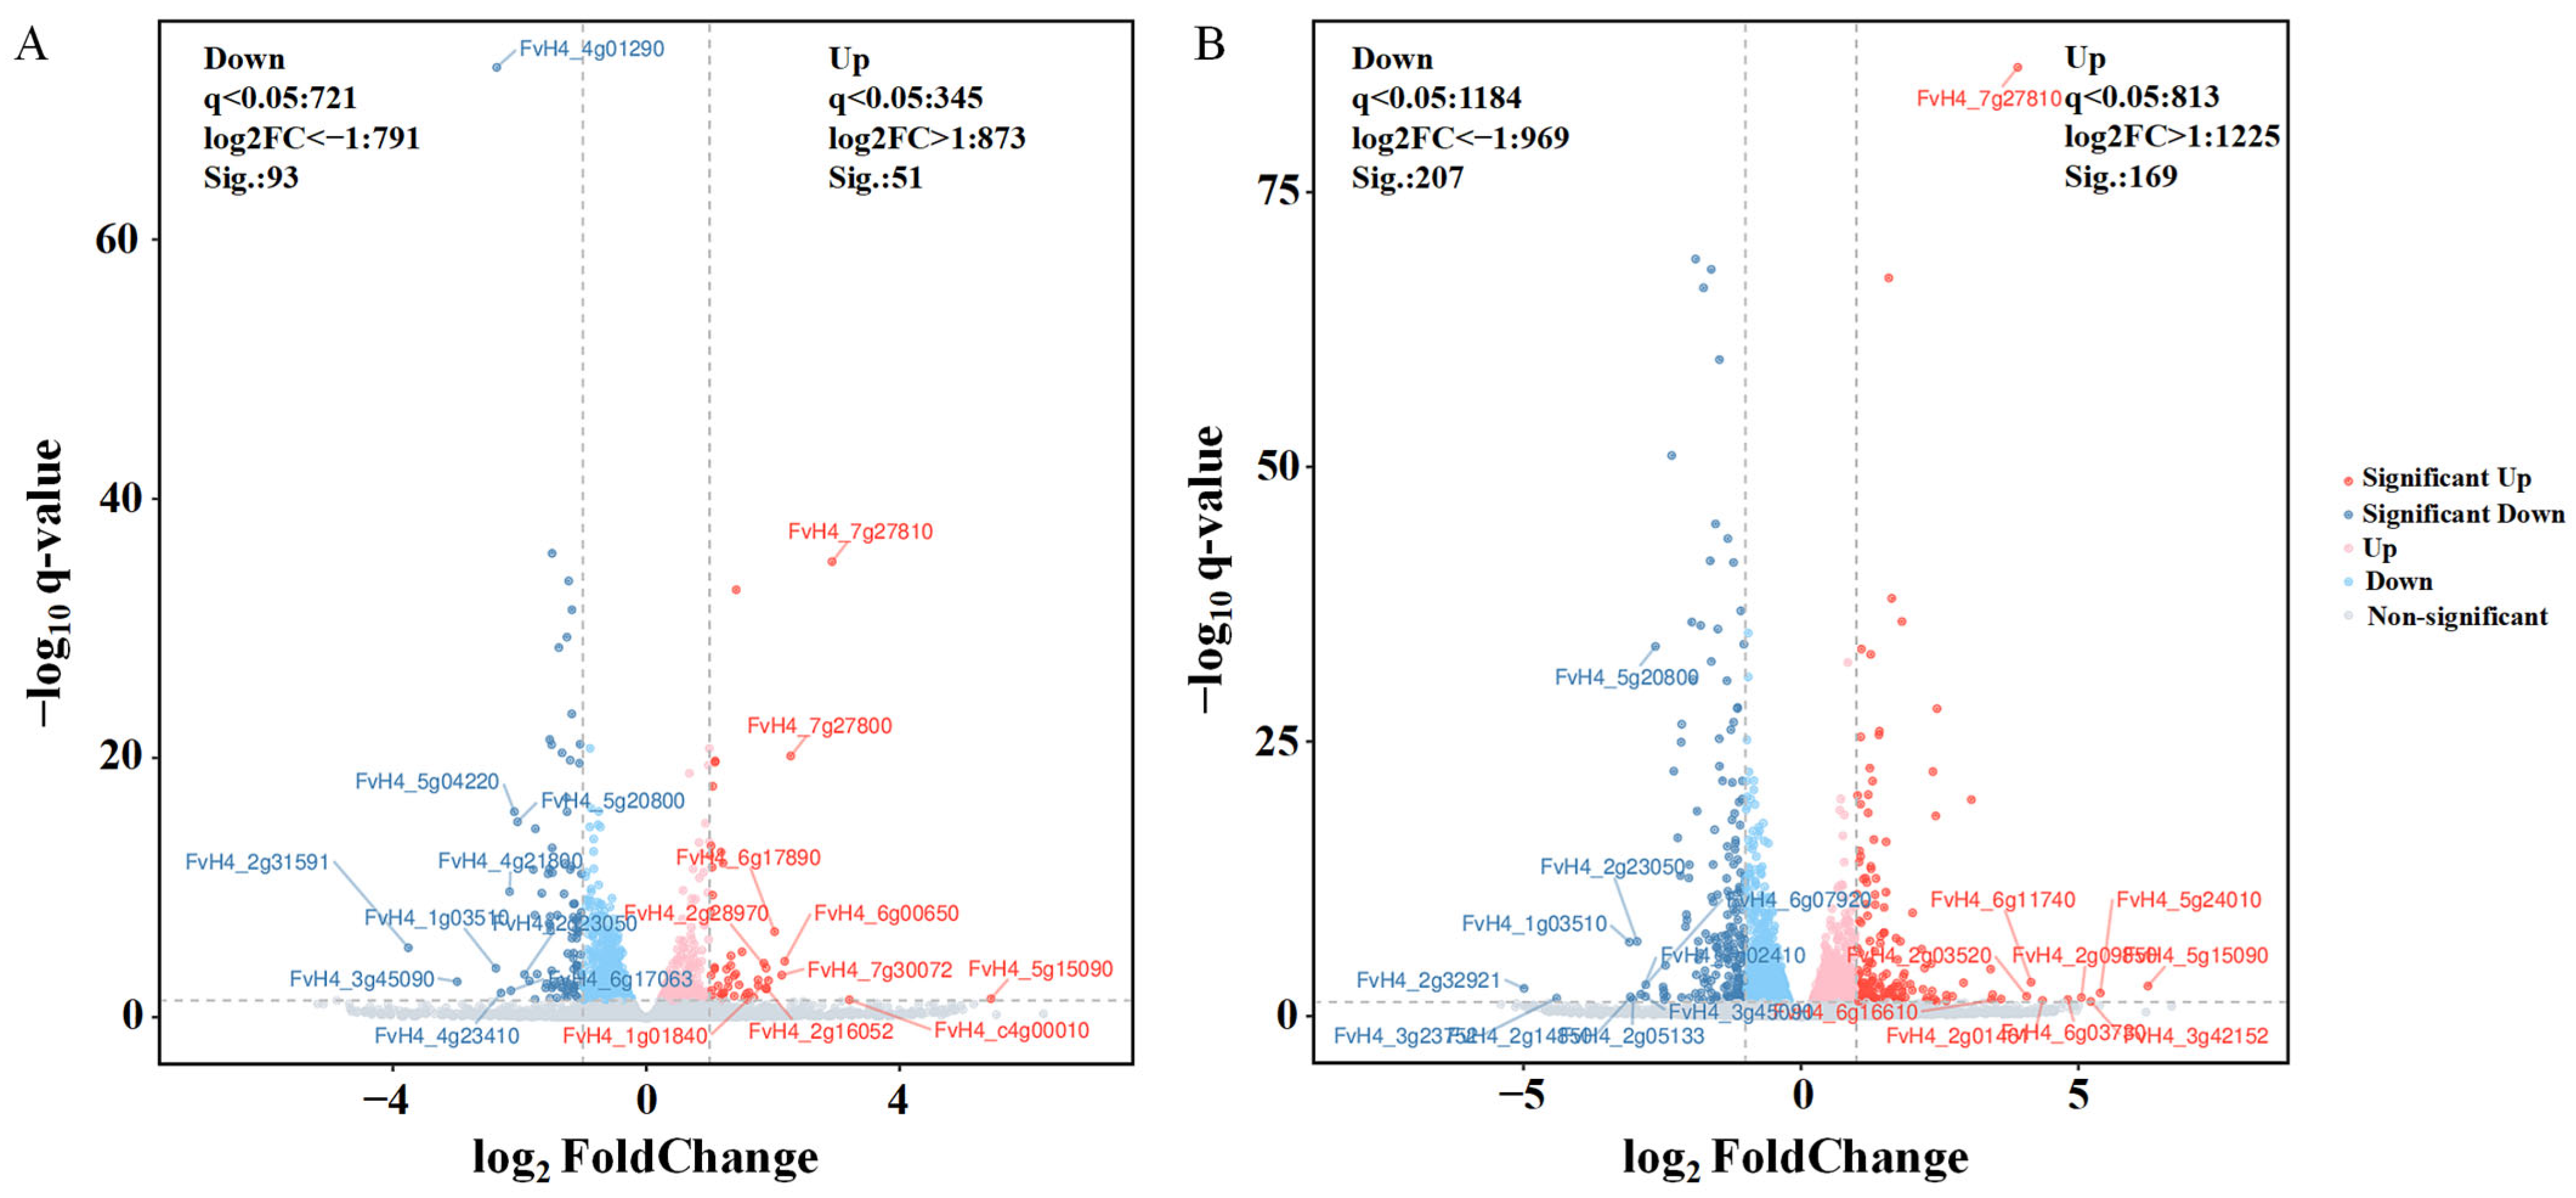
3.4.1. Volcano Plots of DEGs

Nine cDNA libraries were constructed from strawberry RNA-seq data under varying light quality ratios, with three biological replicates per treatment. After data filtering, the clean reads ranged from 47.39 to 48.75 GB per sample, with Q30 scores distributed between 94.33% and 95.16%. The GC content remained stable across all samples, ranging from 46.98% to 47.23%, meeting the quality thresholds for downstream analyses. DEGs were identified using DESeq2 software, with a significance threshold of q-value < 0.05 and |FoldChange| > 1. Volcano plots revealed that 51 genes were significantly upregulated and 93 genes were downregulated under RGB (Figure 5A). In addition, 169 genes showed significant upregulation, while 207 genes were downregulated under RBFR (Figure 5B).

3.4.2. GO Enrichment Analysis

Among the upregulated DEGs under RGB, biological processes were predominantly enriched in circadian rhythm regulation, red or far-red light signaling pathways, and basipetal auxin transport (Figure 6A). Cellular components were associated with the respiratory chain, endoplasmic reticulum lumen, and chloroplast stroma. Molecular functions included auxin efflux transmembrane transporter activity, amino acid transmembrane transporter activity, and jasmonic acid hydrolase activity. For downregulated DEGs, biological processes were linked to hydrogen peroxide transmembrane transport, pigment biosynthesis, water transport, red/far-red light phototransduction, and photosynthetic electron transport chain activity (Figure 6B). Cellular components were enriched in the vacuolar lumen and dynein complex. Molecular functions are primarily involved in catechol oxidase activity.
Among the upregulated DEGs under RBFR, biological processes were significantly enriched in the oxylipin biosynthetic process, unsaturated fatty acid biosynthetic process, tRNA aminoacylation for protein translation, circadian rhythm, response to blue light, photosynthesis (light harvesting), response to far-red light, and photoinhibition (Figure 7A). Cellular components were predominantly focused on photosystem I (PSI), photosystem II (PSII), and the cytoplasmic dynein complex. Molecular functions were mainly related to oxidoreductase activity, enzyme inhibitor activity, and chlorophyll binding. As for downregulated DEGs, biological processes exhibited significant enrichment in the regulation of cell wall pectin metabolic processes, regulation of stomatal complex development, and photosynthetic electron transport in photosystem I (Figure 7B). Cellular components were linked to the NAD(P)H dehydrogenase complex and chloroplast-related structures, such as the chloroplast thylakoid membrane, chloroplast stroma, and chloroplast membrane. Molecular functions primarily involved ferric-chelate reductase activity, heme binding, and catechol oxidase activity.

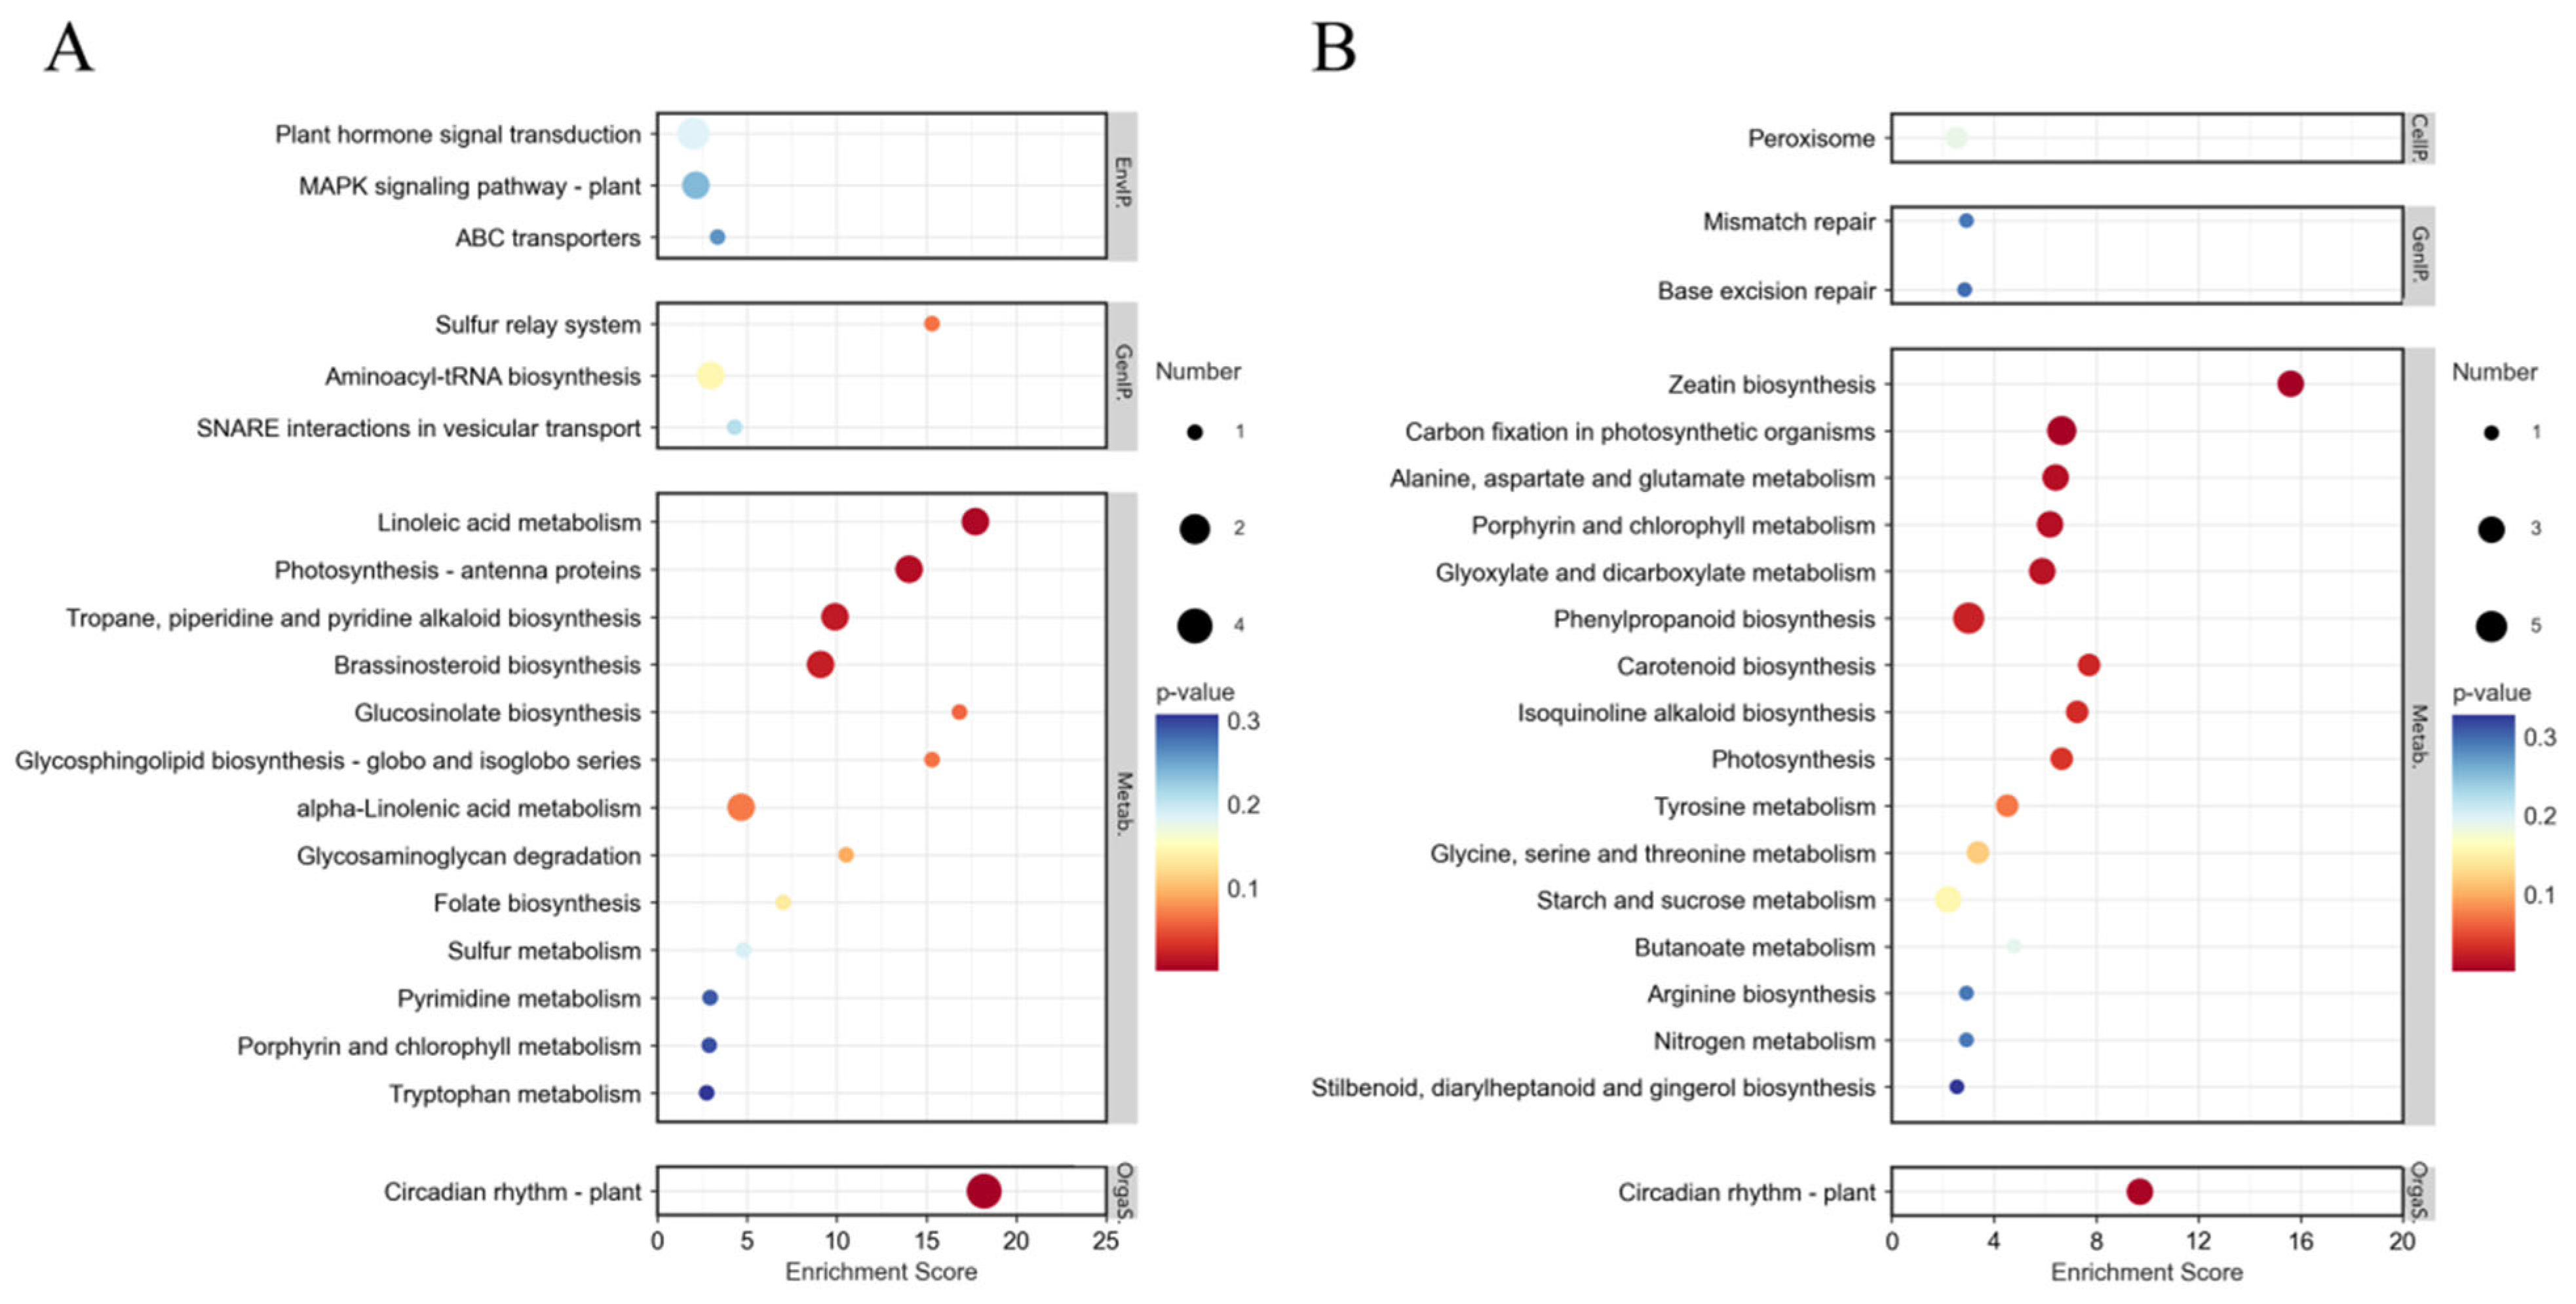
3.4.3. KEGG Enrichment Analysis

The upregulated genes under RGB were significantly enriched in the following metabolic pathways: Circadian rhythm-plant, cyanoamino acid metabolism, ABC transporters, glucosinolate biosynthesis, biosynthesis of unsaturated fatty acids, brassinosteroid biosynthesis, fatty acid biosynthesis, alanine, aspartate, and glutamate metabolism, pyrimidine metabolism, porphyrin and chlorophyll metabolism, tryptophan metabolism, starch and sucrose metabolism, phenylpropanoid biosynthesis, plant hormone signal transduction (Figure 8A). Downregulated pathways included: Circadian rhythm-plant, isoquinoline alkaloid biosynthesis, porphyrin and chlorophyll metabolism, carbon fixation in photosynthetic organisms, tyrosine metabolism, zeatin biosynthesis, carotenoid biosynthesis, photosynthesis (Figure 8B).
The upregulated genes under RBFR were significantly enriched in 20 metabolic pathways, including: Circadian rhythm-plant, linoleic acid metabolism, glucosinolate biosynthesis, sulfur relay system, glycosphingolipid biosynthesis-globo and isoglobo series, photosynthesis-antenna proteins, glycosaminoglycan degradation, tropane, piperidine, pyridine alkaloid biosynthesis, and brassinosteroid biosynthesis (Figure 9A). Downregulated pathways prominently featured: Zeatin biosynthesis, circadian rhythm—plant, carotenoid biosynthesis, isoquinoline alkaloid biosynthesis, photosynthesis, carbon fixation in photosynthetic organs, alanine, aspartate, glutamate metabolism, porphyrin and chlorophyll metabolism, glyoxylate and dicarboxylate metabolism, and tyrosine metabolism (Figure 9B).

3.4.4. Top Genes Affected by Green and Far-Red Light

The significant DEGs induced by RGB are shown in Figure 10A, with the top 20 DEGs displayed on the right side. The upregulated genes included: Cyclin-dependent kinase F-4-like (CDKSF4, FvH4_7g27810), ABC transporter B family member 4-like (FvH4_6g00650), phytochrome kinase substrate 3 (PKS3, FvH4_5g15090), and lysine histidine transporter (FvH4_2g16052). Conversely, downregulated genes were associated with growth suppression and altered metabolic homeostasis, these genes include UDP-glycosyltransferase 73C1-like (UGT73C1, FvH4_6g17063), transcription factor HY5 (FvH4_4g21800), chlorophyllase-1 (FvH4_2g23050), beta-amylase 3 (FvH4_5g20800), anthocyanidin reductase-like isoform X1 (FvH4_5g04220), early light-induced protein 1 (FvH4_4g01290), and adenine nucleotide transporter BT1 (FvH4_1g03510).
The significant DEGs induced by RBFR are shown in Figure 10B. The upregulated genes induced by far-red light were predominantly associated with light signaling, cell cycle regulation, and metabolic adaptation, while downregulated genes were linked to chlorophyll degradation, carbohydrate metabolism, nucleotide transport, and zeatin biosynthesis. The upregulated genes include PKS3 (FvH4_5g15090) (Figure 10B), CDKSF4 (FvH4_7g27810), cysteine synthase-like isoform X2 (FvH4_6g03730), heparan-alpha-glucosaminide N-acetyltransferase-like (FvH4_6g16610), Lactosylceramide 4-alpha-galactosyltransferase-like (FvH4_6g11740), and umecyanin-like (FvH4_2g09850). Downregulated genes include chlorophyllase-1 (FvH4_2g23050), galactinol synthase 2 (FvH4_6g07920), SWEET1-like sugar transporter (FvH4_2g14850), beta-amylase 3 (FvH4_5g20800), adenine nucleotide transporter BT1 (FvH4_1g03510), replication factor C subunit 3 (FvH4_7g02410), adenylate isopentenyltransferase 3 (IPT3, FvH4_2g23840), UGT73C1 (FvH4_6g17063), and Zeatin O-glucosyltransferase (FvH4_6g24360).

3.5. Expression Profile Validation

To validate the reliability and accuracy of the RNA-seq data, a total of 8 DEGs were selected for qRT-PCR analysis. As shown in Figure 11, relative expression changes following different light treatments were calculated using Log2 (RGB/RB) and Log2 (RBFR/RB). All genes detected by qRT-PCR exhibited expression patterns consistent with the RNA-Seq results, indicating the high credibility of the sequencing data.

4. Discussion

This study elucidates the distinct regulatory roles of RBFR and RGB light spectra in the growth, physiological traits, and transcriptional responses of micropropagated strawberries. Compared to traditional RB light, RBFR significantly enhanced shoot multiplication (38.8%), plant height, and callus biomass. These morphological improvements are likely mediated by phytochrome signaling pathways, particularly through the activation of phytochrome-interacting factors (PIFs) that promote cell elongation and axillary bud initiation by promoting cell wall loosening enzymes and auxin polar transport genes [15,16]. Far-red light is known to stabilize PIFs by inactivating phytochrome B (phyB), thereby releasing transcriptional repression of growth-related genes [17]. The upregulation of Phytochrome Kinase Substrate 3 (PKS3) under RBFR suggests enhanced PIF activity, which was found to directly drive hypocotyl elongation and organogenesis in Arabidopsis and other crops [18,19].
The improved shoot multiplication under RBFR may also account for accelerated cell cycle and membrane biosynthesis. RBFR upregulated key cell cycle regulators Cyclin-dependent kinase F-4-like (CDKSF4, FvH4_7g27810), which governs G1/S and G2/M phase transitions to drive mitotic division [20]. This mechanism likely underpins the 38.8% increase in shoot number and elevated callus biomass (0.059 g/plant vs. 0.052 g/plant in RB). Concurrently, the activation of linoleic acid metabolism pathways (Figure 9A) indicates enhanced membrane lipid production, providing structural support for rapid cell proliferation [21].
Energy reallocation toward protein synthesis may support meristem activation and rapid cell division during bud formation. The observed increase in soluble protein content under RBFR light, coupled with the enrichment of tRNA aminoacylation for protein translation under RBFR, was opposite to the downregulation of carbohydrate metabolism genes (such as SWEET1-like sugar transporter). Such a metabolic shift may reflect a resource reallocation strategy, prioritizing nitrogen assimilation for strawberry multiplication over carbohydrate storage, a phenomenon also reported in Brassica species under far-red-enriched conditions [22,23].
The RGB light significantly enhanced shoot multiplication (24.2%) in micropropagated strawberries compared to conventional RB light, while it was less pronounced than the effects of RBFR. Researchers also found that far-red light had a more pronounced effect on morphogenesis compared to the green light in Viola cornuta cv. [24]. Nevertheless, green light also plays an important role in the growth and development of many plants [25]. Green light induced distinct molecular and physiological adaptations that synergistically promoted morphogenesis. Similar to far-red light, green light also significantly enriched circadian rhythm-plant pathways, synchronizing metabolic processes such as starch degradation and hormone signaling. The CDKSF4 and PKS3 are also upregulated by green light, indicating that circadian-regulated cell cycle genes drive mitotic activity to enhance cell proliferation. Concurrently, GO analysis highlighted enhanced basipetal auxin transport, likely mediated by ABC transporter B family member 4-like (FvH4_6g00650) [26]. Green light also enhanced cytokinin activity by downregulating zeatin O-glucosyltransferase. Auxin and cytokinin redistribution under green light may stimulate meristematic activity for proliferation in axillary buds, as reported in Arabidopsis under low green-to-red light ratios [23].
Chlorophyll biosynthesis was enhanced under RGB in micropropagated strawberry compared to conventional RB light. RGB treatment markedly elevated chlorophyll a and b levels, aligning with its known role in stimulating chloroplast development. Transcriptomic analysis revealed the upregulation of the porphyrin and chlorophyll metabolism pathway (Figure 8A), particularly genes encoding magnesium-chelatase (FvH4_3g04520), which are critical for chlorophyll biosynthesis [27]. Unlike red or blue light, green light penetrates deeper into the leaf tissues due to its longer wavelength, optimizing light capture in multilayered canopies and enhancing carbon fixation efficiency [28,29]. However, the concurrent downregulation of photosystem genes (such as PSI/II subunits) under RGB may indicate a trade-off to mitigate photoinhibition risks in the closed in vitro environment. Similar responses have been observed in lettuce, where green light supplementation reduced photodamage under high irradiance by modulating reactive oxygen species (ROS) scavenging systems [30]. Additionally, the suppression of stress-responsive genes such as HY5 under RGB suggests a dampening of light stress signals, potentially stabilizing cellular homeostasis during micropropagation [31,32].
Transcriptomic profiling revealed that RBFR and RGB differentially regulate circadian rhythm pathways to some extent, which are critical for synchronizing metabolic and developmental processes with environmental cues [33]. RGB-enriched pathways were linked to glucosinolate and brassinosteroid biosynthesis, which are associated with enhanced stress resilience and cell expansion [34,35]. These findings highlight the spectral-specific modulation of secondary metabolism, a strategy that may improve acclimation to controlled environments.
Contrasting with prior studies on vegetables like cucumber and lettuce [4,29], RBFR downregulated photosystem genes despite its growth-promoting effects. This discrepancy may arise from species-specific responses or suboptimal light intensity (50 μmol·m−2·s−1 PPFD), which might not saturate photosynthetic capacity in strawberry [7]. Notably, far-red light has been shown to enhance photosynthetic efficiency in low-light conditions by increasing cyclic electron flow around PSI [36], but such benefits may be offset in strawberries through the prioritization of vegetative growth over photosynthetic maintenance under limited energy input. Future studies should explore interactions between light quality and intensity to refine spectral recipes for strawberry tissue culture, particularly in systems aiming to balance biomass production with photosynthetic efficiency.

5. Conclusions

The integration of green (RGB) and far-red (RBFR) light with red-blue spectra synergistically enhances morphogenesis and metabolic adaptation in micropropagated strawberry through distinct molecular mechanisms. Both RBFR and RGB promote shoot multiplication and vegetative expansion by stabilizing phytochrome-interacting factors (PKS3) and activating cell cycle regulators (CDKSF4). RBFR prioritizes nitrogen assimilation via tRNA aminoacylation pathways, whereas RGB significantly enhances chlorophyll biosynthesis through upregulation of the porphyrin metabolism gene. In conclusion, integrating far-red light and green light into red and blue light can be commercially utilized to promote the proliferation and growth of strawberries. By leveraging LED technology, producers and nursery growers can access enhanced energy efficiency and unparalleled versatility, paving the way for significant advancements in the plant growth of strawberries and other plants.

Author Contributions

Conceptualization, Y.L. and F.W.; methodology, Y.L. and Y.P.; software, F.Z. and X.Q.; validation, P.H. and S.W.; formal analysis, H.C.; investigation, Y.L. and Y.P.; resources, F.W.; data curation, Y.L. and J.H.; writing—original draft preparation, Y.L.; writing—review and editing, S.W., H.M. and F.W.; visualization, X.Q.; supervision, P.H.; project administration, F.W.; funding acquisition, F.W. All authors have read and agreed to the published version of the manuscript.

Funding

This research was funded by the National Natural Science Foundation of China (no. 32402488); Sichuan Science and Technology Program (2024NSFSC1453); Science and Technology Program of Sichuan Academy of Agricultural Sciences (5+1QYGG006/2022ZZCX032).

Data Availability Statement

The raw data supporting the conclusions of this article will be made available by the authors on request.

Conflicts of Interest

The authors declare no conflicts of interest.

References

  1. Martin, R.R.; Tzanetakis, I.E. Characterization and recent advances in detection of strawberry viruses. Plant Dis. 2006, 90, 384–396. [Google Scholar] [CrossRef] [PubMed]
  2. Jia, H.; Tang, H. Effect of heat treatment combined with shoot tip culture on the virus-free of arena strawberry. J. Life Sci. 2012, 6, 168–174. [Google Scholar]
  3. Ashrafuzzaman, M.; Faisal, S.; Yadav, D.; Khanam, D.; Raihan, F. Micropropagation of strawberry (Fragaria ananassa) through runner culture. Bangladesh J. Agric. Res. 2013, 38, 467–472. [Google Scholar] [CrossRef]
  4. Hogewoning, S.W.; Trouwborst, G.; Maljaars, H.; Poorter, H.; van Ieperen, W.; Harbinson, J. Blue light dose–responses of leaf photosynthesis, morphology, and chemical composition of Cucumis sativus grown under different combinations of red and blue light. J. Exp. Bot. 2010, 61, 3107–3117. [Google Scholar] [CrossRef]
  5. Heo Jeongwook, H.J.; Lee Chunwoo, L.C.; Debasis Chakrabarty, D.C.; Paek Keeyoeup, P.K. Growth responses of marigold and salvia bedding plants as affected by monochromic or mixture radiation provided by a light-emitting diode (LED). Plant Growth Regul. 2002, 38, 225–230. [Google Scholar]
  6. Ouzounis, T.; Fretté, X.; Ottosen, C.O.; Rosenqvist, E. Spectral effects of LEDs on chlorophyll fluorescence and pigmentation in Phalaenopsis ‘Vivien’ and ‘Purple Star’. Physiol. Plant. 2015, 154, 314–327. [Google Scholar] [CrossRef]
  7. Sabzalian, M.R.; Heydarizadeh, P.; Zahedi, M.; Boroomand, A.; Agharokh, M.; Sahba, M.R.; Schoefs, B. High performance of vegetables, flowers, and medicinal plants in a red-blue LED incubator for indoor plant production. Agron. Sustain. Dev. 2014, 34, 879–886. [Google Scholar] [CrossRef]
  8. Nhut, D.T.; Takamura, T.; Watanabe, H.; Okamoto, K.; Tanaka, M. Responses of strawberry plantlets cultured in vitro under superbright red and blue light-emitting diodes (LEDs). Plant Cell Tissue Organ Cult. 2003, 73, 43–52. [Google Scholar] [CrossRef]
  9. Kim, H.-H.; Goins, G.D.; Wheeler, R.M.; Sager, J.C. Green-light supplementation for enhanced lettuce growth under red-and blue-light-emitting diodes. HortScience 2004, 39, 1617–1622. [Google Scholar] [CrossRef]
  10. Wang, Y.; Folta, K.M. Contributions of green light to plant growth and development. Am. J. Bot. 2013, 100, 70–78. [Google Scholar] [CrossRef]
  11. Park, Y.G.; Jeong, B.R. Both the quality and positioning of the night interruption light are important for flowering and plant extension growth. J. Plant Growth Regul. 2020, 39, 583–593. [Google Scholar] [CrossRef]
  12. Tan, T.; Li, S.; Fan, Y.; Wang, Z.; Ali Raza, M.; Shafiq, I.; Wang, B.; Wu, X.; Yong, T.; Wang, X. Far—Red light: A regulator of plant morphology and photosynthetic capacity. Crop J. 2022, 10, 300–309. [Google Scholar] [CrossRef]
  13. Zhen, S.; van Iersel, M.W. Far-red light is needed for efficient photochemistry and photosynthesis. J. Plant Physiol. 2017, 209, 115–122. [Google Scholar] [CrossRef] [PubMed]
  14. Xiao, J.; Li, Y.; Jeong, B.R. Foliar silicon spray to strawberry plants during summer cutting propagation enhances resistance of transplants to high temperature stresses. Front. Sustain. Food Syst. 2022, 6, 938128. [Google Scholar] [CrossRef]
  15. Park, Y.; Runkle, E.S. Far-red radiation promotes growth of seedlings by increasing leaf expansion and whole-plant net assimilation. Environ. Exp. Bot. 2017, 136, 41–49. [Google Scholar] [CrossRef]
  16. Li, Y.; Jiang, H.; Gao, M.; He, R.; Liu, X.; Su, W.; Liu, H. Far-red-light-induced morphology changes, phytohormone, and transcriptome reprogramming of Chinese kale (Brassica alboglabra Bailey). Int. J. Mol. Sci. 2023, 24, 5563. [Google Scholar] [CrossRef]
  17. Paik, I.; Huq, E. Plant photoreceptors: Multi-functional sensory proteins and their signaling networks. Proc. Semin. Cell Dev. Biol. 2019, 92, 114–121. [Google Scholar] [CrossRef] [PubMed]
  18. Kami, C.; Lorrain, S.; Hornitschek, P.; Fankhauser, C. Light-regulated plant growth and development. Curr. Top. Dev. Biol. 2010, 91, 29–66. [Google Scholar]
  19. Leivar, P.; Monte, E. PIFs: Systems integrators in plant development. Plant Cell 2014, 26, 56–78. [Google Scholar] [CrossRef]
  20. Lin, K.-H.; Huang, M.-Y.; Huang, W.-D.; Hsu, M.-H.; Yang, Z.-W.; Yang, C.-M. The effects of red, blue, and white light-emitting diodes on the growth, development, and edible quality of hydroponically grown lettuce (Lactuca sativa L. var. capitata). Sci. Hortic. 2013, 150, 86–91. [Google Scholar] [CrossRef]
  21. Inzé, D.; De Veylder, L. Cell cycle regulation in plant development. Annu. Rev. Genet. 2006, 40, 77–105. [Google Scholar] [CrossRef] [PubMed]
  22. Folta, K.M.; Carvalho, S.D. Photoreceptors and control of horticultural plant traits. HortScience 2015, 50, 1274–1280. [Google Scholar] [CrossRef]
  23. Zhang, T.; Maruhnich, S.A.; Folta, K.M. Green light induces shade avoidance symptoms. Plant Physiol. 2011, 157, 1528–1536. [Google Scholar] [CrossRef]
  24. Jang, I.T.; Lee, J.H.; Shin, E.J.; Nam, S.Y. Evaluation of growth, flowering, and chlorophyll fluorescence responses of Viola cornuta cv. Penny Red Wing according to spectral power distributions. J. People Plants Environ. 2023, 26, 335–349. [Google Scholar] [CrossRef]
  25. Park, B.G.; Lee, J.H.; Shin, E.J.; Kim, E.A.; Nam, S.Y. Light quality influence on growth performance and physiological activity of Coleus cultivars. Int. J. Plant Biol. 2024, 15, 807–826. [Google Scholar] [CrossRef]
  26. Geisler, M.; Aryal, B.; Di Donato, M.; Hao, P. A critical view on ABC transporters and their interacting partners in auxin transport. Plant Cell Physiol. 2017, 58, 1601–1614. [Google Scholar] [CrossRef] [PubMed]
  27. Tanaka, R.; Tanaka, A. Tetrapyrrole biosynthesis in higher plants. Annu. Rev. Plant Biol. 2007, 58, 321–346. [Google Scholar] [CrossRef] [PubMed]
  28. Terashima, I.; Fujita, T.; Inoue, T.; Chow, W.S.; Oguchi, R. Green light drives leaf photosynthesis more efficiently than red light in strong white light: Revisiting the enigmatic question of why leaves are green. Plant Cell Physiol. 2009, 50, 684–697. [Google Scholar] [CrossRef]
  29. Johkan, M.; Shoji, K.; Goto, F.; Hahida, S.-N.; Yoshihara, T. Effect of green light wavelength and intensity on photomorphogenesis and photosynthesis in Lactuca sativa. Environ. Exp. Bot. 2012, 75, 128–133. [Google Scholar] [CrossRef]
  30. Ouzounis, T.; Rosenqvist, E.; Ottosen, C.-O. Spectral effects of artificial light on plant physiology and secondary metabolism: A review. HortScience 2015, 50, 1128–1135. [Google Scholar] [CrossRef]
  31. Schenkels, L.; Saeys, W.; Lauwers, A.; De Proft, M.P. Green light induces shade avoidance to alter plant morphology and increases biomass production in Ocimum basilicum L. Sci. Hortic. 2020, 261, 109002. [Google Scholar] [CrossRef]
  32. Xu, D. COP1 and BBXs-HY5-mediated light signal transduction in plants. New Phytol. 2020, 228, 1748–1753. [Google Scholar] [CrossRef] [PubMed]
  33. McClung, C.R. Plant circadian rhythms. Plant Cell 2006, 18, 792–803. [Google Scholar] [CrossRef] [PubMed]
  34. Halkier, B.A.; Gershenzon, J. Biology and biochemistry of glucosinolates. Annu. Rev. Plant Biol. 2006, 57, 303–333. [Google Scholar] [CrossRef] [PubMed]
  35. Clouse, S.D. Brassinosteroid signal transduction: From receptor kinase activation to transcriptional networks regulating plant development. Plant Cell 2011, 23, 1219–1230. [Google Scholar] [CrossRef]
  36. Goldschmidt-Clermont, M.; Bassi, R. Sharing light between two photosystems: Mechanism of state transitions. Curr. Opin. Plant Biol. 2015, 25, 71–78. [Google Scholar] [CrossRef]
Figure 1. The relative value of irradiance of the three light treatments. (A): red-blue light; (B): red-blue-green light; (C): red-blue-far-red light.
Horticulturae 11 00701 g001
Figure 2. Plant growth of micropropagated strawberries under different light treatments.
Horticulturae 11 00701 g002
Figure 3. The influence of different light qualities on the chlorophyll a (A), chlorophyll b (B), chlorophyll a/b (C), and carotenoid (D) contents in micropropagated strawberries. FW: fresh weight. Lowercase letters indicate the significant difference according to Duncan’s multiple range test at p ≤ 0.05.
Horticulturae 11 00701 g003
Figure 4. Effects of different light qualities on the contents of soluble protein (A) and sugar (B) in micropropagated strawberries. FW: fresh weight. Lowercase letters indicate the significant difference according to Duncan’s multiple range test at p ≤ 0.05.
Horticulturae 11 00701 g004
Figure 5. Volcano plots of differentially expressed genes in micropropagated strawberries under green (A) and far-red light (B).
Horticulturae 11 00701 g005
Figure 6. The upregulated (A) and downregulated (B) differentially expressed genes in micropropagated strawberries under RGB.
Horticulturae 11 00701 g006
Figure 7. The upregulated (A) and downregulated (B) differentially expressed genes in micropropagated strawberries under RBFR.
Horticulturae 11 00701 g007
Figure 8. KEGG enrichment analysis of the intersection of differentially expressed up-regulated (A) and down-regulated (B) genes in micropropagated strawberries under RGB.
Horticulturae 11 00701 g008
Figure 9. KEGG enrichment analysis of the intersection of differentially expressed up-regulated (A) and down-regulated (B) genes in micropropagated strawberries under RBFR.
Horticulturae 11 00701 g009
Figure 10. Heat map of differentially expressed genes induced by green (A) and far-red (B) light in micropropagated strawberries.
Horticulturae 11 00701 g010
Figure 11. Validation of differentially expressed genes under green (A) and far-red (B) light treatments by qRT-PCR.
Horticulturae 11 00701 g011
Table 1. The details of the primers used for RT-qPCR.
Gene idPrimerPrimer Sequence (5′ → 3′)Annealing Temperature (°C)Amplicon
Size (bp)
FvH4_7g27810CDKSF4-FACAGTGTGGTGGTGTTCCTC59210
CDKSF4-RGACGCTTTCCTTGTTGCTCC
FvH4_5g15090PKS3-FGGATTGATCAGGACGGCGAA60292
PKS3-RGAACCACTGCAGACAAAGCC
FvH4_4g21800HY5-FACAAGCCCGTGAGAGGAAAA59181
HY5-RACAGCTTGCACACTGATGATT
FvH4_6g17063UGT73C1-FCCAAAGGGCTACAAGAGCCA60256
UGT73C1-RACCTCAATGCGATCTGGCAA
FvH4_2g23840IPT3-FCATGGTTGGTACATTAATTTGGTCA59257
IPT3-RCCGTCATTTCTCAGGTTCCCA
Table 2. Plant growth of micropropagated strawberries as affected by different light combinations.
Light QualityNumber of Shoots/PlantPlant
Height (cm)
Shoot Fresh Weight (g/Plant)Leaf Weight (g/Plant)Callus Weight (g/Plant)
RB1.378 ± 0.067 b *5.107 ± 0.090 b0.460 ± 0.024 a0.162 ± 0.005 a0.052 ± 0.004 b
RGB1.712 ± 0.119 a5.240 ± 0.092 b0.434 ± 0.023 a0.150 ± 0.013 a0.049 ± 0.001 b
RBFR1.914 ± 0.067 a6.027 ± 0.038 a0.460 ± 0.019 a0.151 ± 0.011 a0.059 ± 0.002 a
* Lowercase letters indicate the significant difference according to Duncan’s multiple range test at p ≤ 0.05.
Disclaimer/Publisher’s Note: The statements, opinions and data contained in all publications are solely those of the individual author(s) and contributor(s) and not of MDPI and/or the editor(s). MDPI and/or the editor(s) disclaim responsibility for any injury to people or property resulting from any ideas, methods, instructions or products referred to in the content.

