Article

Identification of Potential Key Genes for Stem Polysaccharide Synthesis Based on Transcriptome Analysis of Different Developmental Stages of Dendrobium officinale

1
College of Agriculture, Guangxi University, Nanning 530004, China
2
Institute of Biotechnology, Guangxi Academy of Agricultural Sciences, Nanning 530007, China
*
Authors to whom correspondence should be addressed.
These authors contributed equally to this work.
Horticulturae 2025, 11(6), 679; https://doi.org/10.3390/horticulturae11060679 (registering DOI)
Submission received: 27 March 2025 / Revised: 8 June 2025 / Accepted: 9 June 2025 / Published: 13 June 2025
(This article belongs to the Section Genetics, Genomics, Breeding, and Biotechnology (G2B2))

Abstract

:
Dendrobium officinale holds significant value as a traditional medicinal plant, with its stems serving as the primary medicinal component and polysaccharides acting as the key active ingredients. To systematically analyze the biosynthetic pathways of polysaccharides and identify key genes involved in polysaccharide synthesis, this research assessed the water-soluble polysaccharide content and conducted transcriptome sequencing on stem tissues of D. officinale at different developmental stages. The findings revealed that the water-soluble polysaccharide level in D. officinale stems exhibited an increasing trend followed by a decrease, reaching its peak before flowering. Transcriptome analysis identified 5764, 6408, 4477, and 3809 differentially expressed genes (DEGs) in groups S1 vs. S2, S2 vs. S3, S3 vs. S4, and S4 vs. S5, respectively. The Kyoto Encyclopedia of Genes and Genomes Enrichment Analysis (KEGG) demonstrated that the DEGs in the S1 vs. S2, S2 vs. S3, and S3 vs. S4 groups were enriched in the starch and sucrose metabolism pathways. Based on the transcriptome sequencing results, expression heat maps of genes correlated with the polysaccharide synthesis pathways of D. officinale clearly showed changes in the expression of polysaccharide synthesis-related genes at five stages. Using weighted gene co-expression network analysis (WGCNA), three co-expression modules were identified, showing a significant positive correlation with fluctuations in the water-soluble polysaccharide content. From the light blue module with the highest correlation coefficient, 15 key genes potentially closely related to polysaccharide synthesis were identified. This study provides gene resources for the genetic improvement of D. officinale and detailed reference data for further elucidating the molecular mechanisms of polysaccharide biosynthesis.

1. Introduction

Dendrobium officinale Kimura & Migo is a perennial plant belonging to the Dendrobium SW. of the Orchidaceae family [1]. It thrives in shady, cool, and humid environments. In the wild, D. officinale is often found attached to semi-shaded rocks, tree trunks, or cliffs. It is commonly distributed in temperate and cool regions characterized by high humidity, typically found at altitudes ranging from 450–900 m. The species exhibits optimal growth within a temperature range of 20–25 °C [2]. It is a traditional and precious Chinese medicinal material with a medicinal history of over two thousand years [3]. It possesses unique medicinal value, with the stem being the primary medicinal part. The stem contains various chemical components, such as polysaccharides, alkaloids, amino acids, and flavonoids, with polysaccharides being the main active ingredients [4,5]. Modern pharmacological studies have demonstrated the antioxidant [6,7], anti-tumor [8,9], antimicrobial [10,11,12], immune-boosting [13,14], and gastrointestinal function-enhancing [15,16] properties of the polysaccharides present in D. officinale. Its polysaccharides comprise multiple monosaccharides, such as mannose, glucose, fructose, xylose, and arabinose. The content and proportion of these polysaccharides can influence the strength of their pharmacological activities [17]. The quality of medicinal materials derived from D. officinale is typically evaluated based on the polysaccharide content [18,19].
In higher plants, the synthesis of polysaccharides involves the utilization of sucrose as a precursor. Through a series of processes, organic matter derived from photosynthesis undergoes decomposition and transformation to yield polysaccharides [20]. These compounds serve as energy sources and play pivotal roles in nutrient storage and metabolism. In D. officinale, the accumulation of polysaccharides is intricately linked to its growth, exhibiting notable variations across different physiological stages and among various nutritional organs [2,21]. Throughout the growth and developmental phases, there is an initial rise followed by a subsequent decline in the total polysaccharide content within the stem. The decrease in the total polysaccharide content in the later stage was related to the decrease in glucose content [22]. Fifteen sucrose synthase (SUS) genes were identified through transcriptome analysis of D. officinale stems; these genes exhibited two distinct expression patterns at four developmental stages, suggesting that SUS genes are related to the metabolic process of stem polysaccharides [21]. The accumulation of mannose in D. officinale was highly correlated with the transcription level of GDP-mannose transporter (GMT) genes. DoGMT1, DoGMT2, and DoGMT3 can transport GDP-mannose and participate in the polysaccharide synthesis of D. officinale [23]. The accumulation of polysaccharides in D. officinale is a complex physiological process modulated by the coordinated action of multiple genes [24]. Although current studies have identified several functional genes involved in polysaccharide biosynthesis, our understanding of the molecular mechanisms governing polysaccharide accumulation during D. officinale development remains limited and key regulatory genes remain to be discovered.
Zhang et al. [25] performed transcriptome analysis on D. officinale at two stages, seedling and adult plants, which resulted in the identification of numerous differentially expressed genes (DEGs) closely linked to polysaccharide synthesis, including 170 glycosyltransferase (GT) genes and 37 cellulose synthase genes. Nevertheless, despite the identification of a notable number of DEGs linked to polysaccharide synthesis, the accuracy of key gene discovery remained inadequate, primarily due to the fact that the polysaccharide content in D. officinale exhibits a dynamic pattern of an initial increase followed by a decrease during its growth process, with the flowering stage serving as the critical turning point. Transcriptome analysis limited to only two stages (seedling and adult plant) is insufficient to capture the expression patterns of key genes involved in polysaccharide biosynthesis. In Codonopsis pilosula, polysaccharide quantification and gene expression profiling across 12 time points provided valuable insights for determining the optimal harvesting time [26]. Furthermore, an integrated metabolomic and transcriptomic analysis was conducted across four distinct developmental stages (germination, vegetative growth, early flowering, and flowering) in Cynomorium songaricum, elucidating key biosynthetic pathways of polysaccharides and flavonoids [27]. Similar to C. pilosula and C. songaricum, D. officinale exhibit dynamic changes in polysaccharide accumulation throughout their growth cycles. Thus, systematic analysis across multiple developmental stages is essential to comprehensively characterize the expression profiles of polysaccharide-related genes and to identify key genes involved in polysaccharide biosynthesis. This study collected D. officinale samples across five critical developmental stages: early vegetative, vigorous vegetative growth, cessation of apical growth, full anthesis, and senescence. The selected samples encompass critical developmental stages exhibiting significant fluctuations in polysaccharide content, thereby revealing comprehensive expression dynamics of genes associated with polysaccharide metabolic pathways.
In this study, water-soluble polysaccharides were measured, and transcriptome sequencing was conducted on the stem tissues of D. officinale at these developmental stages. A series of polysaccharide synthesis-related genes were identified, and their correlation with stem polysaccharide content was analyzed. Moreover, a polysaccharide synthesis pathway map and a related gene expression heatmap were developed to more directly display the expression changes of polysaccharide synthesis-related genes at different developmental stages. This research displays the reference data to further elucidate the molecular mechanism of polysaccharide metabolism in D. officinale.

2. Materials and Methods

2.1. Materials

D. officinale samples were collected from Xilin County, Baise City, Guangxi, China, at five developmental stages: S1 (2 months after sprouting, early vegetative), S2 (5 months after sprouting, vigorous vegetative growth), S3 (11 months after sprouting, cessation of apical growth), S4 (13 months after sprouting, full anthesis), and S5 (15 months after sprouting, senescence). Three biological replicates were taken at each stage. Following collection, the samples were promptly frozen in liquid nitrogen and preserved in an ultra-low-temperature freezer at −80 °C. The transcriptome sequencing was outsourced to Genepioneer Biotechnologies Co., Ltd. (Nanjing, China).

2.2. Determination of Water-Soluble Polysaccharide Content

The stems of D. officinale were oven-dried and subsequently assessed for water-soluble polysaccharide content following the method prescribed by the Chinese Pharmacopoeia Commission [19]. The powder (0.3 g) was extracted in 200 mL of distilled water and kept in a water bath for 2 h at 95 °C. The solution was filtered and diluted to a final volume of 250 mL with distilled water. From this solution, 2 mL was transferred to a 15 mL centrifuge tube, where 10 mL of absolute ethanol was added and thoroughly mixed. The mixture was refrigerated at 4 °C for 1 h to facilitate polysaccharide precipitation, followed by centrifugation at 4000 rpm for 20 min, after which the supernatant was discarded. The precipitate was washed twice with 8 mL of 80% (v/v) ethanol, with centrifugation at 4000 rpm for 10 min performed after each wash, and the supernatants were discarded. The remaining precipitate was then dissolved in hot distilled water, and the resulting solution was transferred to a 25 mL volumetric flask. Finally, the volume was adjusted to the mark with distilled water to obtain the polysaccharide test solution. The polysaccharide test solution (1 mL) was mixed with 1 mL of 5% phenol solution, followed by the addition of 5 mL of concentrated sulfuric acid. The mixture was heated in a boiling water bath for 20 min and subsequently cooled in an ice bath for 5 min. Using the corresponding reagent as the blank, the absorbance was measured at 488 nm utilizing an ultraviolet-visible spectrophotometer (UV-1780, Shimadzu, Kyoto, Japan). Glucose solutions at different concentrations (10, 20, 40, 60, 80, and 100 μg/mL) were used as standard solutions. The standard curve was y = 11.655 × −0.0116, r2 = 0.9992 (n = 6), with a linear range of 0.01–0.1 mg. Each sample result represents the average of three biological replicates, with triplicate measurements per replicate.

2.3. Transcriptome Sequencing and Analysis

2.3.1. Ribonucleic Acid Extraction and Complementary DNA Library Development

The total ribonucleic acid (RNA) from the stems of D. officinale was extracted utilizing a FastPure Plant Total RNA Isolation Kit (Polysaccharides & Polyphenolics–rich) (RC401-01, Vazyme Biotech Co., Ltd., Nanjing, China). The concentration and purity of the extracted RNA were evaluated by employing a Nanodrop 2000 (Thermo Fisher Scientific Inc., Waltham, MA, USA). The integrity of the RNA was examined through agarose gel electrophoresis. The RNA integrity number (RIN) was assessed using an Agilent 2100 Bioanalyzer (Agilent Technologies Inc., Santa Clara, CA, USA), with a threshold of RIN ≥8. High-quality RNA meeting these stringent criteria was then used to develop the complementary DNA (cDNA) library. Eukaryotic mRNA was enriched using magnetic beads coated with Oligo (dT) and subsequently subjected to random fragmentation by adding a fragmentation buffer. Utilizing the mRNA as a template, the first strand of cDNA was synthesized with random hexamers. Subsequently, buffer, dNTPs, RNase H, and DNA polymerase I were introduced to synthesize the second strand of cDNA. The cDNA underwent purification by employing AMPure XP beads. The purified double-stranded cDNA underwent end repair, A-tailing, and adapter ligation. Fragment size selection was performed utilizing AMPure XP beads. Finally, the cDNA library was obtained by polymerase chain reaction enrichment.

2.3.2. Sequencing and Raw Data Filtering

The sequencing was performed using the NovaSeq 6000 platform. After obtaining the raw data, adapter sequences and low-quality reads were removed following the method by Chen et al. [28], yielding high-quality clean data to ensure the reliability of subsequent analyses.

2.3.3. Reference Genome Alignment

Following Kim et al. [29,30], the clean reads were aligned to the reference genome (ASM160598v2) in orientation mode using HISAT2 software (v2.1.0) to generate mapped reads for subsequent transcript assembly and expression level calculation. Simultaneously, the alignment outcomes of this transcriptome sequencing were assessed for quality, encompassing sequencing saturation, gene coverage, distribution of reads in different regions of the reference genome, and distribution of reads on various chromosomes.

2.3.4. Functional Annotation and GO, KEGG Analysis of Differentially Expressed Genes

After obtaining the read counts of genes, differential expression analysis was performed using the DESeq Rpackage (1.10.1); genes with a false discovery rate value <0.05 and absolute fold change ≥2 were retained as DEGs, and the functions of DEGs were annotated on the base network database [31,32,33,34]. Based on the GO database, genes were classified according to the biological process (BP) they participate in, the cellular component (CC) that make up in cells, and the molecular function (MF) they perform, and GO functional enrichment analysis of DEGs was performed by Goatools [35]. Then, genes were classified according to the pathways they participate in and the functions they perform using the KEGG database, and KEGG pathway enrichment analysis of DEGs was conducted by KOBAS [36].

2.3.5. Expression Trend and Weighted Gene Co-Expression Network Analysis

The R language mfuzz package (v2.58.0) was used to analyze the expression trend, and the number of clusters was controlled at 10. The R language WGCNA package (v1.72-5) was used for weighted gene co-expression network analysis with a soft-thresholding power of 16 (R2 >0.9), and genes with expression levels less than 0.5 were filtered out. The ‘pearson’ method was used to calculate the correlation between each trait and module and the corresponding pvalue. The corr.test function of R language was used to calculate the correlation between genes based on the ‘spearman’ method. The relationships with p values greater than 0.01 and correlations less than 0.9 were filtered out, and then visualized by Cytoscape (v3.10.1).

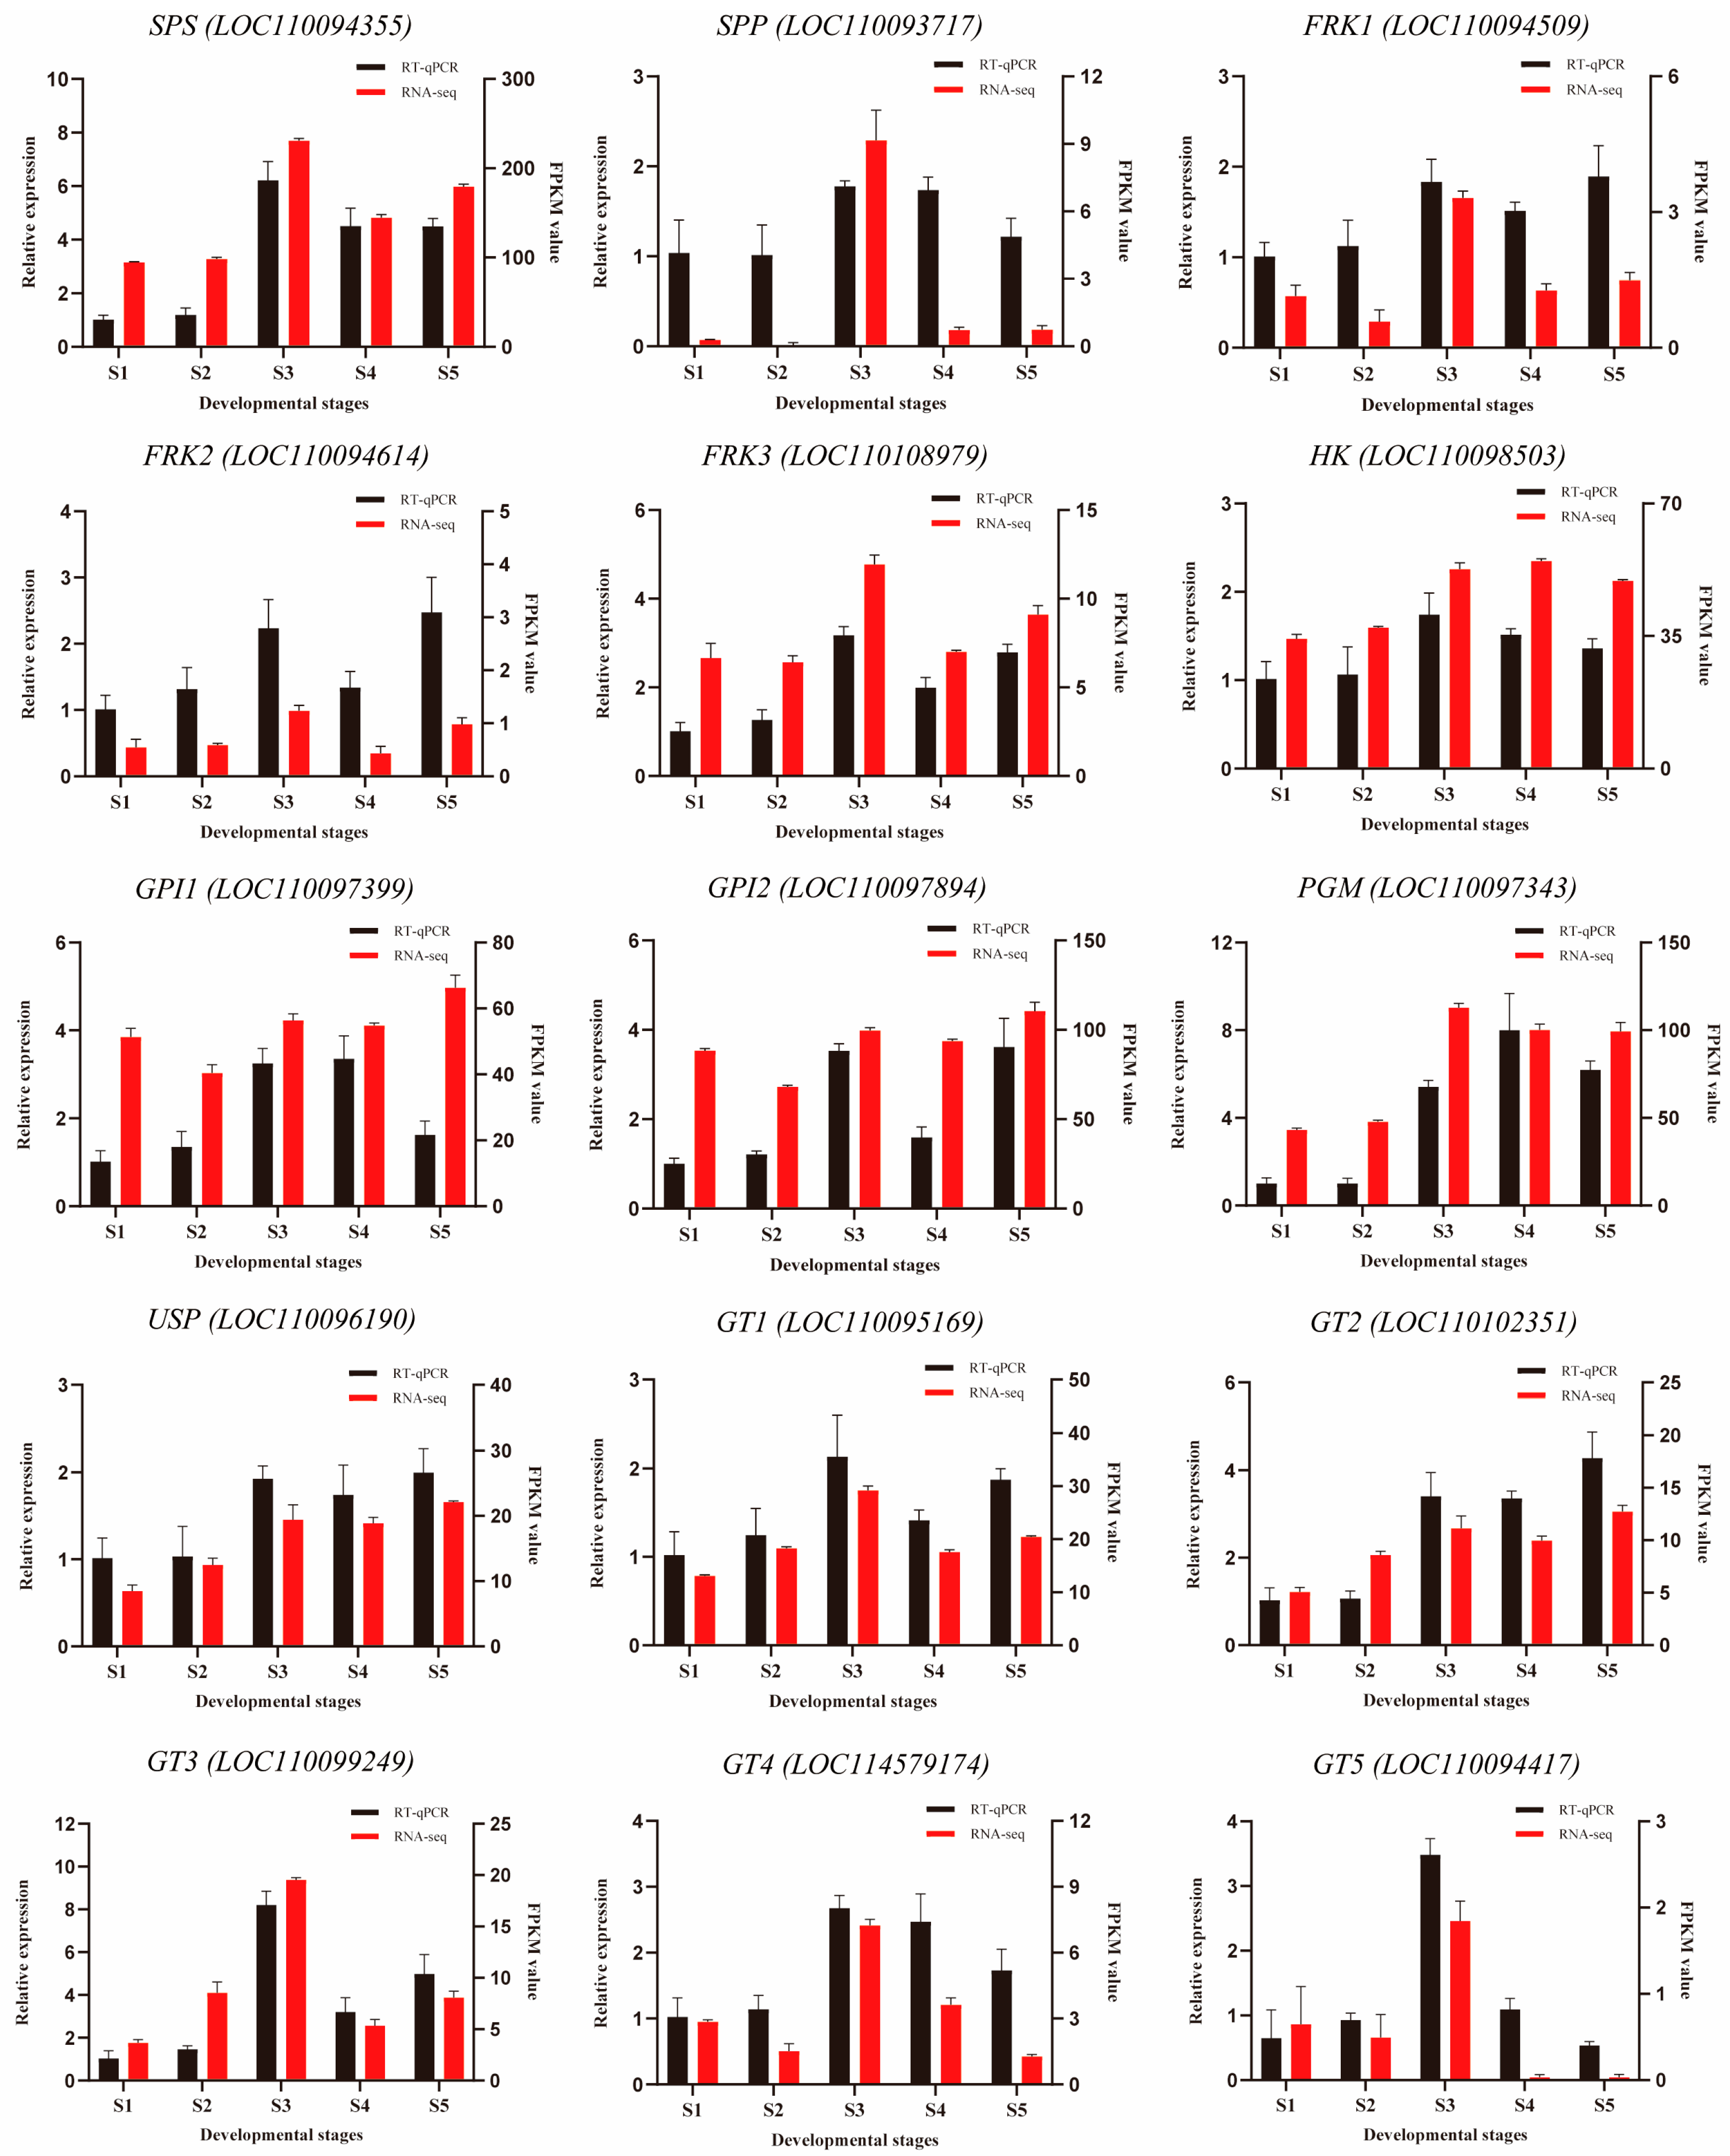
2.3.6. Sugar Metabolism Genes with qRT-PCR Analysis

The gene primers were designed for qRT-PCR (Table S1), and the test kit of ChamQ SYBR qPCR Master Mix (Q311, Vazyme Biotech Co., Ltd., Nanjing, China) was used for qRT-PCR. qRT-PCR was performed using a real-time fluorescence quantitative PCR instrument (QuantStudio 3, Thermo Fisher Scientific Inc., Waltham, MA, USA). The expression levels were normalized to DoActin1 as an internal reference and calculated using the 2−ΔΔCt method. Three biological samples were included and three replicates were performed per sample.

3. Results

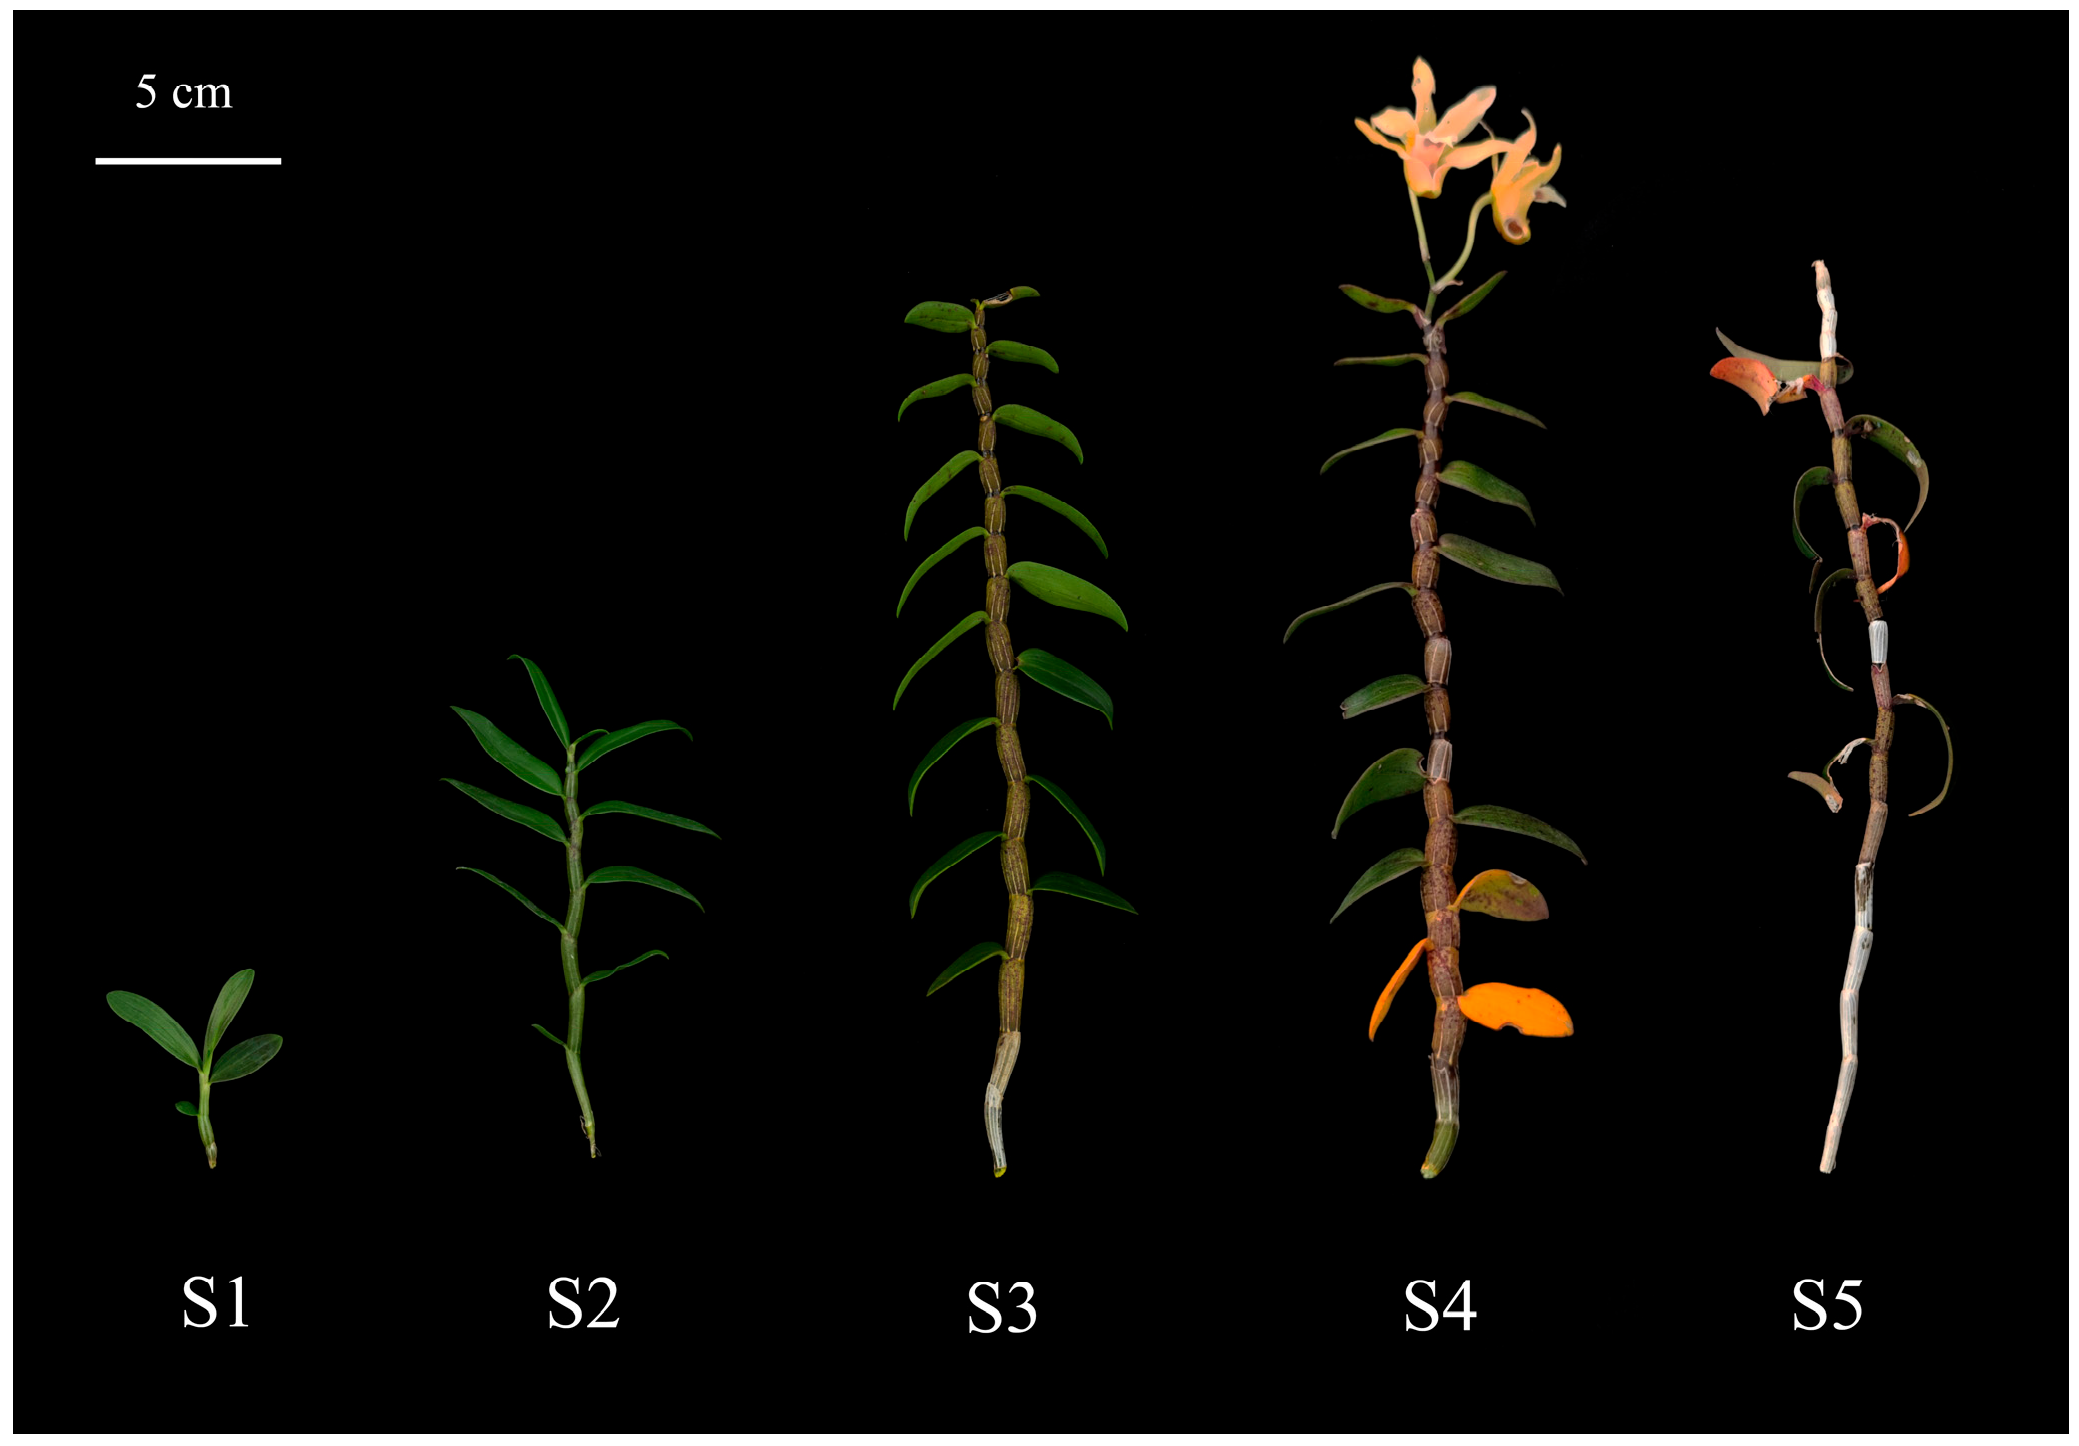
3.1. Phenotypic Changes and Water-Soluble Polysaccharide Content Variations in D. officinale at Different Developmental Stages

During the S1–S2 period, D. officinale undergoes vegetative growth, with carbohydrates primarily allocated for the rapid growth and development of the plant. Subsequently, after the cessation of apical growth in the S3 period, polysaccharides rapidly accumulate, serving as nutrient reserves to support the plant’s transition from vegetative to reproductive growth. Moving from the S4 to S5 period, the plant progresses from the flowering stage to the senescence stage, characterized by gradual leaf shedding and stems gradually turning white (Figure 1). The content of water-soluble polysaccharides in the stems shows an initial increase followed by a gradual decline during the S1–S5 period (Table 1). This reached its highest point in the S3 period, with a water-soluble polysaccharide content of 40.44%. In the S4 period, the water-soluble polysaccharide content decreased by 11.92% compared with that in the S3 period. In the S5 period, due to leaf senescence and shedding, photosynthesis decreases, leading to decreased synthesis of carbohydrates, causing a gradual decline in polysaccharide content. Moreover, the S1–S5 period represents several important growth and development stages, which is of great significance for investigating the accumulation and degradation of polysaccharides in this species.

3.2. Transcriptome Quality Examination and Statistics

Transcriptome sequencing was performed on samples from five stages of D. officinale, yielding 113.50 Gb of total data. For every sample, the clean data attained 6.40 Gb or above, with Q30 nucleobase percentages reaching 93.41% or higher. The comparison efficiency of clean reads to the reference genome exceeded 88.68% for every sample (Table 2). The expression density ranged from 0 to 0.6 (Figure 2a). The principal component analysis (PCA) results demonstrated that the three biological replicates of each sample clustered together (Figure 2b), indicating good reproducibility among samples. However, samples from five stages were markedly separated, suggesting substantial differences in gene expression levels across different stages. Pearson analysis yielded consistent results (Figure 2c).

3.3. Expression Pattern Analysis

Expression pattern clustering of all genes was carried out. The analysis results showed that all DEGs could be divided into 10 clustering patterns (Figure 3). Cluster 8 and cluster 9 had higher expression levels at stage S1 and cluster 7 and cluster 8 had higher expression levels at stage S2. The genes with higher expression levels at stages S1 and S2 may be related to plant nutritional growth and development. Cluster 3, cluster 4, and cluster 5 had higher expression levels at stage S3, and these genes may be related to polysaccharide accumulation. Cluster 2 and cluster 6 had higher expression levels at stage S4, and these genes may be related to plant reproductive growth. Cluster 5, cluster 6, and cluster 10 were highly expressed at stage S5, which may be related to the senescence process of plants.

3.4. Analysis of DEGs

3.4.1. Statistics of DEGs

The statistical findings in Table 3 indicate that there were a total of 5764 DEGs between the S1 and S2 groups, with genes exhibiting elevated expression accounting for 50.3% and genes exhibiting reduced expression accounting for 49.7%. Between groups S2 and S3, there were 6408 DEGs, with upregulated genes representing 42.7% and downregulated genes representing 57.3%. Between groups S3 and S4, 4477 DEGs were found, with genes exhibiting upregulation representing 49.5% and genes exhibiting downregulation accounting for 50.5%. Furthermore, between groups S4 and S5, there were 3809 DEGs, with upregulated genes accounting for 51.4% and downregulated genes accounting for 48.6%. The highest number of DEGs was noted between groups S2 and S4, while the lowest number of DEGs was found between groups S4 and S5. Additionally, there were 617 shared DEGs among groups S1 vs. S2, S2 vs. S3, S3 vs. S4, and S4 vs. S5 (Figure 4).

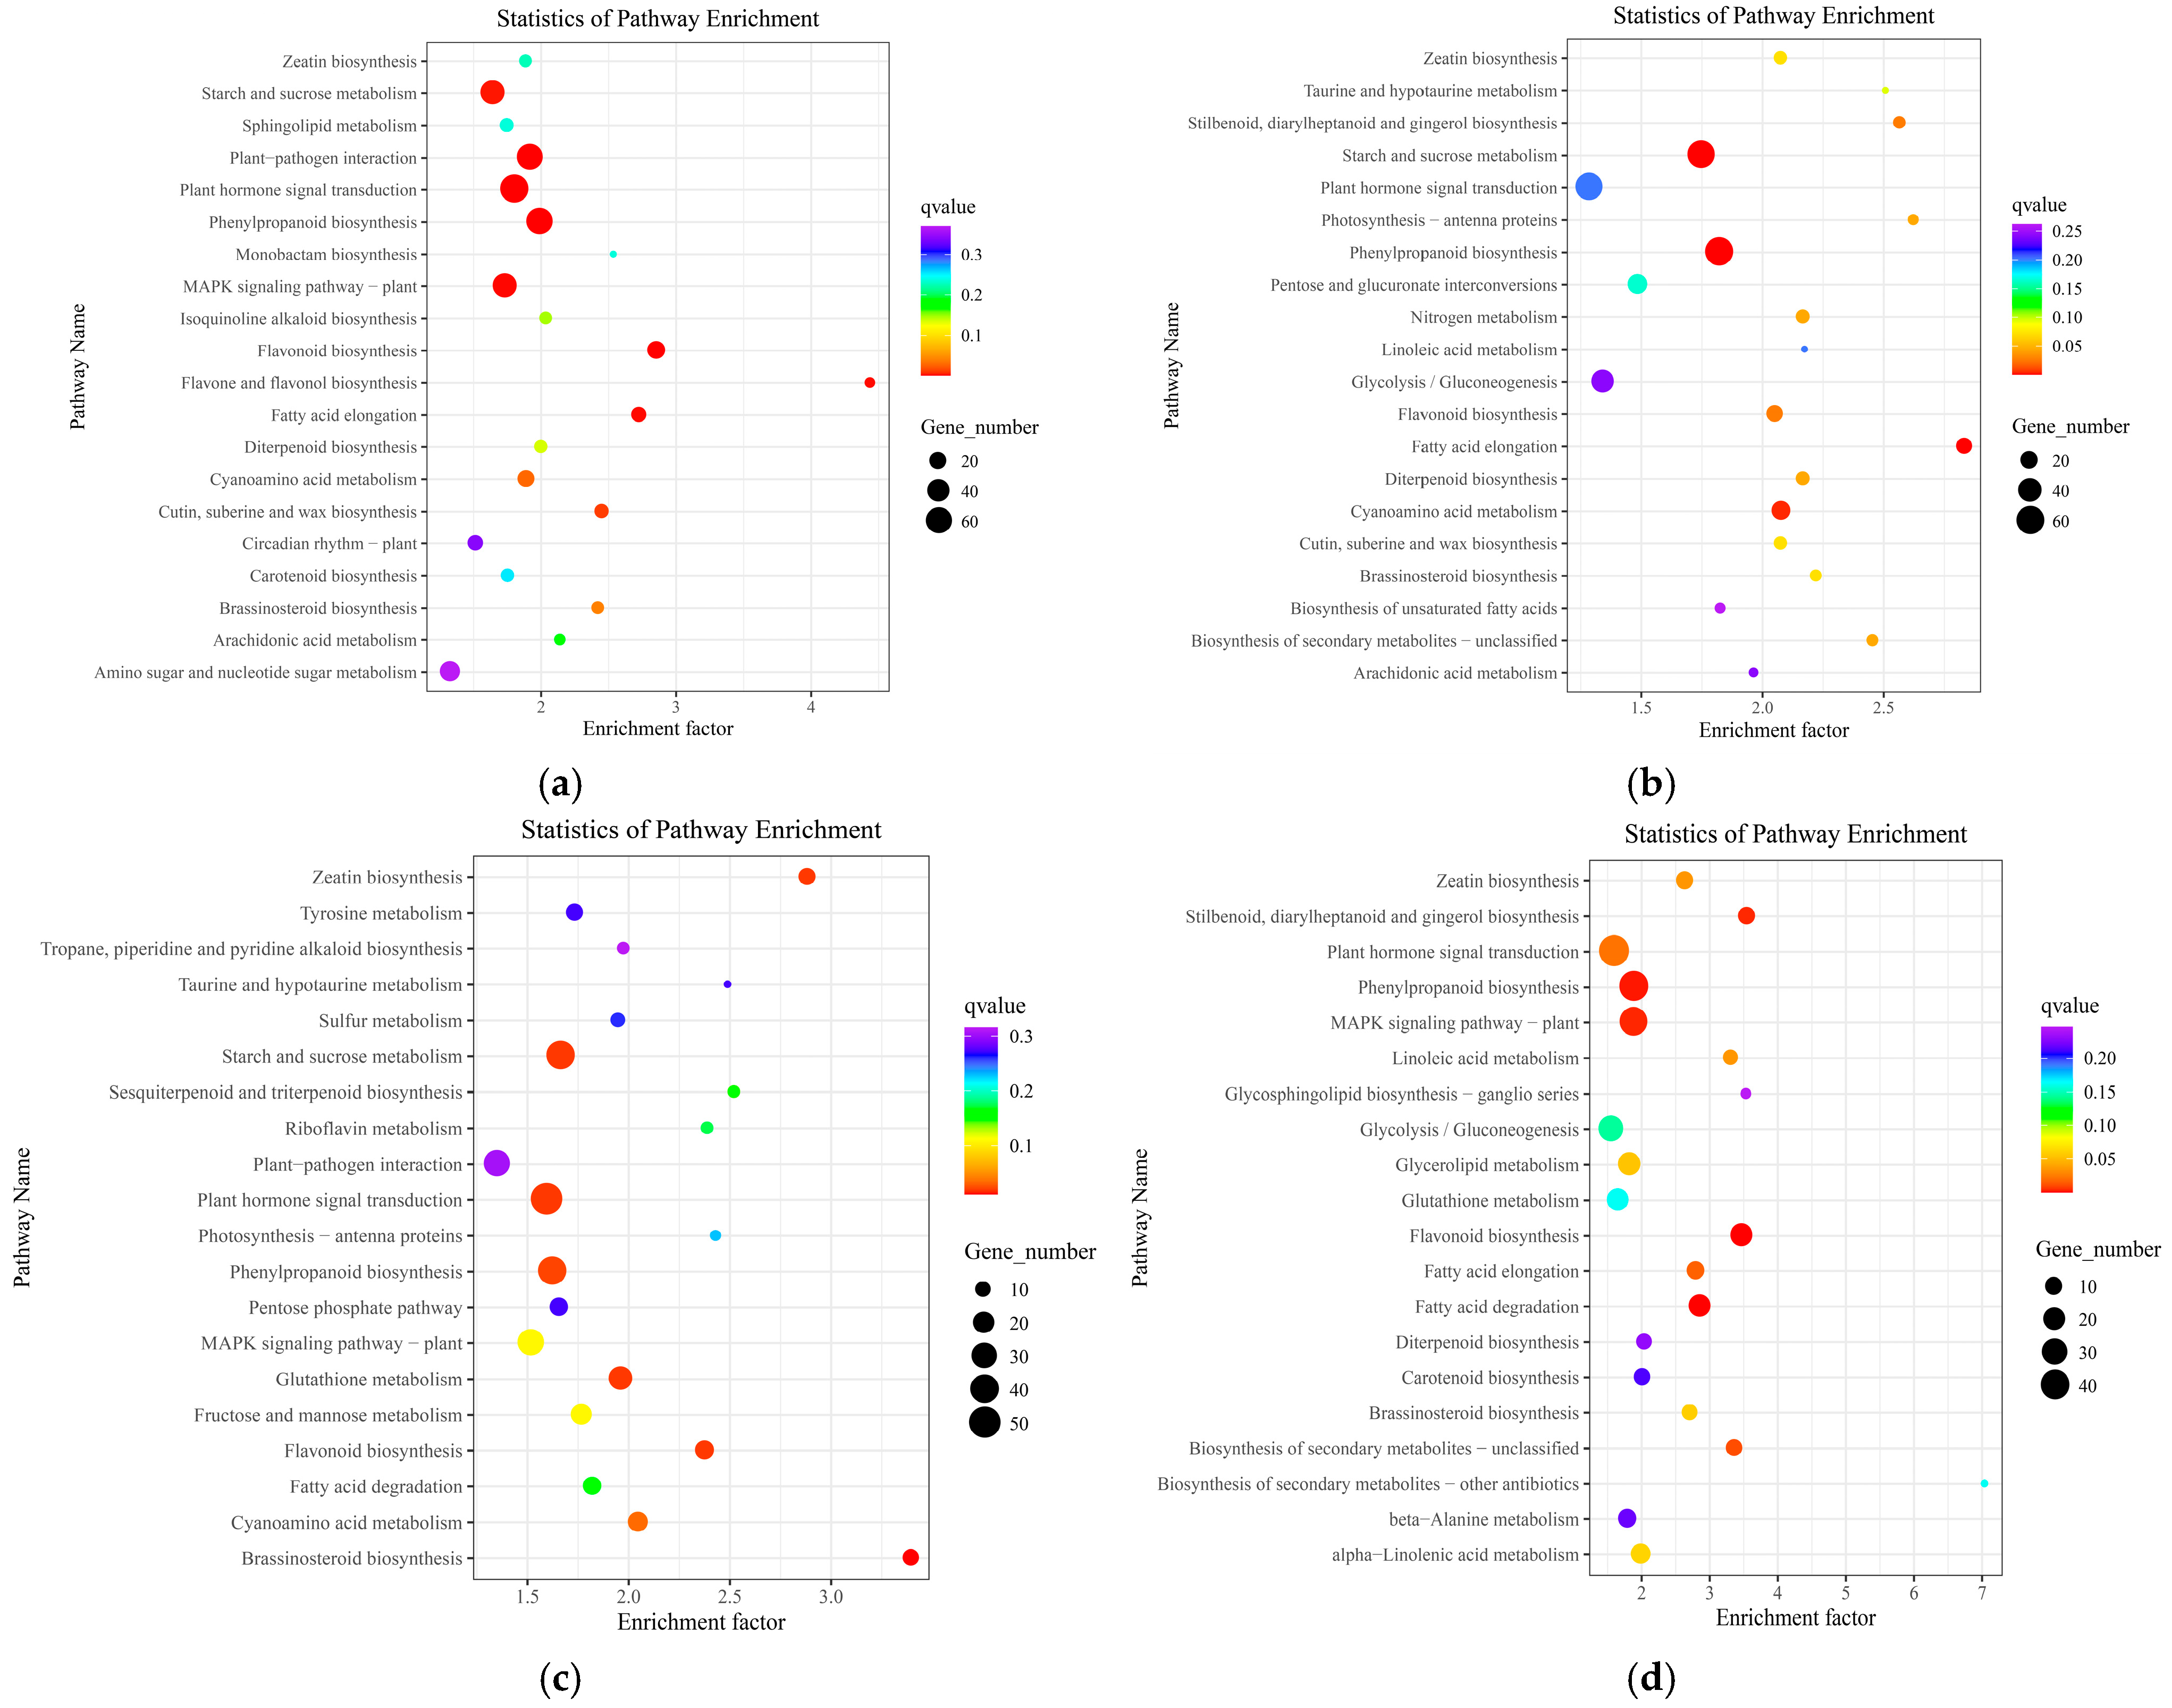
3.4.2. KEGG Pathway Analysis of DEGs

KEGG functional enrichment analysis was further conducted for DEGs at different developmental stages, and the top 20 significantly enriched metabolic pathways were selected (Figure 5). Among them, DEGs in the S1 vs. S2 group were mainly enriched in pathways including starch and sucrose metabolism, plant–pathogen interactions, plant hormone signal transduction, and phenylpropanoid biosynthesis. DEGs in the S2 vs. S3 group were mainly enriched in pathways such as starch and sucrose metabolism, phenylpropanoid biosynthesis, fatty acid elongation, and cyanoamino acid metabolism. DEGs in the S3 vs. S4 group were mainly enriched in pathways involved in starch and sucrose metabolism, plant hormone signal transduction, phenylpropanoid biosynthesis, and glutathione metabolism. DEGs in the S4 vs. S5 group were mainly enriched in pathways such as plant hormone signal transduction, phenylpropanoid biosynthesis, and MAPK signaling pathway–plants. The results showed that DEGs in groups S1 vs. S2, S2 vs. S3, and S3 vs. S4 were significantly enriched in the starch and sucrose metabolism pathway, with 49, 57, and 39 enriched genes, respectively. It is speculated that these genes are closely related to the changes in the polysaccharide content of D. officinale at different stages. DEGs in the S4 vs. S5 group were not enriched in the starch and sucrose metabolism pathway, indicating that there were no significant differences in the expression of genes related to starch and sucrose metabolism between these two periods.

3.5. Analysis of the Biosynthetic Pathway of D. officinale Stem Polysaccharides

Based on the transcriptome analysis of samples from different developmental stages, 178 DEGs linked to polysaccharide synthesis were found. A polysaccharide synthesis pathway map was developed (Figure 6). By analyzing the expression of genes implicated in the biosynthesis of D. officinale polysaccharides, it was found that mannose-6-phosphate isomerase (MPI), UDP-glucose-4,6-dehydratase (RHM), UDP-glucose dehydrogenase (UGDH), and UDP-glucuronate-4-epimerase (UGE) had similar expression patterns, with higher relative expression levels in the early stages of development. Ketohexokinase (KK), xylose isomerase (XI), UDP-arabinopyranose mutase (UAM), glucose-6-phosphate isomerase (GPI), phosphoglucomutase (PGM), and UDP-sugar pyrophosphorylase (USP) also had identical expression patterns, with higher relative expression levels in the later stages of development. These genes with similar expression patterns may assume important synergistic roles in the polysaccharide synthesis process. Most of the other polysaccharide synthesis-related genes had varying degrees of relative expression levels at different stages. Among the four sucrose phosphate synthase (SPS) genes, LOC110108196 exhibited the highest relative expression level at stage S1, while LOC110094355 showed the highest relative expression level at stage S3. At stage S4, both LOC110108530 and LOC110103949 displayed the highest relative expression levels. Both sucrose phosphate phosphatase (SPP) genes had higher relative expression levels at stage S3, with LOC110093717 having an even higher relative expression level at stage S5. Among the six SUS genes, LOC110092960 and LOC110111733 showed higher relative expression levels at stages S2 and S3, while LOC110115043 and LOC110096435 had higher expression levels at stage S2. Moreover, LOC110110417 had higher relative expression levels at stages S2 and S4, while LOC110103989 had higher relative expression levels at stages S3, S4, and S5. Most SUS genes had higher relative expression levels at stage S2. Among the four hexokinase (HK) genes, LOC110098503 exhibited higher relative expression levels at stages S3, S4, and S5, while LOC110095985 showed higher relative expression levels at stages S2 and S5. Additionally, LOC110105045 and LOC110114236 displayed the highest relative expression levels at stages S1 and S4, respectively. The two phosphomannomutase (PMM) genes, LOC110097581 and LOC110100273, exhibited the highest relative expression levels at stages S3 and S5, respectively. Among the four mannose-1-phosphate guanylyl transferase (GMPP) genes, LOC110099269 exhibited the highest relative expression level at stage S5. Moreover, LOC110114184 showed higher relative expression levels at stages S1 and S2, while LOC110103545 had higher relative expression levels at stages S2 and S4. Lastly, LOC110099858 displayed higher relative expression levels at stages S3 and S4. Numerous invertase (INV), fructokinase (FRK), and GT genes were found to exhibit higher relative expression levels at each developmental stage.

3.6. Weighted Gene Co-Expression Network Analysis

Through WGCNA, eight modules were identified (Figure 7a,b). Among them, the light-blue (3698 genes), bisque (4071 genes), and brown (1110 genes) modules showed significant positive correlations with the changes in water-soluble polysaccharide content, with correlation coefficients of 0.91 (p = 4 × 10⁻⁶), 0.8 (p = 3 × 10⁻⁴), and 0.51 (p = 0.05), respectively. In contrast, the cyan (1975 genes) and blue (4112 genes) modules exhibited significant negative correlations with the changes in water-soluble polysaccharide content, with correlation coefficients of −0.73 (p = 0.002) and −0.52 (p = 0.04), respectively. Analysis of gene expression patterns revealed that polysaccharide-related genes in the light-blue module exhibited relatively high expression levels during stage S3, while those in the bisque and brown modules showed predominant expression during stages S4 or S5, respectively (Figure 7b). Given that the most rapid polysaccharide accumulation occurs specifically during stage S3, we selected the polysaccharide-related genes from the light-blue module for in-depth analysis. Fifteen genes involved in polysaccharide biosynthesis pathways were identified in the light-blue module, including SPS (LOC110094355), SPP (LOC110093717), HK (LOC110098503), FRK (LOC110094509, LOC110094614, and LOC110108979), GPI (LOC110097399 and LOC110097894), PGM (LOC110097343), USP (LOC110096190), and GT (LOC110095169, LOC110102351, LOC110099249, LOC114579174, and LOC110094417). These 15 genes showed significant positive correlations with the changes in polysaccharide content during growth and development. This observation suggested that these genes may be critically involved in the accumulation of polysaccharides in the stems. Furthermore, 260 transcription factors were identified in the light-blue module, including MYB, bZIP, bHLH, and NAC transcription factors. The annotated genes as TFs are listed in the Supplementary Materials (Table S2). Figure 8 shows the co-expression network of 15 polysaccharide-related genes and 260 transcription factors (TFs). Among these 260 TFs, the top 20 most abundant were further identified, as shown in Figure 9a. SPS (LOC110094355) showed the highest number of associated TFs, suggesting that it may be regulated through multiple mechanisms and could play a pivotal role in polysaccharide accumulation. The promoter regions of 15 polysaccharide-related genes harbored diverse cis-acting elements linked to hormones, stresses, and growth (Figure 9b, Table S3), with light responsiveness (141) and MeJA-responsiveness (60) elements being the most abundant. We further validated these genes using quantitative real-time RT-qPCR (Figure 10) and found that their expression patterns were generally consistent with the transcriptome data. These genes all exhibited relatively high expression levels during stage S3, when rapid polysaccharide accumulation occurs.

4. Discussion

This investigation aimed to systematically investigate genes linked to polysaccharide biosynthesis, thereby establishing a theoretical framework for understanding the molecular mechanisms underlying polysaccharide synthesis in D. officinale. The assessment of the water-soluble polysaccharide content in the stems across these stages revealed a pattern of initial increase followed by decrease, with peak levels observed prior to flowering. This observation aligns with that in previously reported research findings [22], indicating that the samples assessed corresponded to their respective developmental stages. The outcome of KEGG enrichment analysis demonstrated that the DEGs in the S1 vs. S2, S2 vs. S3, and S3 vs. S4 groups were enriched in the starch and sucrose metabolism pathway, which is closely related to the changes in polysaccharide content in the stems. These findings demonstrate differential expression of sugar metabolism genes across different stages.
The polysaccharide structures of medicinal plants are relatively complex, with the primary structure primarily consisting of the main chain and side chains. The basic structure of the main chain is usually composed of glucans, fructans, xylans, mannans, galactans, or polymers of two or more monosaccharides, while the side chains are even more complex and diverse. This accounts for the complex and diverse nature of polysaccharides [37,38,39]. Polysaccharides in D. officinale originate from sucrose, which undergoes a series of transformations to produce GDP-glucose, GDP-mannose, and GDP-rhamnose. These compounds are subsequently combined by different GTs to form polysaccharide polymers [20,40]. The resulting repeating units undergo polymerization and exportation, ultimately contributing to polysaccharide formation. Sucrose, a pivotal precursor for polysaccharide synthesis, is primarily synthesized during photosynthesis. In the process of polysaccharide biosynthesis, sucrose conversion involves three different pathways. One pathway involves the direct generation of UDP-glucose through the action of SUS (sucrose synthase). Alternatively, sucrose is catalyzed by INV to yield glucose, which is then converted into glucose-6-phosphate by HK. Next, glucose-6-phosphate is transformed into glucose-1-phosphate by PGM, followed by its conversion to UDP-glucose via UDP-glucose pyrophosphorylase or UDP-sugar pyrophosphorylase (UGP/USP). The third pathway involves sucrose being catalyzed by SUS to generate fructose, which is then converted to fructose-6-phosphate by FRK. Fructose-6-phosphate is further converted to glucose-6-phosphate by GPI, then into glucose-1-phosphate by PGM, and ultimately converted to UDP-glucose by UGP/USP [37,38,41,42]. These three metabolic pathways of sucrose involve SUS, INV, HK, PGM, FRK, GPI, and UGP/USP. In the transcriptome analysis results of five stages, 6 SUS, 8 INV, 4 HK, 3 PGM, 11 FRK, 4 GPI, and 1 USP DEGs were found, respectively. These DEGs may collaboratively regulate polysaccharide metabolism in the stems. Among them, SUS is the key to the initiation of polysaccharide synthesis and exhibits relatively elevated expression levels in the S2 and S3 stages, which is closely related to the growth state. Stage S2 is a period of vigorous vegetative growth with strong photosynthesis and rapid sucrose synthesis, which also promotes the transport of photosynthetic products from leaves to stems. At this stage, plant growth requires substantial carbohydrate utilization, leading to limited polysaccharide accumulation. As the plant enters stage S3, it attains a defined form, with the pace of vegetative growth slowing down while transitioning to reproductive growth, initiating energy storage processes. It is plausible that storage substances in the leaves, upon conversion to sucrose, are transported to the stems, contributing to the relatively high accumulation of polysaccharides in the stems during this phase. Most SUS have relatively low expression levels in stages S4 and S5, and sucrose metabolism is relatively weakened. During stage S4, which marks the flowering phase characterized by high energy demands, there is a gradual onset of leaf senescence. To meet the increased energy requirements for flowering, stored polysaccharides in the stems undergo decomposition to provide energy. Consequently, the total content of water-soluble polysaccharides in the stems decreases during this period. In stage S5, the plant has entered senescence, the leaves have gradually fallen off, and the photosynthetic capacity is low, resulting in a decrease in the synthesis of energy substances. To maintain the basic physiological activities of the plant, the polysaccharides in the stems are further consumed, and the content of water-soluble polysaccharides in the stems gradually decreases. In the polysaccharide synthesis pathway, many homologous genes exhibit different expression patterns, demonstrating their temporal expression specificity. Stage S3 represents the phase with the highest polysaccharide content in the stems. This stage occurs during the late vegetative growth phase, where the plant accumulates energy reserves for subsequent reproductive growth. Therefore, the high expression of genes linked to the polysaccharide synthesis pathway during this period may be related to the accumulation of polysaccharides, to a certain extent.
Through WGCNA, genes related to target traits can be screened and classified into modules, obtaining co-expression modules with high biological significance [43]. The WGCNA identified three modules (light blue, bisque, and brown) that positively correlated with water-soluble polysaccharide content variations, particularly the light-blue module, which showed the strongest correlation. The polysaccharide-related genes in the light-blue module exhibited elevated expression during stage S3 (the peak period of polysaccharide accumulation) and are functionally involved in sucrose metabolism, monosaccharide interconversion, and the final step of polysaccharide biosynthesis. SPS has been demonstrated to be the first rate-limiting enzyme in the polysaccharide biosynthesis pathway, playing a pivotal regulatory role in the partitioning of photosynthetic products between sucrose and starch [44]. Huang et al. [45] found that the expression of SPSs differed among sugarcane varieties with high, medium, and low sugar contents, suggesting that these genes play crucial roles in sucrose accumulation and utilization in sugarcane. Chen et al. [46] performed RNA interference silencing of the SPP gene in tobacco and discovered that the SPP gene can affect the allocation of photosynthetic carbon among different storage substances. The SPS (LOC110094355) and SPP (LOC110093717) in D. officinale likely play similar regulatory roles, and their upregulation may promote polysaccharide accumulation. HK, FRK, GPI, PGM, and USP are essential for the interconversion of various monosaccharides. HK can catalyze the conversion of glucose, fructose, and mannose into glucose-6-P, fructose-6-P, and mannose-6-P, respectively. FRK can catalyze the conversion of fructose-6-P to fructose, while GPI catalyzes the interconversion between glucose-6-P and fructose-6-P. PGM mediates the interconversion between glucose-1-P and glucose-6-P, and USP facilitates the interconversion between glucose-1-P and UDP-glucose [47,48]. These substances serve as precursors for polysaccharide synthesis, and alterations in the expression of associated genes are closely linked to polysaccharide production. Given the critical role these enzymatic genes play in monosaccharide modification, including HK (LOC110098503), FRK (LOC110094509, LOC110094614, LOC110108979), GPI (LOC110097399, LOC110097894), PGM (LOC110097343), and USP (LOC110096190), they provide valuable references for future artificial polysaccharide biosynthesis. GTs are pivotal enzymes that catalyze the terminal step of polysaccharide biosynthesis, specifically facilitating the elongation of polysaccharide chains [49]. Previous studies have established that glycosyltransferase families GMTs and CSLAs are positively correlated with polysaccharide accumulation. The overexpression of CSLA6 significantly enhanced the mannose content in Arabidopsis thaliana [21,23,50]. The five GTs (LOC110095169, LOC110102351, LOC110099249, LOC114579174, and LOC110094417) identified in this study may similarly contribute to enhanced polysaccharide accumulation, but their functional characterization requires further investigation.
Among the 260 TFs identified in the light-blue module, MYB TFs (22) were the most abundant. We identified MYB-binding sites in the promoter regions of ten genes: SPS1 (LOC110094355), SPP (LOC110093717), FRK1 (LOC110094509), FRK2 (LOC110094614), GPI1 (LOC110097399), GPI2 (LOC110097894), USP1 (LOC110096190), HK1 (LOC110098503), GT1 (LOC110095169), and GT3 (LOC110099249). This finding suggests that these MYB TFs may serve as pivotal regulators influencing polysaccharide biosynthesis. FRK2 (LOC110094614) contains 16 methyl jasmonate-responsive elements and 6 abscisic acid-responsive elements, suggesting that this gene may be regulated by methyl jasmonate and abscisic acid signaling pathways, and is potentially involved in defense responses and abiotic stress adaptation. Furthermore, the promoter regions of these 15 polysaccharide-related genes contain various cis-acting elements associated with abiotic stress, suggesting that these genes may not only function in growth and development, but also play a role in the stress response. Zhang et al. [51] observed that MG1, a D. officinale genotype with higher soluble sugar and polysaccharide contents, exhibited enhanced cold tolerance. Additionally, high light exposure induced a marked increase in polysaccharide accumulation in the stems of D. officinale [24]. These studies indicate a strong correlation between polysaccharide accumulation and stress resistance in D. officinale. Future research should investigate the expression profiles of these genes under abiotic stress, with further exploration and functional validation of potential regulatory factors involved in polysaccharide biosynthesis, to elucidate the molecular mechanisms underlying polysaccharide accumulation in D. officinale.

5. Conclusions

In this study, the water-soluble polysaccharide content and transcriptome sequencing of stem tissues at different developmental stages of D. officinale were investigated. The findings revealed that the water-soluble polysaccharide content in the stems reached its peak before flowering and gradually decreased after flowering. The KEGG enrichment analysis demonstrated that the DEGs in groups S1 vs. S2, S2 vs. S3, and S3 vs. S4 were markedly enriched in the starch and sucrose metabolism pathway. Based on the findings of transcriptome sequencing, a gene expression heatmap related to the polysaccharide synthesis pathway of D. officinale was developed. The WGCNA identified three co-expression modules markedly positive correlated with changes in water-soluble polysaccharide content. In total, 15 key genes that were closely related to polysaccharide synthesis were identified from the light-blue module with the highest correlation coefficient. This study systematically elucidated the expression patterns of polysaccharide synthesis-related genes across five developmental stages, offering valuable gene resources for the genetic enhancement of D. officinale. Additionally, it provides detailed reference data for further elucidating the molecular mechanisms underlying polysaccharide biosynthesis.

Supplementary Materials

The following supporting information can be downloaded at: https://www.mdpi.com/article/10.3390/horticulturae11060679/s1. Table S1 List of primers for qRT-PCR; Table S2 List of 260 transcription factors; Table S3 List of cis-acting elements in the promoters of 15 polysaccharide-related genes.

Author Contributions

Writing—original draft, Formal analysis, T.Y.; Writing—original draft, S.H.; Resources, Investigation, S.T.; Resources, Investigation, M.G.; Validation, Software, X.Z.; Writing—review and editing, Supervision, Funding acquisition, L.H.; Writing—review and editing, Supervision, Funding acquisition, Conceptualization, S.Z. All authors have read and agreed to the published version of the manuscript.

Funding

This research was funded by the China Agricultural Research System of the Ministry of Finance and the National Agricultural Research Center (CARS-21), Basic scientific research business special project of Guangxi Academy of Agricultural Sciences (Guinongke2025YP072) and Guangxi Characteristic Crop Test Station ‘Guangxi Long’ an Chinese Herbal Medicine Test Station’ (GuiTS2022002).

Data Availability Statement

All the raw sequencing data have been deposited in the National Center for Biotechnology Information (NCBI) Bioproject database under the accession number PRJNA1266615.

Conflicts of Interest

The authors declare no conflicts of interest.

References

  1. Li, X.; Ding, X.; Chu, B.; Zhou, Q.; Ding, G.; Gu, S. Genetic diversity analysis and conservation of the endangered Chinese endemic herb Dendrobium officinale Kimura et Migo (Orchidaceae) based on AFLP. Genetica 2008, 133, 159–166. [Google Scholar] [CrossRef]
  2. Shen, C.; Guo, H.; Chen, H.; Shi, Y.; Meng, Y.; Lu, J.; Feng, S.; Wang, H. Identification and analysis of genes associated with the synthesis of bioactive constituents in Dendrobium officinale using RNA-Seq. Sci. Rep. 2017, 7, 187. [Google Scholar] [CrossRef]
  3. Ng, T.; Liu, J.; Wong, J.; Ye, X.; Sze, S.; Tong, Y.; Zhang, K. Review of research on Dendrobium, a prized folk medicine. Appl. Microbiol. Biotechnol. 2012, 93, 1795–1803. [Google Scholar] [CrossRef]
  4. Wang, Z.; Zhao, M.; Cui, H.; Li, J.; Wang, M. Transcriptomic landscape of medicinal Dendrobium reveals genes associated with the biosynthesis of bioactive components. Front. Plant Sci. 2020, 11, 391. [Google Scholar] [CrossRef]
  5. Yuan, Y.; Zhang, J.; Liu, X.; Meng, M.; Wang, J.; Lin, J. Tissue-specific transcriptome for Dendrobium officinale reveals genes involved in flavonoid biosynthesis. Genomics 2020, 112, 1781–1794. [Google Scholar] [CrossRef]
  6. Zhang, W.; Liu, X.; Sun, X.; Han, R.; Yu, N.; Liang, J.; Zhou, A. Comparison of the antioxidant activities and polysaccharide characterization of fresh and dry Dendrobium officinale Kimura et Migo. Molecules 2022, 27, 6654. [Google Scholar] [CrossRef]
  7. Luo, Z.; Liu, L.; Nie, Q.; Huang, M.; Luo, C.; Sun, Y.; Ma, Y.; Yu, J.; Du, F. HPLC-based metabolomics of Dendrobium officinale revealing its antioxidant ability. Front. Plant Sci. 2023, 14, 1060242. [Google Scholar] [CrossRef]
  8. Wang, H.; Ge, J.; Zhang, F.; Zha, X.; Liu, J.; Li, Q.; Luo, J. Dendrobium officinale polysaccharide promotes M1 polarization of TAMs to inhibit tumor growth by targeting TLR2. Carbohydr. Polym. 2022, 292, 119683. [Google Scholar] [CrossRef]
  9. Sun, C.; Zhang, N.; Xu, G.; Jiang, P.; Huang, S.; Zhao, Q.; He, Y. Anti-tumor and immunomodulation activity of polysaccharides from Dendrobium officinale in S180 tumor-bearing mice. J. Funct. Foods 2022, 94, 105105. [Google Scholar] [CrossRef]
  10. Xu, L.; Zeng, X.; Liu, Y.; Wu, Z.; Zheng, X.; Zhang, X. Inhibitory effect of Dendrobium officinale polysaccharide on oxidative damage of glial cells in aging mice by regulating gut microbiota. Int. J. Biol. Macromol. 2023, 247, 125787. [Google Scholar] [CrossRef]
  11. Huang, H.; Lee, W.; Zou, H.; Li, H.; Zhang, S.; Li, H.; Lin, J. Antimicrobial peptides in Dendrobium officinale: Genomic parameters, peptide structures, and gene expression patterns. Plant Genome 2023, 16, e20348. [Google Scholar] [CrossRef]
  12. Cai, M.; Zhu, H.; Xu, L.; Wang, J.; Xu, J.; Li, Z.; Yang, K.; Wu, J.; Sun, P. Structure, anti-fatigue activity and regulation on gut microflora in vivo of ethanol-fractional polysaccharides from Dendrobium officinale. Int. J. Biol. Macromol. 2023, 234, 123572. [Google Scholar] [CrossRef]
  13. Tao, S.; Lei, Z.; Huang, K.; Li, Y.; Ren, Z.; Zhang, X.; Wei, G.; Chen, H. Structural characterization and immunomodulatory activity of two novel polysaccharides derived from the stem of Dendrobium officinale Kimura et Migo. J. Funct. Foods 2019, 57, 121–134. [Google Scholar] [CrossRef]
  14. Guo, X.; Yang, M.; Wang, C.; Nie, S.; Cui, S.; Guo, Q. Acetyl-glucomannan from Dendrobium officinale: Structural modification and immunomodulatory activities. Front. Nutr. 2022, 9, 1016961. [Google Scholar] [CrossRef]
  15. Fang, J.; Lin, Y.; Xie, H.; Farag, M.; Feng, S.; Li, J.; Shao, P. Dendrobium officinale leaf polysaccharides ameliorated hyperglycemia and promoted gut bacterial associated SCFAs to alleviate type 2 diabetes in adult mice. Food Chem.-X 2022, 13, 100207. [Google Scholar] [CrossRef]
  16. Zhao, W.; Chen, Y.; Tian, Y.; Wang, Y.; Du, J.; Ye, X.; Lu, L.; Sun, C. Dietary supplementation with Dendrobium officinale leaves improves growth, antioxidant status, immune function, and gut health in broilers. Front. Microbiol. 2023, 14, 1255894. [Google Scholar] [CrossRef]
  17. Wang, L.; Li, C.; Hu, C.; Gong, P.; Zhao, S. Purification and structural characterization of Dendrobium officinale polysaccharides and its activities. Chem. Biodivers. 2021, 18, e2001023. [Google Scholar] [CrossRef]
  18. Tian, W.; Dai, L.; Lu, S.; Luo, Z.; Qiu, Z.; Li, J.; Li, P.; Du, B. Effect of Bacillus sp. DU-106 fermentation on Dendrobium officinale chock for polysaccharide: Structure and immunoregulatory activities. Int. J. Biol. Macromol. 2019, 135, 1034–1042. [Google Scholar] [CrossRef]
  19. Pharmacopoeia Commission of the People’s Republic of China. Pharmacopoeia of the People’s Republic of China, 2020 ed.; China Medical Science Press: Beijing, China, 2020; Volume I. [Google Scholar]
  20. Wang, Y.; Tong, Y.; Adejobi, O.; Wang, Y.; Liu, A. Research advances in Multi-Omics on the traditional chinese herb Dendrobium officinale. Front. Plant Sci. 2022, 12, 808228. [Google Scholar] [CrossRef]
  21. Jiang, M.; Li, S.; Zhao, C.; Zhao, M.; Xu, S.; Wen, G. Identification and analysis of sucrose synthase gene family associated with polysaccharide biosynthesis in Dendrobium catenatum by transcriptomic analysis. PeerJ 2022, 10, e13222. [Google Scholar] [CrossRef]
  22. He, C.; Zhang, J.; Liu, X.; Zeng, S.; Wu, K.; Yu, Z.; Wang, X.; da Silva, J.; Lin, Z.; Duan, J. Identification of genes involved in biosynthesis of mannan polysaccharides in Dendrobium officinale by RNA-seq analysis. Plant Mol. Biol. 2015, 88, 219–231. [Google Scholar] [CrossRef]
  23. Yu, Z.; He, C.; da Silva, J.; Luo, J.; Yang, Z.; Duan, J. The GDP-mannose transporter gene (DoGMT) from Dendrobium officinale is critical for mannan biosynthesis in plant growth and development. Plant Sci. 2018, 277, 43–54. [Google Scholar] [CrossRef]
  24. Li, D.; Ye, G.; Li, J.; Lai, Z.; Ruan, S.; Qi, Q.; Wang, Z.; Duan, S.; Jin, H.; Wang, H. High light triggers flavonoid and polysaccharide synthesis through DoHY5-dependent signaling in Dendrobium officinale. Plant J. 2023, 115, 1114–1133. [Google Scholar] [CrossRef] [PubMed]
  25. Zhang, J.; He, C.; Wu, K.; da Silva, J.; Zeng, S.; Zhang, X.; Yu, Z.; Xia, H.; Duan, J. Transcriptome analysis of Dendrobium officinale and its application to the identification of genes associated with polysaccharide synthesis. Front. Plant Sci. 2016, 7, 5. [Google Scholar] [CrossRef] [PubMed]
  26. Wang, S.; Zhang, T.; Wang, L.; Dong, S.; Wang, D.; Li, B.; Cao, X. The dynamic changes in the main substances in Codonopsis pilosula root provide insights into the carbon flux between primary and secondary metabolism during different growth stages. Metabolites 2023, 13, 456. [Google Scholar] [CrossRef]
  27. Wang, J.; Su, H.; Wu, Z.; Wang, W.; Zhou, Y.; Li, M. Integrated metabolites and transcriptomics at different growth stages reveal polysaccharide and flavonoid biosynthesis in Cynomorium songaricum. Int. J. Mol. Sci. 2022, 23, 10675. [Google Scholar] [CrossRef]
  28. Chen, S.; Zhou, Y.; Chen, Y.; Gu, J. Fastp: An ultra-fast all-in-one FASTQ preprocessor. Bioinformatics 2018, 34, 884–890. [Google Scholar] [CrossRef]
  29. Kim, D.; Pertea, G.; Trapnell, C.; Pimentel, H.; Kelley, R.; Salzberg, S. TopHat2: Accurate alignment of transcriptomes in the presence of insertions, deletions and gene fusions. Genome Biol. 2013, 14, R36. [Google Scholar] [CrossRef]
  30. Kim, D.; Paggi, J.; Park, C.; Bennett, C.; Salzberg, S. Graph-based genome alignment and genotyping with HISAT2 and HISAT-genotype. Nat. Biotechnol. 2019, 37, 907–915. [Google Scholar] [CrossRef]
  31. Anders, S.; Huber, W. Differential expression analysis for sequence count data. Genome Biol. 2010, 11, R106. [Google Scholar] [CrossRef]
  32. Apweiler, R.; Bairoch, A.; Wu, C.; Barker, W.; Boeckmann, B.; Ferro, S.; Gasteiger, E.; Huang, H.; Lopez, R.; Magrane, M.; et al. UniProt: The universal protein knowledgebase. Nucleic Acids Res. 2004, 32, D115–D119. [Google Scholar] [CrossRef] [PubMed]
  33. Mistry, J.; Chuguransky, S.; Williams, L.; Qureshi, M.; Salazar, G.; Sonnhammer, E.; Tosatto, S.; Paladin, L.; Raj, S.; Richardson, L.; et al. Pfam: The protein families database in 2021. Nucleic Acids Res. 2021, 49, D412–D419. [Google Scholar] [CrossRef] [PubMed]
  34. Tatusov, R.; Galperin, M.; Natale, D.; Koonin, E. The COG database: A tool for genome-scale analysis of protein functions and evolution. Nucleic Acids Res. 2000, 28, 33–36. [Google Scholar] [CrossRef]
  35. Klopfenstein, D.; Zhang, L.; Pedersen, B.; Ramirez, F.; Vesztrocy, A.; Naldi, A.; Mungall, C.; Yunes, J.; Botvinnik, O.; Weigel, M.; et al. GOATOOLS: A Python library for Gene Ontology analyses. Sci. Rep. 2018, 8, 10872. [Google Scholar] [CrossRef]
  36. Xie, C.; Mao, X.; Huang, J.; Ding, Y.; Wu, J.; Dong, S.; Kong, L.; Gao, G.; Li, C.; Wei, L. KOBAS 2.0: A web server for annotation and identification of enriched pathways and diseases. Nucleic Acids Res. 2011, 39, W316–W322. [Google Scholar] [CrossRef] [PubMed]
  37. Wang, S.; Wang, B.; Hua, W.; Niu, J.; Dang, K.; Qiang, Y.; Wang, Z. De Novo assembly and analysis of polygonatum sibiricum transcriptome and identification of genes involved in polysaccharide biosynthesis. Int. J. Mol. Sci. 2017, 18, 1950. [Google Scholar] [CrossRef]
  38. Niu, J.; Zhao, G.; Mi, Z.; Chen, L.; Liu, S.; Wang, S.; Wang, D.; Wang, Z. De novo sequencing of Bletilla striata (Orchidaceae) transcriptome and identification of genes involved in polysaccharide biosynthesis. Genet. Mol. Biol. 2020, 43, e20190417. [Google Scholar] [CrossRef]
  39. Zhang, S.; Shi, Y.; Huang, L.; Wang, C.; Zhao, D.; Ma, K.; Wu, J.; Peng, D. Comparative transcriptomic analysis of rhizomes, stems, and leaves of Polygonatum odoratum (Mill.) Druce reveals candidate genes associated with polysaccharide synthesis. Gene 2020, 744, 144626. [Google Scholar] [CrossRef]
  40. Zhang, G.; Xu, Q.; Bian, C.; Tsai, W.; Yeh, C.; Liu, K.; Yoshida, K.; Zhang, L.; Chang, S.; Chen, F.; et al. The Dendrobium catenatum Lindl. genome sequence provides insights into polysaccharide synthase, floral development and adaptive evolution. Sci. Rep. 2016, 6, 19029. [Google Scholar] [CrossRef]
  41. Misra, V.; Mall, A.; Ansari, S.; Ansari, M.I. Sugar transporters, sugar-metabolizing enzymes, and their interaction with phytohormones in sugarcane. J. Plant Growth Regul. 2023, 42, 4975–4988. [Google Scholar] [CrossRef]
  42. Yoon, J.; Cho, L.; Tun, W.; Jeon, J.; An, G. Sucrose signaling in higher plants. Plant Sci. 2021, 302, 110703. [Google Scholar] [CrossRef] [PubMed]
  43. Shen, Q.; Wu, X.; Tao, Y.; Yan, G.; Wang, X.; Cao, S.; Wang, C.; He, W. Mining candidate genes related to heavy metals in Mature Melon (Cucumis melo L.) peel and pulp using WGCNA. Genes 2022, 13, 1767. [Google Scholar] [CrossRef] [PubMed]
  44. Ma, P.; Zhang, X.; Chen, L.; Zhao, Q.; Zhang, Q.; Hua, X.; Wang, Z.; Tang, H.; Yu, Q.; Zhang, M.; et al. Comparative analysis of sucrose phosphate synthase (SPS) gene family between Saccharum officinarum and Saccharum spontaneum. BMC Plant Biol. 2020, 20, 422. [Google Scholar] [CrossRef]
  45. Huang, D.; Qin, C.; Gui, Y.; Zhao, L.; Chen, Z.; Wang, M.; Sun, Y.; Liao, Q.; Li, Y.; Lakshmanan, P. Role of the SPS Gene Families in the Regulation of Sucrose Accumulation in Sugarcane. Sugar Tech 2017, 19, 117–124. [Google Scholar] [CrossRef]
  46. Chen, S.; Hajirezaei, M.; Peisker, M.; Tschiersch, H.; Sonnewald, U.; Börnke, F. Decreased sucrose-6-phosphate phosphatase level in transgenic tobacco inhibits photosynthesis, alters carbohydrate partitioning, and reduces growth. Planta 2005, 221, 479–492. [Google Scholar] [CrossRef]
  47. Vanderwall, M.; Gendron, J.M. HEXOKINASE1 and glucose-6-phosphate fuel plant growth and development. Development 2023, 150, dev202346. [Google Scholar] [CrossRef] [PubMed]
  48. Aguilera-Alvarado, G.; Sanchez-Nieto, S. Plant hexokinases are multifaceted proteins. Plant Cell Physiol. 2017, 58, 1151–1160. [Google Scholar] [CrossRef]
  49. Zabotina, O.A.; Zhang, N.; Weerts, R. Polysaccharide biosynthesis: Glycosyltransferases and their complexes. Front. Plant Sci. 2021, 12, 625307. [Google Scholar] [CrossRef]
  50. He, C.; Wu, K.; Zhang, J.; Liu, X.; Zeng, S.; Yu, Z.; Zhang, X.; da Silva, J.; Deng, R.; Tan, J.; et al. Cytochemical localization of polysaccharides in Dendrobium officinale and the involvement of DoCSLA6 in the synthesis of mannan polysaccharides. Front. Plant Sci. 2017, 8, 173. [Google Scholar] [CrossRef]
  51. Zhang, S.; Li, J.; Shen, Y.; Korkor, L.; Pu, Q.; Lu, J.; Shakeela, B.; Kong, D.; Li, O.; Zeng, G.; et al. Physiological responses of Dendrobium officinale under exposure to cold stress with two cultivars. Phyton 2020, 89, 599–617. [Google Scholar] [CrossRef]
Figure 1. Phenotypes of D. officinale at different developmental stages. S1: 2 months after sprouting; S2: 5 months after sprouting; S3: 11 months after sprouting; S4: 13 months after sprouting; and S5: 15 months after sprouting.
Horticulturae 11 00679 g001
Figure 2. (a) Density plot of gene expression distribution. (b) Principal component analysis plot. (c) Pearson correlation coefficient analysis.
Horticulturae 11 00679 g002
Figure 3. Expression pattern clustering of all genes.
Horticulturae 11 00679 g003
Figure 4. Venn diagram of the number of differentially expressed genes at different developmental stages of D. officinale.
Horticulturae 11 00679 g004
Figure 5. Kyoto Encyclopedia of genes and genomes enrichment analysis (KEGG) of differentially expressed genes (DEGs) in groups (a) S1 vs. S2, (b) S2 vs. S3, (c) S3 vs. S4, and (d) S4 vs. S5.
Horticulturae 11 00679 g005
Figure 6. Heatmap of polysaccharide synthesis-related gene expression at different developmental stages of D. officinale. CLSA, cellulose synthase-like A; FRK, fructokinase; GMPP, mannose-1-phosphate guanylyl transferase; GPI, glucose-6-phosphate isomerase; GT, glycosyltransferases; HK, hexokinase; INV, invertase; KK, ketohexokinase; MPI, mannose-6-phosphate isomerase; PGM, phosphoglucomutase; PMM, phosphomannomutase; RHM, UDP-glucose-4,6-dehydratase; SDH, sorbitol dehydrogenase; SPP, sucrose phosphate phosphatase; SPS, sucrose phosphate synthase; SUS, sucrose synthase; UAE, UDP-arabinose-4-epimerase 2; UAM, UDP-arabinopyranose mutase; UGDH, UDP-glucose dehydrogenase; UGE, UDP-glucuronate-4-epimerase; USP, UDP-sugar pyrophosphorylase; XI, xylose isomerase.
Horticulturae 11 00679 g006
Figure 7. Weighted gene co-expression network analysis: (a) Expression trends of eight modules and correlation analysis between the content of stem water-soluble polysaccharides and the expression levels of genes in each module at different developmental stages. (b) Expression patterns of polysaccharide-related genes in three co-expression modules (light blue, bisque, and brown).
Horticulturae 11 00679 g007
Figure 8. The co-expression network of 15 polysaccharide-related genes and 260 transcription factors. The color depth represents the degree of network.
Horticulturae 11 00679 g008
Figure 9. (a) Classification and abundance-based ranking of the 260 TFs. (b) Analysis of cis-acting elements in the promoter regions of 15 polysaccharide-related genes.
Horticulturae 11 00679 g009
Figure 10. The expression of 15 polysaccharide-related genes significantly related to water-soluble polysaccharide content.
Horticulturae 11 00679 g010
Table 1. Water-soluble polysaccharide content in stems of D. officinale at different developmental stages.
S1S2S3S4S5
Content of water-soluble polysaccharide (%)15.37 ± 0.41% e21.18 ± 0.22% d40.44 ± 0.75% a35.62 ± 0.23% b32.61 ± 0.52% c
Note: Different lowercase letters indicate statistically significant differences (p < 0.05).
Table 2. Sequencing data statistics.
SampleReadSumBaseSumGC (%)Q20 (%)Q30 (%)Uniquely Mapped (%)
S1-124,600,6617,380,198,30045.7497.9694.4991.57
S1-228,335,1918,500,557,30045.6597.8794.391.27
S1-329,071,0468,721,313,80045.8298.0794.7291.90
S2-126,070,1647,821,049,20045.9598.0294.6691.73
S2-223,229,8286,968,948,40045.8498.0294.5791.71
S2-323,112,2206,933,666,00046.0797.8494.2891.76
S3-123,947,7487,184,324,40045.3597.8794.3790.23
S3-231,578,5619,473,568,30045.2297.9794.5590.11
S3-325,886,6137,765,983,90045.4297.5593.4190.25
S4-122,837,9906,851,397,00045.6197.9694.5292.30
S4-223,227,5176,968,255,10045.6598.1994.9792.60
S4-321,288,9916,404,681,38645.5898.0394.7890.89
S5-124,748,7567,474,124,31245.4998.1695.1988.68
S5-225,158,0857,597,741,67045.4398.3195.4889.21
S5-324,674,3337,451,648,56645.4698.3995.6589.52
Table 3. Statistics of differentially expressed genes at different developmental stages of D. officinale.
TypeTotalUpDown
S1 vs. S2576428982866
S2 vs. S3640827353673
S3 vs. S4447722172260
S4 vs. S5380919581851
Disclaimer/Publisher’s Note: The statements, opinions and data contained in all publications are solely those of the individual author(s) and contributor(s) and not of MDPI and/or the editor(s). MDPI and/or the editor(s) disclaim responsibility for any injury to people or property resulting from any ideas, methods, instructions or products referred to in the content.

