Article

Uncovering the Technical Efficiency Divide Among Apple Farmers in China: Insights from Stochastic Frontier Analysis and Micro-Level Data

by
Ruopin Qu
1,2,
Yongchang Wu
1 and
Jing Chen
1,*
1
Institute of Agricultural Economics and Development, Chinese Academy of Agricultural Sciences, Beijing 100081, China
2
Agricultural Information Institute of CAAS, Chinese Academy of Agricultural Sciences, Beijing 100081, China
*
Author to whom correspondence should be addressed.
Horticulturae 2025, 11(6), 655; https://doi.org/10.3390/horticulturae11060655
Submission received: 10 April 2025 / Revised: 30 May 2025 / Accepted: 4 June 2025 / Published: 9 June 2025

Abstract

Based on a sample of 412 apple farmer households across Gansu, Shaanxi, Shanxi, and Shandong provinces in China, this study estimates production efficiency and its determinants for apple growers. The stochastic frontier analysis model estimates technical efficiency while the Tobit model identifies influencing factors. Results show that the average production efficiency of smallholder apple farmers is relatively low at 0.45, indicating significant room for improvement. Production efficiency exhibits an inverted “U” relationship with farm scale, and excessive pesticide inputs have a significant negative impact on efficiency. Computer use to search for information among farmers was found to significantly improve apple production efficiency, indicating the potential benefits of ICT adoption. However, membership in cooperatives had no significant effect on efficiency. Overall, these findings suggest approaches to enhance the productivity of China’s apple growers through improved resource allocation, optimized farm scale, and the promotion of information technology.

1. Introduction

China is the largest apple-producing country globally, with a total production of 45.9734 million tons in 2021, accounting for 57.09% of the world’s apple production, a significant share in the global market (data source: Chinese National Bureau of Statistics, 2022; USDA Foreign Agricultural Service, 2022). Unlike staple food crops such as corn and wheat, apple cultivation is a labor-intensive cash crop, and its management mode has a more significant impact on farmers’ income in the face of market competition. Previous studies have shown that the income of farmers is mainly influenced by their production and management methods, and different levels of orchard/farm management among farmers result in differences in production efficiency [1,2,3]. On the other hand, studies have found that scale has a significant impact on the differences in agricultural production efficiency [4,5,6,7]. Some crops are suitable for intensive cultivation, while others are suitable for large-scale production due to differences in production methods and factor allocation. The impact of scale on production efficiency is more complex, and further research is needed to determine whether there is an optimal planting scale for farmers in apple cultivation.
Currently, research on agricultural production efficiency has mainly focused on bulk crops, such as corn, wheat, and rice [8,9,10,11,12,13,14]. However, there is relatively little literature on the production efficiency of apple planting, and the research objects are generally concentrated on apple growers in the Loess Plateau [15,16,17,18,19]. In addition to the Loess Plateau, China’s apple planting advantage areas also include the Bohai Bay area, but only a small amount of literature has studied the efficiency of apple planting in this region [20]. As such, there is still a need for more comprehensive studies on the production efficiency of apple planting based on surveys of farmers in major apple-producing areas across the country.
Data envelopment analysis (DEA) and the stochastic frontier analysis (SFA) model are two widely used estimation methods for analyzing agricultural production efficiency. DEA is a classical non-parametric method with a flexible model, which was initially introduced by scholars to focus on environmental or ecological measures [21]. In recent years, scholars have also applied DEA to agricultural production efficiency research [22,23,24]. In comparison, SFA has been increasingly used in efficiency research [23,24,25,26,27]. SFA is advantageous over DEA in estimating agricultural production efficiency due to its capability of handling random errors and invalidity terms effectively. In contrast, DEA assigns all inefficiencies to invalid items and does not assume random errors, making it highly sensitive to outliers and random errors, particularly when the dataset is small.
The sensitivity of agricultural production efficiency to random errors and unpredictable weather conditions underscores the importance of accounting for random errors in efficiency estimation, as it is assumed to be a key factor determining efficiency [28]. Therefore, this article employs the SFA method to estimate efficiency, which decomposes deviations from optimal output into random error and inefficiency components and quantifies their relative contributions. Due to the labor- and technique-intensive nature of apple farming, this paper hypothesizes that efficiency will initially rise with scale but decline after reaching a certain scale.
Existing research on agricultural production efficiency has primarily focused on staple food crops, with limited attention given to labor-intensive cash crops such as apples. Research on apple production has predominantly concentrated on growers in the Loess Plateau region, with little exploration of the optimal scale of apple growers on a household basis and production efficiency. To test the hypotheses, this study selects small and medium-sized farmers who grow apples on a household basis in the Bohai Bay area and the Loess Plateau area as the research objects. The SFA method is employed to jointly analyze their production efficiency and optimal production scale, while the Tobit model is used to investigate the factors influencing their production efficiency. By doing so, this study extends the literature by simultaneously addressing scale optimization and efficiency measurement for a high-value cash crop across contrasting production regions.

2. Data and Methods

2.1. Data Collection

The primary apple-producing regions in China are concentrated in the provinces of Shandong, Liaoning, and Hebei in the Bohai Bay region, as well as Shaanxi, Shanxi, and Gansu in the Loess Plateau of northwest China. Among them, the apple production of Gansu, Shaanxi, Shanxi, and Shandong provinces accounts for more than half of the total national output annually, amounting to approximately 67% of total production between 2018 and 2022 [Data source: National Bureau of Statistics (2022)]. These regions span China’s primary apple-growing zones (e.g., Loess Plateau, Bohai Bay) and collectively account for 40% of the world’s total apple production [Data source: FAO 2025]. These four provinces have vast hilly and mountainous terrain, suitable soil and climatic conditions for producing high-quality apples, and have a long history of apple cultivation. Apple planting has always been a characteristic and advantageous industry for these localities. Therefore, this study selected farmers from these four provinces and was conducted by a research team led by the author. After preliminary questionnaire design in 2019, a small-scale pre-test was conducted in Shandong. Based on farmer feedback, the questionnaire was adjusted and the final survey questionnaire was confirmed. The survey was administered from October 2019 to January 2020.
Within the four provinces, two regions were selected for each province, one representing the highest (i.e., most renowned and highest yielding) apple-producing area in the province and the other representing a medium-performing area. To minimize selection bias, six villages were randomly chosen at the county level, and 10 farmers were randomly selected from each village for this study. A total of 480 farmers participated in the survey, with 120 from each province. Among the 480 collected questionnaires, 451 had a high completion rate, ultimately yielding 412 with complete data for empirical analysis in this article. The questionnaire had a high efficacy rate of 95.83%.
The selection of the four provinces for this study was based on their significance in China’s apple production, representing a considerable proportion of the national production. Moreover, these regions possess favorable environmental conditions and a rich history of apple cultivation, making them ideal subjects for this study. The research team conducted a rigorous sampling strategy, including random selection of villages at the county level and farmers to minimize selection bias. Furthermore, the survey questionnaire design underwent several iterations and was finalized after consulting with farmers to ensure the accuracy and reliability of the data. Overall, the rigorous sampling strategy and careful design of the survey questionnaire provide a robust foundation for the empirical analysis conducted in this study.

2.2. Methods

The SFA model proposed by Aigner, Lovell, and Schmidt (1977) [29] is written as follows:
y i = f ( x i , β ) ξ i e v i
e v i = v i u i
where y i is the i   th farmer’s yield (revenue) from selling apples, x i is the farmer’s total input cost, β is parameters to be estimated, ξ i is the efficiency score of the farmer. ξ i ranges from 0 to 1, with 0 meaning the i   th farmer is completely inefficient, and 1 being the i   th farmer is completely efficient. e v i is the symmetric random term representing stochastic noise, composed of stochastic noise term v i and normal distributed stochastic inefficiency term u i .   v i   a n d   u i are completely independent, with u i being able to be normally, half-normally, or exponentially distributed; this paper assumes u i to be normally distributed.
This study employs a consistent monetary unit to represent both inputs and outputs, with a focus on strong substitutability among inputs. The selection of an appropriate production function is a crucial step in estimating efficiency, and this study employs a maximum likelihood test to determine the most suitable production function. Specifically, the transcendental logarithm function and Cobb–Douglas function were tested, with the latter ultimately selected as the most appropriate option. To facilitate estimation, the logarithms of both sides of the Cobb–Douglas function are expanded as follows:
ln Y i = β 0 + j = 1 6 β j l n x i + ω i
where, in this model, l n is the natural logarithm, Y i is the farmer’s yield per mu (1/15 ha). For farmers who have not sold all of their apples, to accurately estimate earnings, the income from all apples produced by each farmer is calculated based on the price at which the farmer sold them. This approach ensures that the earnings generated by each farmer are accurately represented, regardless of whether all of their apples were sold or not. Furthermore, to facilitate meaningful comparisons between farmers, earnings are calculated in monetary units. By doing so, differences in apple quality between farmers and variations in bargaining power between large and small farmers can be more accurately distinguished. x i is total input composed of fertilizer cost, pesticide cost, family labor, hired labor, bagging (protective fruit coverings that can reduce spoilage, indirectly increasing marketable yield per unit area.), and other costs per 1/15 ha, also calculated in monetary units. β 0 is the constant term, β j is parameters to be estimated,   ω i is the random error term that follows the normal distribution.
Based on the model, the production efficiency is calculated by this formula:
T E i = Y i e f x i , β + V i = exp U i = Y i / Y i *
where Y i is the i th farmer’s yield per mu (1/15 ha), Y i * is the “frontier” which is the highest earning possible to achieve with same inputs. When error term is 0, the i th farmer’s efficiency score is 1. Based on Bravo-Ureta et al.’s (2012) procedure to test technology disparity, a likelihood ratio test can be employed to examine if farmers of different scales share the same production frontier; the method is as follows:
LRs = −2 × (LnLs-LnLp)
LRm = −2 × (LnLm-LnLp)
LRl = −2 × (LnLl-LnLp)
In the above formula, LR represents the likelihood ratio, the notes of s, m, and l denotes small-, medium-, and large-scale farmers, LnLp denotes the overall likelihood ratio, LnLs is the likelihood ratio of small-scale farmers, LnLm is medium-scale farmers, and LnLl is large-scale farmers. The null hypothesis is all farmers share the same production frontier, while rejecting the null hypothesis means the production frontier of small-, medium-, and large-scale farmers are different from the pooled sample, and separate production functions need to be estimated:
Small farmers: ln Y i = η 0 + j = 1 6 η j l n x i + τ i
Medium farmers:   ln Y i = ω 0 + j = 1 6 ω j l n x i + φ i
Large farmers:   ln Y i = 0 + j = 1 6 j l n x i + i
Y i and x i are the same as above; η 0 , ω 0 , and 0 are the constant terms for the three types of farmers, respectively; η j ,   ω j ,   a n d   j are parameters to be estimated; τ i , φ i , and i are random error terms.
The production efficiency measured by the SFA method ranges from 0 to 1, representing truncated data. As such, the analysis of factors influencing efficiency and the extent of their influence is subject to bias when using ordinary least squares (OLS) regression. In response to this issue, this study adopts the Tobit method for regression analysis. The Tobit method is a widely used approach in efficiency studies, as it allows for the analysis of censored or truncated data while accounting for the limits imposed on the dependent variable. Specifically, in this study, the Tobit method is employed to estimate regression parameters using the maximum likelihood value (ML), which provides a robust and reliable estimation approach for analyzing the relationship between production efficiency and its influencing factors. This approach is consistent with similar studies and ensures that the results obtained are accurate and reliable for the purposes of this research. The model is as follows:
T E i = θ 0 + θ i α i + ϵ i
In the above formula, T E i is the truncated variable which is the calculated apple planting production efficiency score by SFA, α i is exogenous factors that affect efficiency, θ i is regression parameters, ϵ i is the random error term, θ 0 is the constant term.

3. Empirical Results

3.1. Variable Selection and Descriptive Statistics

The sample of farmers in this study is divided into three equal groups based on sample size and three groups based on planting scale, as shown in Table 1, which presents the characteristics of each group’s planting scale. Descriptive statistics on the unit production input data of small-, medium-, and large-scale farmers are presented in Table 2. In the SFA model employed in this study, the output variable is the yield generated by selling apples per mu (1/15 ha), while the input variable is the cost generated by the input required for apple production per mu (1/15 ha), uniformly converted into yuan (CNY). To ensure model stability, all variables are logarithmically transformed. Costs incurred by farmers for fertilizers, pesticides, and bagging per mu (1/15 ha) of required products, excluding labor costs incurred when using the products, are included in the input variable. The labor volume of family labor is calculated based on the number of people * days, with a salary of CNY 150 (USD 20.73) per day. All other expenses incurred by hired labor are included in the category of hired labor. The expenses of thinning flowers and fruits, pollination, watering, etc., are included in other expenses, and not all farmers have these investments, so they are reflected in the category of other expenses.
Based on the data presented in Table 2, small-scale farmers exhibit the highest unit efficiency, followed by medium-sized farmers, while large-scale farmers have the lowest efficiency. Specifically, the profit from selling apples per acre for small-scale farmers is CNY 6365.21 (USD 879.58), while for medium-sized farmers and large-scale farmers, it is CNY 5689.15 (USD 786.16) and CNY 3456.67 (USD 477.66), respectively. In terms of input items, the fertilizer costs, employment labor, and other costs of small farmers are significantly lower than those of medium and large farmers, while the pesticide costs, household labor, and bagging costs of small farmers are significantly higher than those of medium and large farmers. Among these input items, the difference in the input amount of household labor is most significant between small farmers and medium and large farmers. Specifically, small farmers rely more on family labor in the production process, effectively reducing the cost of employing labor.
In summary, the sample of farmers in this study is divided into groups based on sample size and planting scale, and the input and output variables are uniformly expressed in monetary units. The SFA model is employed to estimate efficiency, and the input variable is logarithmically transformed to ensure model stability. The results suggest that small-scale farmers exhibit the highest unit efficiency, with a significant negative relationship between scale and efficiency.
Table 3 presents the variables used in the Tobit model, along with their descriptive statistics. The variables were chosen based on previous related studies [16,17] and to some extent limited by the length of the survey. The dependent variable in the Tobit model is the production efficiency value calculated by the SFA method, with a theoretical range of 0 to 1. In this study, the minimum value is 0.02 and the maximum value is 0.88. The independent variables in the Tobit model include demographic characteristics of the household head (gender, age, and education), production characteristics (number of household labor, scale (orchard area), and irrigation area), the proportion of other income to total income, whether they use computers to search for information, and whether they have joined a cooperative.
The descriptive statistics of the variables presented in Table 3 provide insights into the characteristics of the sample farmers in this study. Specifically, the surveyed farmers are mainly male, with an average gender value of 0.88. The average age of the household head is relatively high, at 52.45 years, while the education level is relatively low, at 8.14 years. On average, the sample farmers own 9.54 acres of orchard area, with an average irrigated area of 5.24 acres, indicating that some orchards cannot be irrigated. The average number of household laborers is two, with a small standard deviation, suggesting that there is not a significant difference in the number of laborers between each planting household. However, a comparison of labor inputs between different sizes of planting households reveals a significant difference in the time of labor input. The variable of the proportion of other income reflects the income structure of the farmer’s household, with a higher proportion of other income indicating a lower proportion of apple planting income. The average proportion of other income of the surveyed farmers in this study is 10.69%, with a significant difference observed between different types of farmers, with the highest proportion of other income reaching 90%. The choice of whether to use computers to search for information reflects the internet usage and information level of farmers. The proportion of surveyed households who use computers to access the internet in this study is 14%, indicating a relatively low level of information access. Finally, 34% of the surveyed households had joined a cooperative, a low participation rate.
The descriptive statistics presented in Table 3 provide a comprehensive overview of the personal and production characteristics of the surveyed farmers, along with their income structure and access to information. These variables are important factors to consider when examining the determinants of production efficiency in the Tobit model.

3.2. Production Function of Growers by Scale

Table 4 presents the estimation results of the apple production function obtained using Formula (2) for the full sample. The model is tested based on σ2 (v) and σ2 (u), with both coefficients found to be significant. σ2 (u) accounts for 84.32% of the total non-efficiency, as calculated using the formula λ = σ2 (u)/(σ2 (u) + σ2 (v)), indicating that the production non-efficiency arises from the invalid rate term and the disturbance term, with the technical non-efficiency term significantly contributing to the low efficiency. The random disturbance only accounts for 15.68% of the total non-efficiency, demonstrating the applicability of using the SFA model. The production function obtained using traditional linear methods, such as OLS, cannot accurately estimate the production efficiency. The maximum likelihood and prob tests further confirm the robustness of the model.
Formula (4) is subsequently used to compare the maximum likelihood values of different scale planters with the entire sample. The maximum likelihood values of the entire sample, small, medium, and large farmers are −559.333, 201.937, −151.606, and −169.814, respectively. After calculating according to Formula (4), the test values are 2641.2025, 2540.5428, and 2576.9599, respectively. At the 0.001 level, the hypothesis that the technical level of farmers of different scales is the same is rejected, indicating that the production function of different scale growers is different and random. Formula (5) is then used to estimate the production function of small-, medium-, and large-scale growers, respectively.
The results of the apple production function for the entire sample show that fertilizer input, family labor, hired labor, bagging input, and other inputs all significantly increase yield. The more input, the higher the return. Bagging and household labor input have the most significant impact, while pesticide input has no significant impact on yield. The production function reveals that non-efficiency items in production input mainly stem from the excessive use of pesticides. Reducing pesticide use can significantly help apple growers improve their production efficiency. The average pesticide cost per mu (1/15 ha) for the surveyed farmers in this study is CNY 398.83 (USD 55.11). However, the excessive input of pesticides increases the costs during production but cannot increase yield or improve quality. Therefore, changing the pesticide application behavior of apple growers may be a direct method to improve apple production efficiency.
Regarding grouping, farmers of different production scales have different production methods, but pesticide inputs have no significant impact on output in all scales. Among small-scale planters, family labor, bagging, and other inputs have a significant impact on production efficiency. The significant influencing factors for production efficiency of medium-sized planters are hired labor and bagging, while those of large-scale planters are fertilizer, hired labor, family labor, and bagging. Among these factors, bagging has a significant positive impact on the production efficiency of growers of different scales. During the survey, the investigated growers expressed that bagging can help improve the color of apples and protect them from color spots. It is an important way to improve apple quality and also the most labor-intensive production process.

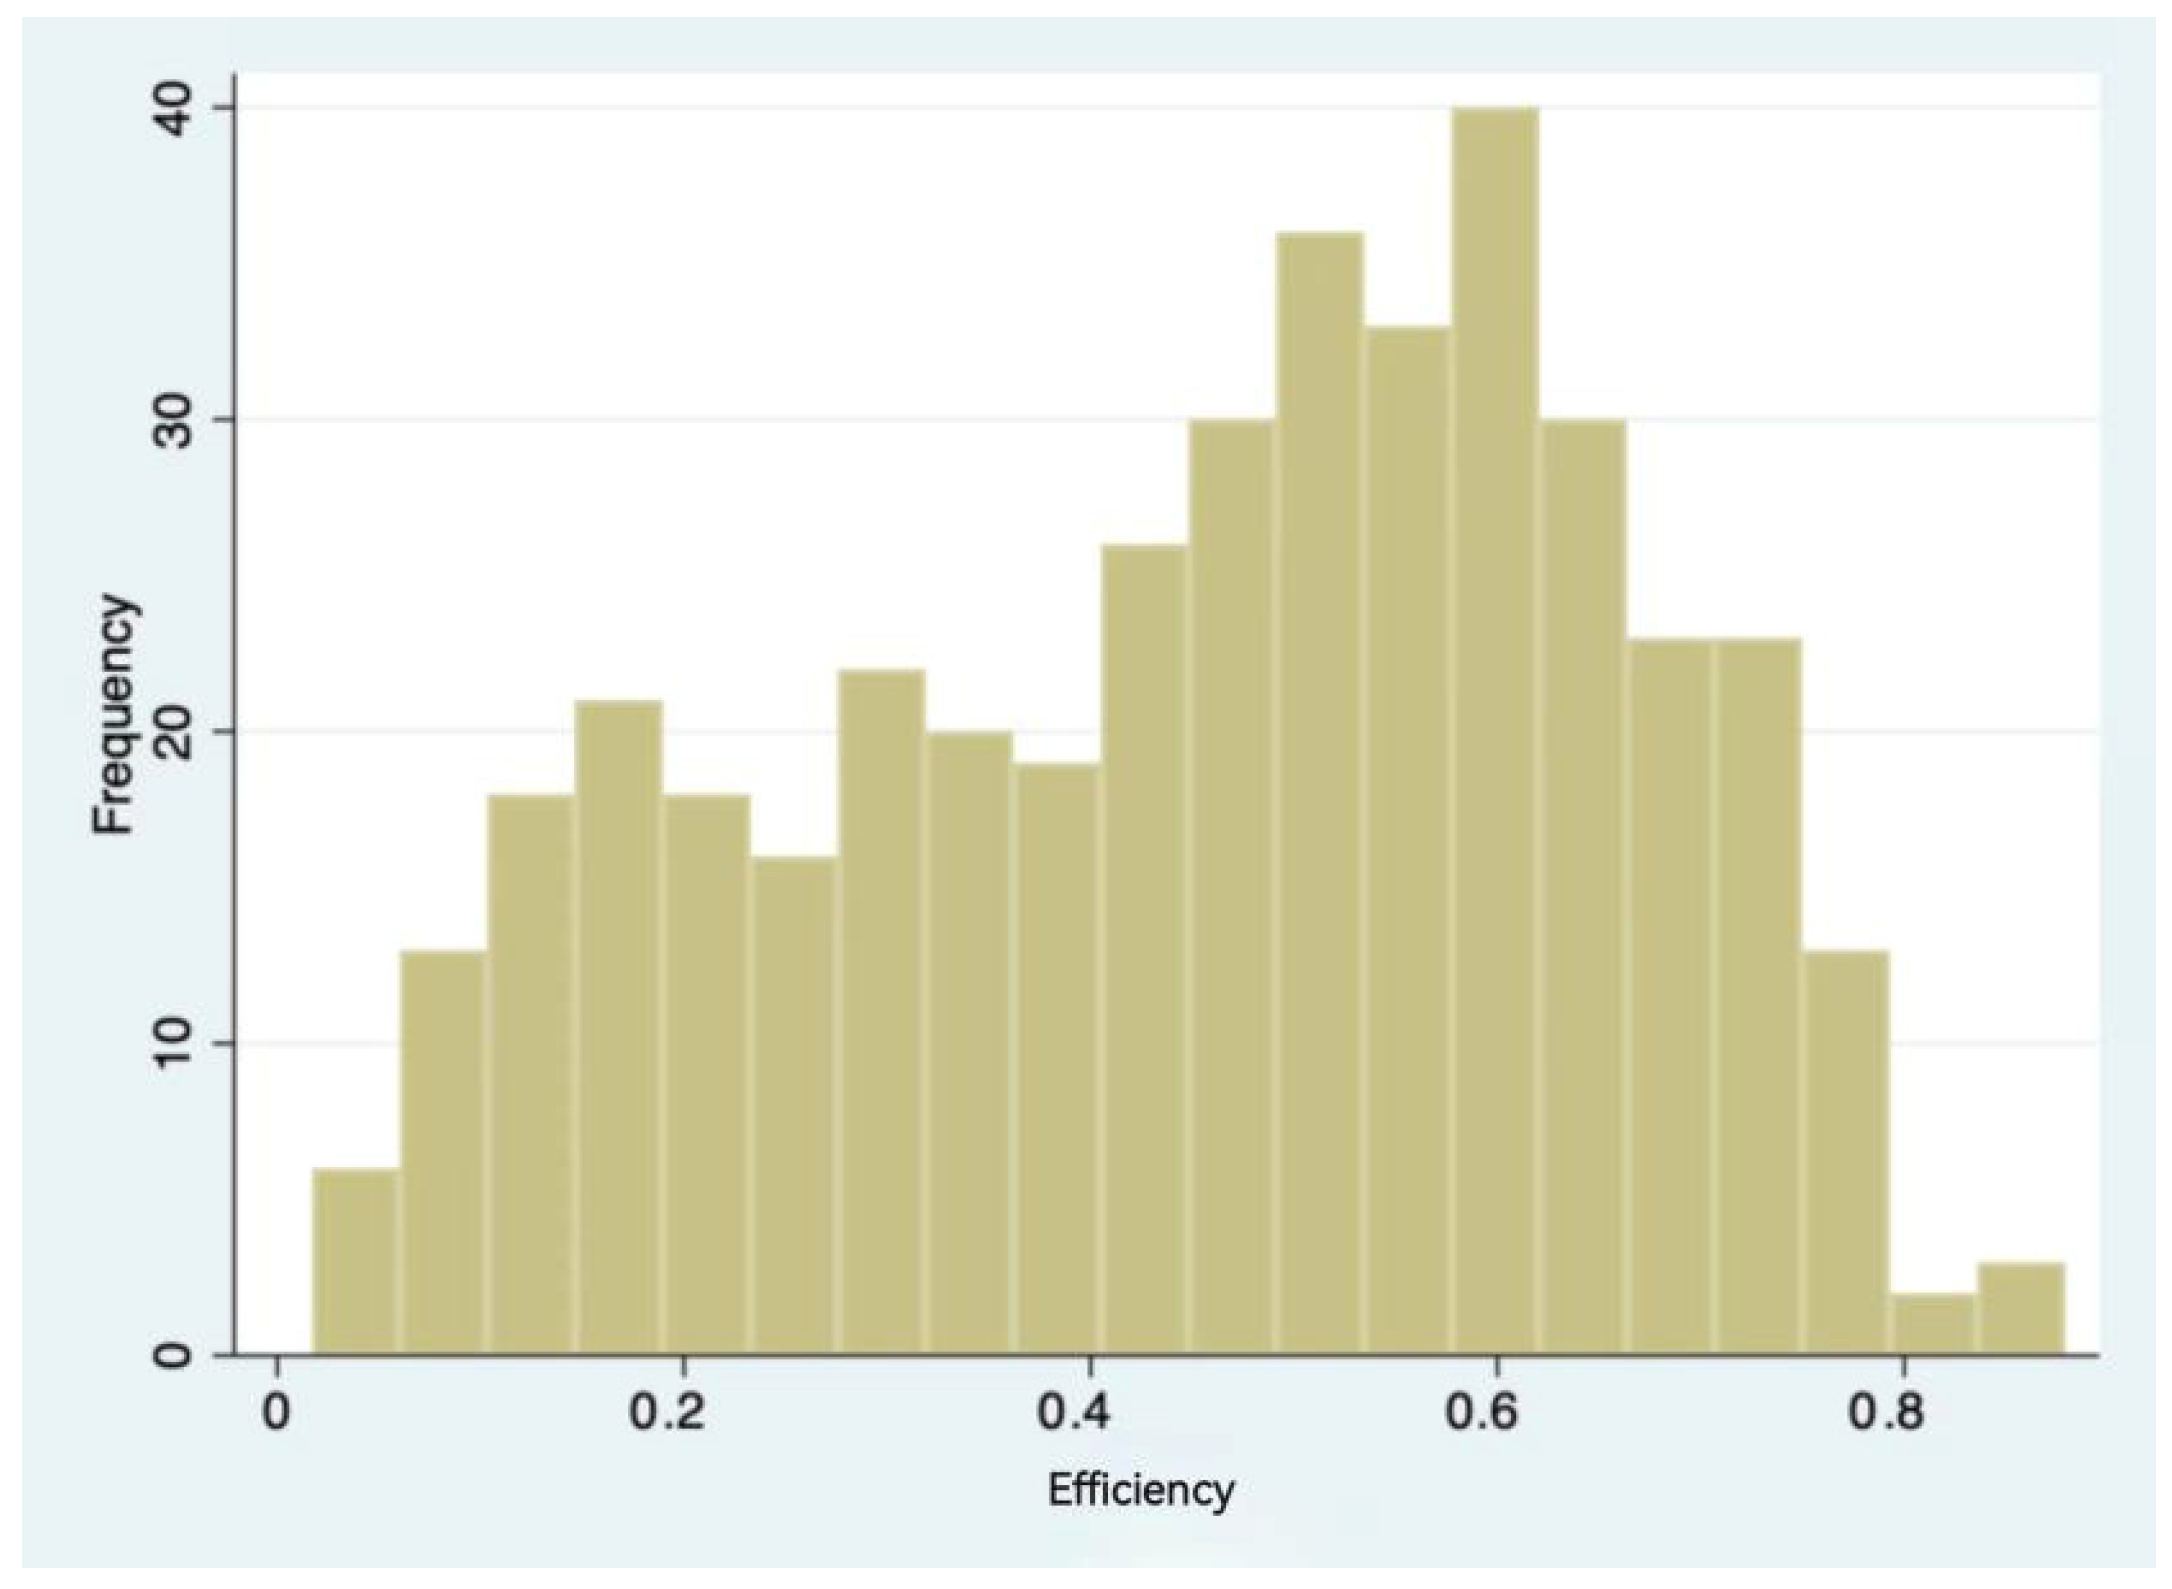
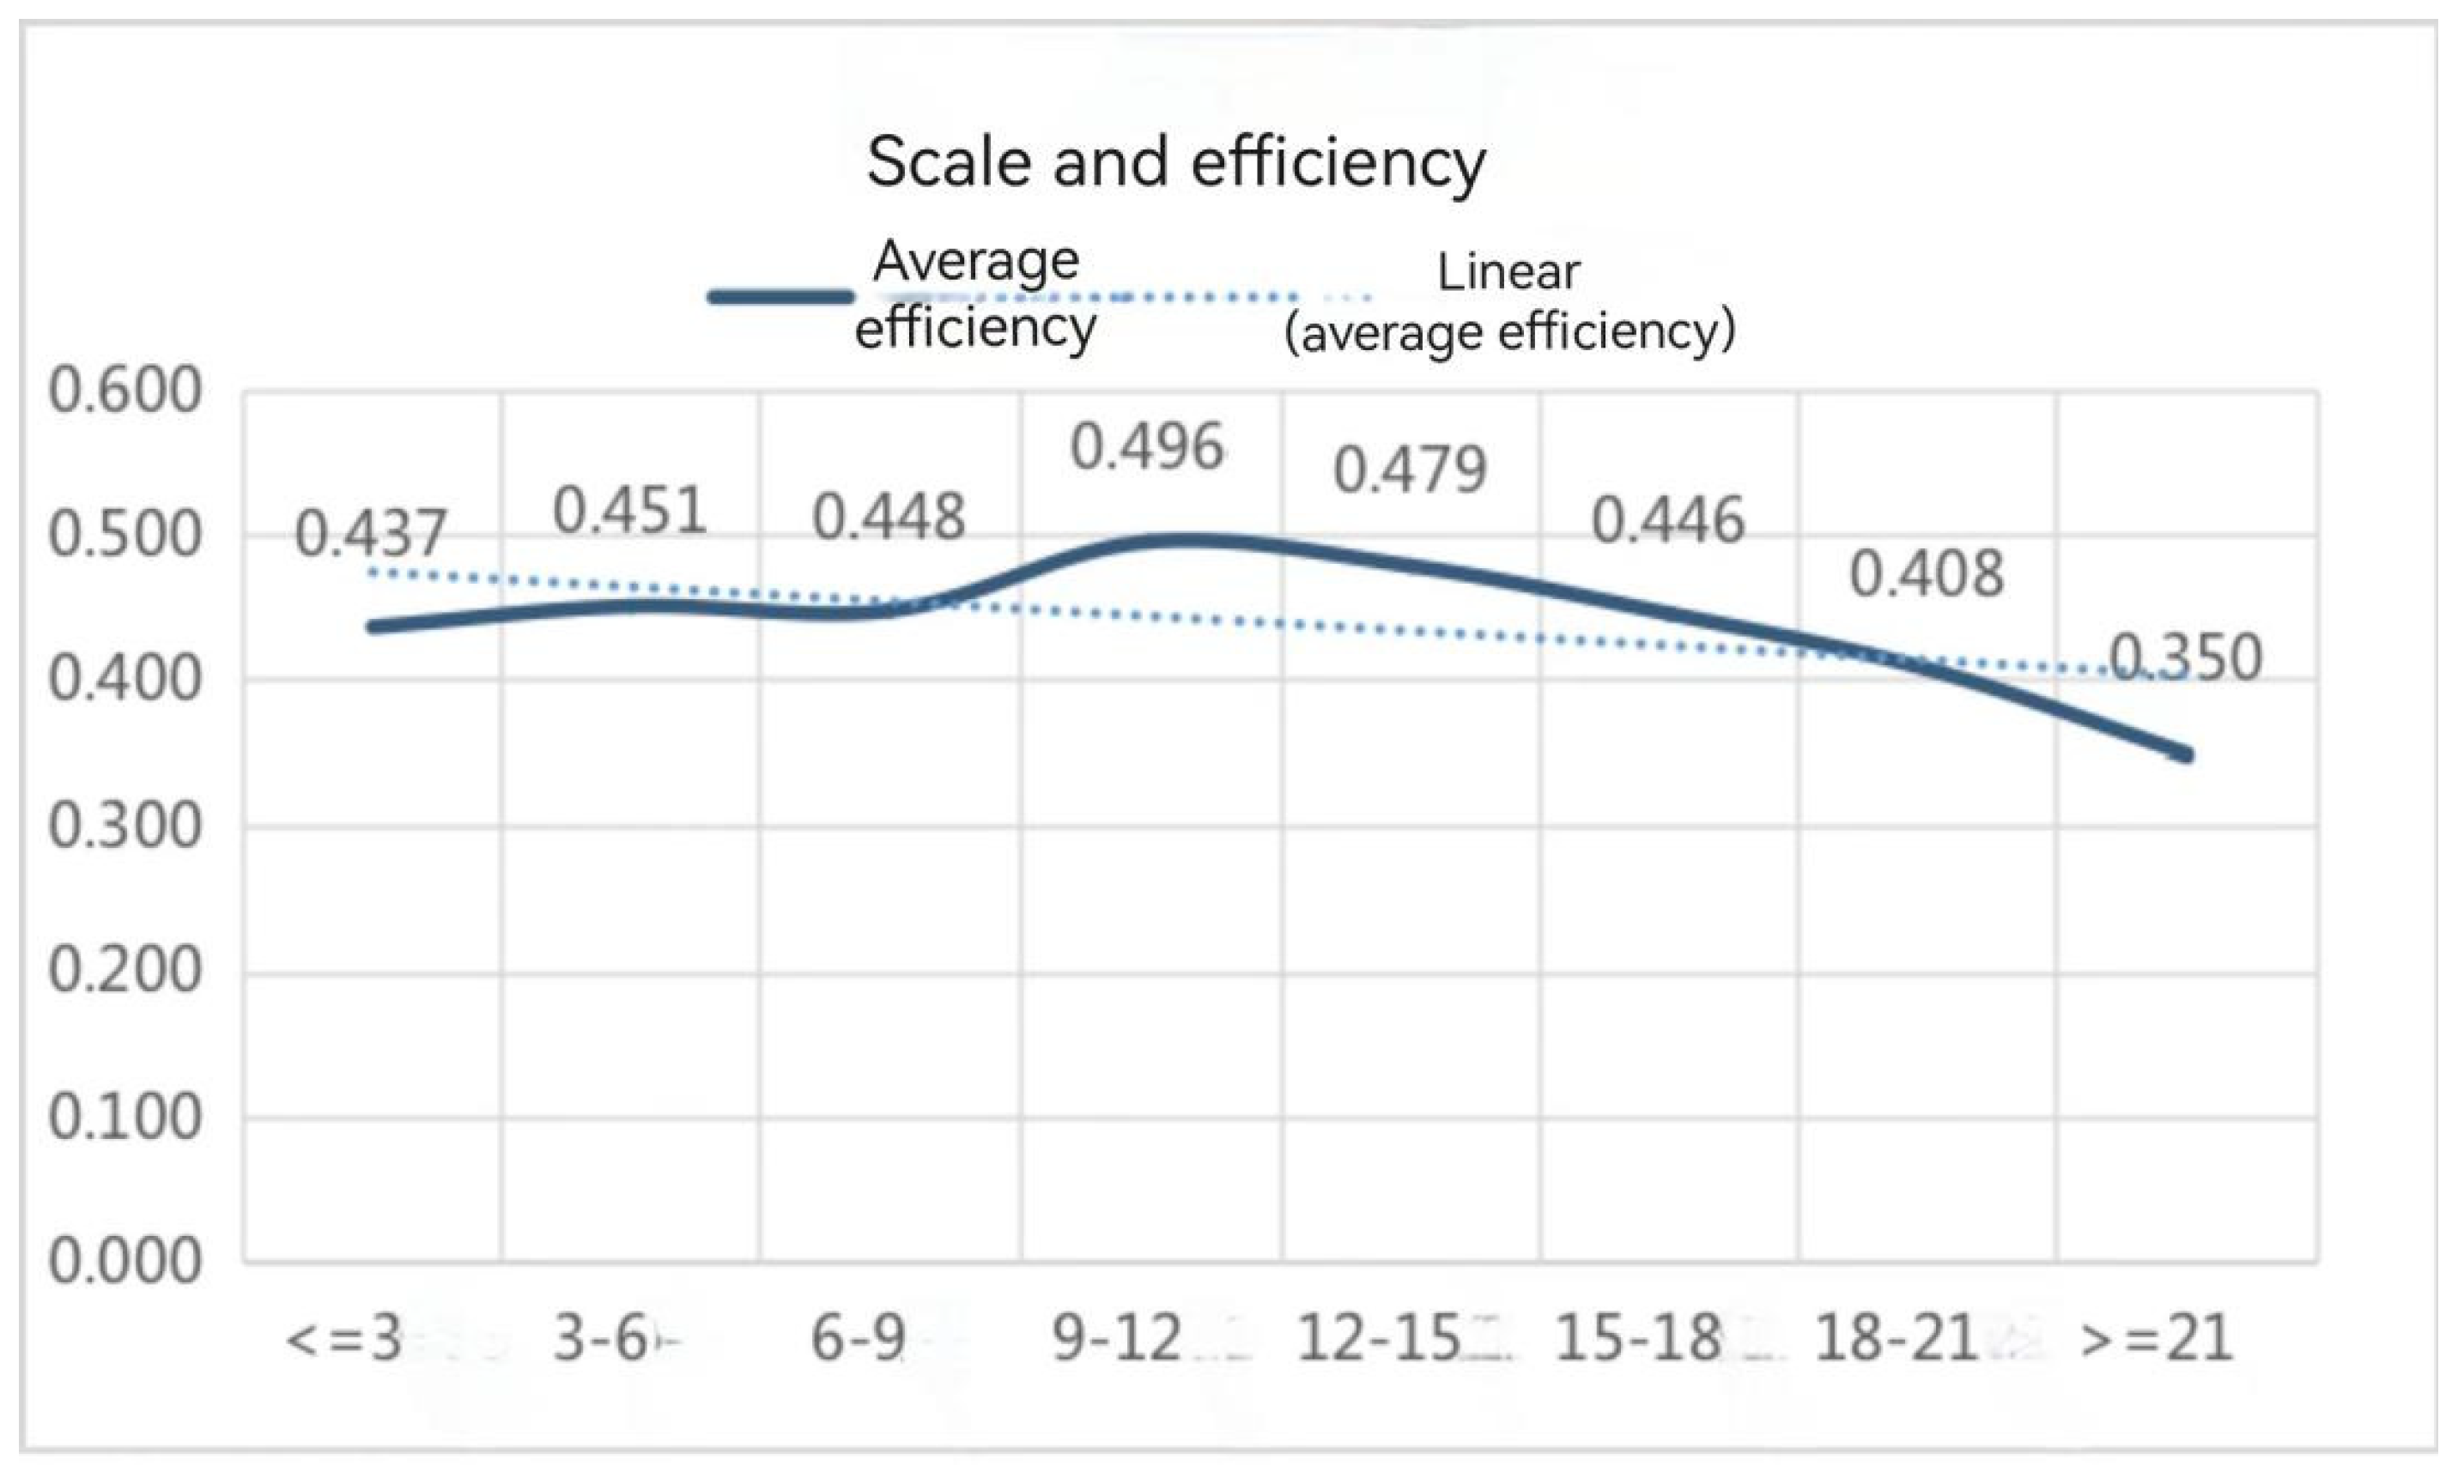
3.3. Efficiency Scores of Growers by Scale

The technical efficiency distribution of the sample planters in this study is presented in Figure 1, derived using Formula (3). The distribution range of efficiency levels among apple growers is found to be large, generally conforming to a slightly left-skewed normal distribution. The majority of apple growers exhibit efficiency levels concentrated in the range of 0.4–0.8, with a smaller number of growers exhibiting efficiency levels below 0.4 or above 0.8. The average efficiency level of the entire sample is 0.455, indicating a relatively low productivity level, with significant scope for improvement. Although a few farmers have achieved high planting efficiency, the majority of surveyed farmers exhibit a relatively low level of production technology efficiency.
To investigate the relationship between scale and efficiency, this study conducts a statistical analysis of production efficiency based on a segmented orchard area of 3 mu (1/15 ha). The technical efficiency results of apple growers of different scales are presented in Table 5. As shown in Figure 2, after subdividing the area with a range of 3 mu (1/15 ha), the production efficiency exhibits an inverted “U” shape. The average efficiency for orchards of 3 mu (1/15 ha) or less is 0.437, with efficiency increasing gradually as the scale increases. The highest efficiency planter scale is 9–12 mu (1/15 ha), with an average efficiency of 0.496, while the efficiency of farmers over 21 mu (1/15 ha) is only 0.350. After the scale exceeds 12 mu (1/15 ha), an increase in scale leads to a decrease in efficiency. The medium scale is the most suitable scale for apple farmers to plant.
These results demonstrate a unique correspondence between business scale and production efficiency for apple growers. The planting scale and production efficiency exhibit an inverted “U” trend, with small-scale and large-scale apple farmers experiencing a “dis-economies of scale” phenomenon. A scale that is too small leads to a loss of division of labor, unreasonable input factors, and other problems, while the initial rise in efficiency with scale (up to 12 mu (1/15 ha)) likely reflects economies of scale in input use and labor allocation. However, beyond this threshold, efficiency declines due to diminishing managerial returns—larger farms face challenges in monitoring hired labor, maintaining orchard quality, and coordinating fragmented plots. Smallholder apple production in China remains labor-intensive, and excessive scale may dilute precision management. Apple planting involves a unique production process that integrates labor-intensive and refined orchard management. A scale that is too small leads to a waste of labor, while a scale that is too large leads to a decrease in the degree of refinement. Therefore, medium-scale production is deemed most suitable for apple planting. These findings confirm the research results of scholars such as Qu Xiaobo (2009) [30] and Atanu (1994) [31] on scale differences and efficiency.
Furthermore, the average production efficiency of the sample in this study is found to be 0.455, indicating that if non-efficiency items in production can be completely eliminated, the production efficiency can be improved by approximately 54%, providing a significant opportunity for improvement. Additionally, there are significant differences in production technology efficiency among different groups, with small-scale planters exhibiting an efficiency of only 0.446, medium-sized planters exhibiting an efficiency of 0.484, and large-scale planters exhibiting an efficiency of only 0.432. These findings highlight the need for targeted policies to improve the efficiency of apple production among different scales of farmers.

3.4. Influencing Factors of Efficiency

The previous results illuminate the production efficiency and production function of apple growers in this study. To gain a deeper understanding of the factors influencing production efficiency, further analysis of exogenous factors is necessary. This study employs Tobit regression to examine these factors using Stata 15.1, and the regression results are presented in Table 6. The factors that have a significant impact on production efficiency are orchard area, other income, and being able to use a computer to search for information. Surprisingly, gender, age, and years of education do not have a significant impact on production efficiency. The non-significance of gender, age, and years of education may be attributed to the gender concentration of the surveyed farmers, who are mostly male, making it difficult to reflect gender differences in production. Similarly, the overall age and lower education level of the sample may be the reason why the impact of personal characteristics is not significant.
As expected, orchard size has a significant negative impact on production efficiency, consistent with the impact of scale and efficiency in the SFA model. Furthermore, the proportion of other income significantly reduces production efficiency, indicating that the higher the income earned by growers from other jobs, the lower the apple production efficiency. However, the number of family labor has no significant impact on production efficiency. Finally, the use of computers to search for information significantly improves the production efficiency of farmers, while participating in cooperatives has no significant impact on efficiency.
The Tobit model results demonstrate that personal characteristics of farmers, such as gender, age, and years of education, have limited influence on production efficiency, while production characteristics such as orchard size, level of focus, and ability to obtain information have a significant impact on production efficiency. As a labor-intensive agriculture, the number of family labor has no significant impact on efficiency in apple cultivation. However, the SFA results indicate that family labor has a significant impact on efficiency, with the time spent by family labor on apple planting playing a crucial role. Excessive part-time work reduces the time spent on apple planting and weakens the refined management of orchards, thereby reducing efficiency. Therefore, farmers can improve production efficiency by changing their production behavior, and their own conditions will not impose too many restrictions on efficiency improvement. For small-scale farmers, they can expand the planting area and increase the investment time of family labor to improve efficiency. Reducing part-time jobs can also effectively increase apple production efficiency. Given the labor-intensive nature and complex planting process of apple cultivation, the level of focus is crucial for improving efficiency. The use of computers represents the level of informatization of farmers, and the ability to use computers proves that farmers possess basic reading and information search abilities, as well as the potential to learn agricultural techniques and participate in e-commerce online. The significance of information parameters highlights the importance of informatization in improving production efficiency. The lack of a significant impact of cooperatives on apple production efficiency may be attributed to the low participation rate of fruit farmers (only 34%) or the failure of cooperatives to provide effective production management assistance.

4. Discussion and Conclusions

This study utilizes micro-data of apple growers collected from four provinces in China from 2019 to 2020 to estimate the production function using the stochastic frontier analysis (SFA) model, calculate the production efficiency of apple growers, and analyze the production scale. Furthermore, the Tobit model is employed to analyze the factors that affect production efficiency.
The findings of this study reveal that apple cultivation, similar to other traditional grain crops such as corn [32,33], exhibits an optimal scale, with medium growers achieving the highest production efficiency. This study confirms the inverted “U” relationship between scale and efficiency in apple planting, which has been previously demonstrated by scholars such as Qu Xiaobo (2009) [30]. However, the average efficiency in this study is significantly lower than its estimated average efficiency in the previous literature, potentially due to changes in apple planting technology and orchard management methods or variations in the research locations selected.
Empirical analysis suggests that the average efficiency of apple growers on a household basis is currently low, with non-efficiency in production being the main reason for low technical efficiency. The ineffective use of pesticides in the production factors is identified as the most unreasonable factor in the allocation of production factors. Previous studies have also highlighted the issue of technical inefficiency and unreasonable allocation of production factors among apple growers. For instance, Nie Yunbin (2018) [17] used the DEA model to study the production efficiency of apple growers in Shaanxi Province from 2012 to 2014 and found that the comprehensive technical efficiency was low, with technical inefficiency being the primary reason for low technical efficiency. To improve efficiency, farmers should prioritize (1) reducing excessive pesticide use through training on integrated pest management, (2) adopting ICT tools (e.g., computers) for real-time market and technical information, and (3) optimizing labor allocation rather than expanding scale indiscriminately. Pesticide overuse is a key inefficiency driver, as it raises costs without proportional yield gains. Similarly, Yu Linxia et al. (2018) [16] found that excessive investment in pesticides is the main reason for low efficiency in apple cultivation on the Loess Plateau.
Several factors affect the production efficiency of apple growers. Cai Wencong et al. (2022) [34] found that part-time farming significantly reduces apple production efficiency. However, Cai’s study suggests that farmers with higher production efficiency are less affected by part-time farming. Qiao Zhixia et al. (2018) [35] used survey data from apple growers in Shaanxi and Gansu provinces to verify the significant negative impact of aging on production efficiency. The main reason for the impact on production efficiency is excessive labor input in apple planting, while modern technology input is limited. Although this study may not fully reflect the impact of aging on production efficiency due to the limited sample size and high average age of the farmers, the aging of farmers is a common problem among Chinese farmers that deserves special attention in future research. Li Xia et al. (2010) [36] suggested that labor shortage and the lack of natural resources, particularly water resources, restrict the development of Shaanxi’s apple industry.
A large part of the “other inputs” in the production factors is generated by irrigation costs and has become a significant input in the production function. If the improvement of infrastructure construction can reduce this part of farmers’ expenses, it can help farmers improve efficiency and reduce costs. Qu Xiaobo’s (2009) [30] study found that the age and family characteristics of household heads have no significant impact on production efficiency, while the dissemination and promotion of technological information have a significant positive impact on production efficiency. Our research has shown that participating in cooperatives has no significant impact on production efficiency; a possible reason for this could be that the cooperatives in our sample may focus more on marketing than production technical support (e.g., input procurement), as observed in [37,38]. Smallholders often retain autonomy in farming decisions, diluting cooperative benefits, per Cui and Ma (2022) [39]. However, cooperatives with clear functions can significantly improve the production efficiency of their members, indicating that the effectiveness of cooperatives lies in their functional practicality (Qu et al., 2020) [38].
Among the factors affecting production efficiency, dis-economies of scale and unreasonable allocation of production factors are the main reasons for low technical efficiency. The pesticide input of small-scale growers is significantly higher than that of medium- and large-scale groups, which can lead to soil pollution, food residue pollution, and increased production costs, affecting the production efficiency of apple growers and reducing planting benefits. Therefore, effective measures should be taken to guide growers in scientific orchard management and avoid unnecessary inputs of chemicals.
In conclusion, improving the production efficiency of apple growers requires the implementation of effective measures, such as guiding farmers in land transfer, strengthening pesticide management, and establishing a natural resource protection system. These measures can effectively improve the production efficiency of apple growers, thereby promoting the sustainable development of the apple planting industry. The results of this study suggest that there is significant room for improvement in the efficiency of apple cultivation. The findings emphasize the need to address the issue of technological inefficiency and the unreasonable allocation of production factors to improve efficiency. Furthermore, this study highlights the importance of optimizing the use of pesticides in the production factors to enhance efficiency. Overall, this study contributes to the current literature on the production efficiency of apple growers and identifies the optimal scale for apple cultivation. The findings have important implications for policymakers and practitioners seeking to improve the efficiency and sustainability of apple cultivation in China and beyond.

5. Policy Suggestions

From the above results and discussion, this study provides policy recommendations to improve the production efficiency of apple growers. Firstly, policymakers should help farmers improve scale efficiency through land transfer, providing subsidies, loans, technical support, and other services to capable farmers. This can help them overcome “scale inefficiency,” achieve moderate scale operation, and improve the efficiency of agricultural production factor allocation. This recommendation is consistent with previous studies that have found an inverted “U” relationship between scale and efficiency in apple cultivation. While direct policy intervention in farm scale is impractical, extension services can disseminate efficiency–scale trade-off evidence to guide farmers’ land leasing decisions. Policies could also support land rental markets or farmer cooperatives to consolidate fragmented plots toward moderate-scale operation.
Secondly, policymakers should promote and guide farmers to use pesticides scientifically and encourage green production through a combination of market and policy measures. This can be achieved by strengthening guidance on the scientific application of pesticides for small-scale farmers, establishing demonstration sites for the scientific application of chemicals, and helping farmers allocate production factors scientifically. By reducing unnecessary chemical inputs in the production process, policymakers can not only improve production efficiency but also reduce the negative impact of pesticides on the environment and human health. Similarly, improving the level of intelligence and mechanization in apple planting can reduce dependence on farmers’ experience and labor, further promoting sustainable development in the apple planting industry.
Thirdly, policymakers should provide training on information technology and smart agriculture for farmers to enhance their ability to obtain information and improve their skills, thereby enhancing their orchard management level. At the same time, policymakers should enhance the supply of public goods in rural areas, strengthen information technology construction, and reduce the diffusion costs of information and technology. This recommendation aligns with previous studies that have emphasized the important role of technological information in improving production efficiency. By providing farmers with training and access to information technology, policymakers can enhance their ability to manage their orchards effectively and improve their decision-making skills. Additionally, by enhancing the supply of public goods in rural areas, policymakers can create an enabling environment that facilitates the adoption of new technologies and practices.
In summary, policymakers can take several measures to improve the production efficiency of apple growers. By promoting moderate scale operation, encouraging green production, and providing training on information technology and smart agriculture, policymakers can help farmers allocate their production factors more efficiently, reduce input costs, and improve their level of orchard management. These measures can ultimately lead to sustainable development in the apple planting industry and contribute to the achievement of broader agricultural development goals.

Author Contributions

Conceptualization, R.Q. and J.C.; methodology, R.Q.; software, R.Q.; validation, R.Q., J.C. and Y.W.; formal analysis, R.Q.; investigation, R.Q. and J.C.; resources, J.C.; data curation, R.Q.; writing—original draft preparation, R.Q.; writing—review and editing, R.Q. and J.C.; visualization, R.Q.; supervision, Y.W.; project administration, J.C.; funding acquisition, J.C. All authors have read and agreed to the published version of the manuscript.

Funding

National Key Research and Development Program of China, grant number 2017YFE0122500; China Science and Technology Innovation Project of Academy of Agricultural Sciences, grant number ASTIP-IAED-2025-07.

Data Availability Statement

The original contributions presented in the study are included in the article, further inquiries can be directed to the corresponding author.

Conflicts of Interest

The authors declare no conflict of interest.

References

  1. Fan, S. Effects of Technological Change and Institutional Reform on Production Growth in Chinese Agriculture. Am. J. Agric. Econ. 1991, 73, 266–275. [Google Scholar] [CrossRef]
  2. Li, X. Research on Input-Output Efficiency of Apple Growers; Northwest A&F University: Xianyang, China, 2010. [Google Scholar]
  3. Gao, S.; Wu, H. Analysis of the impact of the degree of organization of typical family farms on production efficiency. Issues Agric. Econ. 2021, 42, 88–99. [Google Scholar]
  4. Kang, X.; Liu, X. Analysis of Technical Efficiency in China’s Grain Production Based on Stochastic Frontier Analysis Method. China Rural. Obs. 2005, 4, 25–32. [Google Scholar]
  5. Qu, X. Research on Market Behavior of Farmers with Different Business Scales; Northwest A&F University: Xianyang, China, 2008. [Google Scholar]
  6. Zhang, Z.; Zhong, X. Analysis of the Impact of Farmland Fragmentation on the Production Technology Efficiency of Farmers of Different Sizes: Based on Data from 266 Farmers in Xinmin City Liaoning Province. Guangdong Agric. Sci. 2017, 44, 152–159. [Google Scholar]
  7. Sun, Y.; Shi, Z.; Sun, P. Can Scale Management Improve the Operating Efficiency of Large Corn Planters in Gansu Province. China Agric. Resour. Reg. 2019, 40, 78–84. [Google Scholar]
  8. Huang, Z.; Wang, J.; Chen, Z. The impact of non agricultural employment, land transfer, and land fragmentation on the technical efficiency of rice farmers. Chin. Rural. Econ. 2014, 359, 4–16. [Google Scholar]
  9. Liu, Q. A Study on the Land Management Scale and Performance of Chinese Rice Planting Farmers; Zhejiang University: Hangzhou, China, 2017. [Google Scholar]
  10. Gao, M.; Song, H.; Michael, C. Has subsidies reduced losses in grain production efficiency—Analysis Based on Dynamic Asset Poverty Theory. Manag. World 2017, 288, 85–100. [Google Scholar]
  11. Gao, M.; Song, H.; Michael, C. The impact of direct grain subsidies on wheat productivity of farmers with different operating scales: Based on data from fixed observation points in rural areas nationwide. Chin. Rural. Econ. 2016, 380, 56–69. [Google Scholar]
  12. Meng, L.; Zhang, H. Regional Differences in Technical Efficiency of Wheat Production in China. J. Nanjing Agric. Univ. Soc. Sci. Ed. 2004, 2, 13–16. [Google Scholar]
  13. Huang, W.; Wang, K. Analysis of Soybean Production Efficiency in China. J. Nanjing Agric. Univ. Soc. Sci. Ed. 2004, 1, 18–22. [Google Scholar]
  14. Yue, H.; Yu, F.; Cai, X. Research on the Measurement of Total Factor Productivity of Grain in China: Malmquist DEA Analysis Based on Input Output. Price Theory Pract. 2022, 455, 122–125. [Google Scholar]
  15. Guo, Y.; Yao, S.; Huo, X. Calculation and Analysis of China’s Apple Production Technology Progress Rate—Based on Stochastic Frontier Analysis Method. Agric. Technol. Econ. 2013, 215, 54–61. [Google Scholar]
  16. Yu, L.; Zhang, B.; Bai, X. A study on the efficiency and influencing factors of apple production technology in the Loess Plateau region: Based on survey data from 528 apple growers. Resour. Environ. Arid. Areas 2018, 32, 68–74. [Google Scholar]
  17. Nie, Y.; Yan, X. Analysis of Apple Production Efficiency—Based on Survey Data of 602 Apple Specialists in 8 Counties of Shaanxi Province. Agric. Technol. Econ. 2018, 283, 110–119. [Google Scholar]
  18. Cheng, J.; Wang, Q.; Yoshikawa, N. Evaluation of Apple Production Environment Efficiency Based on LCA and SBM Models. Resour. Environ. Arid. Areas 2022, 36, 36–43. [Google Scholar]
  19. Liu, T.; Pan, M.; Zhu, Y.; Huo, X. Characteristics and Convergence of Production Technology Efficiency Changes in Apple Dominant Areas: Data from 573 Fruit Farmers in 5 Provinces of the Loess Plateau. J. Shanxi Univ. Financ. Econ. 2012, 34, 58–66. [Google Scholar]
  20. Shi, H.; Wang, J.; Wang, Y. Empirical Study on the Production Efficiency of the Apple Industry in Hebei Province Based on DEA. Agric. Technol. Econ. 2011, 198, 86–91. [Google Scholar]
  21. Renzetti, S.; Dupont, D.P. Measuring the Technical Efficiency of Municipal Water Suppliers: The Role of Environmental Factors. Land Econ. 2009, 85, 627–636. [Google Scholar] [CrossRef]
  22. Wang, L.; Huo, X. Analysis of production cost efficiency for apple growers. North. Hortic. 2015, 342, 182–187. [Google Scholar]
  23. Qian, L.; Hong, M. Non agricultural employment, land transfer, and changes in agricultural production efficiency: An empirical analysis based on CFPS. Chin. Rural. Econ. 2016, 12, 2–16. [Google Scholar]
  24. Qi, J.; Guo, G.; Chen, Y. Research on the Impact of Agricultural Land Transfer on Agricultural Production Efficiency—Analysis Based on DEA Tobit Model. Resour. Sci. 2015, 37, 1816–1824. [Google Scholar]
  25. Wang, Z. Regional characteristics of production efficiency and decomposition of productivity growth: A method based on principal component analysis and stochastic frontier transcending logarithmic production function. Res. Quant. Econ. Tech. Econ. 2010, 27, 33–43+94. [Google Scholar]
  26. Zhang, L.; Cao, J. Growth of China’s agricultural total factor productivity: The introduction of changes in allocation efficiency: An empirical analysis based on the stochastic frontier production function method. Chin. Rural. Econ. 2013, 339, 4–15. [Google Scholar]
  27. Yang, J. Research on the Impact of Internet Usage on the Technical Efficiency and Allocation Efficiency of Farmers’ Grain Production; Southwest University: Chongqing, China, 2022. [Google Scholar]
  28. Fu, X.; Wu, L. Technical Efficiency, Capital Deepening, and Regional Differences: Analysis of Regional Convergence in China Based on Stochastic Frontier Models. Econ. Res. 2006, 10, 52–61. [Google Scholar]
  29. Aigner, D.; Lovell, C.A.K.; Schmidt, P. Formulation and Estimation of Stochastic Frontier Production Function Models. J. Econom. 1977, 6, 21–37. [Google Scholar] [CrossRef]
  30. Qu, X. Analysis of the differences in production technical efficiency of farmers of different scales and its influencing factors: Based on the production function of the transcendental logarithmic stochastic frontier and the micro data of farmers. J. Nanjing Agric. Univ. Soc. Sci. Ed. 2009, 3, 27–35. [Google Scholar]
  31. Atanu, S.; Love, H.A.; Schwart, R. Adoption of Emerging Technologies Under Output Uncertainty. Am. J. Agric. Econ. 1994, 76, 836–846. [Google Scholar] [CrossRef]
  32. Jiang, Y.; Li, S. A Study on the Production Efficiency and Moderate Scale Operation of Agricultural Machinery Cooperatives in Major Grain Production Areas–Taking Corn Production in Heilongjiang Province as an Example. Res. Agric. Mod. 2016, 37, 902–909. [Google Scholar]
  33. Jia, L.; Xia, Y. Analysis on the Scale Efficiency and Influencing Factors of Grain Production by Farmers: Based on Survey Data of Corn Planters in Hei, Yu, and Sichuan Provinces. Resour. Sci. 2017, 39, 924–933. [Google Scholar]
  34. Cai, W.; Yang, H.; Zhang, Q. Have farmers engaging in part-time farming led to low efficiency in agricultural production—Based on the perspective of agricultural socialized services. Resour. Environ. Arid. Areas 2022, 36, 26–32. [Google Scholar]
  35. Qiao, Z.; Huo, X.; Zhang, B. The impact of aging agricultural labor on the production efficiency of labor-intensive agricultural products: An empirical study based on 745 apple households in Shaanxi and Gansu. Econ. J. 2018, 35, 73–79. [Google Scholar]
  36. Li, X.; Wang, J.; Huo, X. Analysis of input-output efficiency of apple growers: Based on survey data of 300 apple growers in Luochuan, Shaanxi. J. Huazhong Agric. Univ. Soc. Sci. Ed. 2010, 87, 43–48. [Google Scholar]
  37. Ma, W.; Abdulai, A. Does cooperative membership improve household welfare? Evidence from apple farmers in China. Food Policy 2016, 58, 94–102. [Google Scholar] [CrossRef]
  38. Qu, R.; Wu, Y.; Chen, J.; Jones, G.D.; Li, W.; Jin, S.; Chang, Q.; Cao, Y.; Yang, G.; Li, Z.; et al. Effects of Agricultural Cooperative Society on Farmers’ Technical Efficiency: Evidence from Stochastic Frontier Analysis. Sustainability 2020, 12, 8194. [Google Scholar] [CrossRef]
  39. Cui, B.; Ma, K. Can cooperatives become an effective vehicle for rural governance in China? The unexpected functions of cooperatives. Chin. Rural. Econ. 2022, 10, 41–58. [Google Scholar]
Figure 1. Efficiency distribution.
Horticulturae 11 00655 g001
Figure 2. Relation between scale and efficiency.
Horticulturae 11 00655 g002
Table 1. Descriptive statistics of farmers by scale (per mu (1/15 ha)).
ScaleAverageStandard ErrorMinMaxFreq.Percentage
6 mu and below4.091.551614534.94%
6–11 mu8.911.2971114234.22%
11 mu and above16.503.7311.72712830.84%
Overall9.545.58127415100%
Table 2. Input statistics of farmers by scale (per mu (1/15 ha)).
ScaleVariableYieldFertilizerPesticideFamily LaborHired LaborBaggingOthers
6 mu and below
(Small scale)
Average6365.211498.02438.3226,097.832104.22543.96860.75
Standard error6483.691005.74417.574126.207763.29472.912351.36
Min75140250000
Max40,0007000240050,00066,880360018,000
6–11 mu
(Medium scale)
Average5689.151777.73375.031186.634232.68376.471774.65
Standard error4808.391145.37494.69711.5410,317.31238.224560.58
Min133.33180150011.250
Max25,714.29600033404408.1696,740120040,000
11 mu and above
(Large scale)
Average3456.671788.81362.264107757.78253.64900.59
Standard error3866.581452.42579.79236.1418,313.90201.992434.04
Min4080200000
Max18,461.5410,90047001500153,16095015,000
Table 3. Descriptive statistics of variables in Tobit model.
VariableVariable ExplanationAverageStandard ErrorMinMax
EfficiencyResults from SFA model0.450.180.020.88
SexSex of the investigated farmer, male = 1, female = 00.880.3201
AgeAge of the investigated farmer52.459.272875
EducationEducation length (in years) of the investigated farmer8.143.33016
ScaleOrchard area of the investigated farmer9.545.58127
Family laborNumber of family labor of the investigated farmer2.010.6114
Irrigation areaIrrigation area of the investigated farmer5.246.29026
Other incomePercentage of other income in total income10.6918.97090
InformationBeing able to use computer for searching information, yes = 1, no = 00.140.3501
CooperativeWhether in an agricultural cooperative, yes = 1, no = 00.340.4801
Table 4. Production coefficients estimated for SFA model.
VariableAllSmall ScaleMedium ScaleLarge Scale
CoefficientStandard ErrorCoefficientStandard ErrorCoefficientStandard ErrorCoefficientStandard Error
Ln (Fertilizer)0.224 ***0.0690.0930.1320.1270.0430.354 ***0.118
Ln (Pesticide)0.0690.0470.1030.082−0.0200.0710.1320.088
Ln (Hired Labor)0.050 **0.0170.0060.0280.047 **0.0050.098 ***0.036
Ln (Family Labor)0.182 ***0.0310.149 **0.0540.0710.1740.373 ***0.118
Ln (Bagging)0.344 ***0.0340.251 ***0.0490.822 ***0.0100.355 ***0.062
Ln (Other)0.039 **0.0130.079 ***0.0240.0270.100−0.0210.025
Constant3.603 ***0.5915.206 ***1.1532.701 **0.0350.906 ***1.218
lnsig2 v−1.157 **0.228−1.177 **0.407−1.495 ***0.031−0.8560.435
lnsig2 u0.525 ***0.1650.624 **0.268−0.2390.8140.3260.439
Log Likelihood−559.333−201.937−151.606−169.814
Prob > chi20.0000.0010.0050.005
Planting Efficiency0.4550.4460.4840.432
** p < 0.01, *** p < 0.001.
Table 5. Efficiency distribution by scale.
ScaleNAverage EfficiencyStandard
Error
MinMax
<=3 mu560.4370.1940.1000.848
3–6 mu900.4510.2090.0170.879
6–9 mu770.4480.2000.0790.788
9–12 mu870.4960.1910.0680.772
12–15 mu380.4790.1850.1180.863
15–18 mu240.4460.2180.0460.767
18–21 mu300.4080.1850.1170.779
>=21 mu100.3500.2660.0230.793
Overall4120.4550.2000.0170.879
Table 6. Tobit model results.
VariableCoefficientsStandard ErrorT Value
Sex0.0160.0290.55
Age−0.0180.001−1.56
Education−0.0020.003−0.7
Scale−0.042 **0.002−2.88
Family labor0.0030.0170.17
Irrigation area−0.0070.002−0.36
Other income−0.019 ***0.001−3.65
Information0.065 **0.0272.47
Cooperatives−0.0250.021−1.2
Constant term0.622 ***0.0916.81
Log likelihood155.712
** p < 0.01, *** p < 0.001.
Disclaimer/Publisher’s Note: The statements, opinions and data contained in all publications are solely those of the individual author(s) and contributor(s) and not of MDPI and/or the editor(s). MDPI and/or the editor(s) disclaim responsibility for any injury to people or property resulting from any ideas, methods, instructions or products referred to in the content.

