1. Introduction
Precise farming management involves high-resolution data collection from sources such as micro-climates, soil, plants, and fruits, followed by the implementation of appropriate agronomical practices [
1,
2]. In the olive, continuous monitoring aims at applying real-time optimization to orchard performance [
3,
4,
5] and it can be obtained using proximal plant-based sensors mounted in contact with the surface of the organs of the plant such as the root, trunk, stem, leaves, and fruit [
6,
7].
This kind of sensing has been investigated in several studies on olives. For instance, Cuevas et al. [
8] measured the trunk diameter variation to obtain an index for water stress. Brunetti et al. [
9] used a custom leaf sensor to continuously monitor leaf water status as an applicable tool for precision irrigation. Khosravi et al. [
10] monitored fruit diameter and simulated a model for olive maturation detection in the cultivar ‘Frantoio’. However, there are some challenges regarding the application of continuous monitoring using proximal plant-based sensors in an olive orchard, such as the difficulty of replicating on many trees [
11], and wide genetic diversity of olives, which leads to various physiological and morphological mechanisms, requiring the development of cultivar-specific thresholds [
12], or developing non-cultivar-specific methods.
To deal with these challenges various solutions have been provided. Several studies suggested the application of innovative methods for evaluation of sensor output data such as hysteresis phenomenon [
13,
14,
15]. Hysteresis is defined as a non-linear loop-like behavior that does not show affine similarity with respect to time [
14,
16]. In olive, Khosravi et al. [
5] developed a method using the detection of different hysteresis curves for fruit diameter versus vapor pressure deficit (VPD) and suggested a non-cultivar-specific model for setting quantitative index of water status detection. However, this method has been tested just on the proximal fruit-based sensing and should be examined for other tree organs.
Another suggested solution was to combine non-continuously measured parameters with continuously measured data. Hernandez-Santana et al. [
17] measured stomatal conductance in a non-continuous manner and correlated it with continuously measured sap flow. This study suggested the possibility of estimating stomatal conductance in olive trees automatically and continuously under field conditions by using sap flux data.
Other advanced research combined different continuous plant-based measurements. Rodriguez-Dominguez et al. [
18] used stem sap flow and leaf turgor pressure to model the response of trees on different levels of water stress and prioritized implementation of different sensors according to the different levels of stress. Marino et al. [
4] combined three different sensors, including sap flow, leaf turgor pressure, and fruit gauge, to identify the most efficient one for detecting mild water stress in two Sicilian olive cultivars. The results suggested that a combination of sensors could detect water stress in olives earlier than a single sensor. Additionally, different responses were reported between these two olive cultivars. Therefore, more studies combining various sensors are needed to reveal different responses of various organs and to establish more robust models in different climates and olive cultivars.
This research examined four different organs of the olive tree, including root, trunk, branch, and fruit, by mounting proximal plant-based sensors (dendrometer) to evaluate the evolution of each organ on the same tree during the third stage of olive fruit growth (mesocarp cell expansion). The specific objective was to continuously describe the behavior of the ‘Ascolana tenera’ olive cultivar under mild water stress conditions. To our knowledge, no other studies have yet continuously monitored olive trees through root, trunk, branch, and fruit diameters.
2. Materials and Methods
2.1. Site Description and Phenology
The experiment was conducted in 2023 in 14-year-old olive trees (Olea europaea L., cv. ‘Ascolana tenera’) at the commercial olive orchard of Olive Gregori, in Montalto delle Marche, Ascoli Piceno, Italy (latitude 42°5805700 N; longitude 13°3802100 E; altitude 310 m asl). The olive trees were planted with a northwest to southeast orientation, according to a 7.0 × 7.0 m array (204 trees per hectare) and trained as free open vase. The soil had a clay texture, and agricultural operations, pest control, and fertilization practices were conducted in accordance with organic farming practices. The full bloom occurred on the 31st May (DOY 151) and the pit hardening on the 29th July (DOY 210). Olive trees were rainfed during 2023.
2.2. Plant Measurements
The diameter of root, trunk, branch, and fruit were monitored by automatic dendrometers from 14th August (DOY 226) to 8th October (DOY 281) 2023. Sensor’s installation consisted of two different sensors set. The first set of sensors (Ecomatik GmbH, Munich, Germany) was installed on 3 representative trees and consisted of one root dendrometer (model DD-RO), one trunk dendrometer (model DD-L1), two branch dendrometers (model DD-S2), and two fruit extensimeters (synonyms of fruit gauge/dendrometer, model DF6). This resulted in a total of 3 root dendrometers, 3 trunk dendrometers, 6 branch dendrometers, and 6 fruit extensimeters. The second set of sensors, installed in 3 representative trees consisted in a branch dendrometer and a fruit extensimeter of the same model as before, making a total of 3 branch dendrometers and 3 extensimeters. Totally we examined the diameter of 3 roots, 3 trunks, 9 branches, and 9 fruits. All sensors were connected to low-power Long Range Wide Area Network, (LoRaWAN) nodes (Ecomatik GmbH, Munich, Germany). The LoRa nodes were integrated via a LoRaWAN gateway, which establishes the connection to the Internet and the LoRa server for storing the measurement data.
Regarding the root dendrometer, the northwest side of the trunk at about 40 cm from the base was excavated to a depth of approximately 30 to 45 cm to locate a lateral root with a diameter of around 1 cm. Afterward, the surface of the root was carefully cleaned with soft cloths and inspected to ensure it was free of scars and damage. Then, the sensor was mounted on the root and secured with elastic bands in a way that avoided causing any damage and preserved the position and functioning of the root (
Figure S4). Finally, the soil was carefully placed back into position. Trunk dendrometers were installed on the northern side of the trunk at a height of about 40 cm from the ground, in areas free of scars and other irregularities. Fruit extensimeters were mounted on the same side of the trunk as the trunk dendrometers, at a height of about 1.2 m, and positioned at the midpoint of the canopy. Branch dendrometers were mounted on the same branch as the extensimeters.
The collected data underwent standardization using z-scores method [
19] with the following equation
where z is the standardized value (unitless), x is the value of the existing data (mm), mean is the average of all data (mm), and SD is the standard deviation. The standardized value could range from a negative to a positive value, according to the distance from the mean value of the data.
On all the trees with installed sensors, the stem water potential (ᴪStem) was measured at midday every 3 to 4 weeks (
Table 1) using a pressure chamber (model 1000, PMS Instrument Co., Albany, OR, USA) on apical shoots (with 3–5 pairs of leaves) covered with aluminum foil approximately 1 h before the reading [
20]. These measurements were conducted during midday solar time.
Table 1 shows that even though the trees were not irrigated, they maintained mild water stress.
2.3. Meteorological Data
The climate of the study area is Mediterranean, and according to the Köppen–Geiger climate classification, Montalto delle Marche falls under the Cfb category, which is characterized by warm temperatures and high humidity, particularly during the summer months [
21]. The meteorological data were sourced from the nearest regional meteorological station (
www.protezionecivile.marche.it, accessed 26 March 2025), located approximately 6 km away from the orchard. Vapor pressure deficit (VPD) was computed using the formula recommended by Monteith and Unsworth [
22]
where RH is the relative humidity, SVP is the saturated vapor pressure, and T is the temperature (°C).
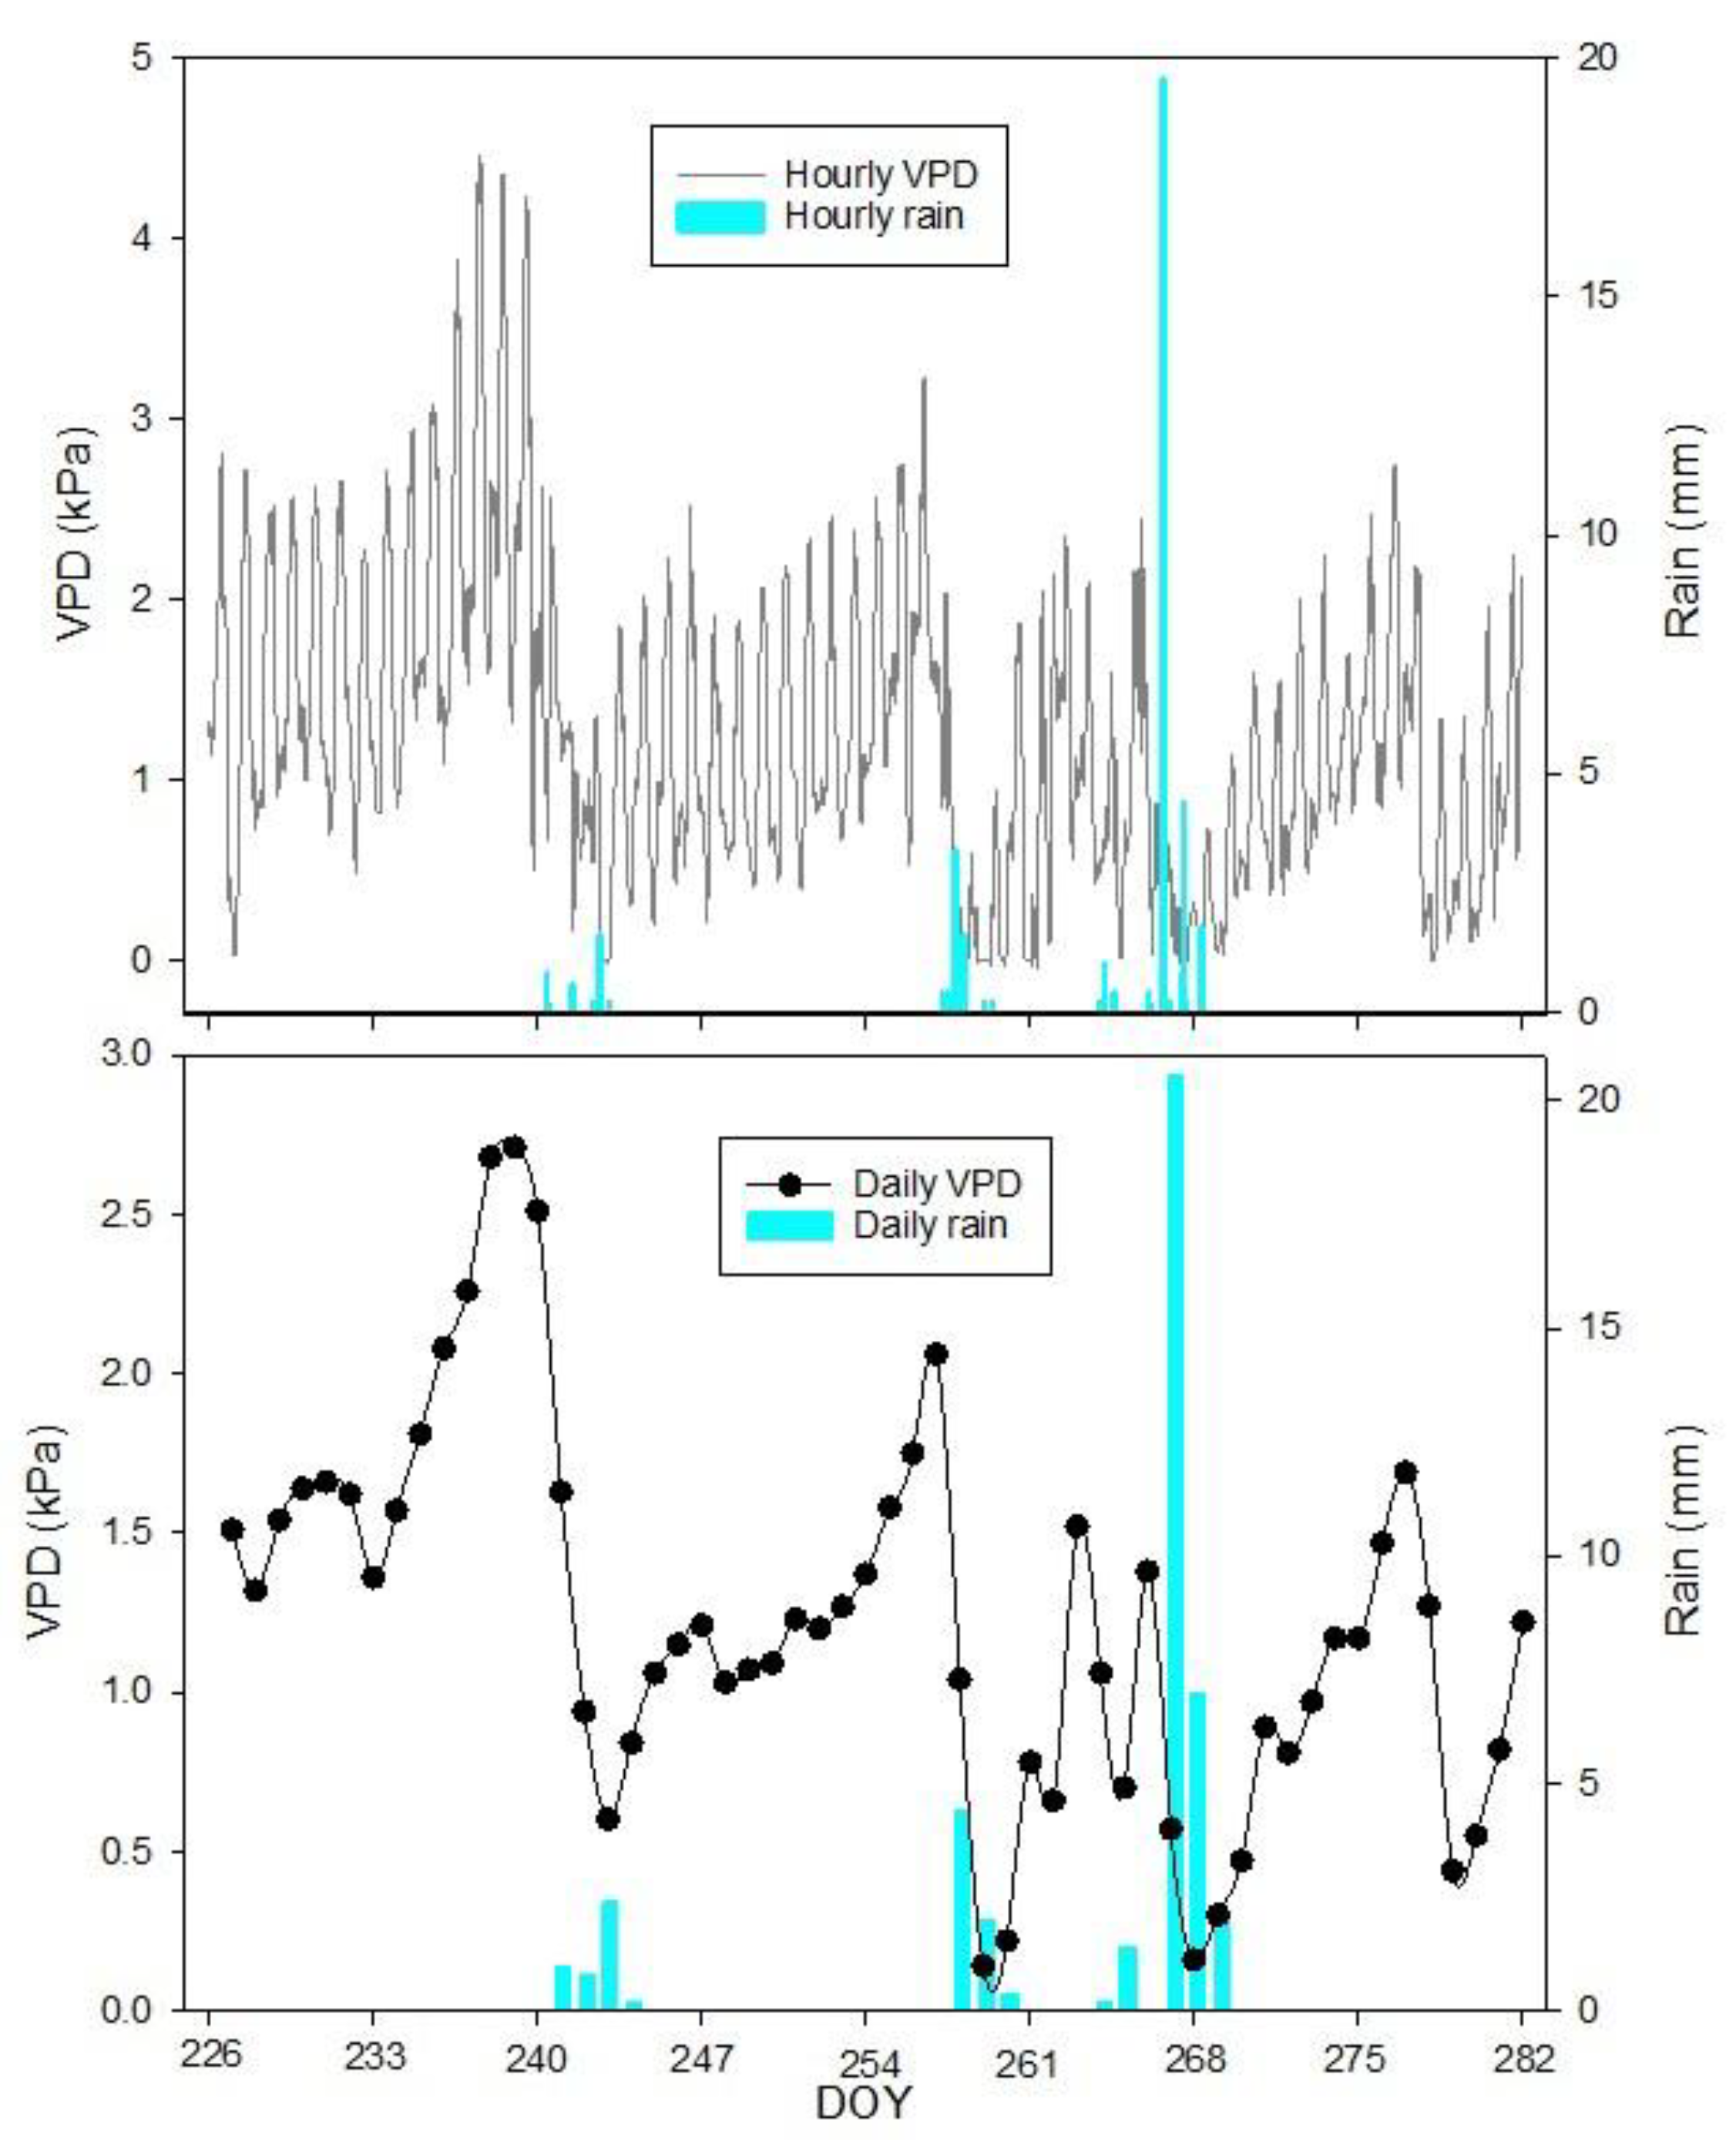
The VPD and rainfall data captured during the experiment (DOY 226 to DOY 281) are reported in
Figure 1. The highest hourly VPD measured was 4.46 kPa on 25th August (DOY 237). The lowest value of VPD was 0.00 kPa on the 30th and 31st of August, as well as on the 14th, 15th, 16th, 17th, 18th, 23rd, 24th, 25th September and the 5th October (DOY 242, 243, 257, 258, 259, 260, 261, 266, 267, 268, and 278, respectively) due to an increase in relative humidity to 100%. The highest daily average of VPD was 2.71 kPa on 26th August (DOY 238), whereas the lowest was 0.14 kPa on 15th September (DOY 258). The daily mean VPD during the experiment was 1.23 ± 0.58 kPa.
Throughout the experimental period, the total cumulated rainfall was 42.4 mm, with peak hourly and daily values reaching 19.6 mm hour−1 and 20.6 mm day−1, respectively, recorded on 23rd September (DOY 266).
2.4. Hysteresis Pattern
Considering hysteretic behavior as an indirect response of vegetation to diurnal changes in the external environment [
23], the daily hysteretic pattern of different organs diameter (z-score) versus VPD has been monitored. VPD has been selected not only as one of the most significant variables but also as a driver for transpiration in plants due to its crucial role in plant growth and productivity [
24]. To describe the hysteresis rotational pattern, the terms clockwise and anticlockwise were used. A clockwise pattern indicates that the progression of data points over time forms a loop in the direction of a clock’s hands, while an anticlockwise pattern follows the opposite direction (see [
5,
10,
14]). Additionally, the hysteresis form was characterized as either partial or complete. A partial hysteresis curve appeared only during part of day and did not represent the entire day. In contrast, a complete hysteresis loop represents the entire day (see [
5,
10,
15]).
2.5. Data Analysis and Visualization
Descriptive statistics were conducted on the output of different sensors, obtaining the mean, maximum, minimum, and standard deviation values. A regression analysis was performed to evaluate the linear relationship between the organs over the entire experiment and across four different time intervals. The coefficient of determination (R2) was calculated. Data analysis and graph visualization were performed using SigmaPlot 14.5 (Systat Software, Inc., San Jose, CA, USA).
4. Discussion
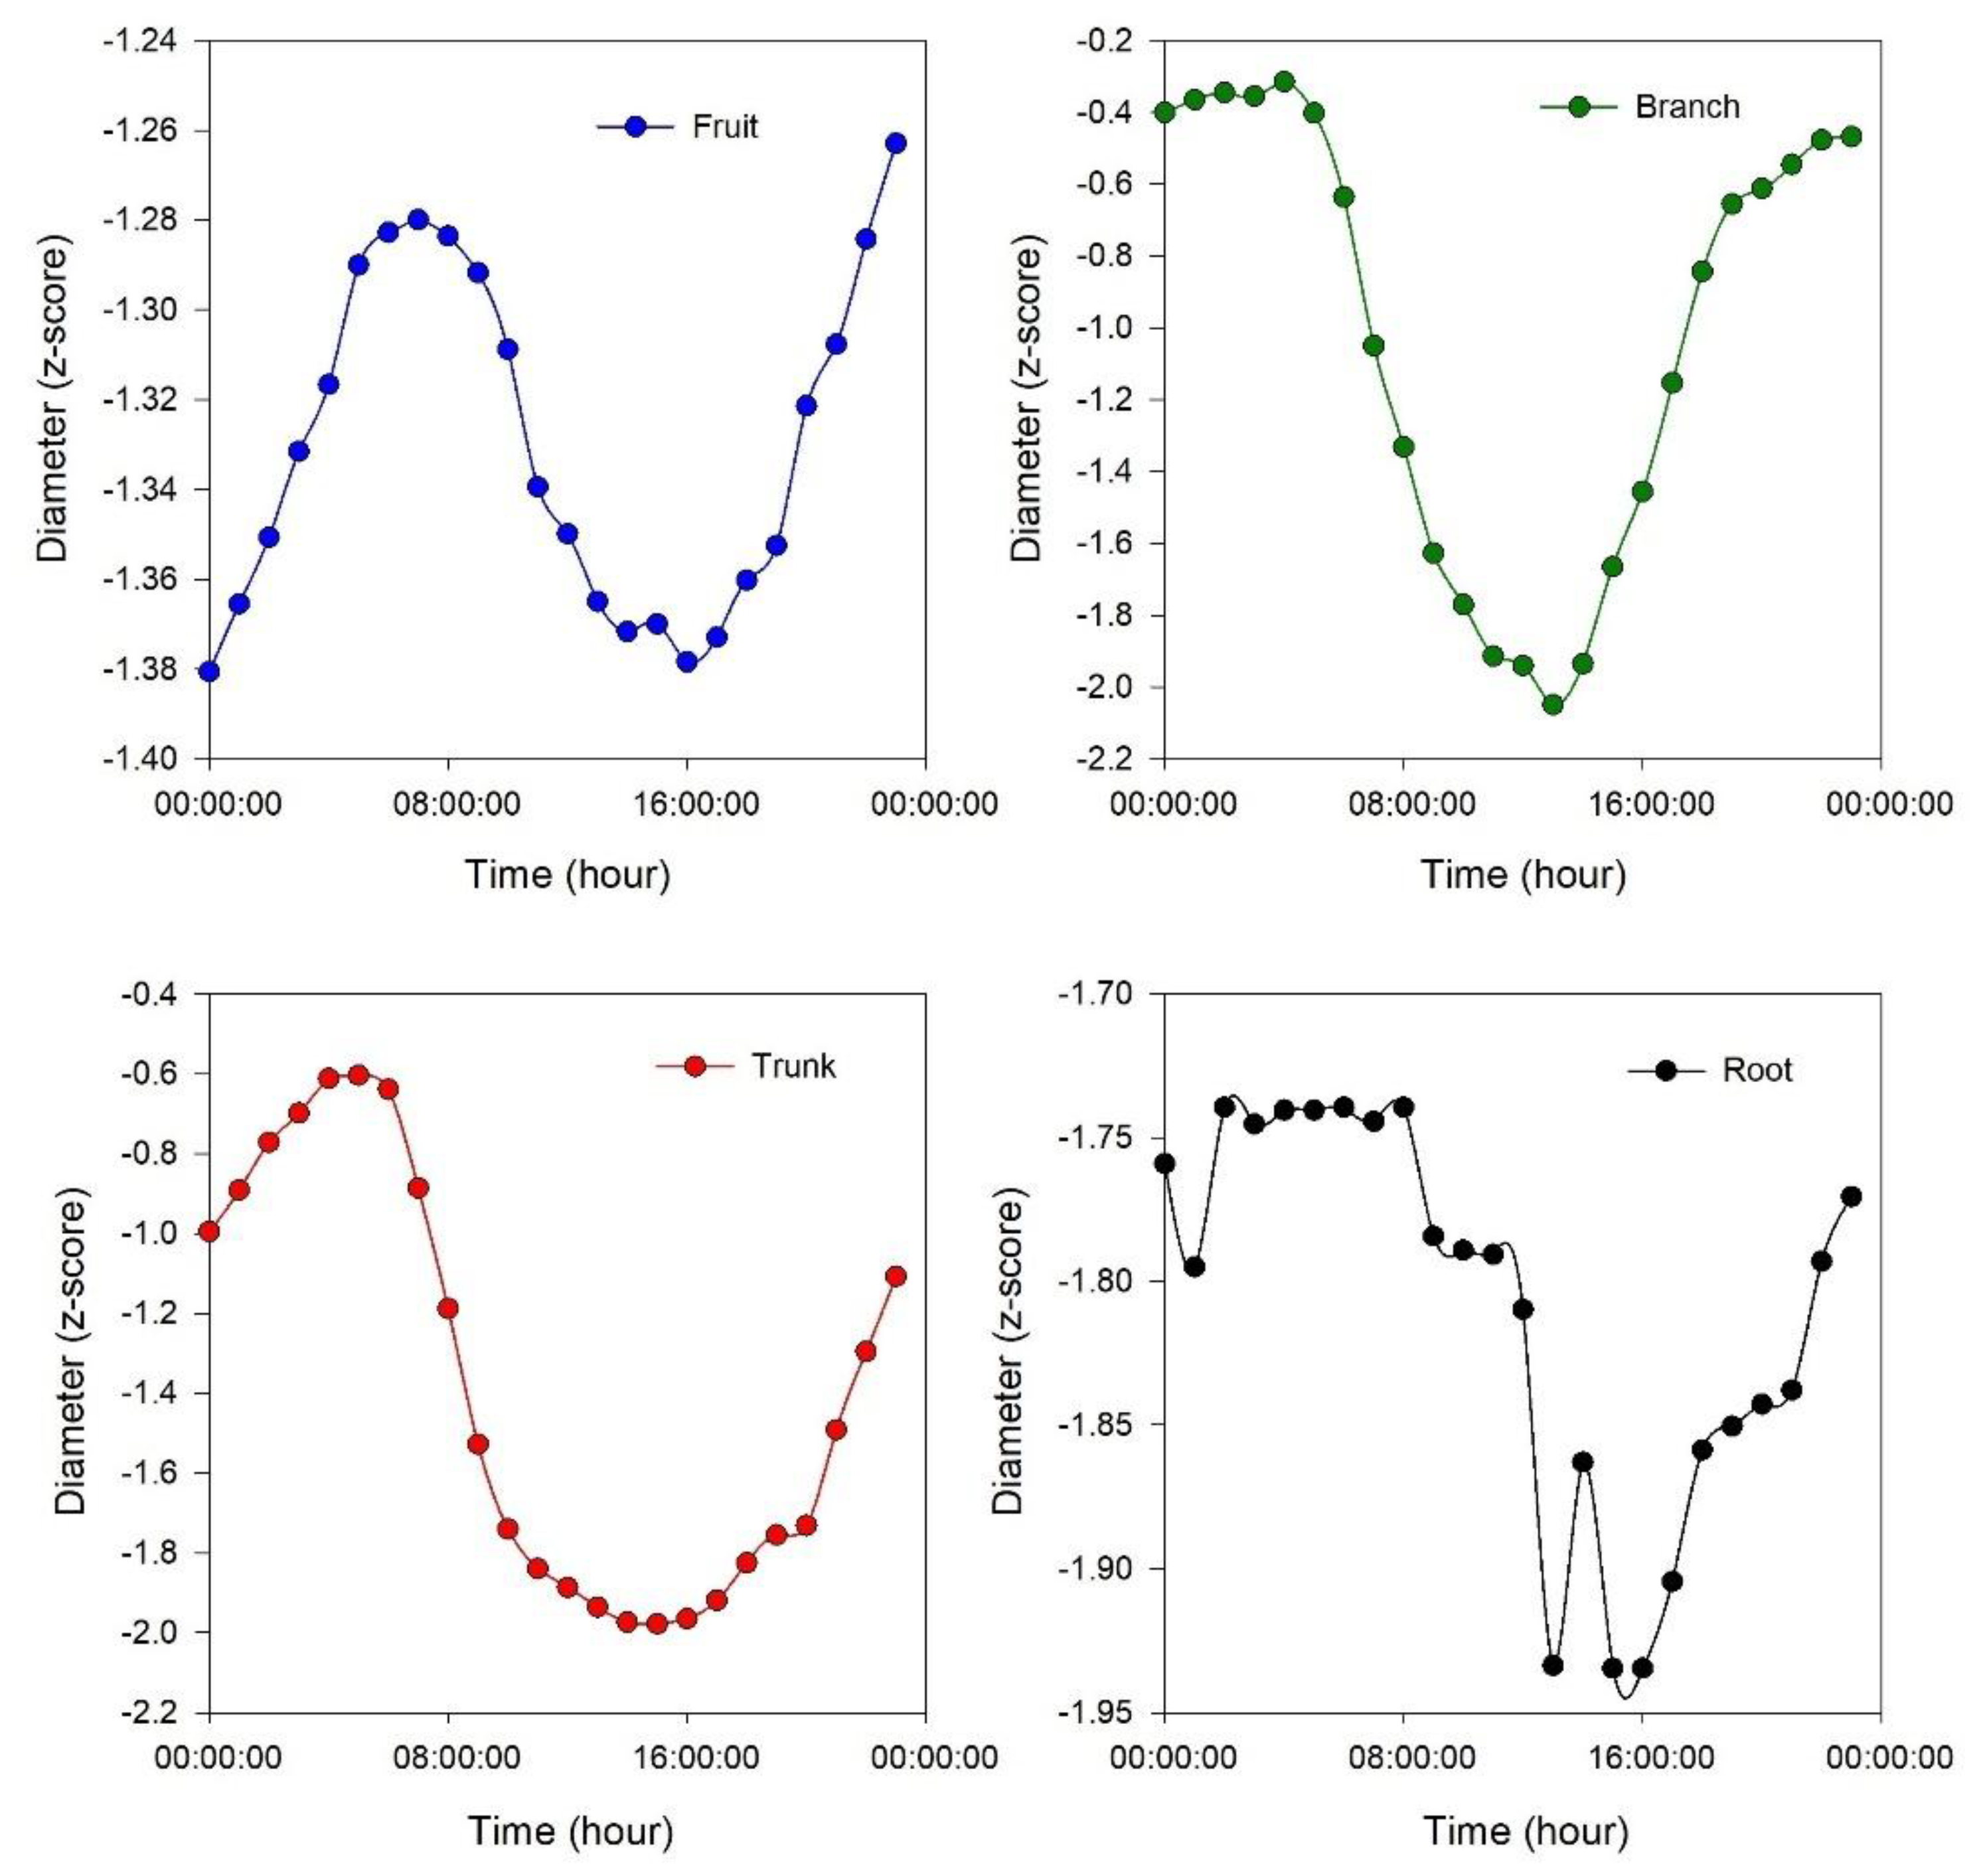
The daily trends of the fruit, branch, and trunk were consistent with the expectations: shrinkage from mid-morning to early afternoon, followed by an expansion from late afternoon to early morning. The highest variation rate was in the branch and could be due to the synergistic effect of water absorption by both fruits and leaves, which created the largest daily fluctuation compared to fruit and trunk. Regarding the daily dynamics of the olive root, there are no previous research studies to compare with our results; however, it could be described as similar to other organs considered (trunk, branch, and fruit) but with higher daily variability in recorded data compared to the other organs. This variability could be influenced by other factors such as soil/root hydraulic [
25], dynamic of wetting and drying [
26], root temperature, and biomass [
27]. Another type of continuous olive root monitoring, without using a dendrometer, was conducted by Villalobos et al. [
28], where they measured diurnal variation in root conductance by combining microtensiometers and sap flow sensors. This approach was based on simultaneous measurements of sap flow and xylem water potential, allowing estimation of temporal variations in root hydraulic conductance in olive trees. It was observed that root hydraulic conductance was proportional to transpiration, with daily variations showing an inverted pattern compared to the diameter measurements in our trial, that is, an increase during the day and a decrease at night, although the actual regulator of these changes was not identified.
It can be hypothesized that the continuous flow of water from root to fruit, affected by VPD, creates similar daily fluctuations in the root and the other organs. Additionally, since the trees used for our experiment did not experience severe water stress (
Table 1), we observed a quick response of the root system to available water [
29], resulting in a visible uniformity in daily diameter fluctuations (shrinkage and expansion) between the root and the other organs.
It is interesting how the shrinkage occurs with a different timeline among the considered organs: first, it occurs in the branch, followed by the trunk and root (simultaneously), and finally in the fruit (
Table S1). This could be due to the water transpiration of the leaves, which affects the branch first and then moves toward the trunk and root. The withdrawal of water from internal storage compartments can contribute to 10–50% of a tree’s daily water usage, depending on factors such as species, ecosystem type, and tree size [
30,
31]. Water storage as a homeostatic mechanism is particularly crucial in olive trees. During peak transpiration, they rely on stored water, which is later replenished, allowing roots to absorb water at moderate rates over an extended period [
31]. In the expansion phase, the branch is again the first organ to react (expand), followed by the trunk and root (simultaneously), and finally the fruit (
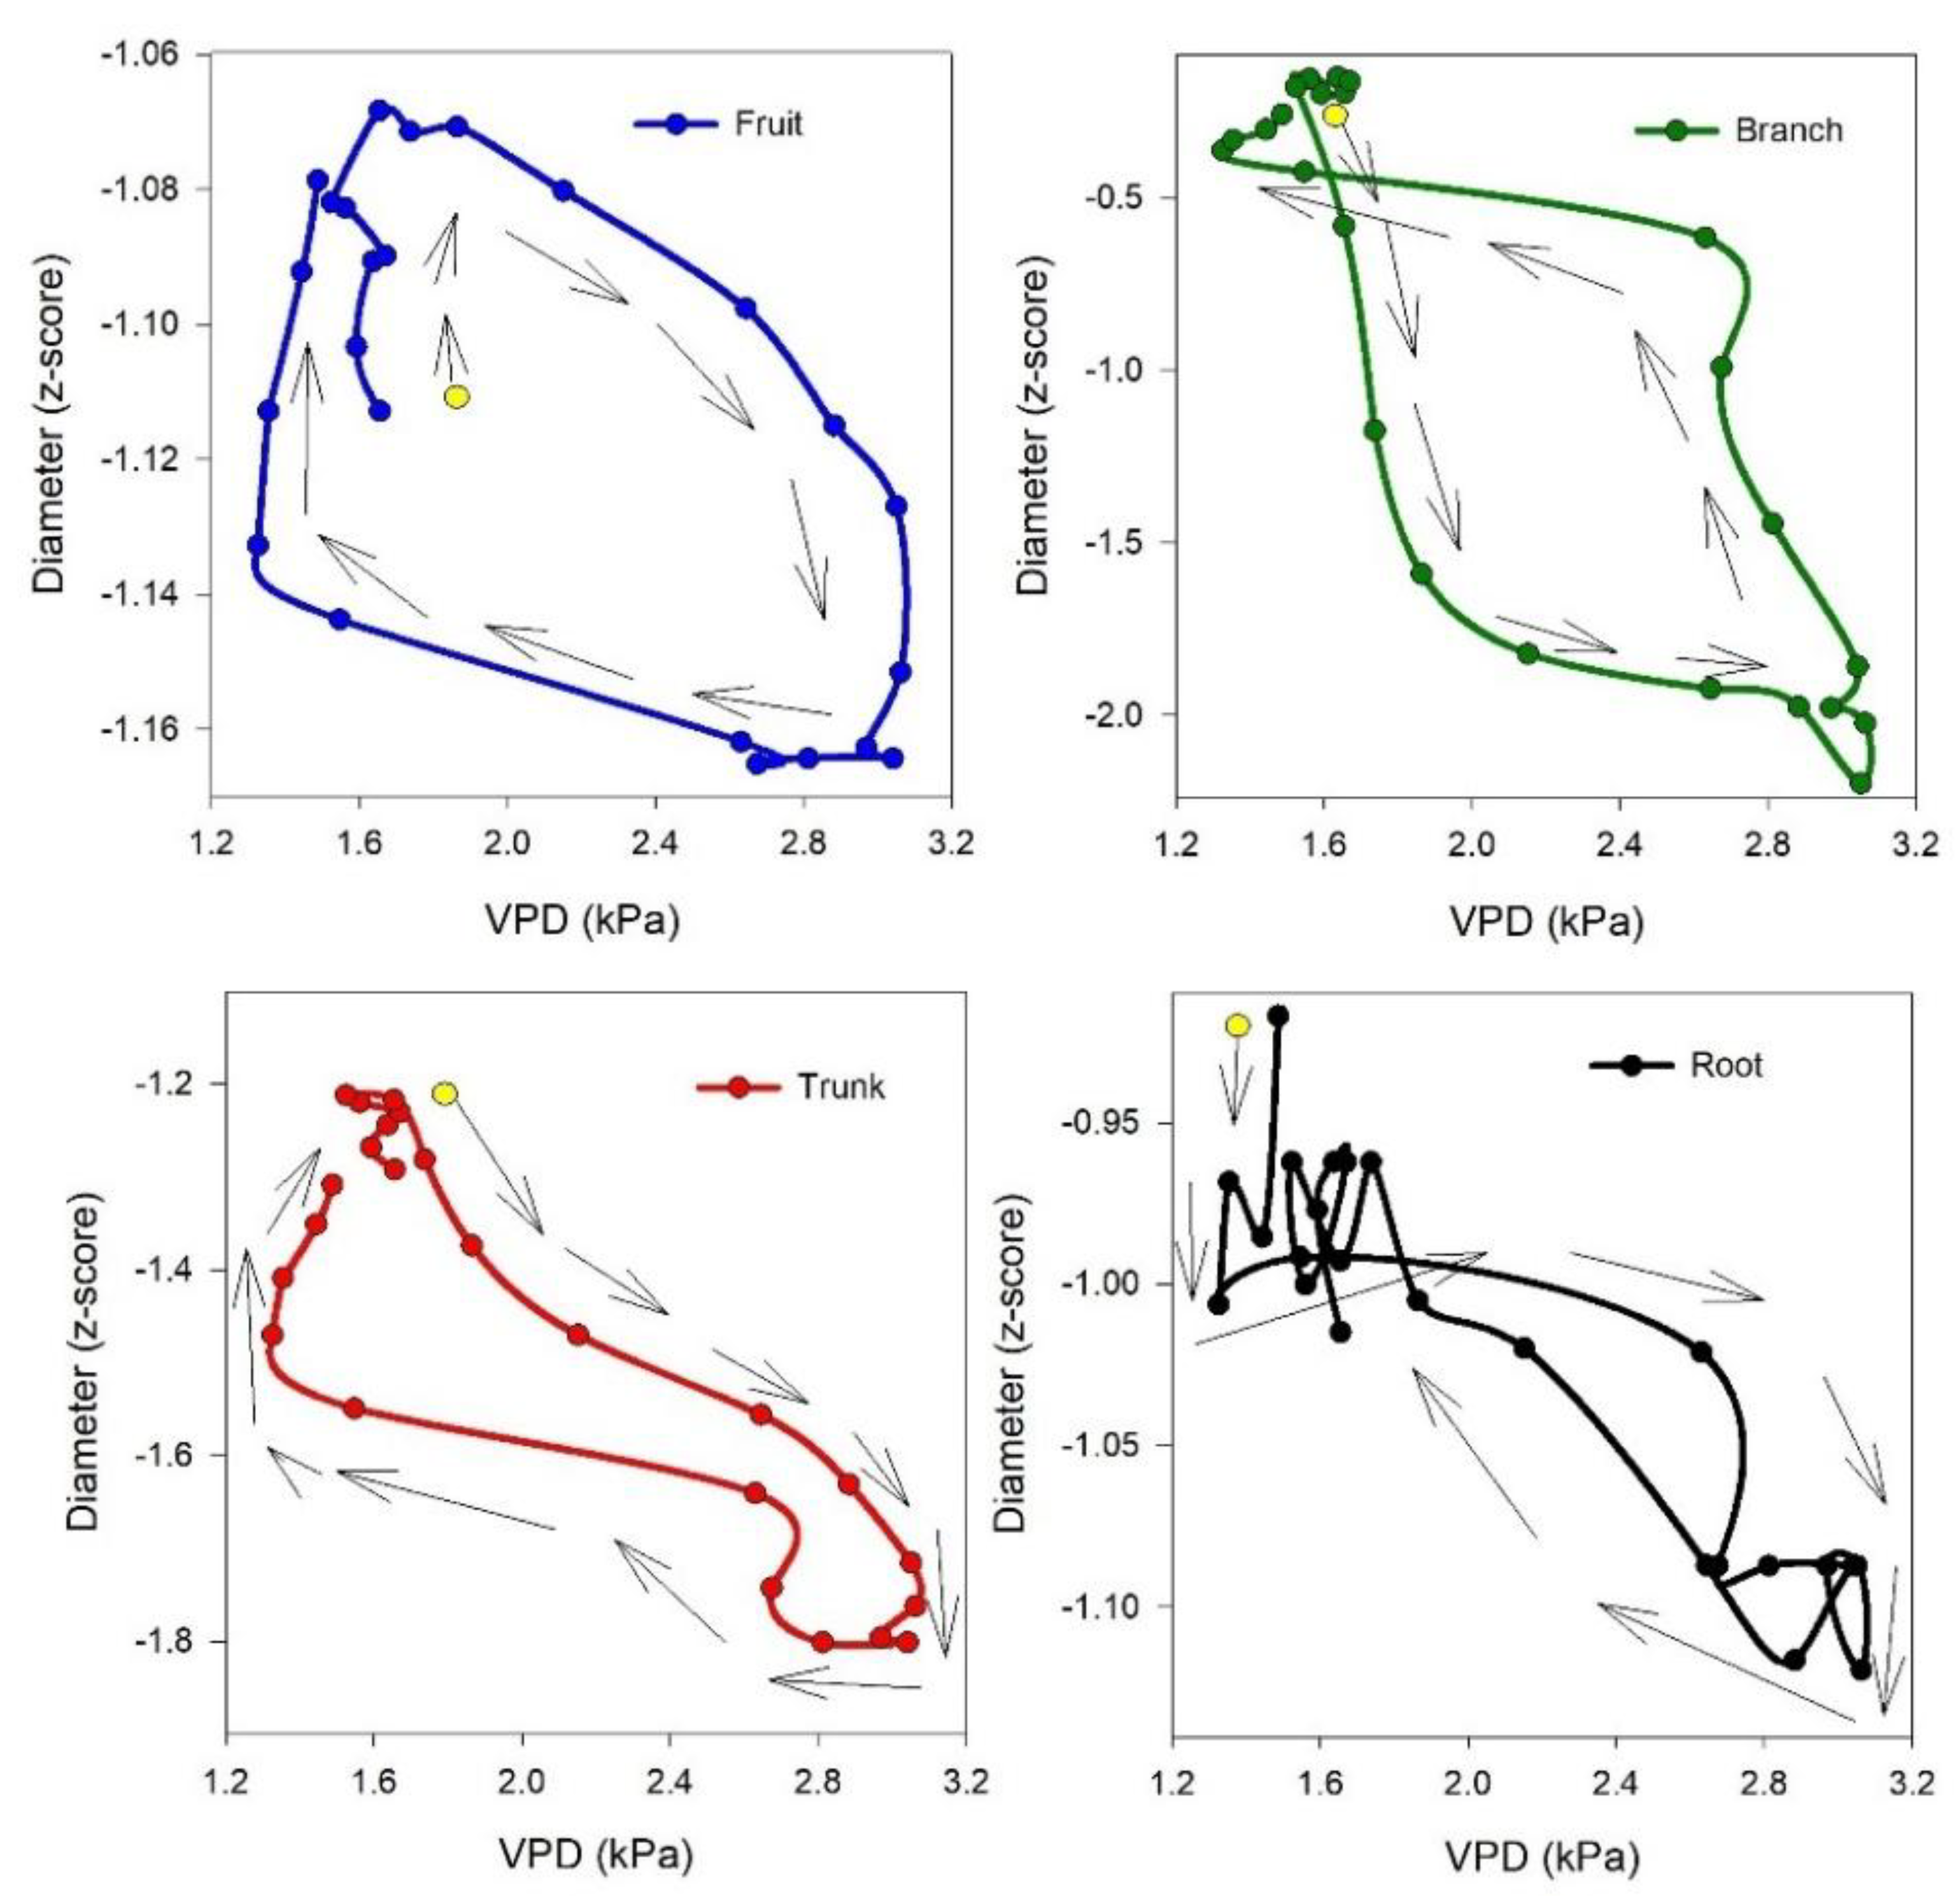
Table S1). These aspects are more evident in
Figure 6, where the best hysteretic curve (loop-like behavior) is observed in the branch versus fruit, showing the highest time lag between the start of shrinkage in the branch (4:00 to 6:00) and fruit (8:00 to 9:00) and the start of expansion in the branch (13:00 to 15:00) and fruit (17:00 to 18:00). Consequently, a more obvious hysteretic pattern is observable, while the mentioned time lags in the trunk versus root are the lowest; therefore, the hysteretic magnitude in root versus trunk is not very clear. The time lag in dehydration and rehydration in different organs could be used as a signal for detecting different levels of water stress or as a time-sensitive, early warning for irrigation management. Interestingly, the time lag in rehydration was described in other fruits, such as nectarines, by Scalisi et al. [
32], who continuously monitored fruit and leaf hydration and explain that it could represent an early warning for water stress not influenced by the fruit development stage.
We could assume that among all the organs studied in this research, considering the initial time of shrinkage and expansion (
Table S1), higher daily fluctuation (
Figure S2) as well different rotational pattern of hysteresis versus VPD (anticlockwise), branch is the most reactive organ, which regulates dehydration and rehydration in tree. In accordance with the findings of Cocozza et al. [
31], we can state that the daily withdrawal of stored water starts from the branches and moves toward the trunk. Meanwhile, this process causes relatively low xylem water potential in the branches, implying a considerable flow of water from the roots to the trunk. This phenomenon also helps explain the absence of correlation between the branch and root, as well as the weak correlation observed between the trunk and root (
Table 3). The only exception was observed during DOY 254 to 267, when the correlation between root and branch reached R
2 = 0.63, and between root and trunk R
2 = 0.93. This pattern was likely driven by two factors: high rainfall and low VPD (
Table S2). The former may have suppressed variation in water availability across different organs, while the latter reflected a reduced evaporative demand. This is consistent with the strong dependency observed between diameter variation and evaporative demand [
31].
The hysteretic pattern is an indirect response of vegetation to diurnal changes in the external environment [
23], with VPD being the major factor affecting the diurnal hysteresis loop [
13,
15]. In our study, among organs, the trunk showed the highest frequency of hysteresis curve appearance versus VPD, followed by the branch. Regarding the relationships of organs with each other, the relationship between trunk and branch showed the highest frequency of hysteresis curve appearance, followed by the branch versus root, and the trunk versus root. This suggests that the trunk and branch are suitable indicators for hysteretic pattern recognition, serving as useful tools for precision tree management. Although in our research the frequency of daily hysteretic pattern of fruit versus VPD was lower compared to the other organs, another study by Khosravi et al. [
5] examined four different olive cultivars under deficit irrigation regime and demonstrated that magnitude of daily hysteresis curve of fruit versus VPD could be used as a non-cultivar-specific index for monitoring water status. It could be mentioned that the low frequency of appearance of the daily hysteretic pattern of fruit versus VPD in ‘Ascolana tenera’ is related to the disappearance of the hysteresis curve, resulting from changes in the daily dynamic of fruit growth (diameter shrinkage and expansion) during the final part of the experiment (DOY 256 to 281) (
Table S1). This change in the daily fruit growth pattern is due to the synergistic effect of two factors: fruit ripening and increased water availability (raising soil moisture). Regarding fruit maturation, Khosravi et al. [
10] demonstrated that olive fruit ripening causes abnormalities and a decrease in the hysteresis pattern of fruit equatorial diameter versus VPD. As for the increase in soil moisture, the main reason was rainfall on DOY 267. Decreasing water stress affects the relative growth rate of the fruit [
33] and leads to a reduction in the magnitude of the hysteresis curve of fruit versus VPD and, in some cases, to the complete disappearance of the hysteresis pattern [
5].
Therefore, it can be expected that this non-cultivar-specific index could be observed among organs with the highest frequency of hysteresis curve appearance versus VPD, such as the trunk. The hysteretic pattern of the olive trunk was also reported by Fernández et al. [
34], who showed a hysteresis curve with varying magnitudes in the relationship between diurnal courses of trunk diameter variation and sap flux. They observed the same trend in trunk diameter variation as we did. Additionally, they mentioned that when using trunk-based indices, factors such as plant age, size, and crop load should be considered. Another study by Moriana et al. [
35] reported similar results regarding trunk variation. Furthermore, they noted that the relationship between trunk-derived indices of maximum daily shrinkage (MDS) and midday stem water potential values of −1.5 MPa or greater (under light water stress conditions, as in our experiment) is linear, with increasing MDS values corresponding to a decrease in stem size. The authors proposed that the reduction in MDS might be caused by decreased transpiration due to the progressive closure of stomata under severe water stress. They concluded that, although there is no direct relationship between MDS and stem diameter in olive trees, the observed response patterns could be explained by the effects of transpiration and soil water deficits on both variables.
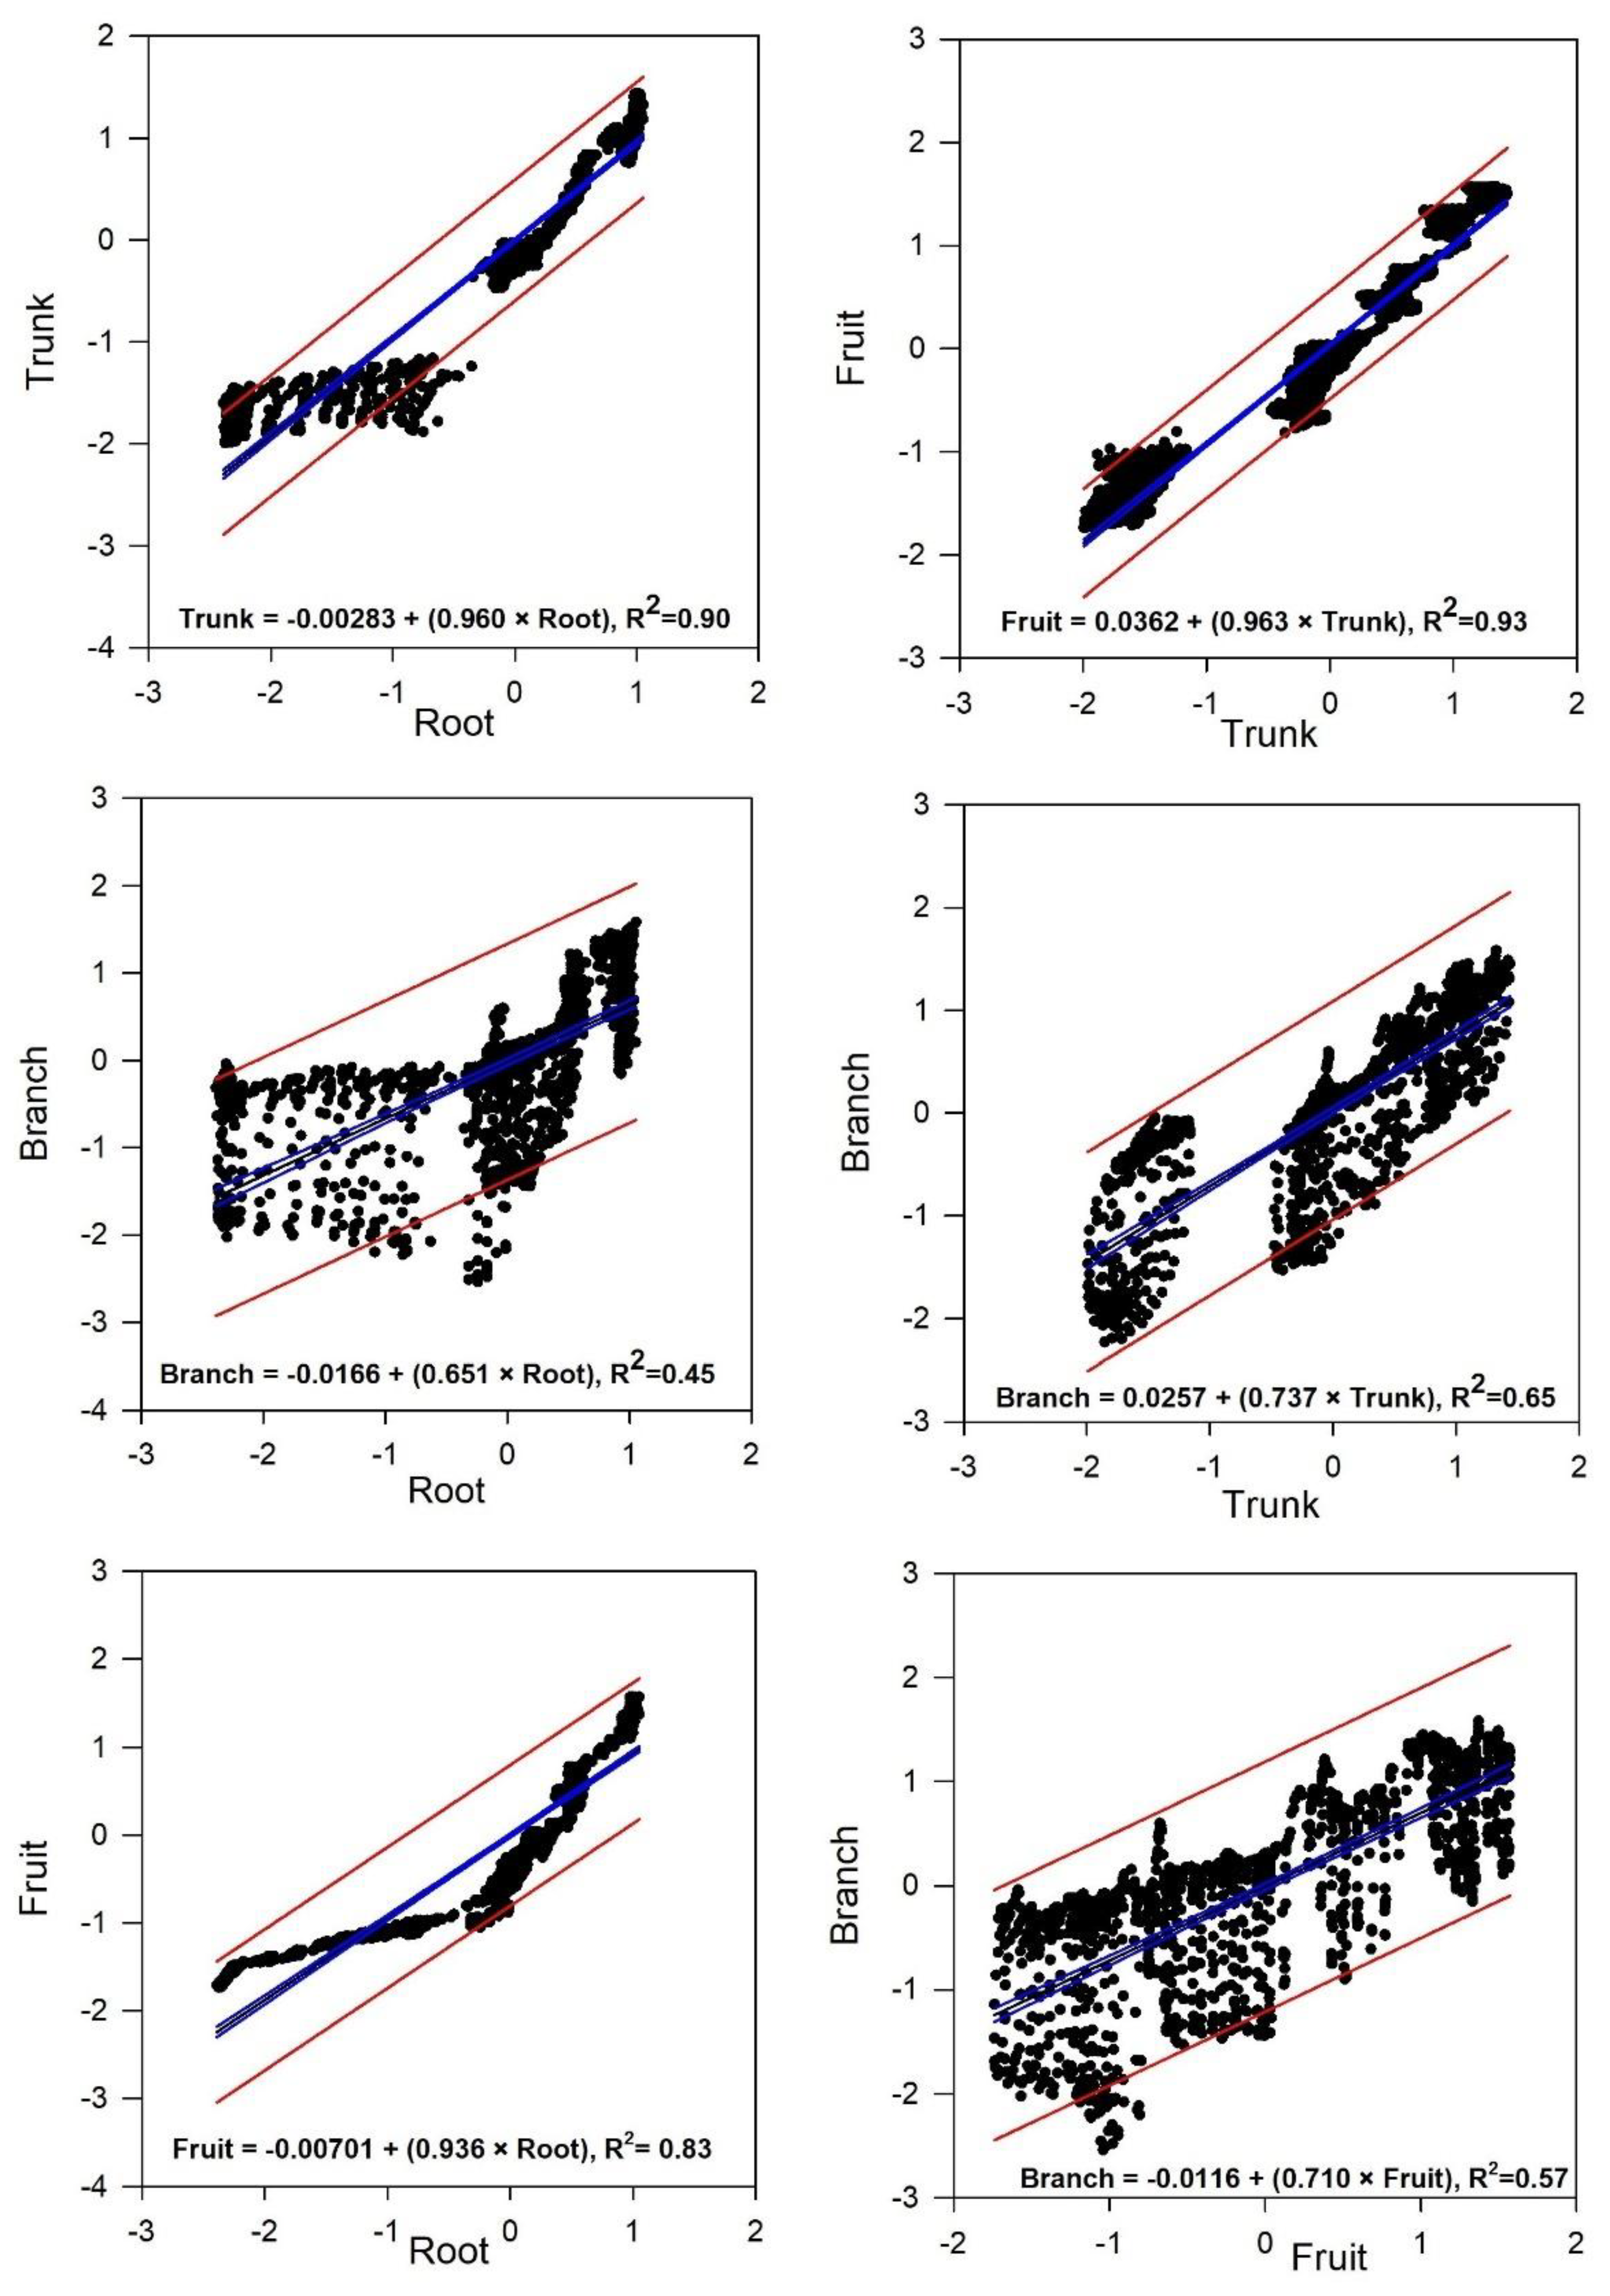
The results of our study showed a good correlation between olive root and fruit in both the long term (entire experiment) and the short term (14-day intervals) (
Table 3 and
Figure 3). This suggests that the root and fruit are well aligned. It suggests that to monitor the flow dynamics within a tree and model plant water relations and time lags in terms of water storage and transport capacities, fruit and root data could be effectively coordinated.
However, with the increasing available water caused by rain in the third time interval (DOY 254 to 267), the correlation between root and trunk increased notably. This could be the result of positive root pressure due to the rising humidity level and, at the same time, a decrease in the average VPD during this time interval (
Table S2). This change in the correlations between parameters throughout the season could be caused by variations in the radial resistance between xylem and bark on a diurnal and seasonal basis, which affects the water flux between these two tissues [
36]. Therefore, trees need to optimize water flow through their tissue compartments and ensure a certain level of coordination between capacitance, vertical water flux in the xylem, transpiration, and radial water movement in the phloem [
31].
5. Conclusions
Our study presents insights into the organ correlations within olive trees, particularly in relation to water storage and transport under mild water stress conditions. The daily shrinkage and expansion patterns of the fruit, branch, trunk, and root followed expected trends, with the branch playing a role to control the process of dehydration and rehydration, likely due to its function in the different leaf and fruit water use. The observed hysteretic patterns, particularly the strong relationship between trunk and branch diameter versus VPD (87.5% of cases; 49 out of 56 for the branch, and 94.3% of cases; 50 out of 53 for the trunk), suggest that these organs are useful indicators for precise water status detection and irrigation management. It was previously reported that monitoring the hysteresis between fruit diameter and VPD in small olive cultivars such as ‘Arbequina’ and ‘Lea’, as well as in medium-sized cultivars like ‘Ascolana Dura’ and ‘Piantone di Falerone’ [
5], could serve as a reliable indicator of water stress. In our study, for large-sized olive cultivar ‘Ascolana tenera’, the hysteresis pattern of fruit versus VPD was observed primarily during the early part of the third stage of fruit growth, with a high frequency of occurrence (78.6% from DOY 226 to 253). After this period, and particularly with the onset of fruit maturation, the pattern appeared only rarely (3.6% from DOY 254 to 281), suggesting a limited diagnostic value beyond the early third stage. Hysteresis patterns during fruit growth seem to be different according to small- and large-sized olive cultivars and dependent on different tissue and cellular processes throughout growth, as previously reported [
37]. The final size of the olive is determined by both the mesocarp and the endocarp, with the mesocarp contributing more. As fruit size increases, the mesocarp-to-endocarp ratio, very important for table olives, also increases due to a proportionally greater expansion of the mesocarp. Differences in fruit size among cultivars are mainly due to variations in the rate of mesocarp cell division after blooming. All cultivars produce most of their cells in the first two months after bloom, with an additional 15–30% formed in the following six months depending on the cultivar (lower and higher values for small- and large-sized olive cultivars, respectively). Mesocarp cell expansion is constant throughout fruit growth and, although it does not directly determine cultivar differences, it accompanies variations in cell division. The significant correlations between root and fruit diameter suggest the potential for coordinated monitoring of plant water relations. Under normal daily patterns of olive fruit growth, which are characterized by shrinkage from mid-morning to early afternoon followed by expansion from late afternoon to early morning (
Figure 4), the correlation between root and fruit could serve as a useful tool for monitoring plant water status. However, as abnormalities in daily fruit growth dynamics increase due to rainfall or the onset of fruit maturation, this correlation becomes less reliable. The findings of our study underscore the importance of considering time lags in organ dehydration and rehydration as priority means of physiological coordination and early signals of water stress, offering a practical tool for optimizing orchard management and irrigation practices. Although there are several challenges associated with the application of continuous monitoring systems in commercial orchards [
4,
11,
38], the advantages they offer in terms of precision irrigation and efficient agricultural water management can overcome many of these limitations. Further research can focus on the application of different levels of water stress and on considering different olive cultivars, as olive species (
Olea europaea L) has a very wide genetic diversity.


 ,
, 


