Article

Expression Analysis of Citrate Metabolism-Related Genes Reveals New Insights into High Citrate Accumulation in a Bingtang Orange Bud Mutant (Citrus sinensis cv. Jinyan)

by
Lingxia Guo
1,2,
Syed Bilal Hussain
3,
Lei Tang
4,
Jian Han
1,2,
Wei Liao
1,2,
Tie Zhou
1,2,
Fei Liu
4,
Congtian Wang
1,2,
Yuanyuan Xu
1,2,* and
Peng Chen
1,2,*
1
Institute of Horticultural Research, Hunan Academy of Agricultural Sciences, Changsha 410125, China
2
Yuelushan Laboratory, Changsha 410125, China
3
School of Agriculture and Food Science, University College Dublin, Dublin 4, D04 V1W8 Dublin, Ireland
4
Bureau of Agriculture and Rural Affairs of Qiyang City, Qiyang 426100, China
*
Authors to whom correspondence should be addressed.
Horticulturae 2025, 11(6), 616; https://doi.org/10.3390/horticulturae11060616
Submission received: 2 May 2025 / Revised: 26 May 2025 / Accepted: 29 May 2025 / Published: 31 May 2025
(This article belongs to the Special Issue Citrus Plant Growth and Fruit Quality)

Abstract

Understanding the molecular regulation of citric acid accumulation in citrus fruits is crucial, as acidity directly influences fruit flavor, consumer preference, and commercial value. Citric acid is the predominant organic acid in citrus, and its levels are shaped by several factors, including genetic and developmental factors. ‘Jinyan’ Bingtang orange (Citrus sinensis cv. Jinyan) is a novel mutant derived from ‘Jinhong’ Bingtang orange (C. sinensis cv. Jinhong) that has a noticeably sour taste. However, the molecular basis of the increased citrate content in ‘Jinyan’ fruits remains unclear. This study compared the organic acid profiles and expression of citric acid metabolism-related genes between ‘Jinyan’ and ‘Jinhong’ fruit juice sacs throughout fruit development. The trend of citric acid content in both cultivars was similar; however, ‘Jinyan’ consistently presented significantly higher levels than ‘Jinhong’ did from 95 to 215 days after flowering (DAF). After 155 DAF, the transcript levels of citrate biosynthesis-related genes (PEPC1, PEPC2, PEPC3, CS1, and CS2) and citrate transport-related genes (V1-E1, V1-E2, V0-a2, V0-d, VHP1, VHP2, and CsPH8) were significantly greater in ‘Jinyan’ than in ‘Jinhong’. In contrast, citrate degradation-related genes (NAD-IDH2 and NAD-IDH3) were expressed at lower levels than in ‘Jinhong’. Notably, the expression patterns of V1-E2 and CsPH8 closely matched the changes in citrate content in both cultivars. These results indicate that, compared with ‘Jinhong’, high citric acid accumulation in the juice sacs of ‘Jinyan’ fruit is likely due to increased citrate synthesis (via upregulated PEPCs and CSs) and increased vacuolar citrate sequestration (via upregulated proton pumps and transporters), coupled with reduced citrate degradation (lower NAD-IDH2/3).

1. Introduction

Fleshy fruits are essential components of the human diet and hold significant commercial value. They contain various organic acids that, together with sugars, shape their characteristic flavors [1,2]. Citric, malic, quinic, and tartaric acids are predominant organic acids in most fruits. In citrus species, citric acid is the principal organic acid and a major determinant of overall fruit acidity, strongly influencing taste and aroma [3,4]. The citric acid concentration varies widely among cultivars, generating a spectrum of flavor profiles that meet diverse consumer preferences [5]. In addition to flavor, citric acid serves as a precursor for the biosynthesis of numerous primary and secondary metabolites [3,6,7]. A better understanding of the genetic and molecular basis of citric acid accumulation is therefore essential for breeding citrus varieties that align with consumer taste preferences and improve marketability.
In citrus juice sac cells, citric acid is synthesized in the mitochondrial tricarboxylic acid (TCA) cycle [8,9]. During glycolytic sucrose degradation, phosphoenolpyruvate carboxylase (PEPC) catalyzes the β-carboxylation of phosphoenolpyruvate (PEP) to form oxaloacetate (OAA), a key intermediate in the TCA cycle [10]. Citrate synthase (CS) then condenses OAA with acetyl-CoA to yield citric acid. Following synthesis, mitochondrial aconitase (myt-ACO) isomerizes citrate into isocitrate, which is subsequently dehydrogenated by isocitrate dehydrogenase (IDH) to form α-ketoglutarate (α-KG) [11]. Partial inhibition of myt-ACO directs citrate into the vacuole via tonoplast-associated proton pumps and inward-rectifying channels [12,13]. Vacuolar citrate transport relies on vacuolar H+-ATPase (V-ATPase, referred to as VHA), vacuolar H+-pyrophosphatase (V-PPase, referred to as VHP), and plasma membrane H+-ATPase (P-type V-ATPase, referred to as PH) [14]. As vacuolar citrate (citrate H2−) accumulates, the tonoplast citrate/H+ transporter (CsCit1) can export citrate H2− to the cytosol to maintain pH homeostasis [15,16]. In the cytosol, citrate may be metabolized by cytosolic aconitase (cyt-ACO) and ATP citrate lyase (ACL). Cyt-ACO and cytosolic NADP-dependent isocitrate dehydrogenase (NADP-IDH) convert citric acid to isocitrate and then to α-KG [9,17]. ACL cleaves citrate into OAA and acetyl-CoA, which are involved in secondary metabolism and fatty acid elongation [3].
Fruit organic acid content ultimately reflects the balance of synthesis, degradation, and storage [3,18]. ‘Jinyan’ Bingtang orange (Citrus sinensis) is a novel citrus variety derived from bud mutations of ‘Jinhong’ Bingtang orange (developed by the Horticultural Research Institute of the Hunan Academy of Agricultural Sciences, Changsha, China). ‘Jinyan’ has a unique exocarp morphology characterized by irregular longitudinal ridges, distinguishing it from commercial Bingtang cultivars and highlighting its market potential. Notably, ‘Jinyan’ accumulates approximately twice the citric acid content of its parent ‘Jinhong’, but the molecular basis for this difference remains unknown. Here, we compared the organic acid profiles and expression of citrate metabolism-related genes in ‘Jinyan’ and ‘Jinhong’ fruits. This analysis not only elucidates the molecular mechanisms driving citrate accumulation in ‘Jinyan’ but also provides a valuable framework for citrus breeders aiming to manipulate acidity for improved fruit flavor and market differentiation.

2. Materials and Methods

2.1. Plant Materials

Eight-year-old healthy ‘Jinhong’ Bingtang orange (C. sinensis cv. Jinhong) and its bud mutant ‘Jinyan’ plants grafted onto trifoliate orange (Poncirus trifoliata) were selected from the Citrus Germplasm Resource Center, Hunan Academy of Agricultural Sciences, Changsha, China. For each cultivar, ten to fifteen uniform fruits were randomly harvested from the outer canopy at 95, 125, 155, 185, and 215 days after flowering (DAF). After harvesting, the fruit juice sacs were separated, pooled per sample, ground in liquid nitrogen, and stored at −80 °C for biochemical and gene expression analysis.

2.2. Physical and Inclusion Indicators

The transverse diameter and longitudinal diameter of the fruit were determined with a digital Vernier caliper. The fruit shape index was calculated as the longitudinal diameter/transverse diameter. Fruit weight was recorded on a weighing balance. Peel color was measured with a Minolta CR-400 colorimeter (Tokyo Tech, Tokyo, Japan) using the L*, a*, and b* system (L*: lightness; a*: green–red; b*: blue–yellow). The color index (CCI) was calculated as 1000 × a*/(L* × b*). Higher values indicate more intense red hues [19]. Total soluble solids (TSS, °Brix) were measured with a PAL-1 pocket refractometer (ATAGO, Tokyo, Japan). The titratable acidity (TA, %) was determined by titrating the juice samples against 0.1 mol/L NaOH with 1% phenolphthalein as an indicator. All the measurements were performed in triplicate.

2.3. Measurement of Soluble Sugars and Organic Acids

Frozen granules from each sample were mixed with liquid N2 to obtain a fine powder. An approximately 3 g fine powder sample was used for the determination of sucrose, glucose, fructose, citric acid, malic acid, and quinic acid contents via gas chromatography, according to the methods of Bartolozzi et al. [20], with minor modifications. The samples were extracted in 15 mL of 80% methanol (v/v). The mixture was incubated in a water bath at 70 °C for approximately 30 min, followed by ultrasonic treatment for 45 min, and then centrifuged at 3000 rpm for 20 min. The supernatant was collected into a 50 mL round-bottom flask and the above extraction procedures were repeated twice. Subsequently, 1 mL of internal standard solution (2.5% methyl-α-D-glucopyranoside, 2.5% phenyl-β-D-glucopyranoside, and 10% acetone) was added, and the final volume was adjusted to the required volume with 80% methanol. The solution was mixed thoroughly, and a 1.5 mL aliquot of the mixture was transferred to a 2 mL Eppendorf tube, followed by centrifugation at 12,000 rpm for 30 min. After centrifugation, a 0.5 mL aliquot of the supernatant was sampled into a new 2 mL Eppendorf tube and evaporated at 60 °C for approximately 2 h. The residue was dissolved in 0.8 mL of a pyridine solution containing hydroxylamine hydrochloride at a concentration of 20 mg/mL. This solution was then subjected to incubation at 75 °C for 1 h, after which it was allowed to cool to room temperature. Subsequently, 0.4 mL of hexamethyldisilazane and 0.2 mL of trimethylchlorosilane were introduced into the mixture, and the resulting mixture was incubated at 70 °C for 2 h. The samples were left overnight at room temperature. The samples were subsequently centrifuged at 12,000 rpm for 30 min. The resulting supernatant was filtered through a 0.22 µm filter and analyzed via gas chromatography using an Agilent 7890B gas chromatograph (Agilent, Santa Clara, CA, USA) with a flame ionization detector.
Separation was achieved using a nonpolar HP-5 MS phenyl-methyl-siloxane column (30.0 m length × 0.32 mm internal diameter, Agilent, Santa Clara, CA, USA) with a film thickness of 0.25 µm. The temperatures of the front inlet and the detector were set at 270 °C and 300 °C, respectively. The flow rates for H2, N2, and air were adjusted to 25, 30, and 400 mL/min, respectively. A sample volume of 1 µL was injected with a split ratio of 30:1. The temperature program commenced at 130 °C, increasing to 198 °C at a rate of 6 °C/min, then to 205 °C at 0.5 °C/min, and finally to 280 °C at 20 °C/min, where it was held for 4 min. The contents of soluble sugars and organic acids were quantified using standard curves, and all the standards were procured from Sigma (St. Louis, MO, USA).

2.4. RNA Extraction and Quantitative Real-Time PCR (qRT-PCR)

Total RNA was isolated from juice sac powder utilizing a plant column RNA extraction kit (Sangon Biotech Company, Shanghai, China). First-strand cDNA was synthesized from 1 µg of total RNA through the use of a Primer Script RT Reagent Kit with gDNA Eraser (Takara, Dalian, China). qRT-PCR was carried out on a Roche Light Cycler 480 Real-Time System (Roche, Basel, Switzerland) in accordance with the manufacturer’s instructions. The primers for genes associated with citrate metabolism were obtained from Guo et al. [21] (see Table S1). The reaction mixture, with a total volume of 10 µL, consisted of 5 µL of SYBR Premix Ex Taq (TaKaRa, Dalian, China), 1 µL cDNA, 1 µM of gene-specific primers, and 3 µL of double-distilled water (ddH2O). The qRT-PCR analysis was performed with three biological replicates, and each biological replicate included three technical replicates. The thermal cycling conditions included an initial incubation step at 50 °C for 2 min and 95 °C for 10 min. This was followed by 40 cycles consisting of denaturation at 95 °C for 15 s, annealing at 60 °C for 15 s, and extension at 72 °C for 20 s. Gene expression levels were calculated by the 2−∆∆Ct method [22], with an internal reference gene (Actin, gene sequence ID: XM_006464503).

2.5. Statistical Analysis

The data were compiled in Excel and analyzed by ANOVA with Duncan’s multiple range test (SAS Institute, Cary, NC, USA) to assess significance (p < 0.05). The data are presented as the means ± standard errors of three or more.

3. Results

3.1. Fruit Quality Characteristics of ‘Jinhong’ and ‘Jinyan’ Bingtang Orange

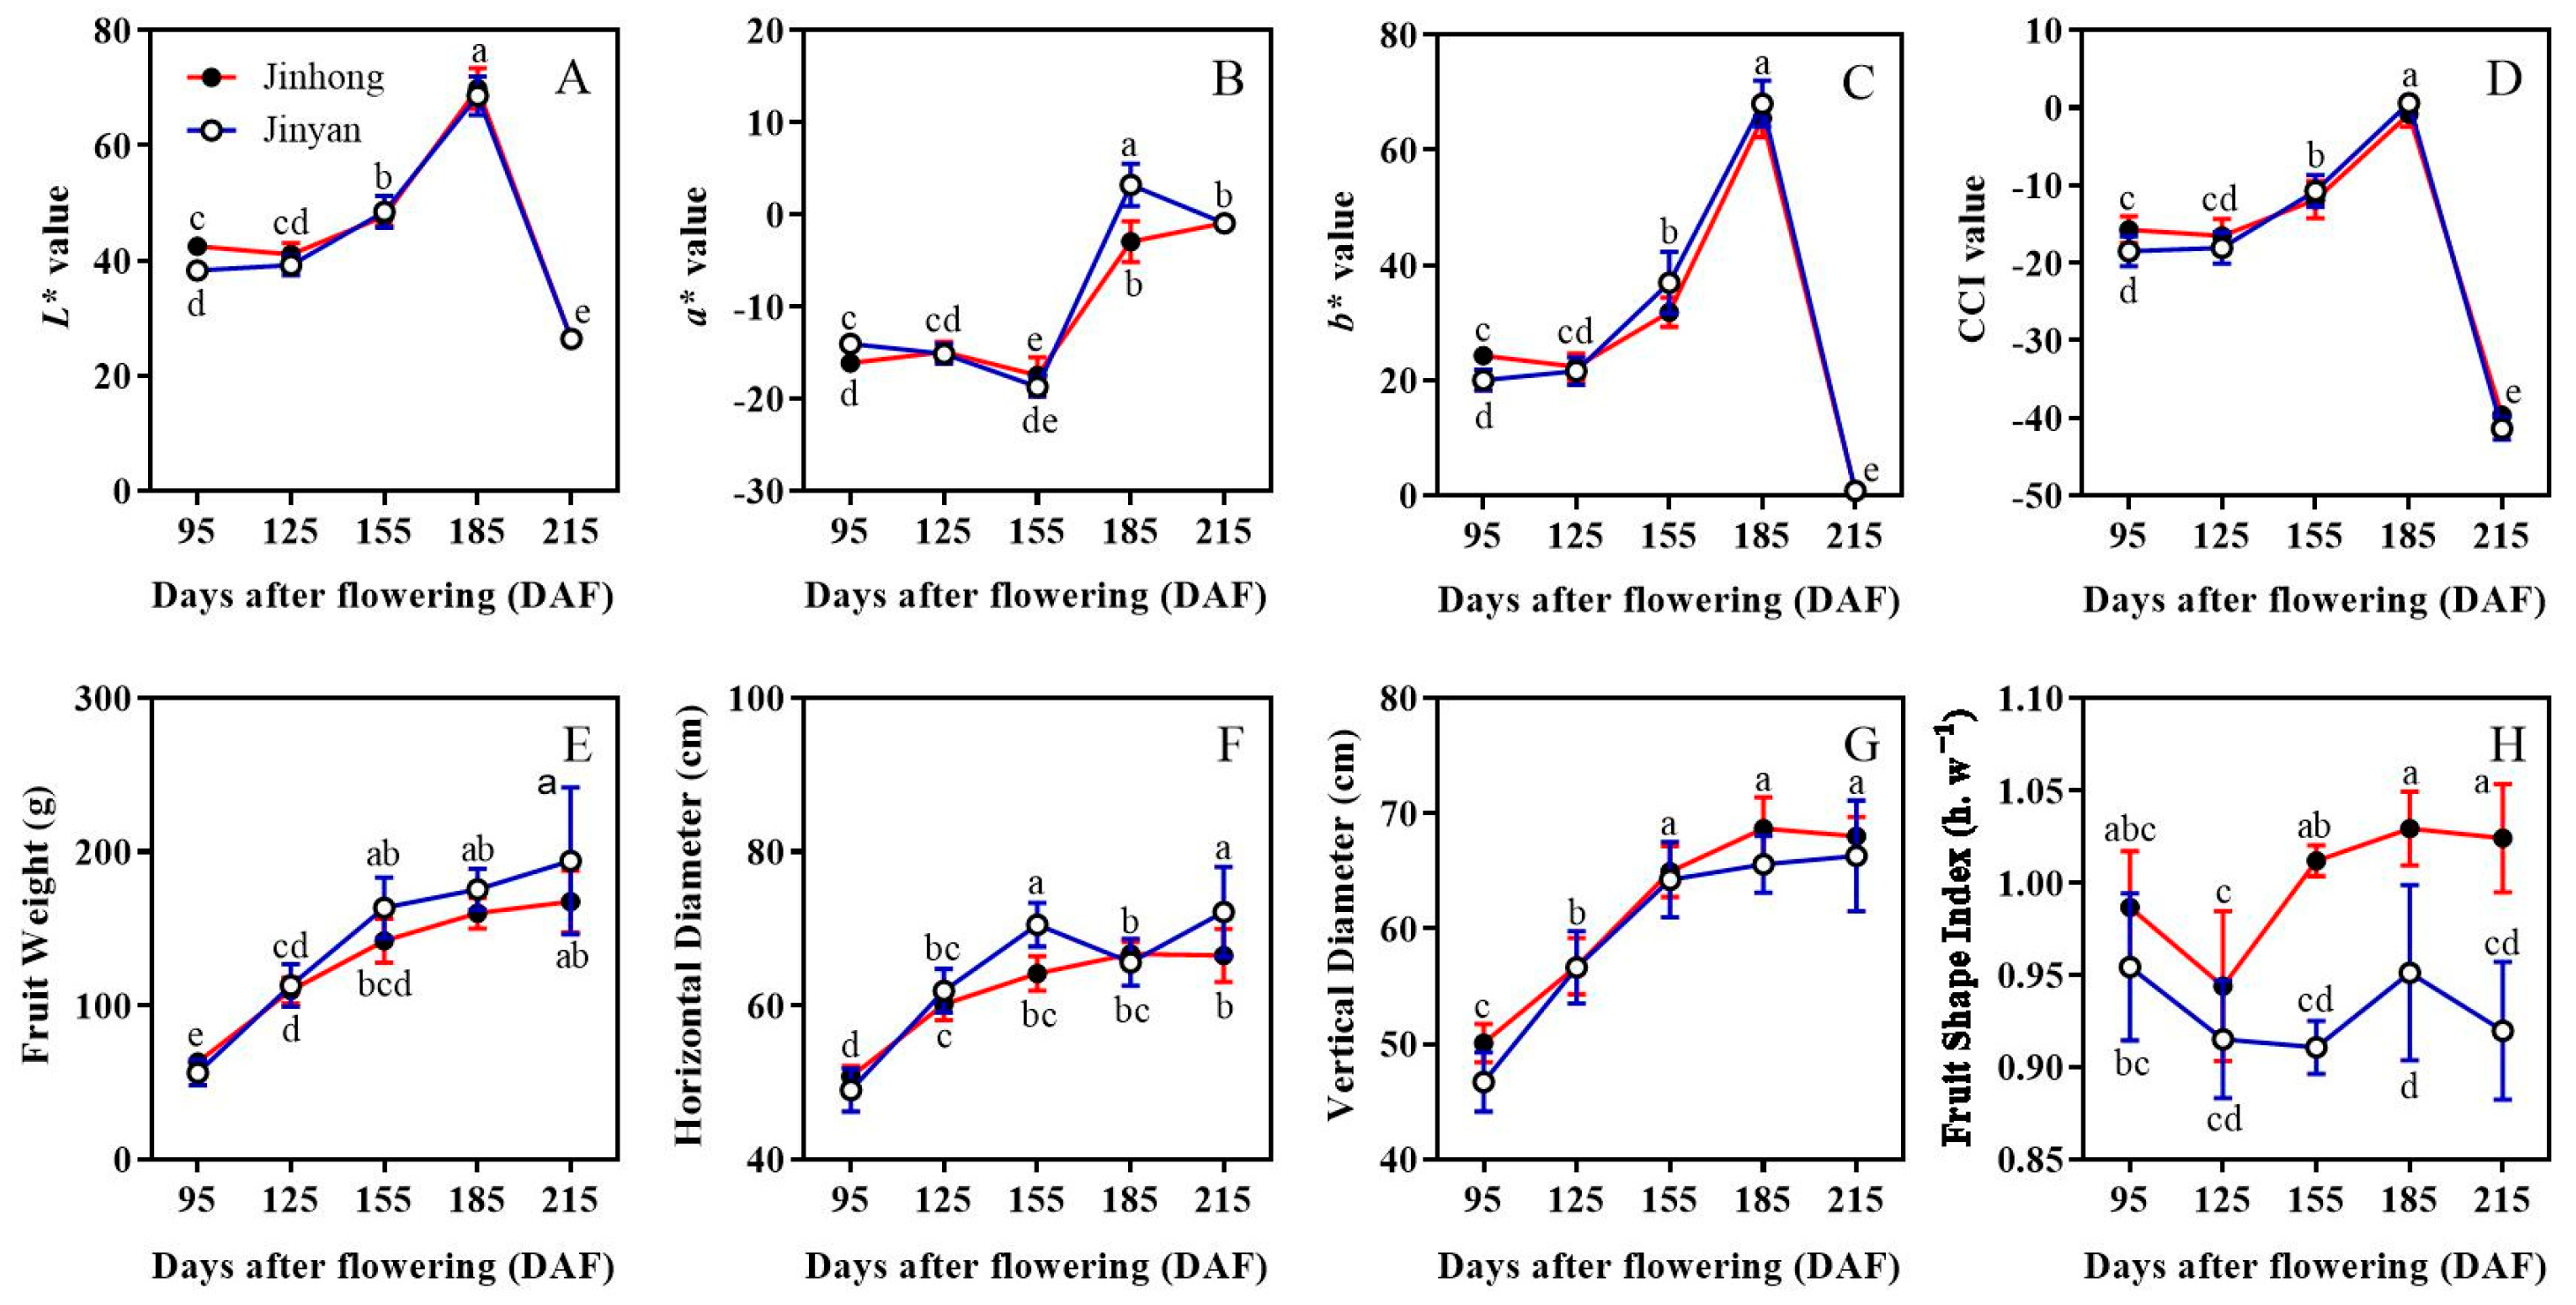
The physical indices were measured at all experimental intervals for ‘Jinhong’ and ‘Jinyan’ fruits from 95 DAF (immature stage) to 215 DAF (fully ripened stage) (Figure 1). Visually, ‘Jinhong’ fruits had smooth peels, whereas ‘Jinyan’ fruits developed multiple longitudinally irregularly arranged ridge-like protrusions; the peel color of both cultivars turned uniformly orange during ripening (Figure 1). At 95 DAF, ‘Jinyan’ had a significantly lower b* (yellow–blue) value and lower CCI but a significantly higher a* (red–green) value than ‘Jinhong’ did (Figure 1B–D). This trend continued at 185 DAF, as ‘Jinyan’ remained redder (higher a* value) than ‘Jinhong’ did. In the other stages, the differences in peel color were not significant (Figure 1A–D).
Fruit weight and vertical (longitudinal) diameter were similar between the two cultivars throughout development (Figure 1E,G). In the late stage of fruit development, ‘Jinyan’ fruits had a significantly larger horizontal (transverse) diameter than ‘Jinhong’ fruits did (Figure 1F). The fruit shape index (vertical/horizontal diameter) was 1.02 for ‘Jinhong’ (nearly spherical) and 0.92 for ‘Jinyan’ (slightly flattened) (Figure 1H).
Compared with ‘Jinhong’ fruits, ‘Jinyan’ fruits presented greater titratable acidity from 125 DAF onward (Figure 2A). We detected three organic acids (citric, malic, and quinic) in the juice sacs of both cultivars (Figure 2B–D). The citric acid content increased from 95 to 125 DAF and then decreased in both cultivars but was significantly greater in ‘Jinyan’ than in ‘Jinhong’ at all stages (Figure 2B). Malic acid levels peaked at 185 DAF in both cultivars and were consistently greater in ‘Jinyan’ throughout development (Figure 2C). The quinic acid content declined steadily in both cultivars, with no significant difference between them (Figure 2D).
The total soluble solids (TSS) content was significantly greater in ‘Jinyan’ than in ‘Jinhong’ from 155 DAF onward (Figure S1A). The sucrose content in both cultivars peaked at 155 DAF and then decreased; except at 125 DAF, ‘Jinyan’ had significantly more sucrose than ‘Jinhong’ did (Figure S1B). The glucose and fructose contents increased similarly in both cultivars from 95 to 155 DAF. After 185 DAF, ‘Jinyan’ had significantly lower glucose and fructose contents than ‘Jinhong’ did (Figure S1C,D).

3.2. Comparative Analysis of Citrate Biosynthesis-Related Genes in Developing Juice Sacs

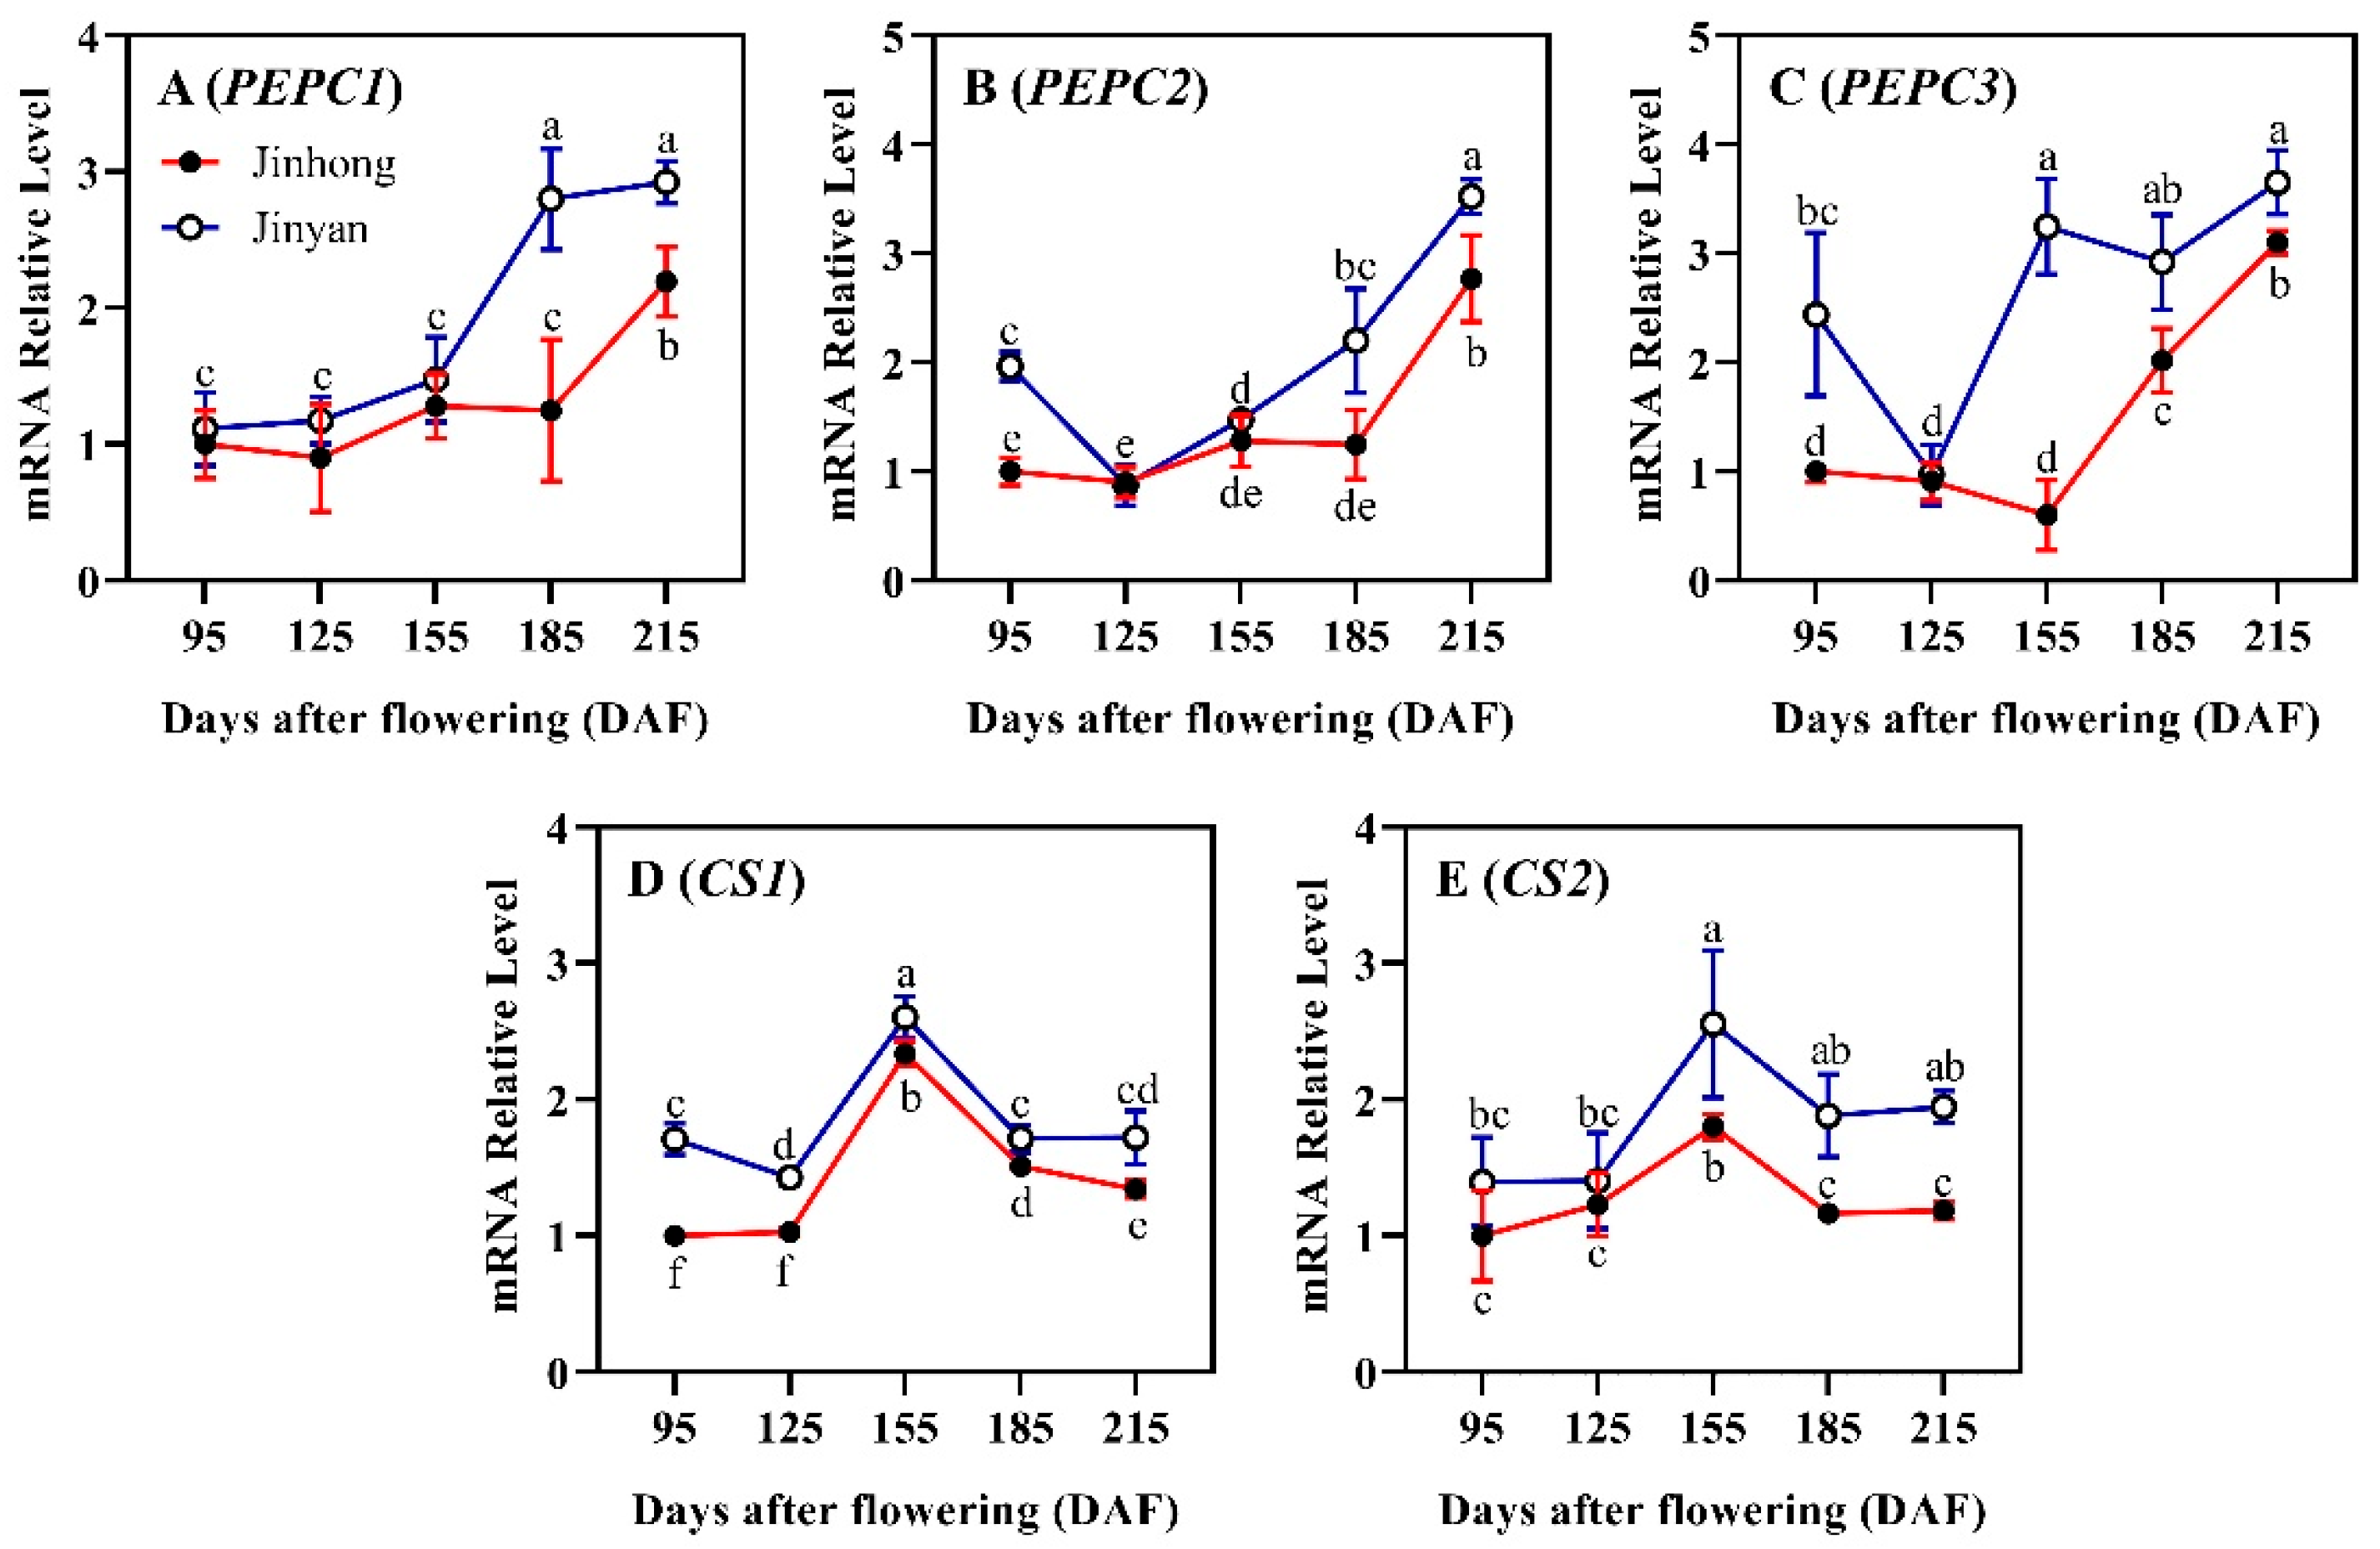
We examined the expression of the citrate synthesis genes PEPC and CS in developing juice sacs (Figure 3). The PEPC1 transcript level remained unchanged from 95 to 155 DAF in both cultivars. After 155 DAF, PEPC1 expression increased sharply in ‘Jinyan’ through 215 DAF, whereas in ‘Jinhong’, it increased only from 185 to 215 DAF (Figure 3A). Moreover, PEPC1 transcript levels were significantly higher in ‘Jinyan’ than in ‘Jinhong’ at 185 and 215 DAF. The PEPC2 transcript level in ‘Jinyan’ declined significantly from 95 to 125 DAF and then increased to 215 DAF. In contrast, ‘Jinhong’ presented stable PEPC2 levels from 95 to 185 DAF, with an increase only at 215 DAF (Figure 3B). Overall, ‘Jinyan’ had a significantly more abundant PEPC2 transcript level than ‘Jinhong’ did at 95, 185, and 215 DAF. PEPC3 showed a similar pattern: it was significantly more abundant in ‘Jinyan’ than in ‘Jinhong’ at 95, 155, 185, and 215 DAF (Figure 3C).
The CS1 and CS2 transcript profiles were similar in both cultivars, increasing to a peak at 155 DAF and then declining. Nevertheless, ‘Jinyan’ maintained higher levels than did ‘Jinhong’ at every stage for both CS1 and CS2. In particular, CS1 was consistently elevated in ‘Jinyan’ throughout development, and CS2 was significantly greater in ‘Jinyan’ at 155 DAF (Figure 3D,E). These results indicate that ‘Jinyan’ has increased expression of citrate synthesis genes.

3.3. Comparative Analysis of Citrate Transport-Related Genes in Developing Juice Sacs

The gene expression profiles encoding vacuolar H+-ATPase (VHA), vacuolar H+-PPase (VHP), P-type V-ATPase (PH), and CsCit1 were compared between ‘Jinhong’ and ‘Jinyan’. The VHA consists of a peripheral V1 domain and a membrane-integral V0 domain. VHA contains 13 subunits (V1-A, V1-B, V1-C, V1-D, V1-E, V1-F, V1-G, and V1-H for the V1 domain and V0-a, V0-c, V0-c″, V0-d, and V0-e for the V0 domain).
V1-A transcripts in ‘Jinyan’ increased from 125 to 155 DAF, remained constant at 185 DAF, and then decreased by 215 DAF. In ‘Jinhong’, V1-A rose only from 125 to 155 DAF and then remained constant (Figure 4A). ‘Jinyan’ had a significantly greater V1-A at 155 and 185 DAF. V1-B in both cultivars rose at 125–155 DAF, decreased at 155–185 DAF, and then rose again to 215 DAF (Figure 4B). ‘Jinyan’ presented a significantly greater V1-B at 95, 155, and 215 DAF. V1-C transcripts in ‘Jinhong’ increased at 95–155 DAF and then declined by 215 DAF; in ‘Jinyan’, V1-C showed an increasing–decreasing–increasing pattern from 125 to 215 DAF (Figure 4C). V1-D in ‘Jinhong’ rose at 95–155 DAF and again at 185–215 DAF, whereas in ‘Jinyan’, it fell at 95–155 DAF and then rose to 215 DAF. V1-D was greater in ‘Jinyan’ at 95, 125, and 215 DAF (Figure 4D).
V1-E1 and V1-E2 presented different expression profiles in ‘Jinhong’ and ‘Jinyan’ during fruit development. The V1-E1 transcript levels increased in both cultivars up to 155 DAF and then remained the same. However, ‘Jinyan’ had higher V1-E1 transcript levels than did ‘Jinhong’ from 155 to 215 DAF (Figure 4E). The V1-E2 transcript level significantly increased from 95 to 125 DAF in both cultivars; thereafter, it decreased to 155 DAF in ‘Jinhong’ but remained high in ‘Jinyan’ through 215 DAF. ‘Jinyan’ had higher V1-E2 transcript levels at all stages except 95 DAF (Figure 4F). The transcript levels of V1-F1 increased in ‘Jinyan’ from 95 to 155 DAF, decreased at 185 DAF, and then increased to 215 DAF; in ‘Jinhong’, it increased at 125–155 DAF and then plateaued (Figure 4G). The transcript level of V1-F2 was greater in ‘Jinhong’ at 95 DAF than in ‘Jinyan’ at 185 and 215 DAF (Figure 4H). The V1-G transcript level tended to increase throughout fruit development in both cultivars; it was relatively high in ‘Jinyan’ at 155 DAF but relatively high in ‘Jinhong’ at 215 DAF (Figure 4I). The V1-H1 transcript level was significantly greater in ‘Jinyan’ than in ‘Jinhong’ at 95, 185, and 215 DAF (Figure 4J). The V1-H2 transcript level tended to increase from 125 to 185 DAF in both cultivars, with significantly greater transcript levels in ‘Jinyan’ (Figure 4K).
The V0-a1 transcript level gradually increased in both cultivars during fruit development; the V0-a1 transcript level was significantly greater in ‘Jinyan’ at 125 and 155 DAF (Figure 4L). The V0-a2 transcript level significantly increased in ‘Jinhong’ from 125 to 185 DAF, whereas in ‘Jinyan’, it significantly increased from 155 to 185 DAF and then declined until 215 DAF. In addition, the V0-a2 transcript level was significantly greater in ‘Jinyan’ than in ‘Jinhong’ at all stages except 95 DAF (Figure 4M). The V0-c1 transcript level presented a similar expression profile to that of V0-a1 in both cultivars during fruit development (Figure 4N). The V0-c2 transcript level increased in both cultivars during fruit development and was significantly greater in ‘Jinyan’ than in ‘Jinhong’ at 215 DAF (Figure 4O). The V0-c3 transcript levels were significantly greater in ‘Jinyan’ than in ‘Jinhong’ at 95 DAF but decreased at 185 and 215 DAF (Figure 4P). The V0-c4 transcript levels significantly differed between both cultivars at 155 and 215 DAF. Specifically, the transcript level was greater in ‘Jinhong’ at 155 DAF but greater in ‘Jinyan’ at 215 DAF (Figure 4Q). The V0-c″ transcript level fluctuated in both cultivars during fruit development. The ‘Jinhong’ cultivar presented greater transcript levels at 95 and 185 DAF, whereas the ‘Jinyan’ cultivar presented greater transcript levels at 155 and 215 DAF (Figure 4R). The V0-d transcript level significantly decreased in ‘Jinhong’ from 95 to 125 DAF and then increased to 185 DAF, whereas in ‘Jinyan’, it increased from 125 to 155 DAF and then decreased to 185 DAF. Overall, ‘Jinyan’ presented significantly greater transcript levels than did ‘Jinhong’ from 125 to 215 DAF (Figure 4S). The V0-e transcript levels were significantly greater in ‘Jinhong’ at 155 and 185 DAF but greater in ‘Jinyan’ at 95 and 215 DAF (Figure 4T).
The VHP1 transcript levels increased in both cultivars, but ‘Jinyan’ had greater transcript levels from 125 to 215 DAF (Figure 5A). The VHP2 transcript level significantly increased in ‘Jinhong’ from 95 to 155 DAF and then plateaued, whereas in ‘Jinyan’, it decreased from 95 to 125 DAF and then increased to 215 DAF. Except at 125 DAF, ‘Jinyan’ presented greater VHP2 transcript levels at all stages (Figure 5B). The VHP3 transcript level decreased from 95 to 125 DAF and then increased to 215 DAF in ‘Jinhong’, whereas in ‘Jinyan’, it only increased from 155 to 215 DAF. Overall, ‘Jinyan’ presented greater transcript levels at 95, 125, and 185 DAF (Figure 5C). The VHP4 transcript profile of both cultivars followed a similar trend as that of VHP2, and the VHP4 transcript level was significantly greater in ‘Jinyan’ at 95, 185, and 215 DAF (Figure 5D).
The expression of the tonoplast-localized P-type V-ATPase-encoding gene CsPH8 (Figure 6A) fluctuated in ‘Jinhong’, whereas in ‘Jinyan’, it significantly increased from 95 to 125 DAF and then declined to 215 DAF. Overall, ‘Jinyan’ maintained significantly higher CsPH8 transcript levels than ‘Jinhong’ did (Figure 6A). The CsCit1 transcript levels decreased from 95 to 125 DAF in both cultivars; thereafter, they continued to increase to 215 DAF in ‘Jinyan’, whereas in ‘Jinhong’, they increased only to 155 DAF before declining at 215 DAF. The CsCit1 transcript levels were significantly greater in ‘Jinyan’ than in ‘Jinhong’ at 95 and 215 DAF (Figure 6B).

3.4. Comparative Analysis of Citrate Degradation-Related Genes in Developing Juice Sacs

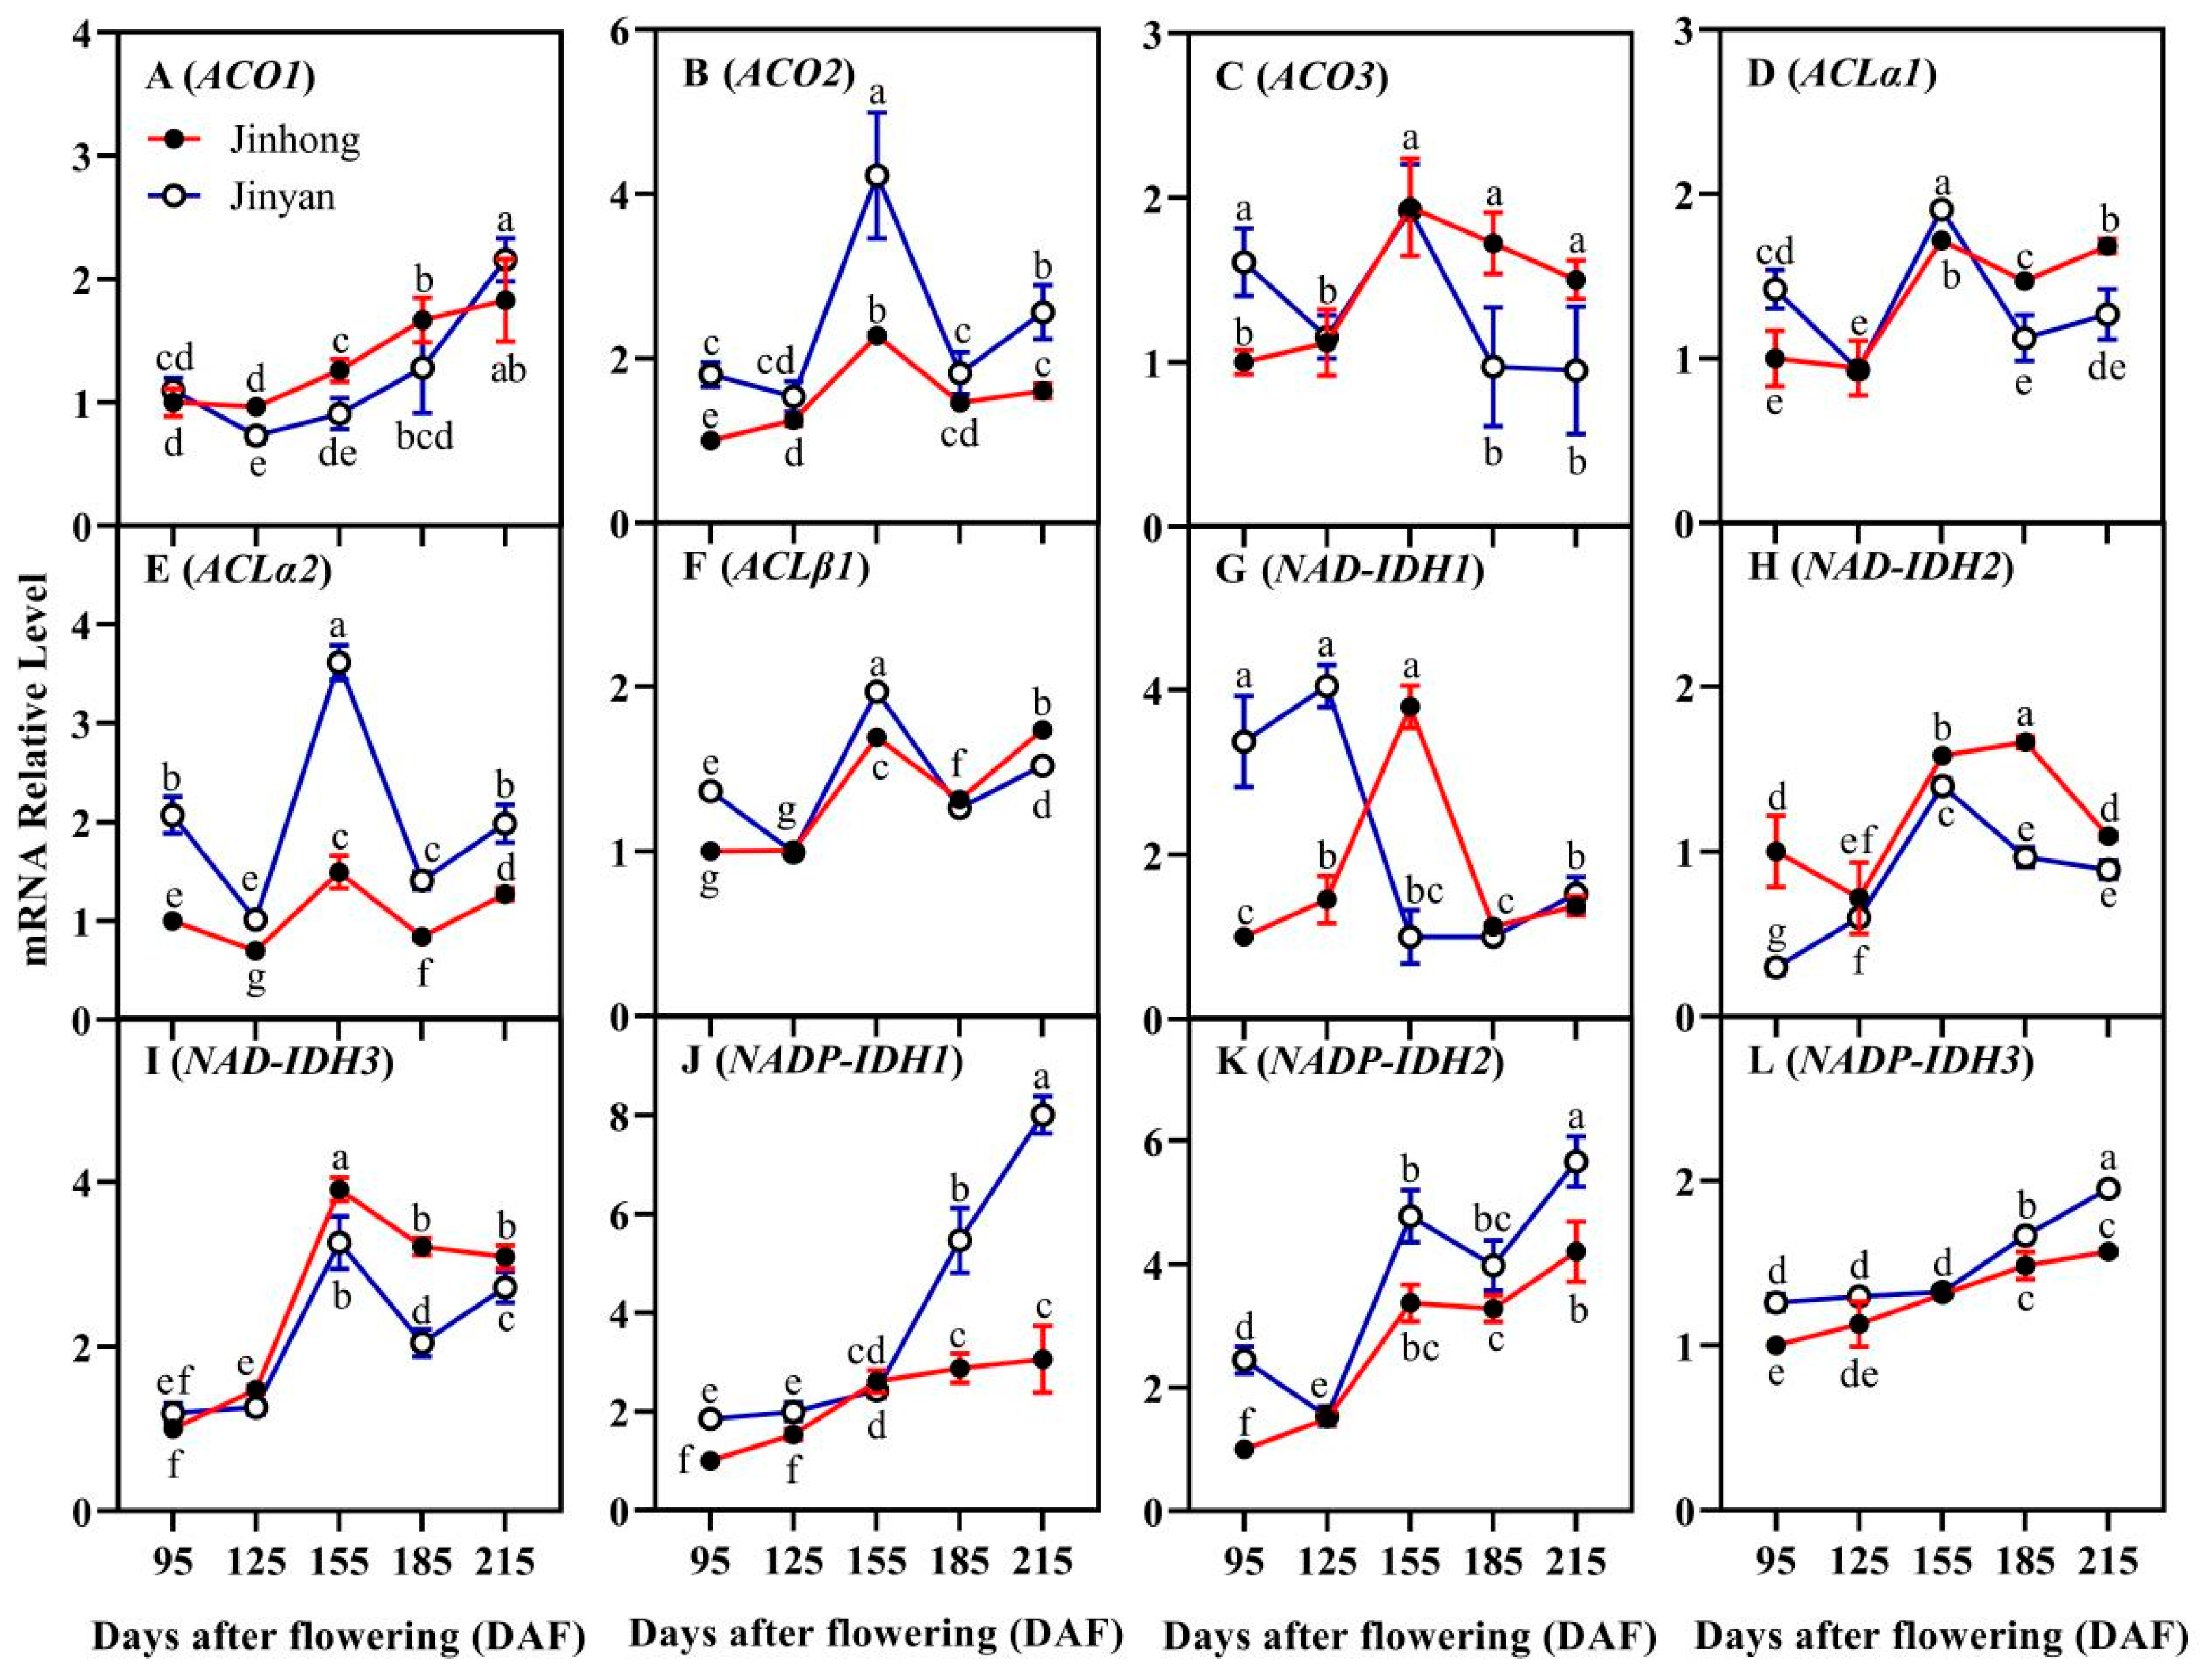
The ACO1 transcript levels significantly increased in ‘Jinhong’ from 125 to 185 DAF, whereas in ‘Jinyan’, they significantly decreased from 95 to 125 DAF and then increased to 215 DAF. Overall, the ACO1 transcript levels were significantly lower in ‘Jinyan’ than in Jinhong at 125 and 155 DAF (Figure 7A). The ACO2 transcript level significantly increased in ‘Jinhong’ from 95 to 155 DAF and then decreased to 185 DAF, whereas in ‘Jinyan’, it significantly increased from 125 to 155 DAF, then decreased to 185 DAF and increased again by 215 DAF. Overall, ‘Jinyan’ presented greater transcript levels at 95, 155, and 215 DAF (Figure 7B). The ACO3 transcript level increased in ‘Jinhong’ from 125 to 155 DAF and then stabilized, whereas in ‘Jinyan’, it significantly decreased from 95 to 125 DAF and again from 155 to 185 DAF (Figure 7C).
The ACLα1 transcript level was significantly greater in ‘Jinyan’ than in ‘Jinhong’ at 95 and 155 DAF, but it was lower from 185 to 215 DAF (Figure 7D). The ACLα2 transcript levels fluctuated significantly in both cultivars and were significantly greater in ‘Jinyan’ than in ‘Jinhong’ at all stages (Figure 7E). The ACLβ1 transcript level followed a similar pattern in both cultivars from 125 to 215 DAF. The transcript level was significantly greater in ‘Jinyan’ than in ‘Jinhong’ at 95 and 155 DAF and lower at 215 DAF (Figure 7F).
The NAD-IDH1 transcript level increased from 95 to 155 DAF in ‘Jinhong’, decreased at 185 DAF, and increased at 215 DAF, whereas in ‘Jinyan’, it significantly decreased from 125 to 155 DAF and then increased at 215 DAF. The transcript level was significantly greater in ‘Jinyan’ than in ‘Jinhong’ from 95 to 125 DAF and lower at 155 DAF (Figure 7G). The NAD-IDH2 transcript level significantly decreased in ‘Jinhong’ from 95 to 125 DAF, increased from 155 to 185 DAF, and decreased again at 215 DAF, whereas in ‘Jinyan’, it significantly increased from 95 to 155 DAF and then declined from 155 to 185 DAF. Except at 125 DAF, the NAD-IDH2 transcript level was significantly lower in ‘Jinyan’ than in ‘Jinhong’ (Figure 7H). The NAD-IDH3 transcript level significantly increased from 125 to 155 DAF and decreased from 155 to 185 DAF in ‘Jinhong’, whereas in ‘Jinyan’, it significantly increased from 95 to 155 DAF, decreased from 155 to 185 DAF, and increased again to 215 DAF. Moreover, the NAD-IDH3 transcript level was significantly lower in ‘Jinyan’ than in ‘Jinhong’ from 155 to 215 DAF (Figure 7I).
The NADP-IDH1 transcript level increased during fruit development in both cultivars. The NADP-IDH1 transcript level was significantly greater in ‘Jinyan’ than in ‘Jinhong’ at all stages except 125 DAF (Figure 7J). The NADP-IDH2 transcript level followed an increasing trend in ‘Jinhong’, whereas in ‘Jinyan’, it significantly decreased from 95 to 125 DAF, increased at 155 DAF, decreased at 185 DAF, and then increased at 215 DAF (Figure 7K). The NADP-IDH3 transcript level increased during fruit development in both cultivars, although it was significantly greater in ‘Jinyan’ than in ‘Jinhong’ at 95, 185, and 215 DAF (Figure 7L).

4. Discussion

Fleshy fruits undergo dynamic changes in phytochemical content during development, which shape their flavor [23]. Organic acids, especially citric acid in citrus, are key determinants of taste [6]. In this study, we measured the citric, malic, and quinic acid contents of the juice sacs of two sweet orange cultivars, ‘Jinyan’ and ‘Jinhong’, and found that ‘Jinyan’ presented significantly greater citric and malic acid contents (Figure 2). Both cultivars presented typical decreases in citric and quinic acid contents during ripening, which is consistent with previous reports [24,25] that the citric acid contents of most sweet orange cultivars tend to decrease with fruit development.
Citric acid, an intermediate metabolite in the TCA cycle, plays a role in the biosynthesis of amino acids and secondary metabolites [11]. Its cellular content is determined by the balance of citrate biosynthesis, transport, and utilization [3,18]. The genes related to the synthesis of citrate include phosphoenolpyruvate carboxylase (PEPC) and citrate synthase (CS) [10]. Transcriptome and enzyme activity analyses revealed that PEPC promoted the accumulation of citric acid during fruit development but was not the main factor influencing the citric acid content in fruit [26]. CS is a direct enzyme that catalyzes the production of citric acid from OAA and acetyl-CoA in mitochondria. Some studies have shown that citric acid accumulation in citrus is positively correlated with the CS expression level [27,28,29,30]. In contrast, it has also been shown that CS is not associated with citric acid accumulation in citrus fruits [24,31,32,33]. Here, we found that the PEPC1-3 transcript levels were significantly greater in ‘Jinyan’ than in ‘Jinhong’ from 185 to 215 DAF (Figure 3A–C). During the entire fruit development process, the CS1 transcript level was significantly greater in ‘Jinyan’ than in ‘Jinhong’ (Figure 3D), and at 155 DAF, the CS2 transcript level was significantly greater in ‘Jinyan’ than in ‘Jinhong’ (Figure 3E). These patterns suggest that upregulated citrate synthesis genes may contribute to the elevated citrate level in ‘Jinyan’.
Studies have shown that partial blockage of myt-Aco activity can promote the entry of more citrate into the cytoplasm [34,35]. When citric acid is transported to the cytoplasm, it is immediately degraded and utilized or stored in vacuoles to maintain a neutral environment in the cytoplasm [18]. In addition, increased cyt-Aco activity reduces citrate accumulation during fruit ripening [9]. Many studies have shown that ACO is not a key factor in the change in acid accumulation, although changes in ACO activity affect the citrate content in citrus fruits [9,25,35,36,37]. Katz et al. [38] reported that the expression level of the ACL protein in mature citrus fruits increased, whereas Guo et al. [25] reported that the ACL gene was not the main gene involved in citrate accumulation in citrus. In this study, after 185 DAF, the transcript levels of ACO3, ACLα1, NAD-IDH2, and NAD-IDH3 were significantly lower in ‘Jinyan’ than in ‘Jinhong’ (Figure 7). These findings suggest that the downregulation of citrate degradation genes in ‘Jinyan’ likely contributes to its higher citrate content.
In addition to synthesis and breakdown, vacuolar storage plays a crucial role in citrate accumulation [39]. Reduced vacuolar proton pump activity has been associated with lower citrate storage capacity in low-acid citrus varieties [21,40]. Notably, the tonoplast proton pumps CsPH8 and CsPH5 are highly expressed in acidic citrus cultivars but downregulated in acidless cultivars [41,42]. In this study, several vacuolar proton pump genes, including V1-E1, V1-E2, V0-a2, V0-d, VHP1, VHP2, and the tonoplast H+-ATPase CsPH8, were expressed at higher levels in ‘Jinyan’ than in ‘Jinhong’ (Figure 4, Figure 5 and Figure 6). In particular, the expression patterns of V1-E2 and CsPH8 mirrored the trends in citric acid content (Figure 2, Figure 4 and Figure 6). These data suggest that increased expression of vacuolar proton pump-related genes in ‘Jinyan’ enhances citrate import and storage in vacuoles, facilitating its increased accumulation.

5. Conclusions

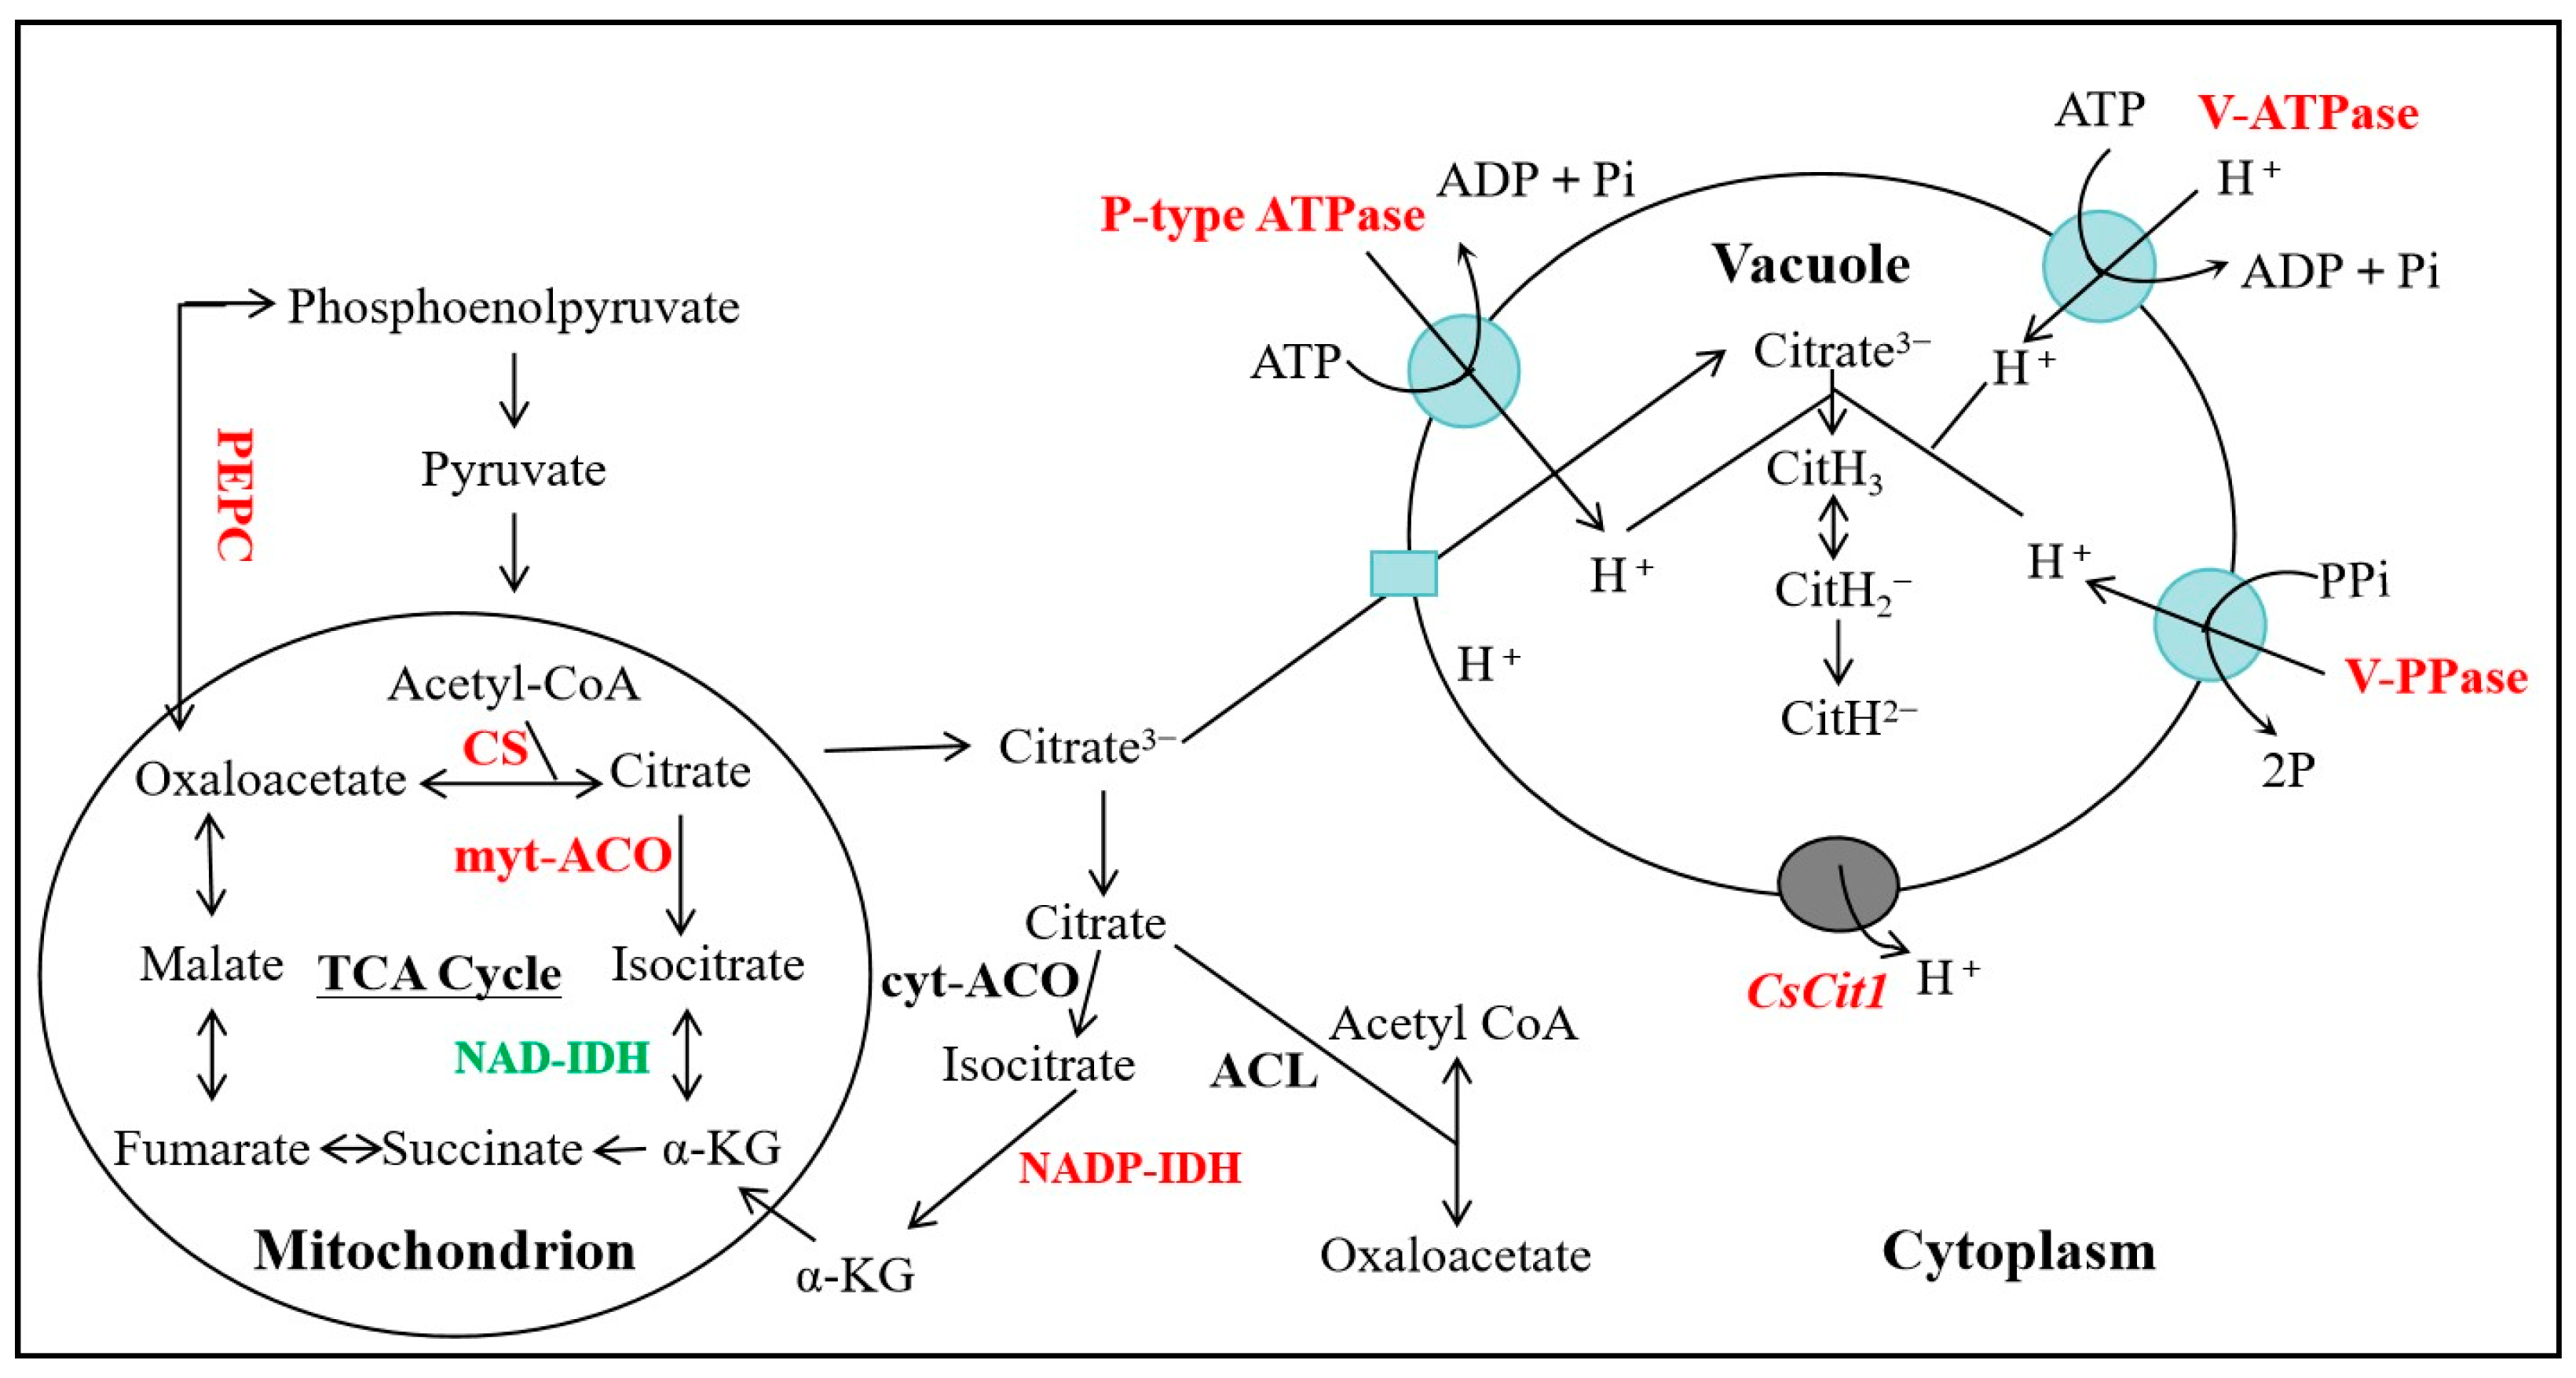
In summary, ‘Jinyan’ Bingtang orange accumulates substantially more citric acid than its parent ‘Jinhong’ does throughout fruit development. Our expression analysis indicates that ‘Jinyan’ has upregulated citrate synthesis (PEPC and CS) and vacuolar sequestration (V1-E1, V1-E2, V0-a2, V0-d, VHP1-2, and CsPH8) genes, along with downregulated citrate degradation-related (NAD-IDH2 and NAD-IDH3) genes. Collectively, these changes likely enable ‘Jinyan’ to synthesize and store more citrate in juice sac vacuoles (Figure 8). Future studies should investigate the regulatory mechanisms causing these gene expression differences.

Supplementary Materials

The following supporting information can be downloaded at https://www.mdpi.com/article/10.3390/horticulturae11060616/s1: Figure S1: Changes in total soluble solids (A), sucrose (B), glucose (C), fructose (D) accumulation in ‘Jinhong’ and ‘Jinyan’ Bingtang orange during fruit development; Table S1: Primers used for real-time quantitative PCR analyses.

Author Contributions

Conceptualization, Y.X. and P.C.; methodology, J.H.; software, L.G.; validation, S.B.H. and Y.X.; formal analysis, L.G. and J.H.; investigation, L.T. and Y.X.; resources, L.G., L.T., W.L., T.Z. and F.L.; data curation, L.G., S.B.H. and L.T.; writing—original draft preparation, L.G.; writing—review and editing, S.B.H., Y.X. and P.C.; visualization, C.W.; supervision, Y.X. and P.C.; project administration, P.C.; funding acquisition, L.G. and P.C. All authors have read and agreed to the published version of the manuscript.

Funding

This research was funded by the National Natural Science Foundation of China (32302487), the Agricultural Science and Technology Innovation Funds Project of Hunan Province (2022CX102) and the Special Financial Funds of Hunan Province (No. [2024]68).

Data Availability Statement

Data will be made available upon request to the corresponding author.

Acknowledgments

We thank Xiangxue Li for his help with the sample collection process.

Conflicts of Interest

The authors declare that they have no conflicts of interest.

References

  1. Tang, Y.; Wang, P.; Chen, J.; Li, L.; Tang, L.; Huang, W.; Wei, X.; Xu, J. The accumulation pattern of sugars and organic acids in diverse fruit pulps coordinates sweet-sour taste of passion fruit. LWT 2025, 225, 117948. [Google Scholar] [CrossRef]
  2. Batista-Silva, W.; Nascimento, V.L.; Medeiros, D.B.; Nunes-Nesi, A.; Ribeiro, D.M.; Zsögön, A.; Araújo, W.L. Modifications in Organic Acid Profiles During Fruit Development and Ripening: Correlation or Causation? Front. Plant Sci. 2018, 9, 1689. [Google Scholar] [CrossRef] [PubMed]
  3. Hussain, S.B.; Shi, C.Y.; Guo, L.X.; Kamran, H.M.; Sadka, A.; Liu, Y.Z. Recent advances in the regulation of citric acid metabolism in citrus fruit. Crit. Rev. Plant Sci. 2017, 36, 241–256. [Google Scholar] [CrossRef]
  4. He, J.; Sun, J.; Huang, Y.; Wang, L.; Liu, S.; Jiang, Z.; Wang, X.; Xu, Q. Transcriptome analysis reveals the common and specific pathways of citric acid accumulation in different citrus species. Hortic. Plant J. 2025, 11, 520–534. [Google Scholar] [CrossRef]
  5. He, J.X.; Xu, Y.T.; Huang, D.; Fu, J.L.; Liu, Z.A.; Wang, L.; Zhang, Y.; Xu, R.W.; Li, L.; Deng, X.X.; et al. TRIPTYCHON-LIKE regulates aspects of both fruit flavor and color in citrus. J. Exp. Bot. 2022, 73, 3610–3624. [Google Scholar] [CrossRef]
  6. Tahjib-Ul-Arif, M.; Zahan, M.I.; Karim, M.M.; Imran, S.; Hunter, C.T.; Islam, M.S.; Mia, M.A.; Hannan, M.A.; Rhaman, M.S.; Hossain, M.A.; et al. Citric Acid-Mediated Abiotic Stress Tolerance in Plants. Int. J. Mol. Sci. 2021, 22, 7235. [Google Scholar] [CrossRef]
  7. Guo, L.X.; Hussain, S.B.; Fernie, A.R.; Liu, Y.Z.; Yan, M.; Chen, H.; Alam, S.M. Multiomic analysis elucidates the reasons underlying the differential metabolite accumulation in citrus mature leaves and fruit juice sacs. J. Agric. Food Chem. 2020, 68, 11863–11874. [Google Scholar] [CrossRef]
  8. Han, H.; Li, Y.J.; Alam, S.M.; Zhou, T.; Khan, M.A.; Thu, A.M.; Liu, Y.Z. AP2 transcription factor CsAIL6 negatively regulates citric acid accumulation in citrus fruits by interacting with a WD40 protein CsAN11. Hortic. Res. 2025, 12, uhaf002. [Google Scholar] [CrossRef]
  9. Sadka, A.; Dahan, E.; Or, E.; Cohen, L. NADP+-isocitrate dehydrogenase gene expression and isozyme activity during citrus fruit development. Plant Sci. 2000, 158, 173–181. [Google Scholar] [CrossRef]
  10. Perotti, V.E.; Figueroa, C.M.; Andreo, C.S.; Iglesias, A.A.; Podestá, F.E. Cloning, expression, purification and physical and kinetic characterization of the phosphoenolpyruvate carboxylase from orange (Citrus sinensis osbeck var. Valencia) fruit juice sacs. Plant Sci. 2010, 179, 527–535. [Google Scholar]
  11. Sweetlove, L.J.; Beard, K.F.M.; Nunes-Nesi, A.; Fernie, A.R.; Ratcliffe, R.G. Not just a circle: Flux modes in the plant TCA cycle. Trends Plant Sci. 2010, 15, 462–470. [Google Scholar] [CrossRef] [PubMed]
  12. Rentsch, D.; Martinoia, E. Citrate transport into barley mesophyll vacuoles: Comparison with malate-uptake activity. Planta 1991, 184, 532–537. [Google Scholar] [CrossRef] [PubMed]
  13. Ratajczak, R.; Luttge, U.; Gonzalez, P.; Etxeberria, E. Malate and malate-channel antibodies inhibit electrogenic and ATP-dependent citrate transport across the tonoplast of citrus juice cells. J. Plant Physiol. 2003, 160, 1313–1317. [Google Scholar] [CrossRef] [PubMed]
  14. Gaxiola, R.A.; Palmgren, M.G.; Schumacher, K. Plant proton pumps. FEBS Lett. 2007, 581, 2204–2214. [Google Scholar] [CrossRef]
  15. Muller, M.L.; Irkens, K.U.; Rubinstein, B.; Taiz, L. On the mechanism of hyperacidification in lemon-comparison of the vacuolar H+-ATPase activities of fruits and epicotyls. J. Biol. Chem. 1996, 271, 1916–1924. [Google Scholar]
  16. Shimada, T.; Nakano, R.; Shulaev, V.; Sadka, A.; Blumwald, E. Vacuolar citrate/H+ symporter of citrus juice cells. Planta 2006, 224, 472–480. [Google Scholar] [CrossRef]
  17. Sadka, A.; Dahan, E.; Cohen, L.; Marsh, K.B. Aconitase activity and expression during the development of lemon fruit. Physiol. Plant. 2003, 108, 255–262. [Google Scholar] [CrossRef]
  18. Etienne, A.; Génard, M.; Lobit, P.; Mbeguié-A-Mbéguié, D.; Bugaud, C. What controls fleshy fruit acidity? A review of malate and citrate accumulation in fruit cells. J. Exp. Bot. 2013, 64, 1451–1469. [Google Scholar] [CrossRef]
  19. Mafrica, R.; De Bruno, A.; Mafrica, D.L.; Merlo, C.; Gattuso, A.; Poiana, M. Ripening Dynamics and Optimal Harvest Timing of ‘Fantastico’ and ‘Femminello’ Bergamot Fruit. Agriculture 2025, 15, 737. [Google Scholar] [CrossRef]
  20. Bartolozzi, F.; Bertazza, G.; Bassi, D.; Cristoferi, G. Simultaneous determination of soluble sugars and organic acids as their trimethylsilyl derivatives in apricot fruits by gas-liquid chromatography. J. Chromatogr. A. 1997, 758, 99–107. [Google Scholar] [CrossRef]
  21. Guo, L.X.; Shi, C.Y.; Liu, X.; Ning, D.Y.; Jin, L.F.; Yang, H.; Liu, Y.Z. Citrate accumulation-related gene expression and/or enzyme activity analysis combined with metabolomics provide a novel insight for an orange mutant. Sci. Rep. 2016, 6, 29343. [Google Scholar] [CrossRef] [PubMed]
  22. Livak, K.J.; Schmittgen, T.D. Analysis of Relative Gene Expression Data Using Real-Time Quantitative PCR and the 2 [−Delta Delta C (T)] Method. Methods 2001, 25, 402–408. [Google Scholar] [CrossRef] [PubMed]
  23. Maldonado-Celis, M.E.; Yahia, E.M.; Bedoya, R.; Landazuri, P.; Loango, N.; Aguillon, J.; Restrepo, B.; Guerrero Ospina, J.C. Chemical composition of mango (Mangifera indica L.) fruit: Nutritional and phytochemical compounds. Front. Plant Sci. 2019, 10, 1073. [Google Scholar] [CrossRef]
  24. Chen, M.; Xie, X.L.; Lin, Q.; Chen, J.Y.; Grierson, D.; Yin, X.R.; Sun, C.D.; Chen, K.S. Differential expression of organic acid degradation-related genes during fruit development of Navel oranges (Citrus sinensis) in two habitats. Plant Mol. Biol. Rep. 2013, 31, 1131–1140. [Google Scholar] [CrossRef]
  25. Guo, L.X.; Liu, Y.Z.; Luo, L.J.; Hussain, S.B.; Bai, Y.X.; Alam, S.M. Comparative Metabolites and Citrate-Degrading Enzymes Activities in Citrus Fruits Reveal the Role of Balance between ACL and Cyt-ACO in Metabolite Conversions. Plants 2020, 9, 350. [Google Scholar] [CrossRef]
  26. Wei, Q.J.; Ma, Q.L.; Zhou, G.F.; Liu, X.; Ma, Z.Z.; Gu, Q.Q. Identification of genes associated with soluble sugar and organic acid accumulation in ‘Huapi’ kumquat (Fortunella crassifolia Swingle) via transcriptome analysis. J. Sci. Food Agric. 2021, 101, 4321–4331. [Google Scholar] [CrossRef]
  27. Yamaki, Y.T. Effect of lead arsenate on citrate synthase activity in fruit pulp of Satsuma mandarin. J. Japan. Soc. Hort. Sci. 1990, 58, 899–905. [Google Scholar] [CrossRef]
  28. Wen, T.; Xiong, Q.E.; Zeng, W.G.; Liu, Y.P. Changes of organic acid synthetase activity during fruit development of navel orange (Citrus sinesis Osbeck). Acta. Hortic. Sinica 2001, 28, 161–163. [Google Scholar]
  29. Sadka, A.; Dahan, E.; Or, E.; Roose, M.L.; Marsh, K.B.; Cohen, L. Comparative analysis of mitochondrial citrate synthase gene structure, transcript level and enzymatic activity in acidless and acid-containing Citrus varieties. Funct. Plant Biol. 2001, 28, 383–390. [Google Scholar] [CrossRef]
  30. Etienne, C.; Moing, A.; Dirlewanger, E.; Raymond, P.; Monet, R.; Rothan, C. Isolation and characterization of six peach cDNAs encoding key proteins in organic acid metabolism and solute accumulation: Involvement in regulating peach fruit acidity. Physiol. Plant. 2002, 114, 259–270. [Google Scholar] [CrossRef]
  31. Delhaize, E.; Ryan, P.R.; Hocking, P.J.; Richardson, A.E. Effects of altered citrate synthase and isocitrate dehydrogenase expression on internal citrate contents and citrate efflux from tobacco (Nicotiana tabacum L.) roots. Plant Soil. 2003, 248, 137–144. [Google Scholar] [CrossRef]
  32. Lin, Q.; Wang, C.Y.; Dong, W.C.; Jiang, Q.; Wang, D.L.; Li, S.J.; Chen, M.; Liu, C.R.; Sun, C.D.; Chen, K.S. Transcriptome and metabolome analyses of sugar and organic acid metabolism in Ponkan (Citrus reticulata) fruit during fruit maturation. Gene 2015, 554, 64–74. [Google Scholar] [CrossRef] [PubMed]
  33. Lu, X.P.; Cao, X.J.; Li, F.F.; Li, J.; Xiong, J.; Long, G.Y.; Cao, S.Y.; Xie, S.X. Comparative transcriptome analysis reveals a global insight into molecular processes regulating citrate accumulation in sweet orange (Citrus sinensis). Physiol. Plantarum. 2016, 158, 463–482. [Google Scholar] [CrossRef]
  34. Bogin, E.; Wallace, A. Organic acid synthesis and accumulation in sweet and sour lemon fruit. J. Am. Soc. Horti. Sci. 1966, 89, 182–194. [Google Scholar]
  35. Degu, A.; Hatew, B.; Nunes-Nesi, A.; Shlizerman, L.; Zur, N.; Katz, E.; Fernie, A.R.; Blumwald, E.; Sadka, A. Inhibition of aconitase in citrus fruit callus results in a metabolic shift towards amino acid biosynthesis. Planta 2011, 234, 501–513. [Google Scholar] [CrossRef]
  36. Chen, M.; Jiang, Q.; Yin, X.R.; Lin, Q.; Chen, J.Y.; Allan, A.C.; Xu, C.J.; Chen, K.S. Effect of hot air treatment on organic acid- and sugar-metabolism in Ponkan (Citrus reticulata) fruit. Sci. Hortic. 2012, 147, 118–125. [Google Scholar] [CrossRef]
  37. Wang, L.; He, F.; Huang, Y.; He, J.X.; Yang, S.Z.; Zeng, J.W.; Deng, C.L.; Jiang, X.L.; Fang, Y.W.; Wen, S.H.; et al. Genome of wild mandarin and domestication history of mandarin. Mol. Plant. 2018, 11, 1024–1037. [Google Scholar] [CrossRef]
  38. Katz, E.; Fon, M.; Lee, Y.J.; Phinney, B.S.; Sadka, A.; Blumwald, E. The citrus fruit proteome: Insights into citrus fruit metabolism. Planta 2007, 226, 989–1005. [Google Scholar] [CrossRef]
  39. Eisenach, C.; Baetz, U.; Martinoia, E. Vacuolar proton pumping: More than the sum of its parts? Trends Plant Sci. 2014, 19, 344–346. [Google Scholar] [CrossRef]
  40. Tan, F.Q.; Zhang, M.; Xie, K.D.; Fan, Y.J.; Song, X.; Wang, R.; Wu, X.M.; Zhang, H.Y.; Guo, W.W. Polyploidy remodels fruit metabolism by modifying carbon source utilization and metabolic flux in Ponkan mandarin (Citrus reticulata Blanco). Plant Sci. 2019, 289, 110276. [Google Scholar] [CrossRef]
  41. Shi, C.Y.; Hussain, S.B.; Yang, H.; Bai, Y.X.; Khan, M.A.; Liu, Y.Z. CsPH8, a P-type proton pump gene, plays a key role in the diversity of citrate accumulation in citrus fruits. Plant Sci. 2019, 289, 110288. [Google Scholar] [CrossRef] [PubMed]
  42. Strazzer, P.; Spelt, C.E.; Li, S.J.; Bliek, M.; Federici, C.T.; Roose, M.L.; Koes, R.; Quattrocchio, F.M. Hyperacidification of Citrus fruits by a vacuolar proton-pumping P-ATPase complex. Nat. Commun. 2019, 10, 744. [Google Scholar] [CrossRef]
Figure 1. Changes in the L* value (A), a* value (B), b* value (C), CCI value (D), fruit weight (E), fruit horizontal and vertical diameter ((F,G), respectively), and fruit shape index (H) during ‘Jinhong’ and ‘Jinyan’ Bingtang orange fruit development. Different lowercase letters near trend lines in each graph indicate significant differences at p < 0.05 among the tested samples at different stages according to Duncan’s multiple range test. The error bars represent the standard errors obtained from ten independent replications.
Horticulturae 11 00616 g001aHorticulturae 11 00616 g001b
Figure 2. Changes in titratable acid (A), citrate (B), malic acid (C), and quinic acid (D) accumulation in ‘Jinhong’ and ‘Jinyan’ Bingtang orange during fruit development. Different lowercase letters near trend lines in each graph indicate significant differences at p < 0.05 among the tested samples at different stages according to Duncan’s multiple range test. The error bars represent the standard errors obtained from three independent replications.
Horticulturae 11 00616 g002
Figure 3. Expression profiles of the phosphoenolpyruvate carboxylase (PEPC) and citrate synthase (CS) genes at different developmental stages of ‘Jinhong’ and ‘Jinyan’ fruits. (A) PEPC1; (B) PEPC2; (C) PEPC3; (D) CS1, and (E) CS2. Different lowercase letters near trend lines in each graph indicate significant differences at p < 0.05 among the tested samples at different stages according to Duncan’s multiple range test. The error bars represent the standard errors obtained from three independent replications.
Horticulturae 11 00616 g003
Figure 4. Expression profiles of vacuolar H+-ATPase (V-ATPase) genes at different developmental stages in ‘Jinhong’ and ‘Jinyan’ fruits. (A) V1-A; (B) V1-B; (C) V1-C; (D) V1-D; (E) V1-E1; (F) V1-E2; (G) V1-F1; (H) V1-F2; (I) V1-G; (J) V1-H1; (K) V1-H2; (L) V0-a1; (M) V0-a2; (N) V0-c1; (O) V0-c2; (P) V0-c3; (Q) V0-c4; (R) V0-c’’; (S) V0-d; and (T) V0-e. Different lowercase letters near trend lines in each graph indicate significant differences at p < 0.05 among the tested samples at different stages according to Duncan’s multiple range test. The error bars represent the standard errors obtained from three independent replications.
Horticulturae 11 00616 g004
Figure 5. Expression profiles of vacuolar H+-pyrophosphatase (V-PPase) genes at different developmental stages in ‘Jinhong’ and ‘Jinyan’ fruits. (A) VHP1; (B) VHP2; (C) VHP3; and (D) VHP4. Different lowercase letters near trend lines in each graph indicate significant differences at p < 0.05 among the tested samples at different stages according to Duncan’s multiple range test. The error bars represent the standard errors obtained from three independent replications.
Horticulturae 11 00616 g005
Figure 6. Expression profiles of the plasma membrane-type H+-ATPase (CsPH8) gene (A) and citrate symporter (CsCit1) gene (B) at different developmental stages in ‘Jinhong’ and ‘Jinyan’ fruits. Different lowercase letters near trend lines in each graph indicate significant differences at p < 0.05 among the tested samples at different stages according to Duncan’s multiple range test. The error bars represent the standard errors obtained from three independent replications.
Horticulturae 11 00616 g006
Figure 7. Expression profiles of citrate degradation-related genes at different developmental stages in ‘Jinhong’ and ‘Jinyan’ fruits. (A) ACO1; (B) ACO2; (C) ACO3; (D) ACLα1; (E) ACLα2; (F) ACLβ1; (G) NAD-IDH1; (H) NAD-IDH2; (I) NAD-IDH3; (J) NADP-IDH1; (K) NADP-IDH2; and (L) NADP-IDH3. Different lowercase letters near trend lines in each graph indicate significant differences at p < 0.05 among the tested samples at different stages according to Duncan’s multiple range test. The error bars represent the standard errors obtained from three independent replications.
Horticulturae 11 00616 g007
Figure 8. Schematic model showing the key genes involved in high citrate accumulation in the sweet orange (Citrus sinensis) mutant cultivar ‘Jinyan’. The red and green colors indicate that the gene expression level is significantly greater and lower, respectively, in ‘Jinyan’ than in ‘Jinhong’. PEPC phosphoenolpyruvate carboxylase, CS citrate synthase, myt-ACO mitochondrial aconitase, NAD-IDH NAD-dependent isocitrate dehydrogenase, cyt-ACO cytosolic aconitase, NADP-IDH cytosolic NADP-dependent isocitrate dehydrogenase, ACL ATP citrate lyase, P-type ATPase plasma membrane H+-ATPase, V-ATPase vacuolar H+-ATPase, V-PPase vacuolar H+-pyrophosphatase.
Horticulturae 11 00616 g008
Disclaimer/Publisher’s Note: The statements, opinions and data contained in all publications are solely those of the individual author(s) and contributor(s) and not of MDPI and/or the editor(s). MDPI and/or the editor(s) disclaim responsibility for any injury to people or property resulting from any ideas, methods, instructions or products referred to in the content.