Article

Crop Load Affects Yield, Fruit Size, and Return Bloom of the New Apple Cultivar Fryd© (‘Wuranda’)

by
Darius Kviklys
1,2,* and
Inger Martinussen
1
1
Norwegian Institute of Bioeconomy Research—NIBIO, P.O. Box 115, 1431 Ås, Norway
2
Lithuanian Research Centre for Agriculture and Forestry, LT-58344 Akademija, Lithuania
*
Author to whom correspondence should be addressed.
Horticulturae 2025, 11(6), 597; https://doi.org/10.3390/horticulturae11060597
Submission received: 9 April 2025 / Revised: 24 May 2025 / Accepted: 25 May 2025 / Published: 27 May 2025
(This article belongs to the Special Issue Orchard Management: Strategies for Yield and Quality)

Abstract

:
The successful introduction of new cultivars depends on the evaluation of complex parameters essential for the consumers, market, and fruit producers. A new scab-resistant apple cultivar, ‘Wuranda’ (SQ159/Natyra®/Magic Star® × Honeycrisp), recently introduced in Norway and managed under the name Fryd©, is prone to biennial bearing. Therefore, one of the first tasks, investigated in Southwestern Norway by the Norwegian Institute of Bioeconomy Research, NIBIO-Ullensvang in 2021–2024, was the establishment of optimal crop load level based on the combination of productivity, fruit quality, and return bloom. The apple cultivar Fryd (‘Wuranda’) was propagated on ‘M.9’ rootstock and planted in 2019. The trial was performed in the same orchard for four consecutive years, starting three years after planting. Crop load level affected average fruit mass but had no impact on cv. Fryd fruit quality parameters at harvest such as blush, ground color, firmness, soluble solid content, or starch degradation. Fruit size variation was diminished by crop load regulation, and most fruits fell into 2–3 grading classes. Crop load, not the yield per tree, was the determining factor for the return bloom. The optimal crop load level depended on the orchard age. To guarantee a regular bearing mode of cv. Fryd planted on M.9 rootstock at a 3.5 × 1 m distance and trained as slender spindle, crop load of 5.5–6 fruits cm−2 TCSA (trunk cross-sectional area) in the 3rd year, 7.5–8 fruits cm−2 TCSA in the 4th year, and 6.5–7 fruits cm−2 TCSA in the 5th year should be maintained.

1. Introduction

New apple cultivars with high-quality, tasty, and crispy fruits and an extended storage season are desirable in the Norwegian market, where cultivars the ‘Red Aroma’, ‘Summered’, ‘Discovery’, and ‘Red Gravenstein’ currently dominate [1]. These old cultivars are adapted to distinctive climate conditions with cool and rainy summers, long days, and a short vegetation period [2]. Despite long fruit-growing traditions in Norway, locally grown apples make up only a minor share of the domestic market. The urgent task for research, together with growers’ organizations and wholesalers, is the introduction of new cultivars that can compete with imported apples.
A new scab-resistant apple cultivar ‘Wuranda’, a cross between SQ159 (Natyra®/Magic Star®) and ‘Honeycrisp’, was recently released by the breeding company Fresh Forward (Huissen, The Netherlands) and is managed in Norway under the trade name Fryd©. Since 2019, plantings of cv. Fryd have expanded very fast and its share in Norwegian apple production has increased each year. The very first observations in the commercial orchards highlighted the tendency of cv. Fryd to biennial bearing. Such cropping patterns and inconsistent yield significantly reduce the value of the apple industry and are common for other ‘Honeycrisp’-related cultivars [3]. In recent years, many breeding companies around the world have included cv. ‘Honeycrisp’ in their breeding programs, resulting in many new cultivars with ‘Honeycrisp’ in their pedigree having been released. Examples include Cosmic Crisp® (‘WA38’) from Washington State University, SweeTango® from the University of Minnesota (St. Paul., MN, USA), SnapDragon® from Cornell University (Ithaca, NY, USA), and EverCrisp® from the Midwestern Apple Improvement Association (Oberlin, OH, USA); these and other similar cultivars have been planted extensively in the US and other countries. Due to the short history of these cultivars, limited studies have been published, and only one is related to crop load studies of apple cultivar ‘WA38’ [3].
Many apple cultivars are prone to biennial bearing, meaning one season with high yields is followed by the next season with low or even no yields. In addition to cultivar genetics, apple-bearing regularity depends on many technological factors such as nutrition, irrigation, the application of phytohormones, tree pruning and training, rootstock used, and most importantly, crop load. Crop load regulation is critical and overwhelms the effects of other factors [4,5,6,7]. Several crop load management strategies can be employed to reach high and regular yields such as pruning, artificial spur extinction, chemical or mechanical thinning, and hand thinning after June drop [8,9].
Recommended crop load levels, which are described by fruit number per trunk cross-sectional area (TCSA) or fruit number per tree, vary depending on the cultivar and growing region. In Australia, Bound [10] recommended crop loads of 2–4 fruit cm−2 TCSA for ‘Delicious’, 4 fruit cm−2 TCSA for ‘Braeburn’, 4–6 fruit cm−2 TCSA for ‘Fuji’, ’Cripps Pink’ (Pink Lady©), and ‘Gala’, and 8 fruit cm−2 TCSA for ‘Jonagold’. In India, 4–6 fruit cm−2 TCSA is the optimal crop load for ‘Jeromine’, ‘Redlum Gala’, and ‘Super Chief’ [11]. Moreover, 3.71 to 4.69 fruit cm−2 TCSA is suggested for ‘Golden Delicious‘ in Turkey [12].
To produce consistent high-quality fruit of cv. ‘Honeycrisp‘ and avoid biennial bearing, a crop load level of 6 fruits cm−2 of trunk cross-sectional area (TCSA) was established in eastern Canada [13], 4.7 to 7.5 fruits cm−2 TCSA in Washington state [14], and 8–10 fruits cm−2 TCSA in New York state [4].
Many shortcomings of certain cultivars can be overcome by developing cultivar-specific growing and management technologies. During the process of introducing cv. Fryd (‘Wuranda’), as with many other ‘Honeycrisp’-related cultivars, control of biennial bearing was one of the main topics, therefore investigations and the establishment of optimal crop load levels according to the tree age and growing conditions was the main goal of our investigations.

2. Materials and Methods

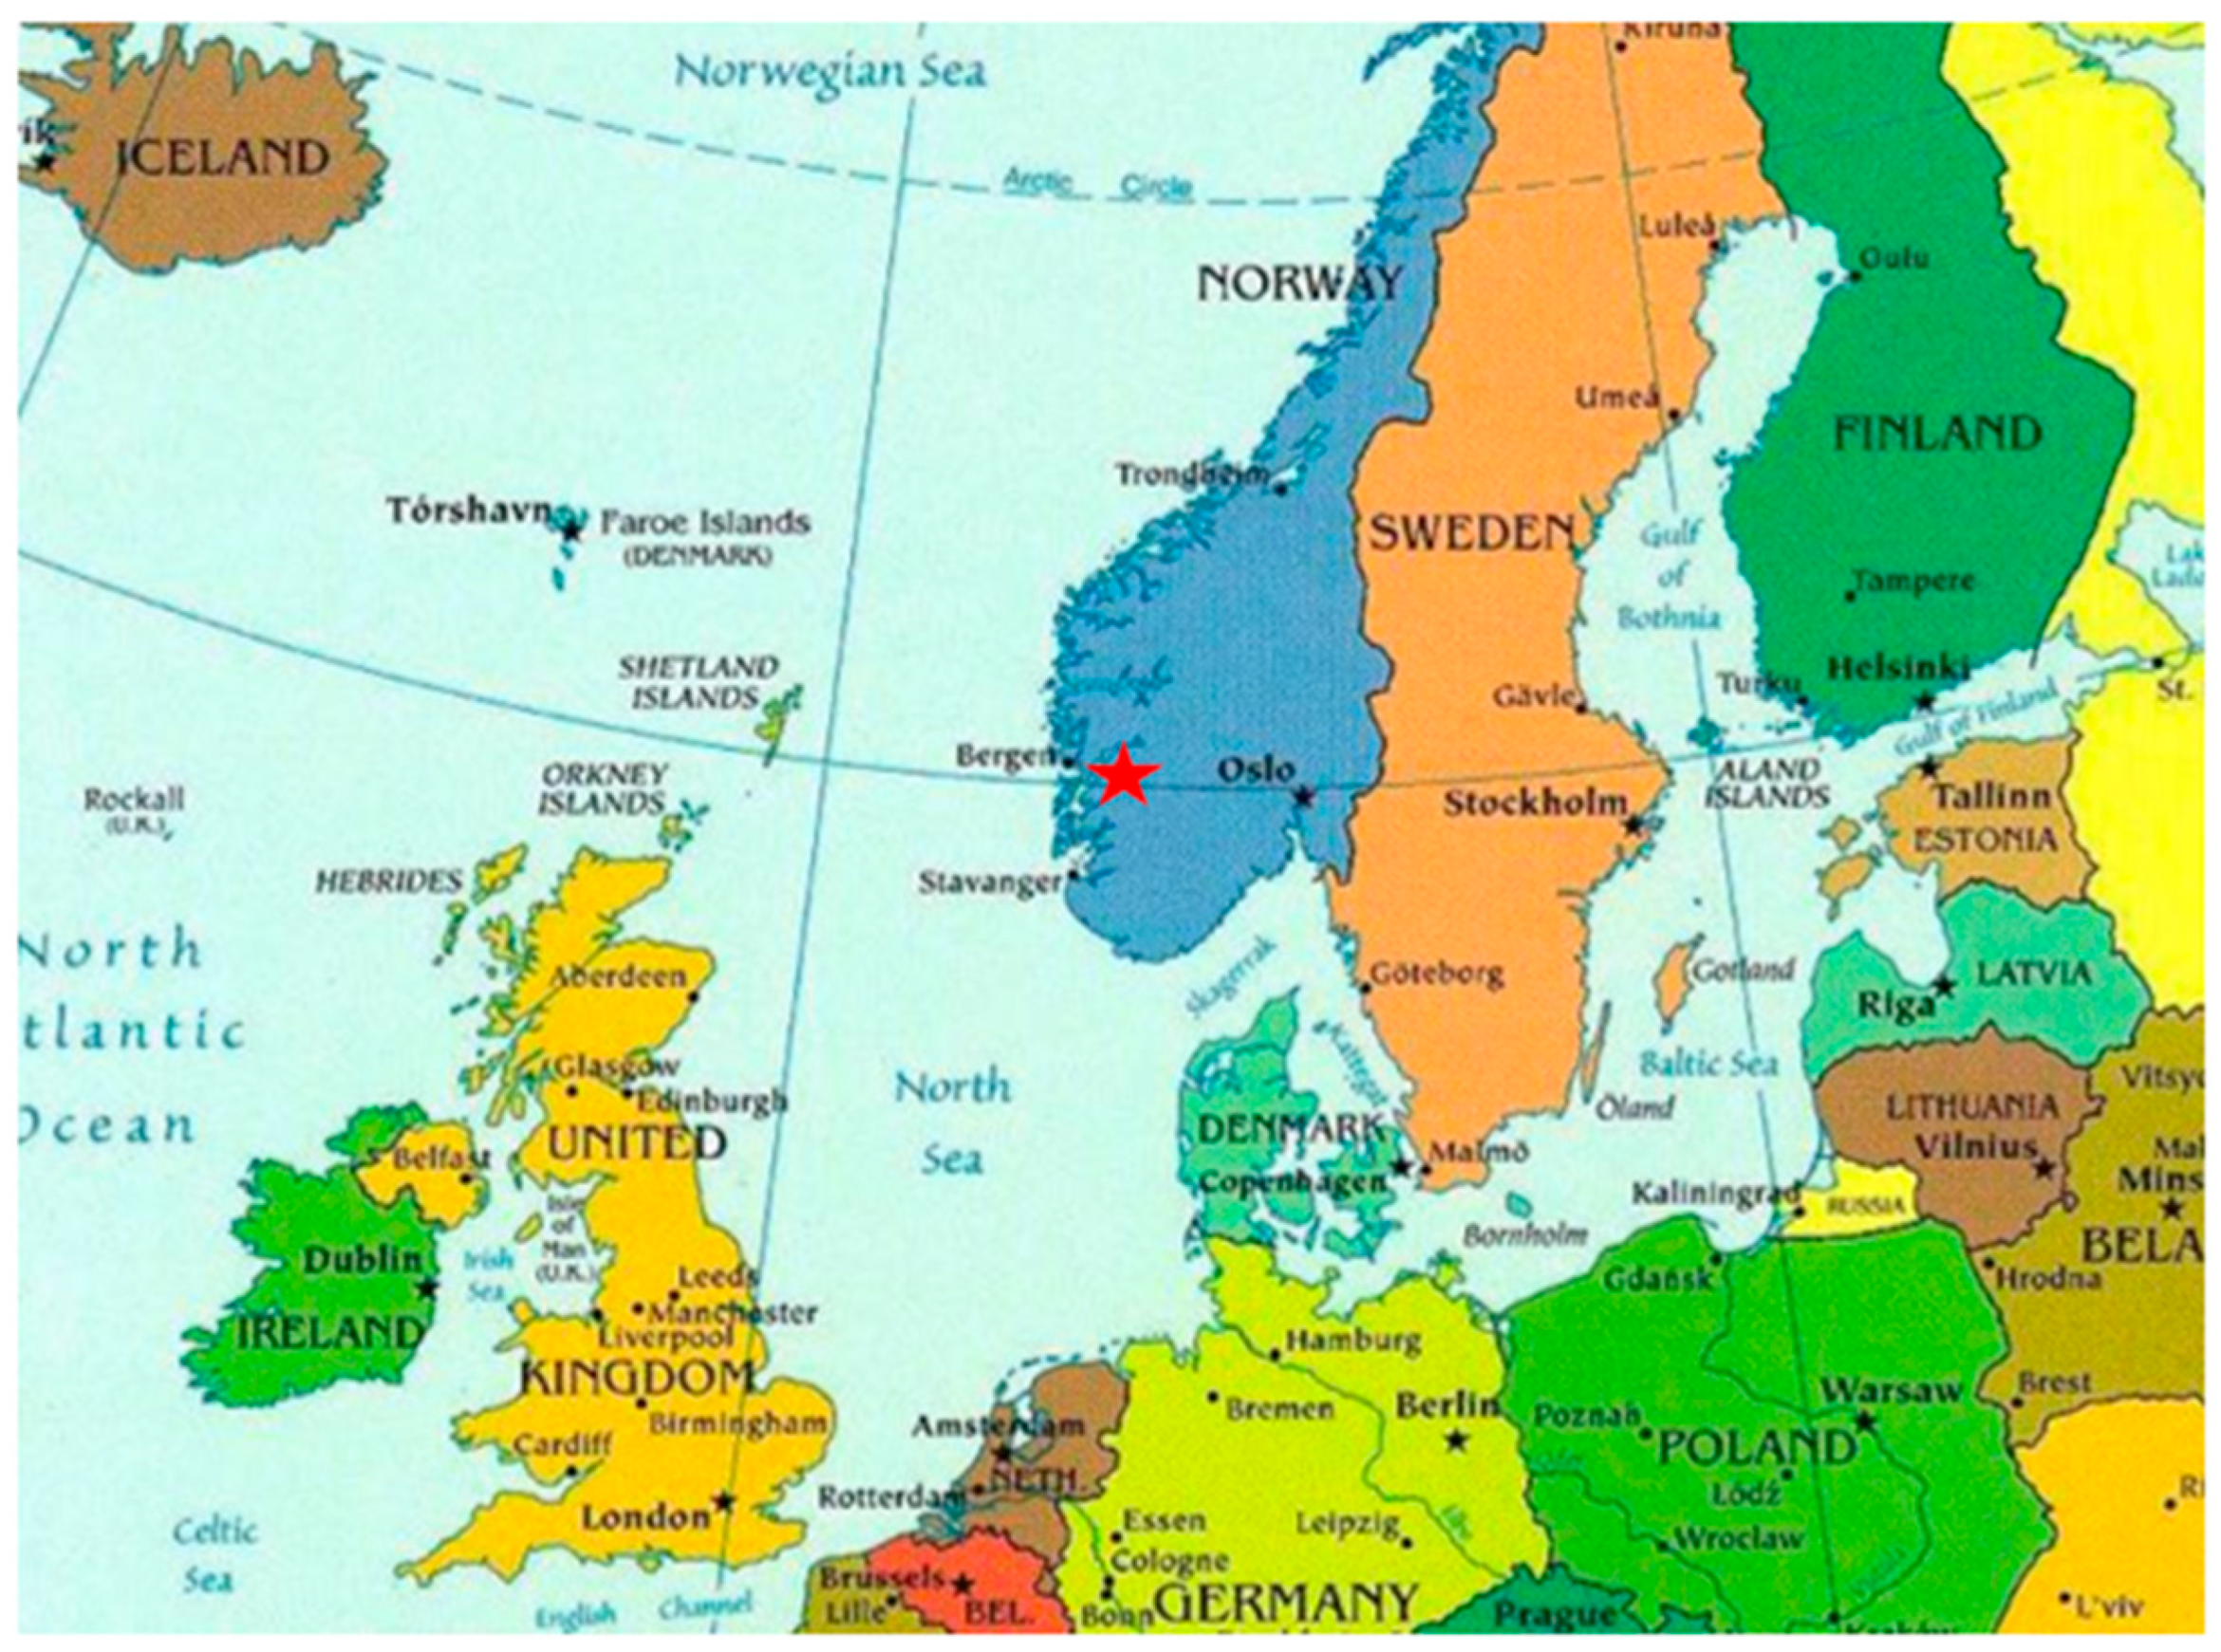
2.1. Location, Plant Material and Soil Conditions

Crop load studies were conducted by the Norwegian Institute of Bioeconomy Research, NIBIO-Ullensvang in 2021–2024. The trial was established with the apple cultivar Fryd (‘Wuranda’) propagated as knip-boom on ‘M.9 T337’ rootstock in a commercial fruit farm in Westland County, Ullensvang commune, Norway (60°34′57.0″ N 6°62′40.0″ E) (Figure 1). The orchard was planted at 3.5 × 1 m distances in 2019. The soil is sandy loam, slightly acidic (pH 5.54 (KCl)), and has 5.54% organic matter content. The orchard is drip irrigated with 0.5 m drip spacing.
Common orchard management practices recommended for the region were applied.

2.2. Crop Load and Return Bloom

The trial was performed in the same orchard for four consecutive years, starting three years after planting. Three crop load levels (low, medium, and high) were established every year according to the tree age and compared with not thinned control in 2021–2022 and thinned trees to one fruit per flower cluster in 2023. According to the tree growth, crop load levels increased gradually: in 2021, there were 20, 30, and 40 fruits per tree; in 2022–2025; there were 35 and 45 fruits per tree; and in 2023–2040, there were 55 and 70 fruits per tree, respectively, to low, medium, and high crop load levels (Figure 2D,E).
Each crop load level was replicated eight times, with a single tree per plot, selecting similarly growing and flowering trees.
The crop loads were set by hand thinning at the fruitlet size 15–20 mm (Figure 2B), retaining a single king fruit in a cluster in 2021 and 2022 and a single fruit or double fruitlets in a cluster to obtain the required fruit number in 2023.
Return bloom was evaluated the following year, recording the number of flower clusters per tree (Figure 2A).

2.3. Tree Growth and Yield

Tree vigor was assessed each spring by the measurement of the trunk diameter at 20 cm above the graft union. Trunk diameter (d) was used to calculate the trunk cross-sectional area (TCSA), using the formula TSCA = π·(d/2)2. Each year similarly growing trees were selected for the studies.
The yield (kg tree−1) and fruit number were recorded on every tree. The fruit average mass (g) was calculated by dividing the yield by the number of fruits harvested per tree.
The final fruit load level (fruit number cm−2 TCSA) was calculated by dividing the fruit number per tree by TCSA.

2.4. Fruit Quality

All fruits per tree were graded in 5 mm size classes, and fruit size distribution (%) was calculated.
Fruit quality characteristics were determined on samples of 10 randomly collected defect-free fruits per tree. Fruit cover color (blush) was evaluated visually using a 1–9 point scale, where 1–0 to 10%, 9–90 to 100% of the fruit surface is covered by red blush. A CTIFL (Centre Technique Interprofesionnel des Fruits et Legumes, Paris, France) 1–9 color chart scale ranging from green to yellow was used to assess the ground color of the apple fruit. Fruit firmness (kg cm−2) was measured using an FTA penetrometer (FT-327, TR Turoni, Forli, Italy) equipped with an 11 mm plunger on two opposite sides of each fruit after removing a disk of skin. The two readings were averaged for each fruit. Soluble solids content (%) was measured with an Atago® Pallete Digital refractometer PR-101 (Atago®, Tokyo, Japan) by collectively juicing 0.5 cm thick slices of all 10 fruits per replicate. The starch index was determined using a 4% potassium iodide and 1% iodine solution (scale 1–9).
Five fruitlets evenly distributed in the tree canopy were selected on each tree to record fruit growth dynamics. All fruitlets were labeled, and the center of the fruit was marked by a permanent marker. Fruit diameter (mm) was measured biweekly after the June drop, using an electronic caliper and placing it on the same marked spot. Due to the drop in marked fruits (due to mechanical or insect damage), fruit size recording was terminated in 2022.

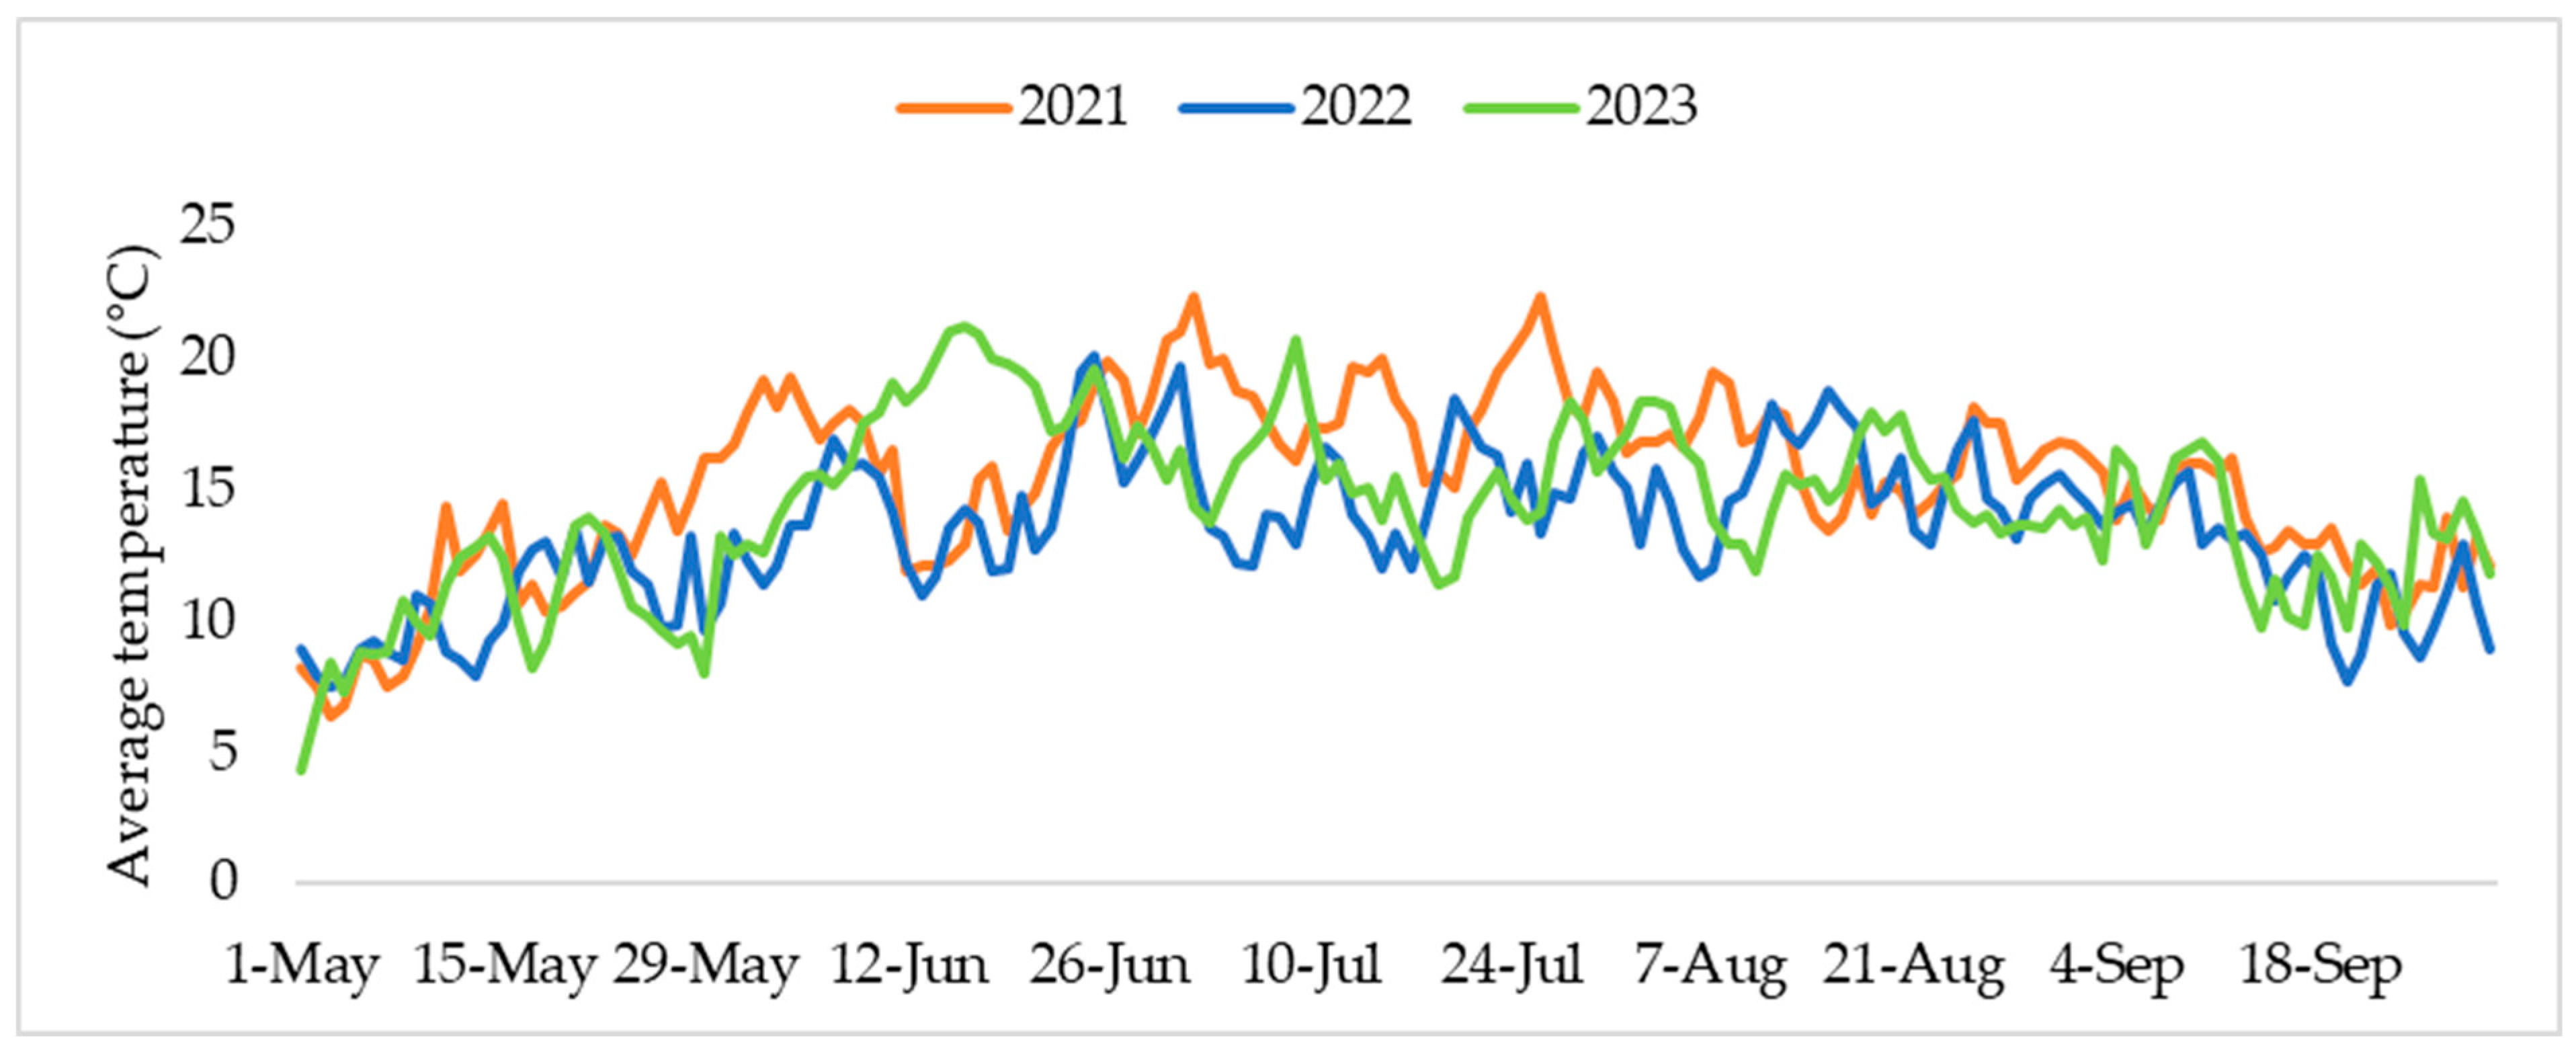
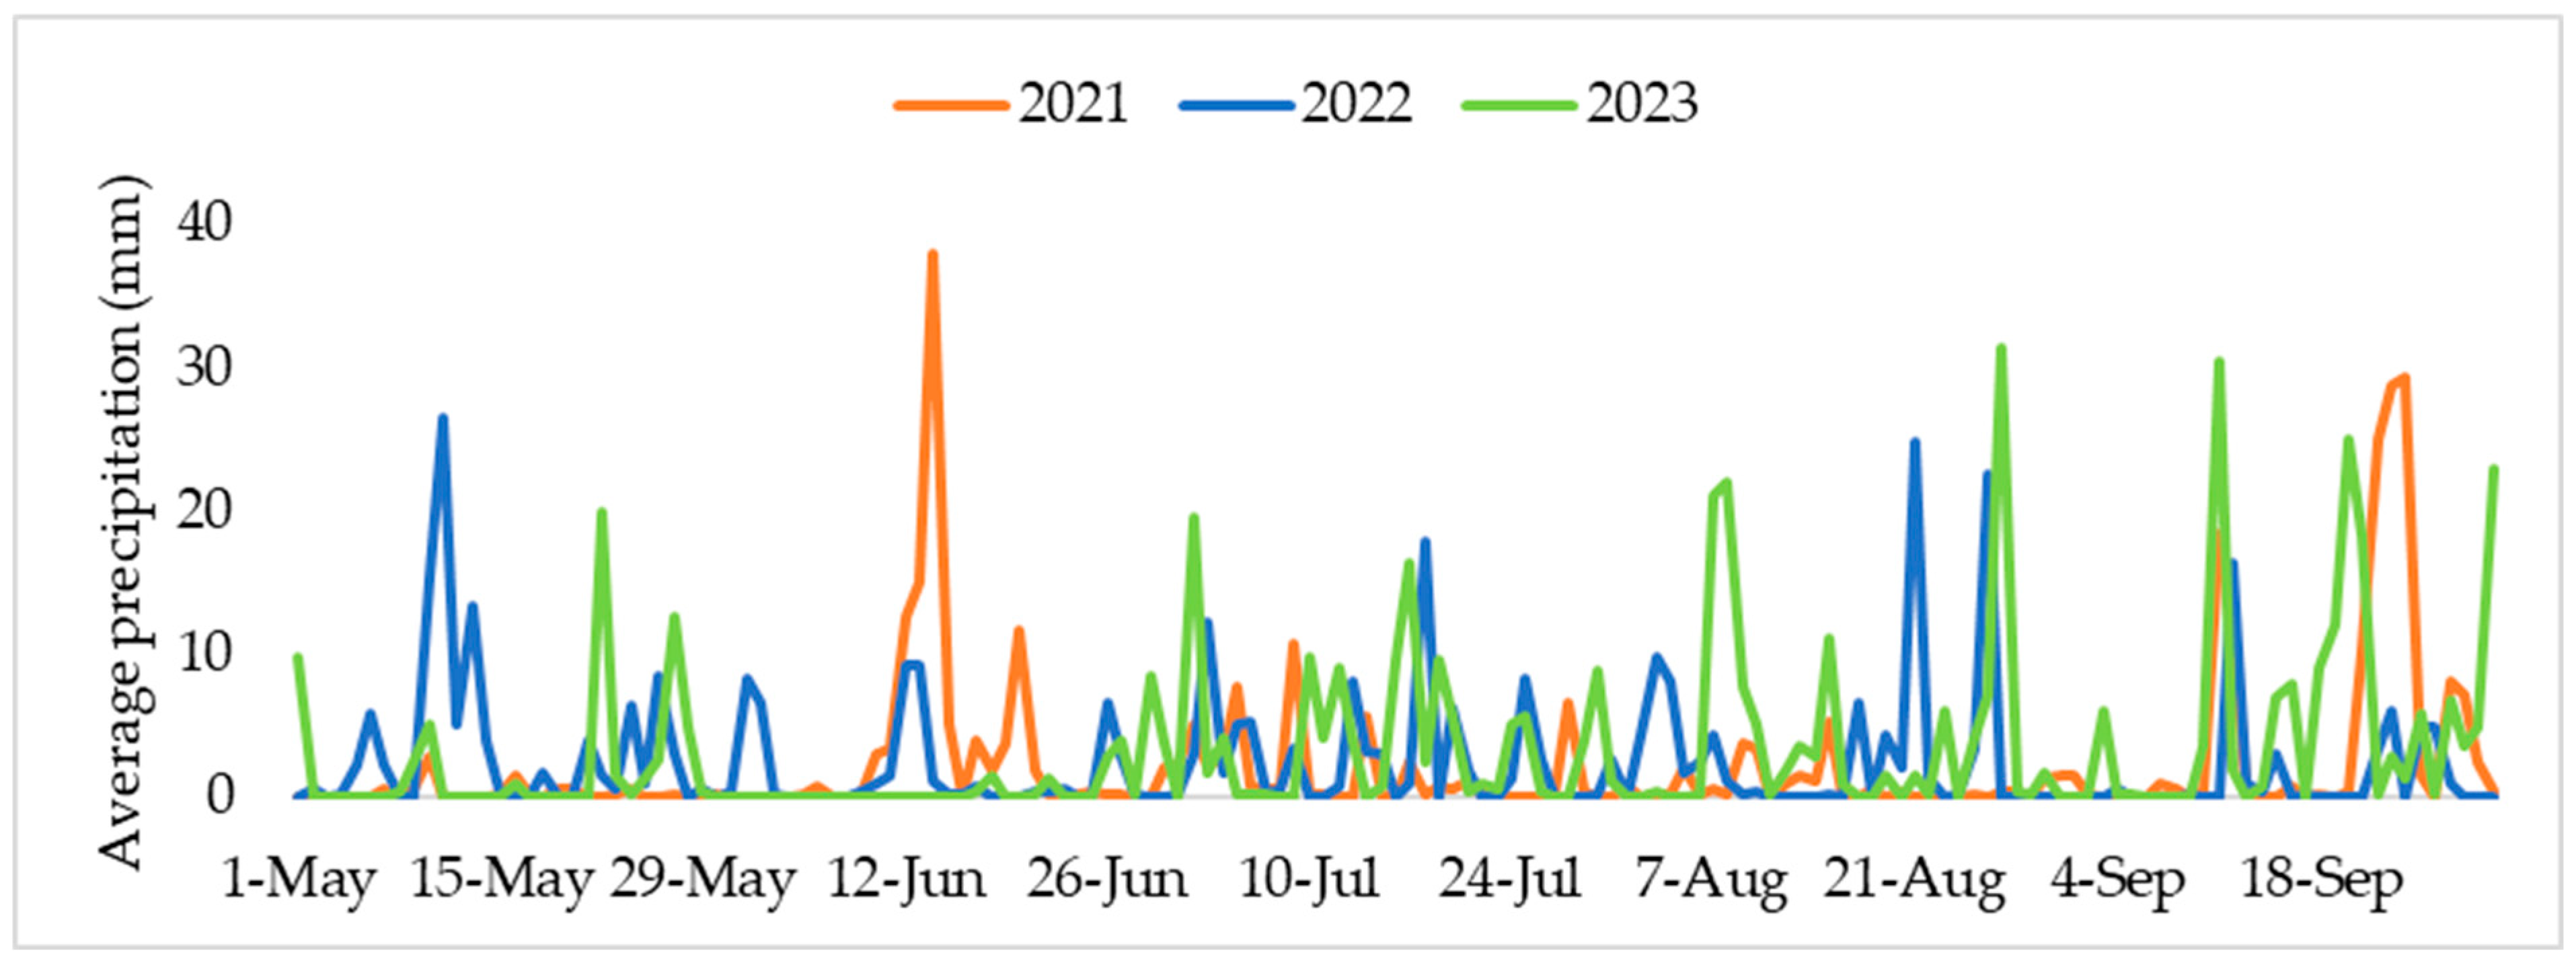
2.5. Weather Conditions

Weather conditions varied between years, and lower average temperatures were recorded in the 2022 growing season (Figure 3). Flowering time in 2022 was 9 days earlier than in 2023 and similar to that of 2021. However, lower temperatures influenced fruit growth and maturation processes; therefore, the harvest time was delayed by 4–8 days (Table 1).
Lower precipitation during the final stages of fruit ripening in 2022 could also negatively influence fruit mass and size (Figure 4).

2.6. Data Analysis

Data were analyzed by a general analysis of variance (ANOVA) for randomized complete block designs, using the statistical program Minitab® 16 (Minitab Ltd., Coventry, UK).

3. Results

3.1. Yield

Apple yield directly depended on the fruit number left on the tree, and significant differences were recorded between all crop load levels (CL) in the first year of investigations (Table 2). In 2022, despite different numbers of fruits, the yield was similar at medium and high CL, but significantly higher than at low CL and significantly lower than in the non-thinned control. The yield of control trees was the highest in 2023 again but did not differ significantly from the high CL. Apple tree cropping at low and medium CL was significantly less but was similar to each other in the five-year-old orchard.

3.2. Fruit Mass

A very high average fruit mass was recorded in the three-year-old orchard at all CL and equaled 210–229 g (Table 3, year 2021). No significant differences were established between adjusting CL, and only the average fruit mass from control trees was significantly lower than from trees where the fruit number was regulated to a different extent. Due to unfavorable growing conditions, fruit mass dropped in the 2022 season; however, no significant differences were recorded between fruit mass at low and medium CL. In the five-year-old orchard (2023), when more fruits were left, fruit mass significantly decreased along with increased CL, but there was no difference between average fruit mass at high CL (70 fruit tree−1) and thinned to one fruit per cluster control.

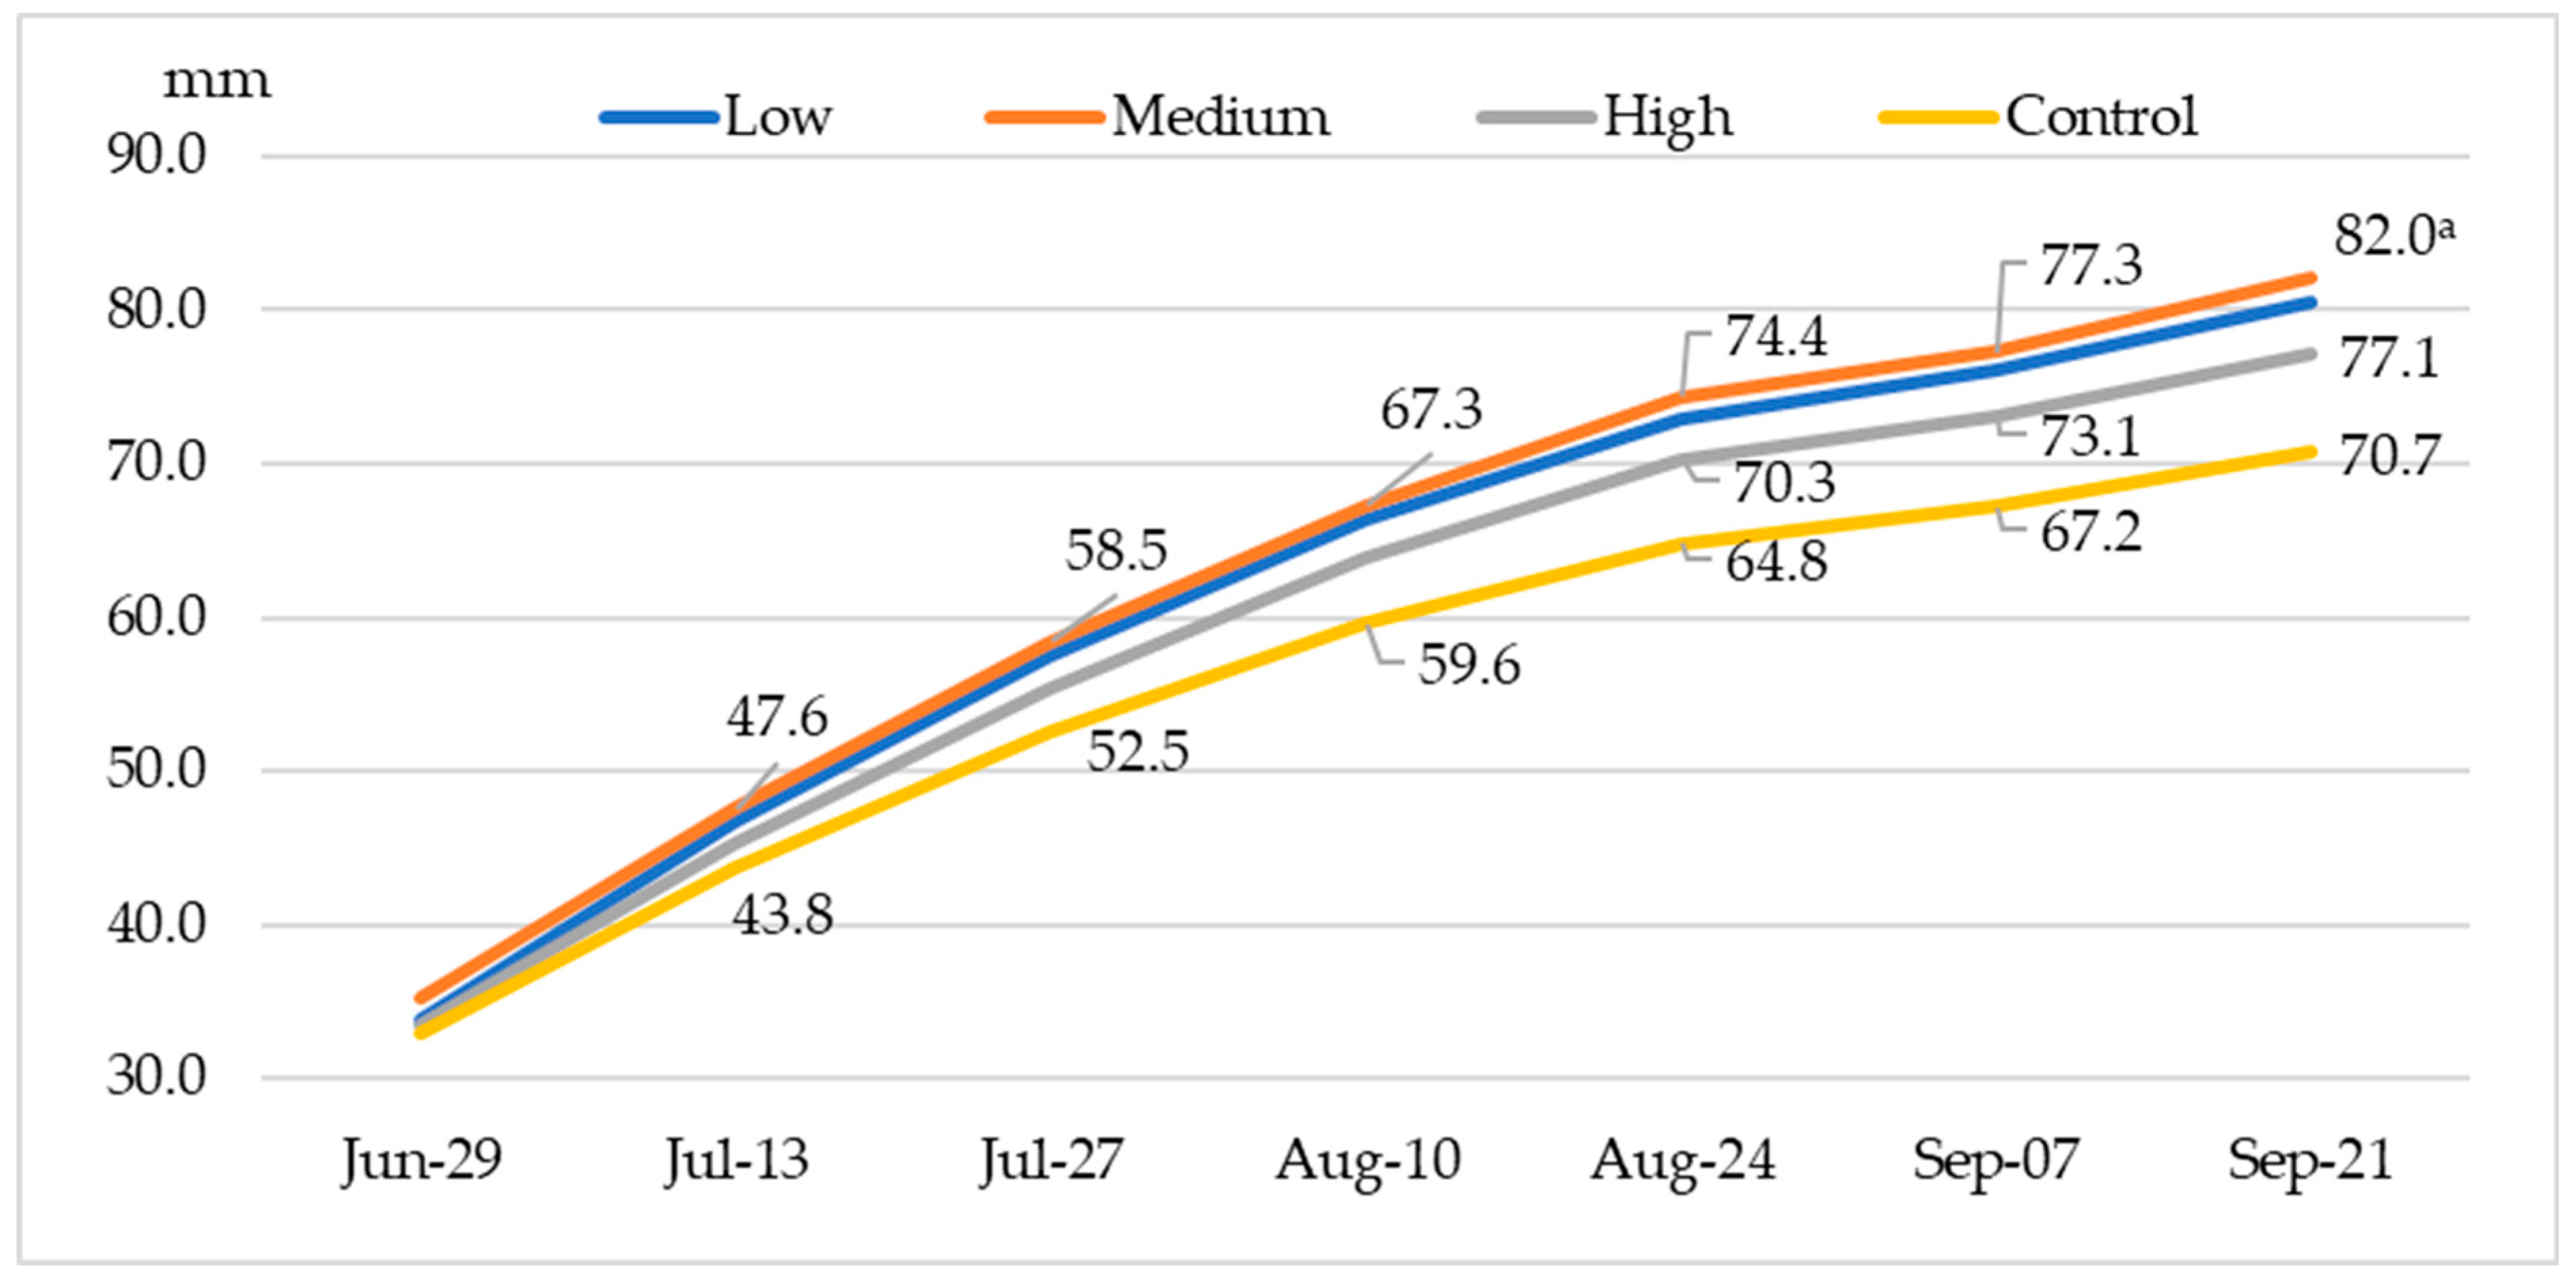
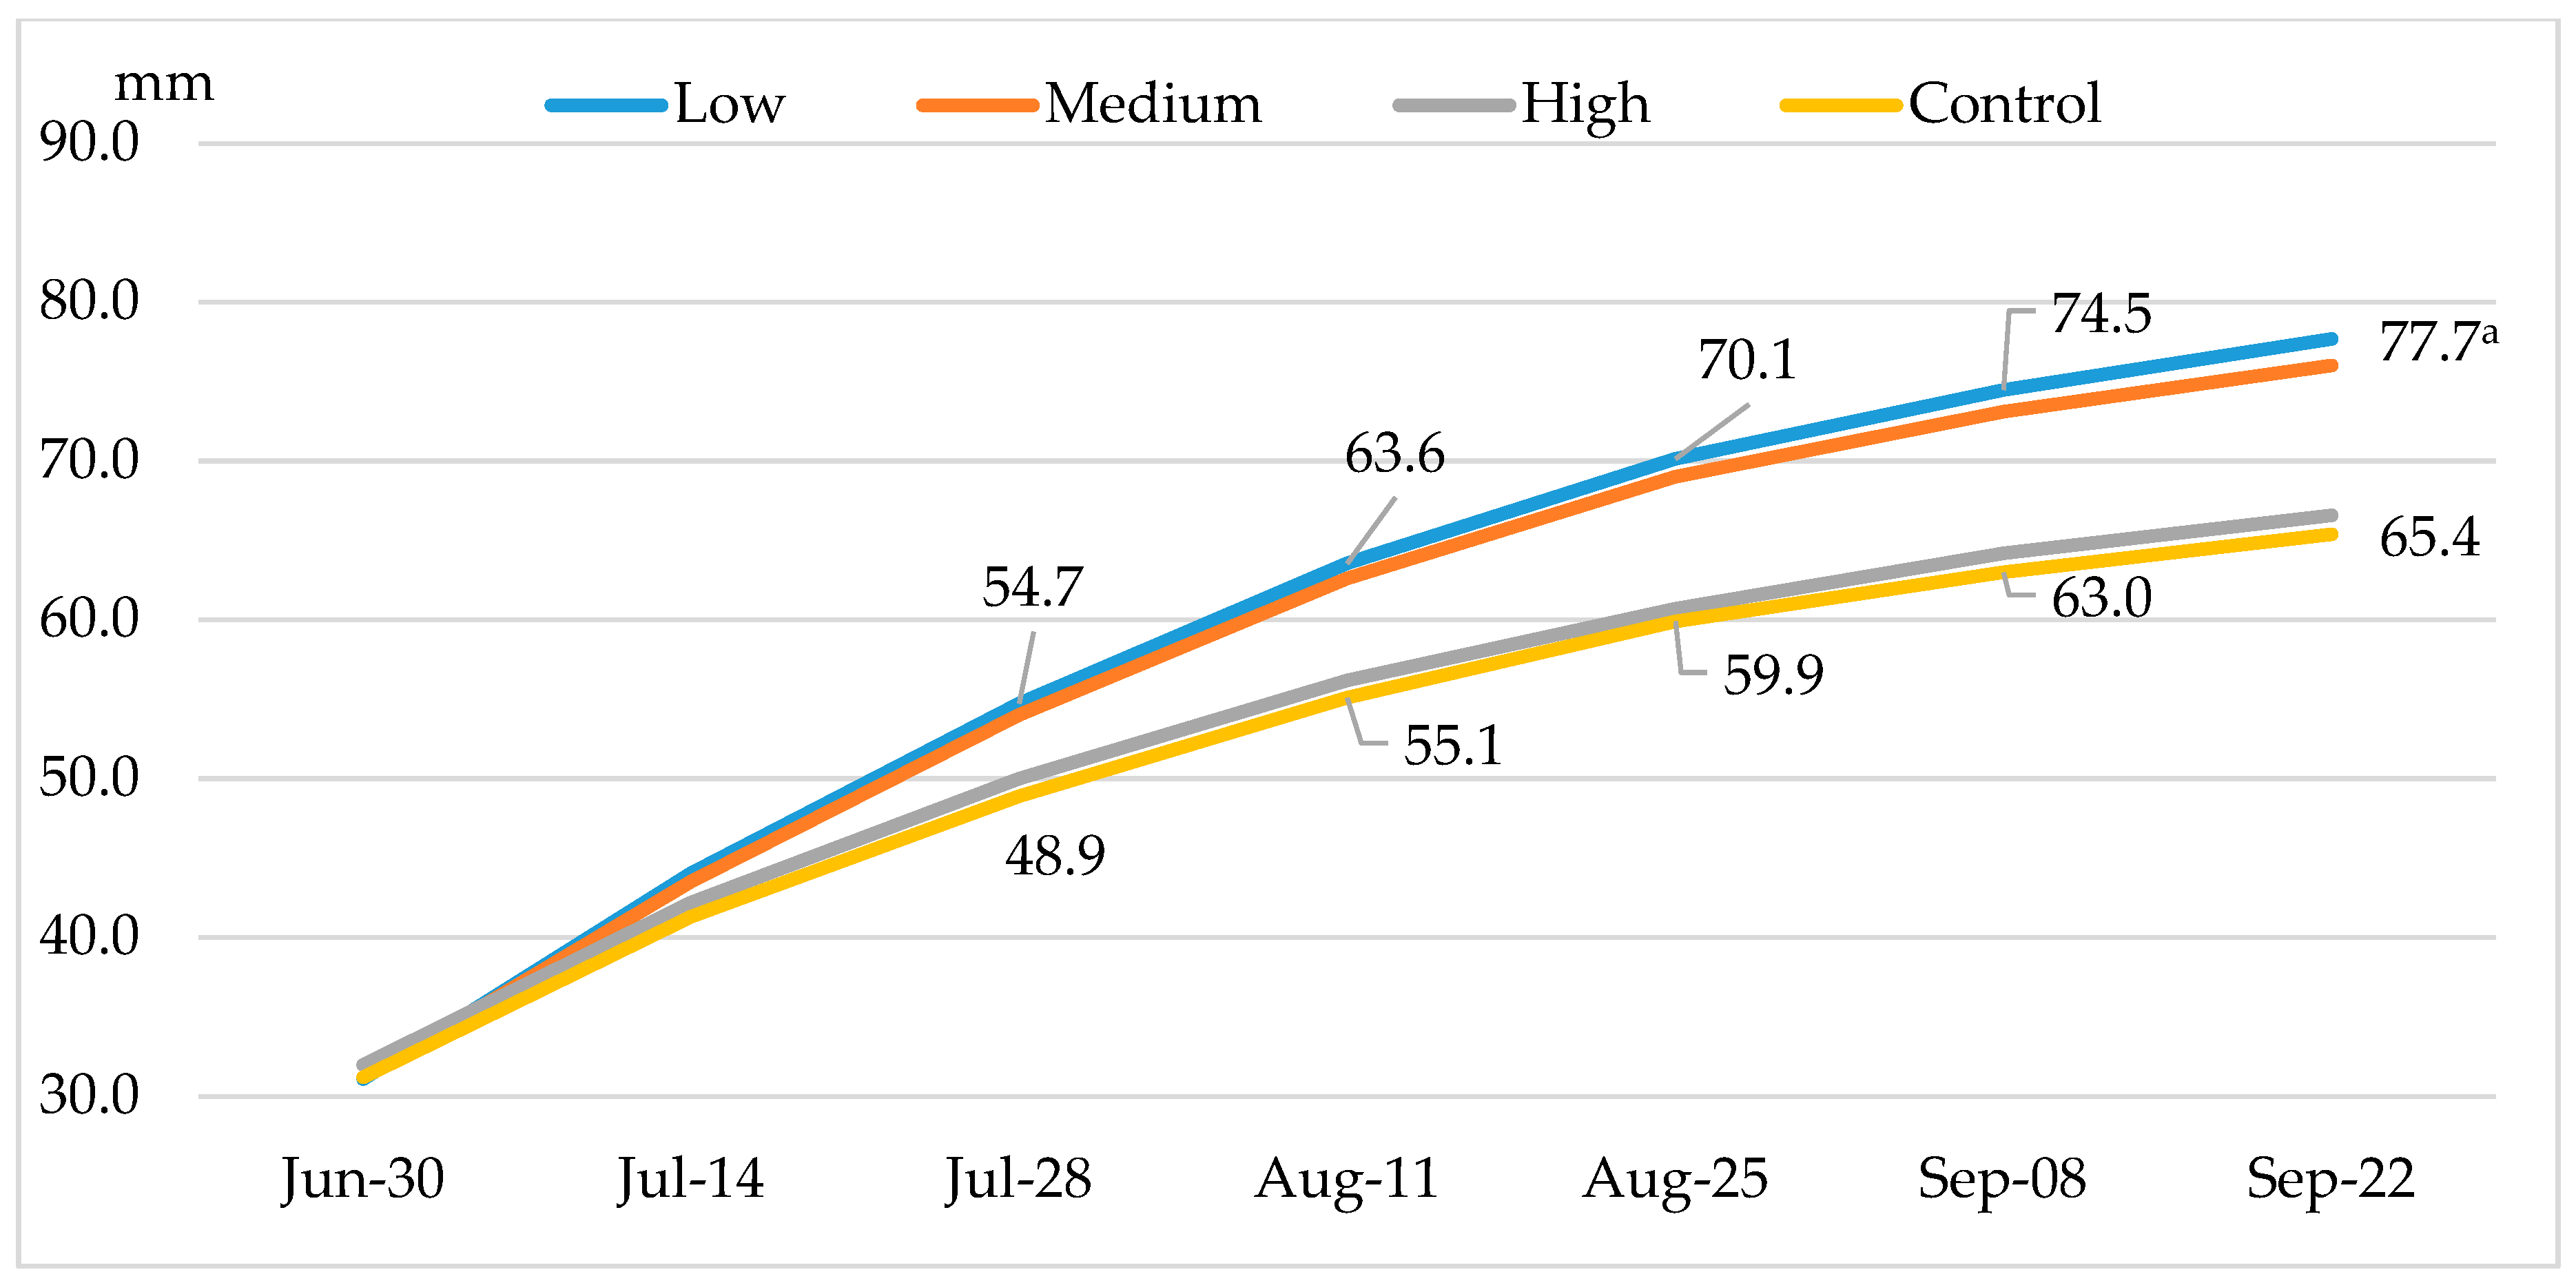
3.3. Fruit Growth Dynamic
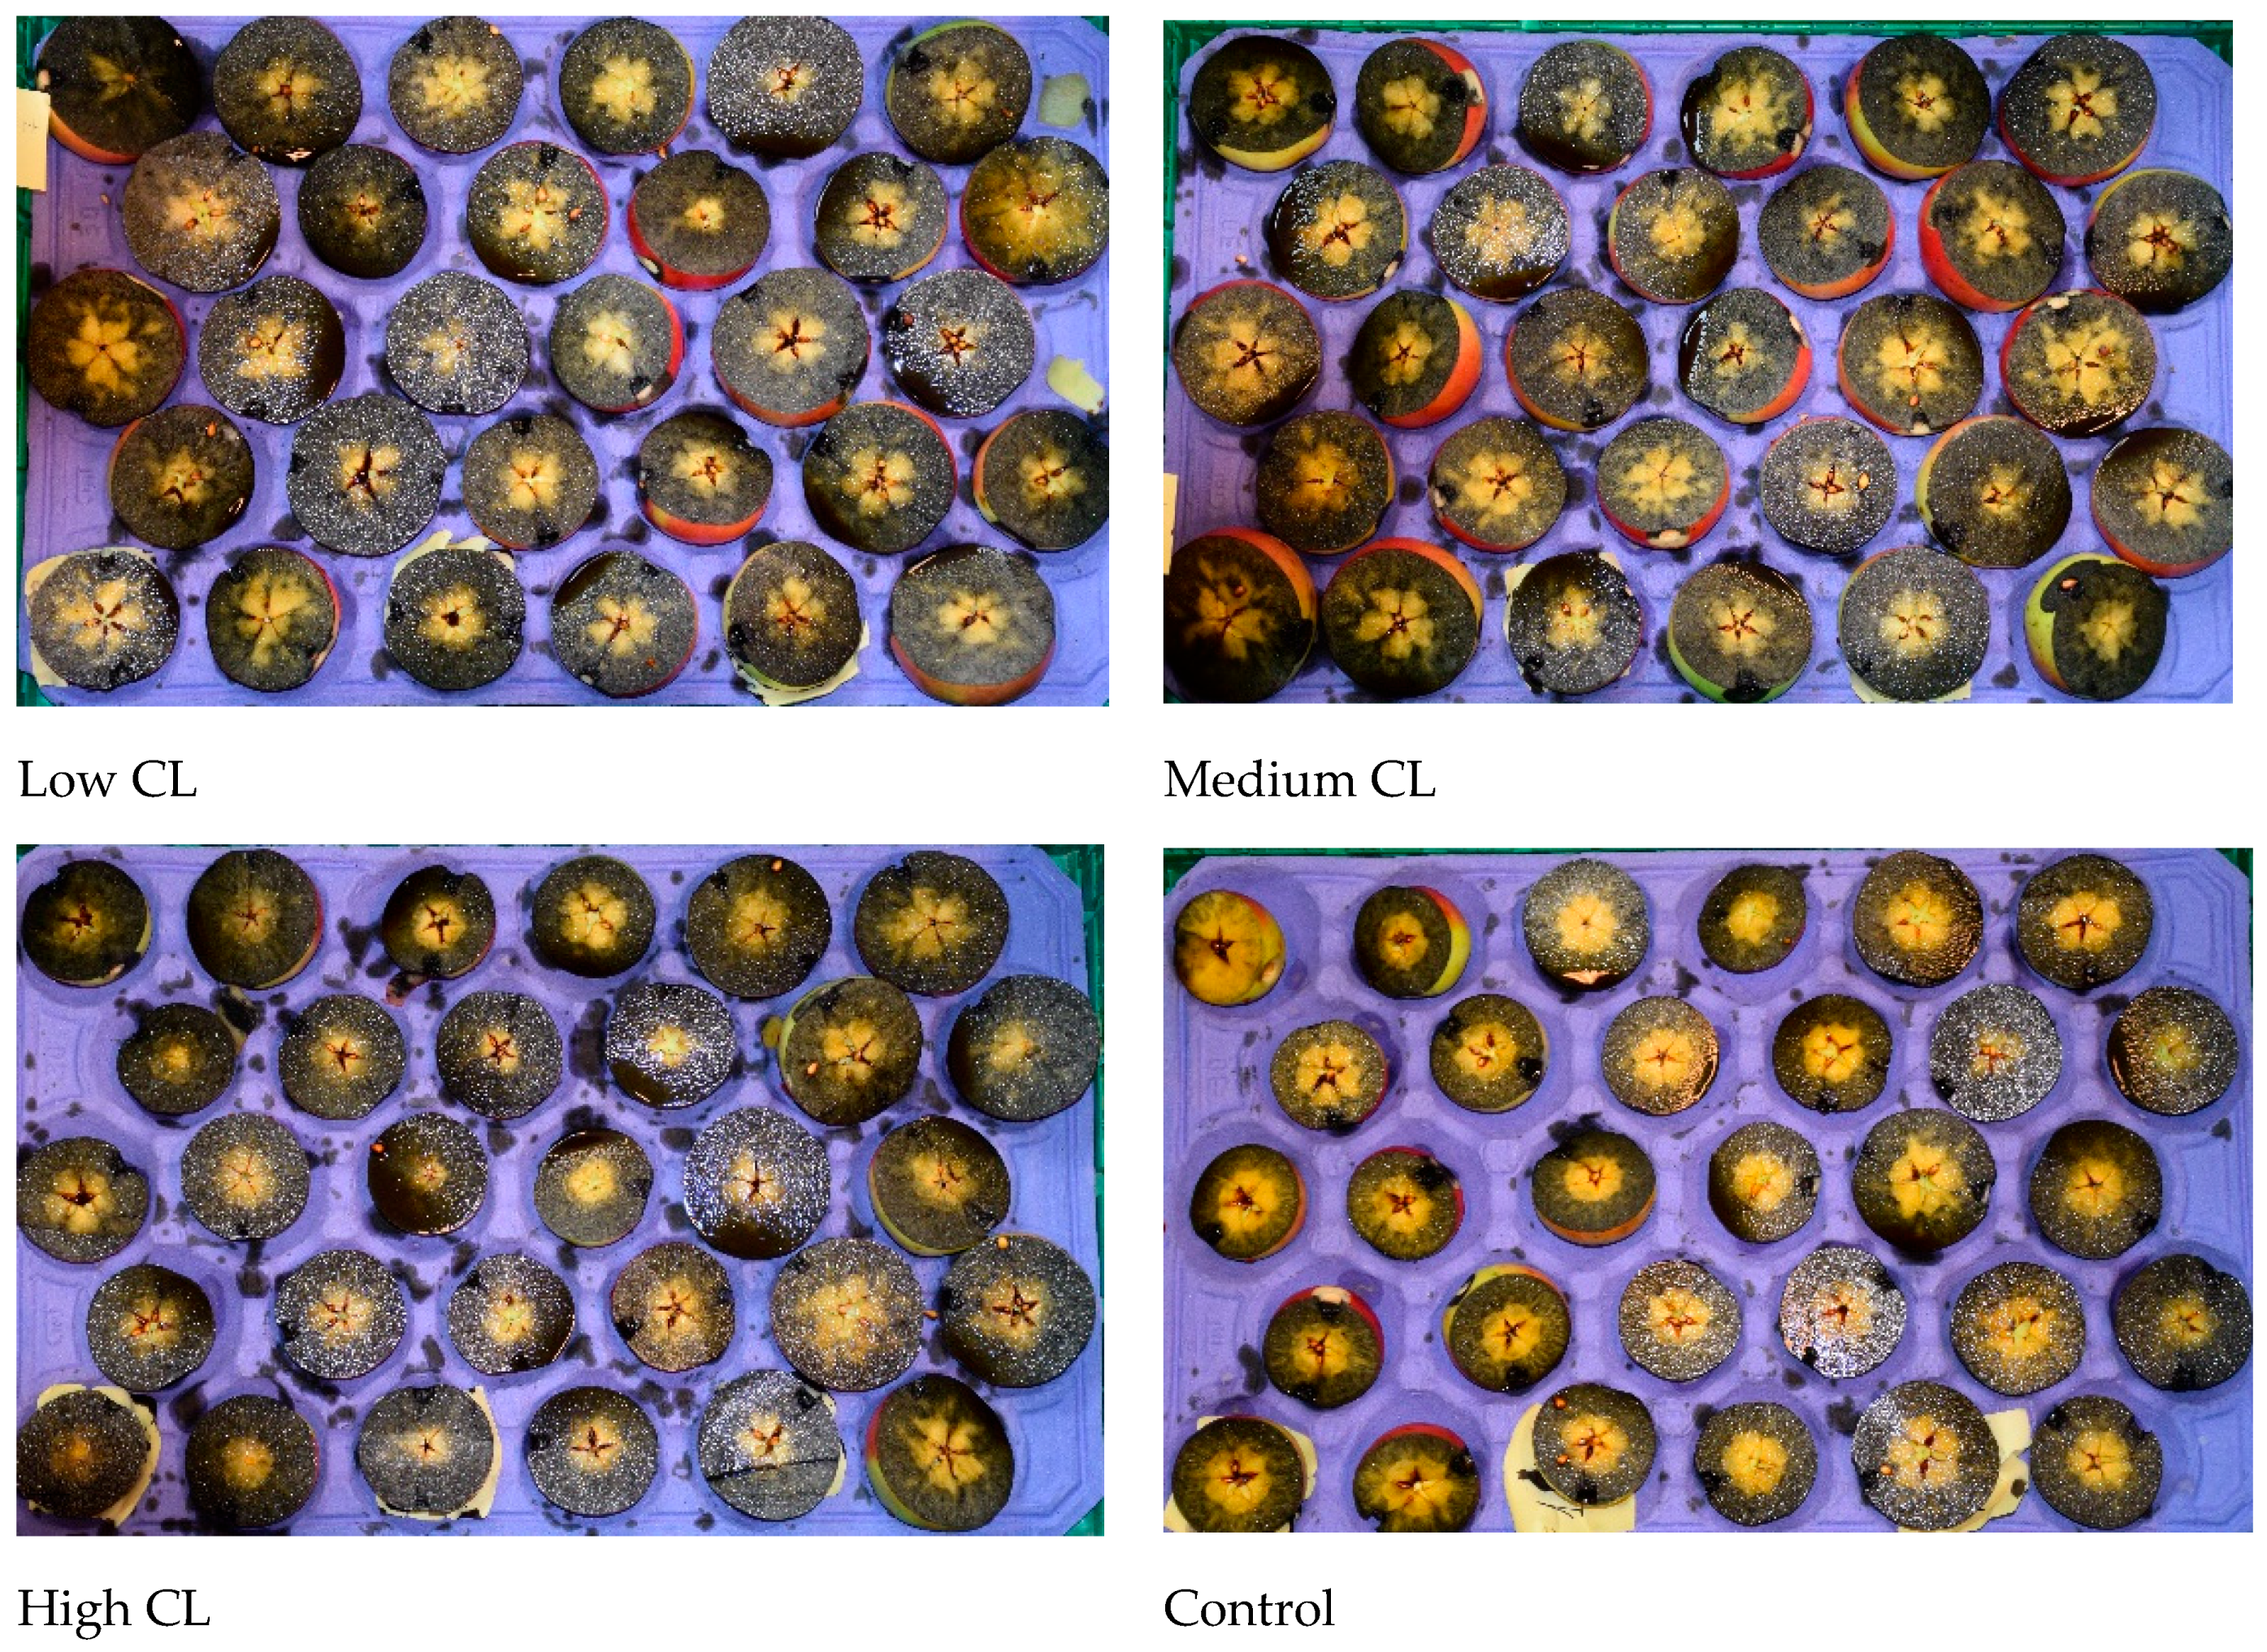
Fruit growth at low and medium CL was very similar in the three-year-old orchard (Figure 5) and did not differ at any measurement date. Slower fruit growth in the non-thinned control was established already after 2 weeks of measurements, and differences in fruit diameter gradually increased during the growing season, reaching 11.3 mm compared with low CL. Final fruit diameter at high CL was also significantly less than at low and medium CL; however, significant differences appeared only during the last month of fruit growth.
In five-year-old orchards, fruit growth dynamics were similar again at low and medium CL (Figure 6). No differences in fruit diameter were observed at high CL and thinned to one fruit per cluster control. However, between these two groups, significant differences in fruit diameter appeared at the end of July (5.8 mm). A significantly slower fruit growth rate at high CL and control was maintained during the rest of the season and reached a 12.3 mm difference at the last measurement date.

3.4. Fruit Size

The standard for class 2 apple fruits in Norway is between 60 and 85 mm (up to 90 mm for some large-fruited cultivars). The fruit diameter of 45% of the fruits at medium and low CL was 80 mm in 2021 (Figure 7). Furthermore, 37% of fruits at low CL and 30% of fruits at medium CL had a diameter larger than 80 mm. At high CL, the fruit diameter was smaller, and most of the fruits were distributed in three grading classes: 75 mm, 80 mm, and over 80 mm. A very large fruit size variation was established in the non-thinned control, and the share of fruits larger than 70 mm was only 27%.
Lower average temperatures during the growing season and lower precipitation levels during the fruit-ripening stage resulted in smaller fruit sizes in the 2022 season. Very similar fruit size distributions were observed at medium and low CL, where the majority of fruits fell into three grading classes: 70, 75, and 80 mm. The majority of fruits at high CL and the control fell into three classes too, but fruits were smaller and concentrated between 65–75 mm and 60–70 mm, respectively (Figure 5 and Figure 7).
A similar fruit size distribution was observed at medium and low CL in 2023, with two main classes: 75 and 80 mm. No differences were recorded between high CL and thinned to one fruit per cluster control. The majority of fruits were graded to 70 and 75 mm classes.

3.5. Fruit Quality Parameters
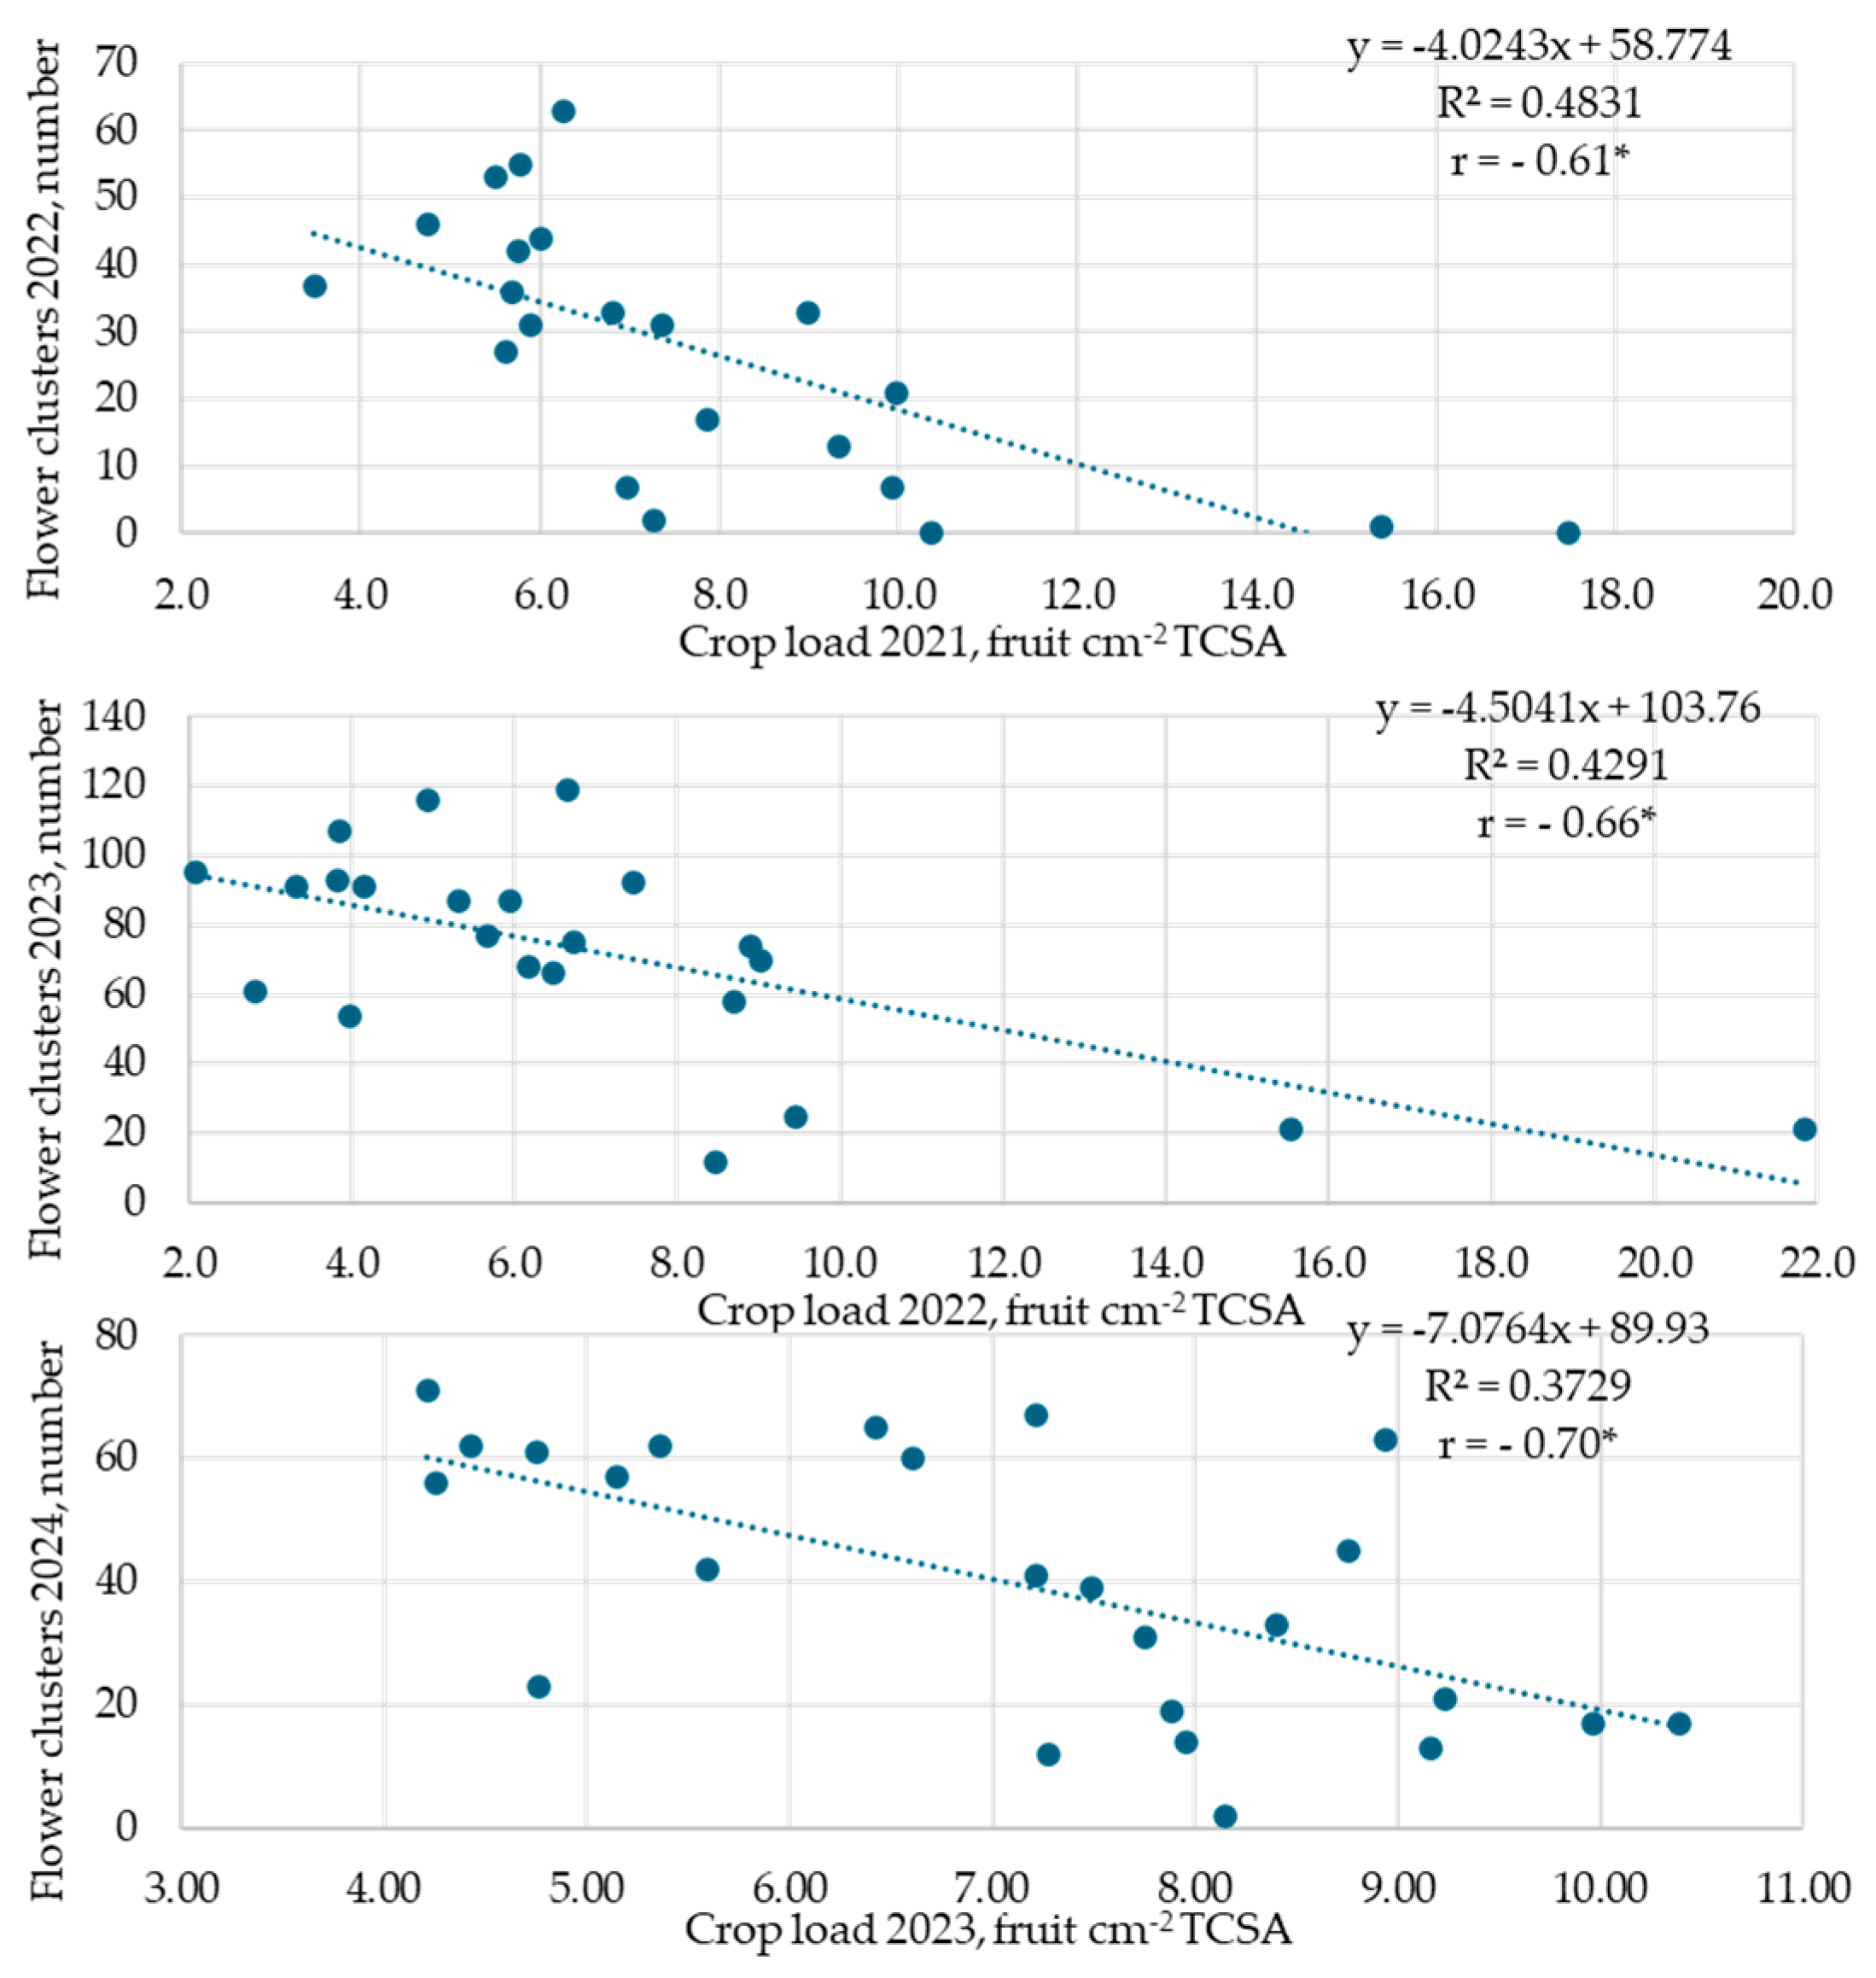
CL did not affect the fruit-soluble solid content (SSC) in any year of the investigation (Table 4). CL also had no significant effect on the starch index, except in 2022, when some significant differences were established between the non-thinned control and low CL, indicating faster maturation of fruits from overcropped trees (Table 4, Figure 8).
Fruit blush and fruit ground color did not depend on CL, but significantly higher values were established compared with the non-thinned control in 2021 and compared with fruit blush at low CL and control in 2022.
A significant effect of CL on fruit firmness was also not established. Only fruits from non-thinned trees were significantly softer in 2022.
CL did not affect any of the tested fruit quality parameters at full-bearing age in 2023.

3.6. Return Bloom

Apple yield per hectare varied according to CL level from 14.8 up to 30 t ha−1 in a three-year-old orchard in 2021 (Table 5). After relatively high yields, return bloom in 2022 was suppressed, and only at low CL did it reach 42 flower clusters per tree. Return bloom at medium and high CL was significantly lower, with only 25–26 flower clusters per tree. Non-thinned trees in the control had almost no flowers and significantly differed from all CL levels.
The apple yield in 2022 was similar to the yield in 2021 and varied from 15.4 to 33 t ha−1. An abundant return bloom in 2023 was recorded at low and medium CL. High CL significantly reduced the number of flower clusters; however, 62 clusters per tree was sufficient for a moderately high yield. The return bloom of non-thinned trees reached only 18 flower clusters per tree.
The yield variation in a 5-year-old orchard was 27 t ha−1 at low CL to 36.7 t ha−1 in the control. High yields negatively affected the return bloom of control trees and trees with the high CL. The number of flower clusters was significantly higher at low and medium CL and equaled 63.4–66.4 clusters per tree.
Return bloom was strongly negatively correlated with the fruit number per cm2 of trunk cross-sectional area (TCSA). The correlation coefficient during the investigation period was minus 0.61–0.70. The correlation chart revealed that 5.5–6 fruits cm−2 TCSA in a three-year-old orchard (2021) guaranteed a sufficient return bloom of Fryd (Figure 9). When fruit number exceeded this limit, the number of flower clusters in the next year was significantly reduced. In a four-year-old orchard (year 2022), the optimal fruit number was 7.5–8 fruits cm−2 TCSA and 6.5–7 fruits cm−2 TCSA in the fifth year (year 2023).

4. Discussion

The successful introduction of new cultivars depends on the research and evaluations of complex parameters essential for the consumers, market, and fruit producers. Failure in one of these steps can make a new cultivar undesirable. Despite having fruits with good taste and appearance, new cultivars can fail because of a lack of productivity, sensitivity to different disorders, or other issues related to growing technologies. Before introducing a new cultivar, a whole package of recommendations for the growers must be prepared. One of the first tasks is the establishment of optimal cultivar-specific crop loads based on the combination of productivity, fruit quality, and return bloom data.
In the current experiments, yield in the young ‘Fryd’ orchard was directly related to the fruit number on the tree, while in the mature orchard, it depended not only on CL but also on the average fruit mass. In the first fruiting year, when fewer fruits were left on the tree, CL had no obvious effect on average fruit mass; however, fruit mass from non-thinned control trees was 33–37% lower compared with medium and low CL in the first two years of the experiment. In the third year, when control trees were thinned to one or two fruit per cluster, a usual practice for most cultivars grown in Norway, the average fruit mass was equal to that of high CL trees, but 16% lower than the average fruit mass of low CL trees. In the four- and the five-year-old orchards, the fruit mass of cv. Fryd was negatively correlated with the fruit number per tree and dropped significantly at high CL, thus decreasing yield. Negative correlations between fruit mass and fruit number per tree have been established not only for apples [13,15,16] but also for many other major fruit species such as pears [17], peaches [18,19], plums [20], and cherries [21].
The regulation of fruit number per tree impacted the fruit growth rate. Differences in fruit diameter had already appeared two to four weeks after the establishment of different crop load levels and steadily increased from 8–11% to 14–16% at harvest. More assimilates are available per fruit at lower CL, thus allowing for a more rapid fruit growth rate and higher final fruit mass [14,22]. The leaf–fruit ratio is lower at higher CL, and it limits the availability of photosynthates [23] and, consequently, metabolites like organic acids [24] and sugars [25]. Metabolite profiling was proposed to create models to distinguish low and high-cropping trees and predict fruit quality [26].
Crop regulation of cv. Fryd enables us to achieve very even fruit growth. At any crop load level, the majority of fruits fell in only two size grading groups, while in non-thinned control fruit, the diameter was very variable. Only in 2022, when the season was not favorable for fruit growth, was the fruit size variation at all crop levels somewhat higher, but even then, more than 70% of fruits were distributed in three size-grading groups.
Crop-load-dependent fruit size is usually related to fruit maturation processes and fruit quality parameters. Larger fruits from low-cropping trees often have better coloring and higher soluble solid and dry matter content [14,25,27]. Overcropping trees produce smaller fruits, which tend to be softer and less colored, but simultaneously, have delayed maturity [13,22]. Studies on the chlorophyll degradation rate (IAD) exhibited the same tendency of delayed maturity at increased crop load levels [14]. Cv. ‘Honeycrisp’ apples also did not obtain characteristic flavor when the crop load was high [4]. Crop load had a significant effect on postharvest fruit quality as well [28,29,30], which can be caused by a higher leaf–fruit ratio and is directly related to carbon partitioning to fruits [31], which is more apparent at lower CL. At higher CL with diminished leaf–fruit ratios, stronger competition for the resources among fruits appears and may be a reason for inferior fruit quality [3]. Surprisingly, different crop load levels in our trial had little impact on cv. Fryd fruit quality parameters, including blush, ground color, firmness, soluble solid content, and starch degradation. Significant differences were found only in comparison with the non-thinned control and only in the young orchard. Furthermore, soluble solid content, one of the main fruit taste indicators, did not depend on crop load level, and no differences were found compared with control trees with much smaller fruits. A decreasing trend in SSC was noticed over the trial period at all crop load levels; however, this may be related to the variation in weather conditions and harvest timing in different years of the study. Limited studies have reported that there is no correlation between CL and soluble solid content [32] or that the effect of CL on fruit quality parameters is inconsistent [33]. Scalisi et al. [34] found that crop load had no effect on fruit flesh firmness and the starch index, which is in line with our results, indicating that cv. Fryd has very stable fruit internal quality parameters.
Fruit yield at medium CL was similar in the first and the second seasons and equaled around 20–22 t ha−1. However, such a crop in the first season was too high and trees started developing a biannual bearing pattern. During the second growing season, in contrast to the previous year, more vigorous trees could handle the same crop without suppressing the return bloom the following year. Similar findings that the optimal crop load in one year can cause great differences in return bloom the next year were found in other studies too [35]. In the five-year-old orchard, fruit number per tree was more correlated with return bloom than yield was with return bloom, with a correlation coefficient that reached only 0.27. Regarding more, smaller fruits at higher crop load levels, the yield difference compared to the lower crop level with fewer but larger fruits was not as obvious as the difference in return bloom. This indicates that a higher number of fruits and therefore a higher number of seeds produce larger amounts of hormones that inhibit flower bud initiation for the next year [36,37,38]. In contrast, annual cropping trees have significantly higher content of cytokinin, abscisic acid, phenylpropanoids, and flavanols, which are known as promoters of flower bud induction [39].
Campbell and Kalcsits [35] indicated two main theories explaining biennial bearing: phytohormone signaling and resource competition for nutrients and carbohydrates. Though more knowledge on carbohydrate and hormone cycling/signaling is continuously gained, the impact of crop load on return bloom is still poorly understood. Similarly, a review by Kumar et al. [40] stated that information about promotors and repressors of apple flowering is still lacking.
Fruit number cm−2 TCSA is a more precise indicator of optimal crop load level compared with fruit number per tree in young orchards. Due to growth variation, trees with the same fruit number per tree had variable fruit numbers per TCSA and differed significantly in return bloom. However, there is a tree age limit when the fruit number per TCSA can be an indicator of crop load. Tree trunks become larger every year, and keeping the same fruits cm−2 TCSA level will lead to the overcropping and suppression of flower bud initiation. In the last year of the experiment, when the optimal fruit number per TCSA started to decrease, this was the case. In full-grown orchards, when tree canopies occupy all allocated space, fruit number per tree again becomes the main indicator of crop load levels.
Establishing the optimal crop load level according to orchard age combines as high as possible yield of high-quality fruits and good return bloom. When optimal crop load is maintained, cv. Fryd does not turn to biennial bearing and guarantees stable incomes for growers throughout the life of the orchard. Too low or too high crop load levels reduce the profitability of apple fruit growing by lower yield values in the first case, or possibly by higher incomes only every second year in the second case since poorer fruit quality at high crop load levels can result in a reduction in marketable fruits.
The optimal yield to keep the orchard in annual fruiting mode depends on many factors. Cultivar genetics plays an essential role in this, but even the same cultivar on different planting and training systems or exposed to different orchard management or different climate conditions can have significantly different yields. In the EUFRIN multilocation apple rootstock trials, the yield of cv. ‘Galaval’ on the same rootstock varied significantly between countries, and when comparing Norway with some southern European countries, 2–3-fold lower yields were achieved [41]. The yield of ‘Honeycrisp’ and related cultivars can differ due to growing site or orchard management. In Washington state, ‘Honeycrisp’ planted at 2.5 × 0.9 m spacing produced yields between 29 t⋅ha−1 and 76 t⋅ha−1 depending on the crop load level [14], while ‘WA38’ produced stable yields of 80 t⋅ha−1 [3]. In a cooler, maritime climate of Nova Scotia, Canada, the yield of ‘Honeycrisp’ (22–32 t⋅ha−1) was similar to our trial results; however, trees were grafted on M.26 rootstock and planted at broader distances [16]. In Norwegian growing conditions, with a shorter, cooler growing season, there is a yield limit of 30 t ha−1 for five-year-old cv. Fryd to maintain a regular bearing pattern; 35 t ha−1 and higher yields turn the trees toward biennial bearing. Additionally, a steady yield increase according to the orchard age is important to maintain a regular bearing of cv. Fryd.
Biennial bearing management must be crop- and cultivar-specific. Crop-load recommendations must be site-specific as well, as they depend on planting density and training systems, which can vary in commercial apple orchards [16,35]. According to our investigations, the optimal crop load levels for cv. Fryd are 5.5–6 fruits cm−2 TCSA in three-year-old orchards, 7.5–8 fruits cm−2 TCSA in four-year-old orchards, and 6.5–7 fruits cm−2 TCSA in the fifth year. Established optimal crop load levels in cv. Fryd are similar to those recommended for cv. ‘Honeycrisp’ [4,13,14].

5. Conclusions

Crop load, but not yield, per tree was the determining factor for return bloom in cv. Fryd. Trees with fewer but larger fruits had a good return bloom, while trees with the same overall yield of more smaller fruits turned to biennial bearing.
Crop load levels significantly affected average fruit mass but had no impact on cv. Fryd fruit quality parameters such as blush, ground color, firmness, soluble solid content, or starch degradation.
Fruit size variation was diminished by crop load regulation and the majority of cv. Fryd fruits fell into 2–3 grading classes, depending on the growing season.
The optimal crop load level depended on the orchard age. To guarantee the regular bearing of cv. Fryd planted on M.9 rootstock at the 3.5 × 1 m distances and trained as slender spindles, crop loads of 5.5–6 fruits cm−2 TCSA in the 3rd year, 7.5–8 fruits cm−2 TCSA in the 4th year, and 6.5–7 fruits cm−2 TCSA in the 5th year should be maintained.

Author Contributions

Conceptualization, methodology, D.K. and I.M.; investigation, data curation, writing—original draft preparation, D.K.; writing—review and editing, D.K. and I.M.; supervision, I.M.; project administration, I.M. All authors have read and agreed to the published version of the manuscript.

Funding

Investigations were supported by the Research Council of Norway, GreenRoad project 320810.

Data Availability Statement

The original contributions presented in this study are included in the article. Further inquiries can be directed to the corresponding author.

Conflicts of Interest

The authors declare no conflicts of interest. The funders had no role in the design of the study; in the collection, analyses, or interpretation of data; in the writing of the manuscript; or in the decision to publish the results.

References

  1. Vujadinović Mandić, M.; Vuković Vimić, A.; Fotirić Akšić, M.; Meland, M. Climate Potential for Apple Growing in Norway—Part 2: Assessment of Suitability of Heat Conditions Under Future Climate Change. Atmosphere 2023, 14, 937. [Google Scholar] [CrossRef]
  2. Ličina, V.; Krogstad, T.; Fotirić Akšić, M.; Meland, M. Apple Growing in Norway—Ecologic Factors, Current Fertilization Practices and Fruit Quality: A Case Study. Horticulturae 2024, 10, 233. [Google Scholar] [CrossRef]
  3. Anthony, B.; Serra, S.; Musacchi, S. Optimizing Crop Load for New Apple Cultivar: “WA38”. Agronomy 2019, 9, 107. [Google Scholar] [CrossRef]
  4. Robinson, T.; Lopez, S. Crop load affects ‘Honeycrisp’ fruit quality more than nitrogen, potassium, or irrigation. Acta Hortic. 2012, 940, 529–537. [Google Scholar] [CrossRef]
  5. Schmidt, T.; Elfving, D.C.; McFerson, J.R.; Whiting, M.D. Crop Load Overwhelms Effects of Gibberellic Acid and Ethephon on Floral Initiation in Apple. HortScience 2009, 44, 1900–1906. [Google Scholar] [CrossRef]
  6. Kviklys, D.; Čeidaitė, A.; Lanauskas, J.; Uselis, N.; Samuolienė, G. Does the rootstock affect alternate bearing of apple tree? Acta Hortic. 2016, 1119, 49–52. [Google Scholar] [CrossRef]
  7. Baldassi, C.; Berim, A.; Roeder, S.; Losciale, P.; Serra, S.; Gang, D.R.; Musacchi, S. Rootstock and Crop Load Effects on ‘Honeycrisp’ Photosynthetic Performance and Carbohydrate Accumulation. Plants 2023, 12, 4035. [Google Scholar] [CrossRef]
  8. Robinson, T.L.; Gonzalez, L.; Cheng, L.; Ziang, Y.; Peck, G.; Arnoldussen, B.; Gomez, M.; Guerra, M.; Miranda Sazo Mario; Kahlke, C.; et al. Studies in precision crop load management of apple. Acta Hortic. 2023, 1366, 219–226. [Google Scholar] [CrossRef]
  9. Verma, P.; Sharma, S.; Sharma, N.C.; Chauhan, N. Review on crop load management in apple (Malus × domestica Borkh.). J. Hortic. Sci. Biotechnol. 2022, 98, 299–321. [Google Scholar] [CrossRef]
  10. Bound, S.A. Determination of Target Crop Loads for Maximising Fruit Quality and Return Bloom in Several Apple Cultivars. Appl. Biosci. 2023, 2, 586–606. [Google Scholar] [CrossRef]
  11. Sharma, S.; Verma, P.; Sharma, N.C. Crop load management in high density apple plantation. Span. J. Agric. Res. 2023, 21, e0905. [Google Scholar] [CrossRef]
  12. Atay, E.; Atay, A.N. Critical Crop Load Threshold in Nutrition and Biennial Bearing of Apple Trees. J. Agric. Sci. Technol. 2024, 26, 1027–1041. Available online: http://jast.modares.ac.ir/article-23-67263-en.html (accessed on 10 December 2024).
  13. Embree, C.G.; Myra, M.T.D.; Nichols, D.S.; Wright, A.H. Effect of blossom density and crop load on growth, fruit quality, and return bloom in Honeycrisp’ apple. HortScience 2007, 42, 1622–1625. [Google Scholar] [CrossRef]
  14. Serra, S.; Leisso, R.; Giordani, L.; Kalcsits, L.; Musacchi, S. Crop Load Influences Fruit Quality, Nutritional Balance, and Return Bloom in ‘Honeycrisp’ Apple. HortScience 2016, 51, 236–244. [Google Scholar] [CrossRef]
  15. Atay, E.; Crété, X.; Loubet, D.; Lauri, P.E. Effects of Different Crop Loads on Physiological, Yield and Fruit Quality of ‘JoyaTM’ Apple Trees: High Crop Load Decreases Maximum Daily Trunk Diameter and Does Not Affect Stem Water Potential. Int. J. Fruit Sci. 2021, 21, 955–969. [Google Scholar] [CrossRef]
  16. Wright, A.H.; Embree, C.G.; Nichols, D.S.; Prange, R.K.; Harrison, P.A.; Delong, J.M. Fruit mass, colour and yield of ‘Honeycrisp’TM apples are influenced by manually-adjusted fruit population and tree form. J. Hortic. Sci. Biotechnol. 2006, 81, 397–401. [Google Scholar] [CrossRef]
  17. Bound, S.A. Crop Load Management in Nashi Pear—A Review. Horticulturae 2022, 8, 923. [Google Scholar] [CrossRef]
  18. DeJong, T.M. Understanding factors influencing peach fruit development and growth. Acta Hortic. 2022, 1352, 55–62. [Google Scholar] [CrossRef]
  19. Robinson, T.; Hoying, S.; Reginato, G.; Kviklys, D. Fruit size of high density peaches is smaller than low density systems. Acta Hortic. 2012, 962, 425–432. [Google Scholar] [CrossRef]
  20. Lammerich, S.; Kunz, A.; Damerow, L.; Blanke, M. Mechanical Crop Load Management (CLM) Improves Fruit Quality and Reduces Fruit Drop and Alternate Bearing in European Plum (Prunus domestica L.). Horticulturae 2020, 6, 52. [Google Scholar] [CrossRef]
  21. Bound, S.A.; Close, D.C.; Measham, P.F.; Whiting, M.D. Regulating crop load of ‘Sweetheart’ and ‘Van’ sweet cherry for optimal quality and reduced risk of cracking. Acta Hortic. 2017, 1161, 91–96. [Google Scholar] [CrossRef]
  22. Robinson, T.L.; Watkins, C.B. Crop load of ‘Honeycrisp’ affects not only fruit size but many quality attributes. N. Y. Fruit Q. 2003, 11, 7–10. [Google Scholar]
  23. Racskó, J. Crop load, fruit thinning and their effects on fruit quality of apple (Malus domestica Borkh.). Acta Agrar. Debreceniensis 2006, 24, 29–35. [Google Scholar] [CrossRef] [PubMed]
  24. Yang, X.; Chen, L.-S.; Cheng, L. Leaf photosynthesis and carbon metabolism adapt to crop load in ‘Gala’ apple trees. Horticulturae 2021, 7, 47. [Google Scholar] [CrossRef]
  25. Wünsche, J.; Ferguson, I. Crop Load Interactions in Apple. Hort. Rev. 2005, 31, 231–290. [Google Scholar] [CrossRef]
  26. Plozza, T.; Reddy, P.; Scalisi, A.; Ezernieks, V.; Rochfort, S.; Goodwin, I. Relationships of early season leaf metabolites to apple crop load and fruit quality at harvest. Acta Hortic. 2024, 1395, 337–342. [Google Scholar] [CrossRef]
  27. Gonzalez, L.; Torres, E.; Avila, G.; Bonany, J.; Alegre, S.; Carbo, J.; Martin, B.; Recasens, I.; Asin, L. Evaluation of chemical fruit thinning efficiency using Brevis® (Metamitron) on apple trees (‘Gala’) under Spanish conditions. Sci. Hortic. 2020, 261, 109003. [Google Scholar] [CrossRef]
  28. Delong, J.M.; Prange, R.K.; Harrison, P.A.; Embree, C.G.; Nichols, D.; Harrison, W.A. The influence of crop-load, delayed cooling and storage atmosphere on post-storage quality of ‘Honeycrisp’TM apples. J. Hortic. Sci. Biotechnol. 2006, 81, 391–396. [Google Scholar] [CrossRef]
  29. Sidhu, R.S.; Bound, S.A.; Hunt, I. Crop Load and Thinning Methods Impact Yield, Nutrient Content, Fruit Quality, and Physiological Disorders in ‘Scilate’ Apples. Agronomy 2022, 12, 1989. [Google Scholar] [CrossRef]
  30. Sidhu, R.S.; Hunt, I.; Bound, S.A.; Swarts, N.D. Crop load, fruit quality and mineral nutrition as predictors of fruit softening and internal flesh browning in modern firm fleshed apple cultivars. Sci. Hortic. 2024, 330, 113035. [Google Scholar] [CrossRef]
  31. Penzel, M.; Tsoulias, N. Annual shoot growth on apple trees with variable canopy leaf area and crop load in response to LiDAR scanned leaf area to fruit ratio. Int. Agrophys. 2022, 36, 173–180. [Google Scholar] [CrossRef] [PubMed]
  32. Iwanami, H.; Moriya-Tanaka, Y.; Hanada, T.; Baba, T.; Sakamoto, D. Factors Explaining Variations in Soluble Solids Content of Apples During Ripening and Storage. Hort. J. 2024, 93, 135–142. [Google Scholar] [CrossRef]
  33. Maas, F.M.; Fotirić Akšić, M.; Meland, M. Response of ‘Rubinstep’ apple to flower and fruitlet thinning in a northern climate. Acta Hortic. 2020, 1295, 41–47. [Google Scholar] [CrossRef]
  34. Scalisi, A.; Plozza, T.; Reddy, P.; Peavey, M.; McClymont, L.; Rochfort, S.; Stefanelli, D.; Goodwin, I. Localised and tree total crop loads influence trunk growth, return fruit set, yield, and fruit quality in apples. Hort. Adv. 2024, 2, 17. [Google Scholar] [CrossRef]
  35. Campbell, T.; Kalcsits, L. Strategies to overcome biennial bearing in apple—A review. Eur. J. Agron. 2024, 158, 127213. [Google Scholar] [CrossRef]
  36. Reddy, P.; Plozza, T.; Scalisi, A.; Hemsworth, J.; Ram, D.; Peavey, M.; McClymont, L.; Ezernieks, V.; Goodwin, I.; Rochfort, S. Spur leaf and fruitlet seed phytohormones of biennial apple trees affect return bloom. Acta Hortic. 2024, 1395, 305–310. [Google Scholar] [CrossRef]
  37. Kviklys, D.; Samuoliene, G. Relationships Among the Rootstock, Crop Load, and Sugar Hormone Signaling of Apple Tree, and Their Effects on Biennial Bearing. Front. Plant Sci. 2020, 11, 1213. [Google Scholar] [CrossRef]
  38. Milyaev, A.; Tandron-Moya, Y.A.; von Wirén, N.; Neuwald, D.; Flachowsky, H.; Wünsche, J.N. What else don’t we know about biennial bearing? Phytohormone profile of seeds and seed number per fruit differ between a biennial and a non-biennial apple cultivar. Acta Hortic. 2022, 1342, 7–14. [Google Scholar] [CrossRef]
  39. Reddy, P.; Plozza, T.; Scalisi, A.; Ezernieks, V.; Goodwin, I.; Rochfort, S. Zonal Chemical Signal Pathways Mediating Floral Induction in Apple. Metabolites 2024, 14, 251. [Google Scholar] [CrossRef]
  40. Kumar, A.; Mushtaq, M.; Kumar, P.; Sharma, D.P.; Gahlaut, V. Insights into flowering mechanisms in apple (Malus × domestica Borkh.) amidst climate change: An exploration of genetic and epigenetic factors. Biochim. Biophys. Acta Gen. Subj. 2024, 1868, 130593. [Google Scholar] [CrossRef]
  41. Kviklys, D.; Abukauskas, V.; Meland, M.; Guerra, W.; Höller, I.; Dallabetta, N.; Pantezzi, T.; Carbo, J.; Lordan, J.; Karlström, A.; et al. EUFRIN apple rootstock trials: First results across Europe. Acta Hortic. 2022, 1346, 603–610. [Google Scholar] [CrossRef]
Figure 1. The trial location (marked by red star) in Westland County, Ullensvang commune, Norway.
Horticulturae 11 00597 g001
Figure 2. Cv. Fryd tree training, flowering, fruit set, and fruits at harvest. (A) Return bloom of 4-year-old trees in the 2nd year of the study. (B) Fruit development stage when fruitlet thinning was performed. (C) Cv. Fryd fruits at harvest. (D) Three-year-old tree with low crop load level in 2021. (E) Five-year-old tree with medium crop load level in 2023.
Horticulturae 11 00597 g002
Figure 3. Average daily temperature during 2021–2023 growing seasons.
Horticulturae 11 00597 g003
Figure 4. Average daily precipitation (mm) during 2021–2023 growing seasons.
Horticulturae 11 00597 g004
Figure 5. Cv. Fryd fruit growth dynamics in 2021. Diameter of marked fruits measured in bi-weekly intervals. a Values indicate significant differences between crop load levels at certain dates at p < 0.05.
Horticulturae 11 00597 g005
Figure 6. Cv. Fryd fruit growth dynamics in 2023. Diameter of marked fruits measured in bi-weekly intervals. a Values indicate significant differences between crop load levels at certain dates at p < 0.05.
Horticulturae 11 00597 g006
Figure 7. Crop load effects on the distribution of cv. Fryd apples according to fruit size groups (%).
Horticulturae 11 00597 g007
Figure 8. The effect of crop load on cv. Fryd average fruit size and starch pattern in 2022. CL—crop load.
Horticulturae 11 00597 g008
Figure 9. Correlation chart between crop load and number of flower clusters of apple cv. Fryd in 2021–2024. * Significant at p < 0.05.
Horticulturae 11 00597 g009
Table 1. Flowering and harvest date variation of cv. Fryd in 2021–2023.
202120222023
Full flowering dateMay 19May 18May 27
Harvest dateSeptember 22September 30September 26
Table 2. Crop load effect on cv. Fryd apple yield in 2021–2023, kg tree−1.
Crop Load Level202120222023
Low5.2 ± 0.3 d5.4 ± 0.4 c9.49 ± 1.4 b
Medium7.7 ± 0.6 c7.2 ± 1.1 b10.53 ± 0.9 b
High9.4 ± 0.4 b8.5 ± 0.9 b12.38 ± 0.7 a
Control10.5 ± 0.5 a11.6 ± 1.3 a12.80 ± 1.1 a
Values within the column that do not share the same letter are significantly different at p < 0.05.
Table 3. Crop load effect on cv. Fryd average fruit mass in 2021–2023, g.
Crop Load Level202120222023
Low229 ± 9.1 a191 ± 10.8 a217 ± 8.6 a
Medium223 ± 7.3 ab194 ± 9.4 a201 ± 7.3 b
High210 ± 7.9 b160 ± 8.6 b186 ± 6.2 c
Control145 ± 6.4 c128 ± 7.7 c182 ± 7.6 c
Values within the column that do not share the same letter are significantly different at p < 0.05.
Table 4. Crop load effect on cv. Fryd fruit quality parameters in 2021–2023.
Crop Load LevelGround Colour, Scale 1–9Blush, Scale 1–9Firmness, kg cm−2Starch, Scale 1–9SSC a, %
2021
Low5.30 ± 0.41 a6.73 ± 0.35 a8.15 ± 0.42 a1.50 ± 0.2111.7 ± 0.74
Medium5.83 ± 0.38 a6.73 ± 0.40 a7.74 ± 0.54 ab1.48 ± 0.1911.5 ± 0.63
High5.23 ± 0.35 a7.03 ± 0.39 a7.85 ± 0.56 ab1.40 ± 0.1811.6 ± 0.75
Control3.18 ± 0.22 b5.20 ± 0.51 b6.94 ± 0.61 b1.35 ± 0.2310.7 ± 1.11
2022
Low4.03 ± 0.524.65 ± 0.32 a9.50 ± 0.50 a1.93 ± 0.22 a11.2 ± 1.12
Medium3.47 ± 0.354.17 ± 0.35 ab9.34 ± 0.41 a2.33 ± 0.26 ab11.1 ± 0.85
High3.40 ± 0.394.15 ± 0.41 ab9.26 ± 0.38 a1.85 ± 0.31 a11.0 ± 0.95
Control3.40 ± 0.433.43 ± 0.45 b8.11 ± 0.44 b2.83 ± 0.41 b10.6 ± 1.18
2023
Low4.85 ± 0.235.38 ± 0.628.57 ± 0.663.58 ± 0.3910.63 ± 1.21
Medium4.70 ± 0.365.89 ± 0.518.55 ± 0.844.07 ± 0.5110.83 ± 1.33
High4.87 ± 0.336.13 ± 0.648.11 ± 0.653.37 ± 0.4510.37 ± 1.20
Control4.80 ± 0.425.10 ± 0.558.45 ± 1.013.15 ± 0.5210.60 ± 1.22
Values within the column in separate years that do not share the same letter are significantly different at p < 0.05; a SSC—soluble solid content.
Table 5. Crop load effects on the yield (t ha−1), and the next year’s return bloom (number of flower clusters tree−1) of cv. Fryd.
Crop Load Level
LowMediumHighControl
Yield 202114.81 ± 0.98 da22.15 ± 1.23 c26.75 ± 1.09 b30.00 ± 2.12 a
Return bloom 202242.63 ± 5.32 a24.82 ± 1.54 b26.24 ± 2.02 b6.61 ± 0.55 c
Yield 202215.38 ± 1.59 c20.43 ± 2.64 b24.19 ± 2.87 b33.02 ± 3.32 a
Return bloom 202389.31 ± 7.41 a78.26 ± 6.87 a62.35 ± 6.22 b18.21 ± 4.51 c
Yield 202327.12 ± 1.28 b30.14 ± 1.96 b35.63 ± 2.74 a36.71 ± 3.26 a
Return bloom 202463.4 ± 5.22 a66.35 ± 4.51 a34.13 ± 3.65 b17.34 ± 2.32 c
Values within the row that do not share the same letter are significantly different at p < 0.05.
Disclaimer/Publisher’s Note: The statements, opinions and data contained in all publications are solely those of the individual author(s) and contributor(s) and not of MDPI and/or the editor(s). MDPI and/or the editor(s) disclaim responsibility for any injury to people or property resulting from any ideas, methods, instructions or products referred to in the content.

