Article

Characterization of SPL Family Genes in Banana Reveals the Critical Role of MaSPL1 in Regulating Fruit Ripening

1
Institute of Fruit Tree Research, Guangdong Academy of Agricultural Sciences, Ministry of Agriculture and Rural Affairs Key Laboratory of South Subtropical Fruit Biology and Genetic Resource Utilization, Guangdong Provincial Key Laboratory of Science and Technology Research on Fruit Tree, Guangzhou 510640, China
2
College of Horticulture and Forestry Sciences, Huazhong Agricultural University, Wuhan 430070, China
*
Authors to whom correspondence should be addressed.
Horticulturae 2025, 11(6), 576; https://doi.org/10.3390/horticulturae11060576
Submission received: 2 April 2025 / Revised: 20 May 2025 / Accepted: 21 May 2025 / Published: 23 May 2025

Abstract

:
SPLs (SQUAMOSA promoter binding protein-like) are pivotal in regulating plant development and stress responses. Although SPL genes have been characterized in a series of plant species, no systematic analysis has been performed on bananas, one of the most consumed tropical fruits with immense economic importance worldwide. Here, 55 putative MaSPL genes were identified in Musa acuminata ssp. malaccensis var. Pahang and classified into seven groups based on phylogenetic analysis. The RNA-seq analysis revealed that the expression of MaSPLs presented distinct spatiotemporal patterns in different tissues at different developmental stages, indicating a potential role in banana growth and development. Furthermore, MaSPL1 was found to be predominantly expressed in banana fruits during the fruit development and the early postharvest stages. Notably, the transient overexpression of MaSPL1 accelerated the fruit ripening in bananas. In conclusion, this study provides comprehensive information for further investigation of the specific roles of SPL genes in banana developmental processes, particularly during fruit development and post-harvest stages, and may implement molecular strategies to regulate maturation and enhance fruit quality in bananas.

1. Introduction

SQUAMOSA-PROMOTER BINDING PROTEIN (SBP) or SQUAMOSA-PROMOTER BINDING PROTEIN-LIKE (SPL) transcription factors, harboring a plant-specific SBP domain, regulate diverse aspects of development and growth across different plant lineages [1]. The SBP domain comprises approximately 76 amino acid residues and contains two specific zinc finger motifs and a nuclear localization signal (NLS) at the C-terminal region [2,3]. The SPL genes were first identified in Antirrhinum majus as AmSBP1 and AmSBP2 with the ability to bind to the promoter of the floral meristem identity gene SQUAMOSA [4]. To date, an increasing number of SPL members have been identified in different plants, including Arabidopsis (Arabidopsis thaliana) [5], cotton (Gossypium spp.) [6], soybean (Glycine max) [7], tomato (Solanum lycopersicum) [8], Wheat (Triticum aestivum) [9], rice (Oryza sativa) [10], and maize (Zea mays) [11].
It has been reported that SPL transcription factors are involved in plant development, including, but not limited to, root development [12], stomatal complexes and epidermal hairs [13], floral organ development and fertility [14], vegetative phase transition and flowering [15,16,17], plant height and architecture [18,19,20,21,22,23,24], grain size and yield [25,26,27,28,29], and fruit development and ripening [30]. For example, in maize, Teosinte glume architecture1 (TGA1), a member of the SBP-box gene family of transcriptional regulators, has been identified as the gene conferring naked kernels [31]. In rice, OsSPL16/GW8 (Grain Width 8), the close ortholog of maize TGA1, has been identified as an important QTL controlling grain size, shape, and quality [28,29,32]. SlSPL-CNR, an SPL transcription factor, functions as a multi-functional protein to activate tomato fruit ripening and trigger plant cell death during fruit ripening [33].
Bananas, as a typical climacteric fruit, are susceptible to softening and rotting during transportation and storage at room temperature, which results in significant postharvest losses and is similar to other climacteric fruits [34]. Elucidating the regulatory factors and studying the regulatory mechanism underlying banana fruit ripening is of paramount importance for maintaining the fruit quality, extending the shelf life, and marketing [35,36,37]. A comprehensive elucidation of the molecular regulatory networks governing ripening and quality formation will contribute to strategies for improving fruit quality and postharvest longevity. To date, several transcription factors (TFs), including MaMYB3 [38], MaWRKY49 [39], MabZIP21 [37], MabHLH28 [40], MaNAC19/029/083/169 [41,42,43,44], MaEIL4 [45], and MaNAP1 [46], have been implicated in banana fruit ripening. Notably, recent findings indicate that MaSPL16 regulates the MaNAC029 transcript level, thereby controlling ethylene biosynthesis and improving fruit quality throughout the entire process of banana fruit ripening [30]. This evidence provides further support for the hypothesis that SPLs play a functional role throughout the banana ripening process.
To gain further insight into the banana SPL gene family and to identify additional SPL genes that regulate fruit ripening, this study has examined the SPL gene family in bananas from three principal perspectives: (i) the diversity of gene structure and domain architecture of the banana SPL gene family; (ii) the expression profiles of banana SPL genes in different tissues; and (iii) the functional analysis of MaSPL1 in the regulation of banana fruit ripening. In brief, this study lays a solid foundation for further investigating the roles of MaSPL genes in developmental processes, particularly during fruit development and postharvest stages, and offers potential targets for molecular strategies to regulate ripening and improve fruit quality in bananas.

2. Materials and Methods

2.1. SPL Transcription Factors in M. acuminata DH Pahang

To identify members of the banana SPL gene family, we downloaded the complete genome sequence data of the banana (Musa acuminata ssp. malaccensis var. Pahang (M. acuminata DH Pahang, AA) from the Banana Genome Hub database (https://banana-genome-hub.southgreen.fr/, accessed on 1 April 2024). Furthermore, the complete genome sequences of Arabidopsis (A. thaliana), rice (O. sativa), and maize (Z. mays) were obtained from the following sources: the Arabidopsis Information Resource (TAIR: http://www.arabidopsis.org/, accessed on 1 April 2024), the National Rice Data Center (https://www.ricedata.cn/, accessed on 1 April 2024), and the Maize Genetics and Genomics Database (https://maizegdb.org/, accessed on 1 April 2024). Subsequently, 66 SPL proteins from the Arabidopsis (17), rice (19), and maize (30) were employed as target sequences in the M. acuminata DH Pahang database for blast comparison with the cutoff (e-value < 1 × 10⁻¹). Then, all the hits were screened by the HMM (hidden Markov model) profile of the SBP domain (PF03110), which was retrieved from the Pfam database (http://pfam.janelia.org/, accessed on 8 April 2024) [47]. To ensure the accuracy of each SPL gene, the candidate protein sequences of the banana SPL gene family were further screened and validated by the Conserved Domain Database (CDD) (https://www.ncbi.nlm.nih.gov/Structure/cdd/wrpsb.cgi, accessed on 8 April 2024) [48] and the Simple Modular Architecture Research Tool (SMART) database (http://smart.embl-heidelberg.de/, accessed on 8 April 2024) [49]. Finally, the protein sequences that exhibited incomplete structural integrity and lacked the conserved structural SBP domain were excluded.

2.2. Gene Structure and Phylogenetic Analysis

The conserved structural domains of M. acuminata SPL proteins were analyzed using the online toolkit of NCBI CD-Search (https://www.ncbi.nlm.nih.gov/Structure/cdd/wrpsb.cgi, accessed on 12 April 2024). The conserved motifs of the banana SPL amino acid sequence were analyzed using the MEME (https://meme-suite.org/meme/, accessed on 12 April 2024) program [50]. The number of motifs was set to 10, and the remaining parameters were set to their default values. The resulting motif results were then visualized in the Visualize MEME Motif Partner of TBtools software [51]. Furthermore, the exon/intron structure of each MaSPL gene was generated in the Gene Structure View of the same platform. Moreover, phylogenetic trees were constructed using the maximum likelihood (ML) method, the Poisson correction model, and bootstrap analysis, performed with 1000 replicates in MEGA7: Molecular Evolutionary Genetics Analysis version 7.0 [52].

2.3. Synteny Analysis

The chromosomal localization of MaSPL genes in M. acuminata DH Pahang was conducted via the Show Gene on Chromosome program within the TBtools software (version 2.225). Furthermore, a synteny analysis was performed based on the chromosomal location of MaSPL family members and gene annotation information. Subsequently, a One Step MCScanX-Super Fast analysis [53] was conducted in TBtools, which was then visualized using the Advanced Circos program.

2.4. Cis-Acting Element and Collinearity Analysis

A 2000 bp upstream of the coding regions of MaSPLs in M. acuminata DH Pahang were extracted using the TBtools software, and then the cis-acting elements in the MaSPLs promoter region (2000 bp) were analyzed by the PlantCARE database (https://bioinformatics.psb.ugent.be/webtools/plantcare/html/, accessed on 12 April 2024) [54]. The numbers of cis-acting elements were visualized and analyzed using the Basic Biosequence Viewer program in TBtools software. A comparative collinearity analysis was conducted to determine the evolutionary relationship and conservation between the SPL proteins of M. acuminata DH Pahang, A. thaliana, O. sativa, and Z. mays, which was performed using the Synteny visualization plugin in TBtools software.

2.5. Expression Profiles of MaSPL Genes in Different Tissues

Transcriptome data (NCBI BioProject accessions: PRJNA394594) [55] were obtained from Musa Cavendish Baxijiao in roots, leaves, and fruits at different stages of development (0, 20, and 80 days after flowering) and ripening (8 and 14 days postharvest). The FPKM (fragments per kb of transcript per million fragments mapped) values were employed to represent the expression abundance of MaSPL genes. The expression heatmap of MaSPLs was generated using TBtools, based on log2 (FPKM+1) values.

2.6. Transient Overexpression in Banana Fruits

The coding sequence of MaSPL1 was subcloned into the pCMABIA1300 vector, which was transferred to Agrobacterium tumefaciens strain EHA105, and subsequently employed for injection of the whole pulp of mature-green banana through the distal end using a syringe. At least twelve fruit fingers were used for each treatment. The transformed fruits were dipped into ethephon solution (200 mg/L) for 1 min on the first day post-inoculation and incubated at 22 °C for six days. Samples were collected to ascertain the gene expression levels. The firmness and hue angle of the fruit were monitored at each predetermined sampling point using a texture analyzer (BosinTech, Shanghai, China) and a color analyzer (Konica Minolta, Tokyo, Japan), respectively. The primers used are listed in Table S4.

2.7. RNA Extraction and RT-qPCR Analysis

Banana samples were collected, frozen in liquid nitrogen, and stored at 80 °C. Total RNA was extracted using the SteadyPure Plant RNA Extraction Kit (Accurate Biotechnology, Changsha, China). Reverse transcription was conducted using 1–2 μg total RNA with the Hifair® Ⅲ 1st Strand cDNA Synthesis SuperMix (YEASEN Biotechnology, Shanghai, China). A quantitative real-time polymerase chain reaction (RT-qPCR) assay was conducted using the Hieff UNICON® qPCR SYBR Green Master Mix (YEASEN Biotechnology, Shanghai, China) and the LightCycler480 system (Roche, Basel, Switzerland). MaCAC was used as a reference gene [56]. The primers used for the RT-qPCR assay are listed in Table S4.

3. Results

3.1. Identification of MaSPL Gene Family Members in M. acuminata DH Pahang

To identify the SPL genes in M. acuminata DH Pahang, we initially constructed a local BLAST library (version 2.16.0) with 66 SPL proteins from the A. thaliana (17), O. sativa (19), and Z. mays (30) for comparison. A subsequent screening in combination with HMM, Batch CD-Search, Pfam, and SMART analysis was conducted to eliminate the protein sequences that lacked complete structural integrity and the conserved structural SBP domain. As a result, 55 SPL genes were identified in M. acuminata DH Pahang (Table S1). Due to the lack of standard annotation designated to the 55 SPL genes in M. acuminata DH Pahang, we named them MaSPL1 to MaSPL55 based on their chromosomal locations.

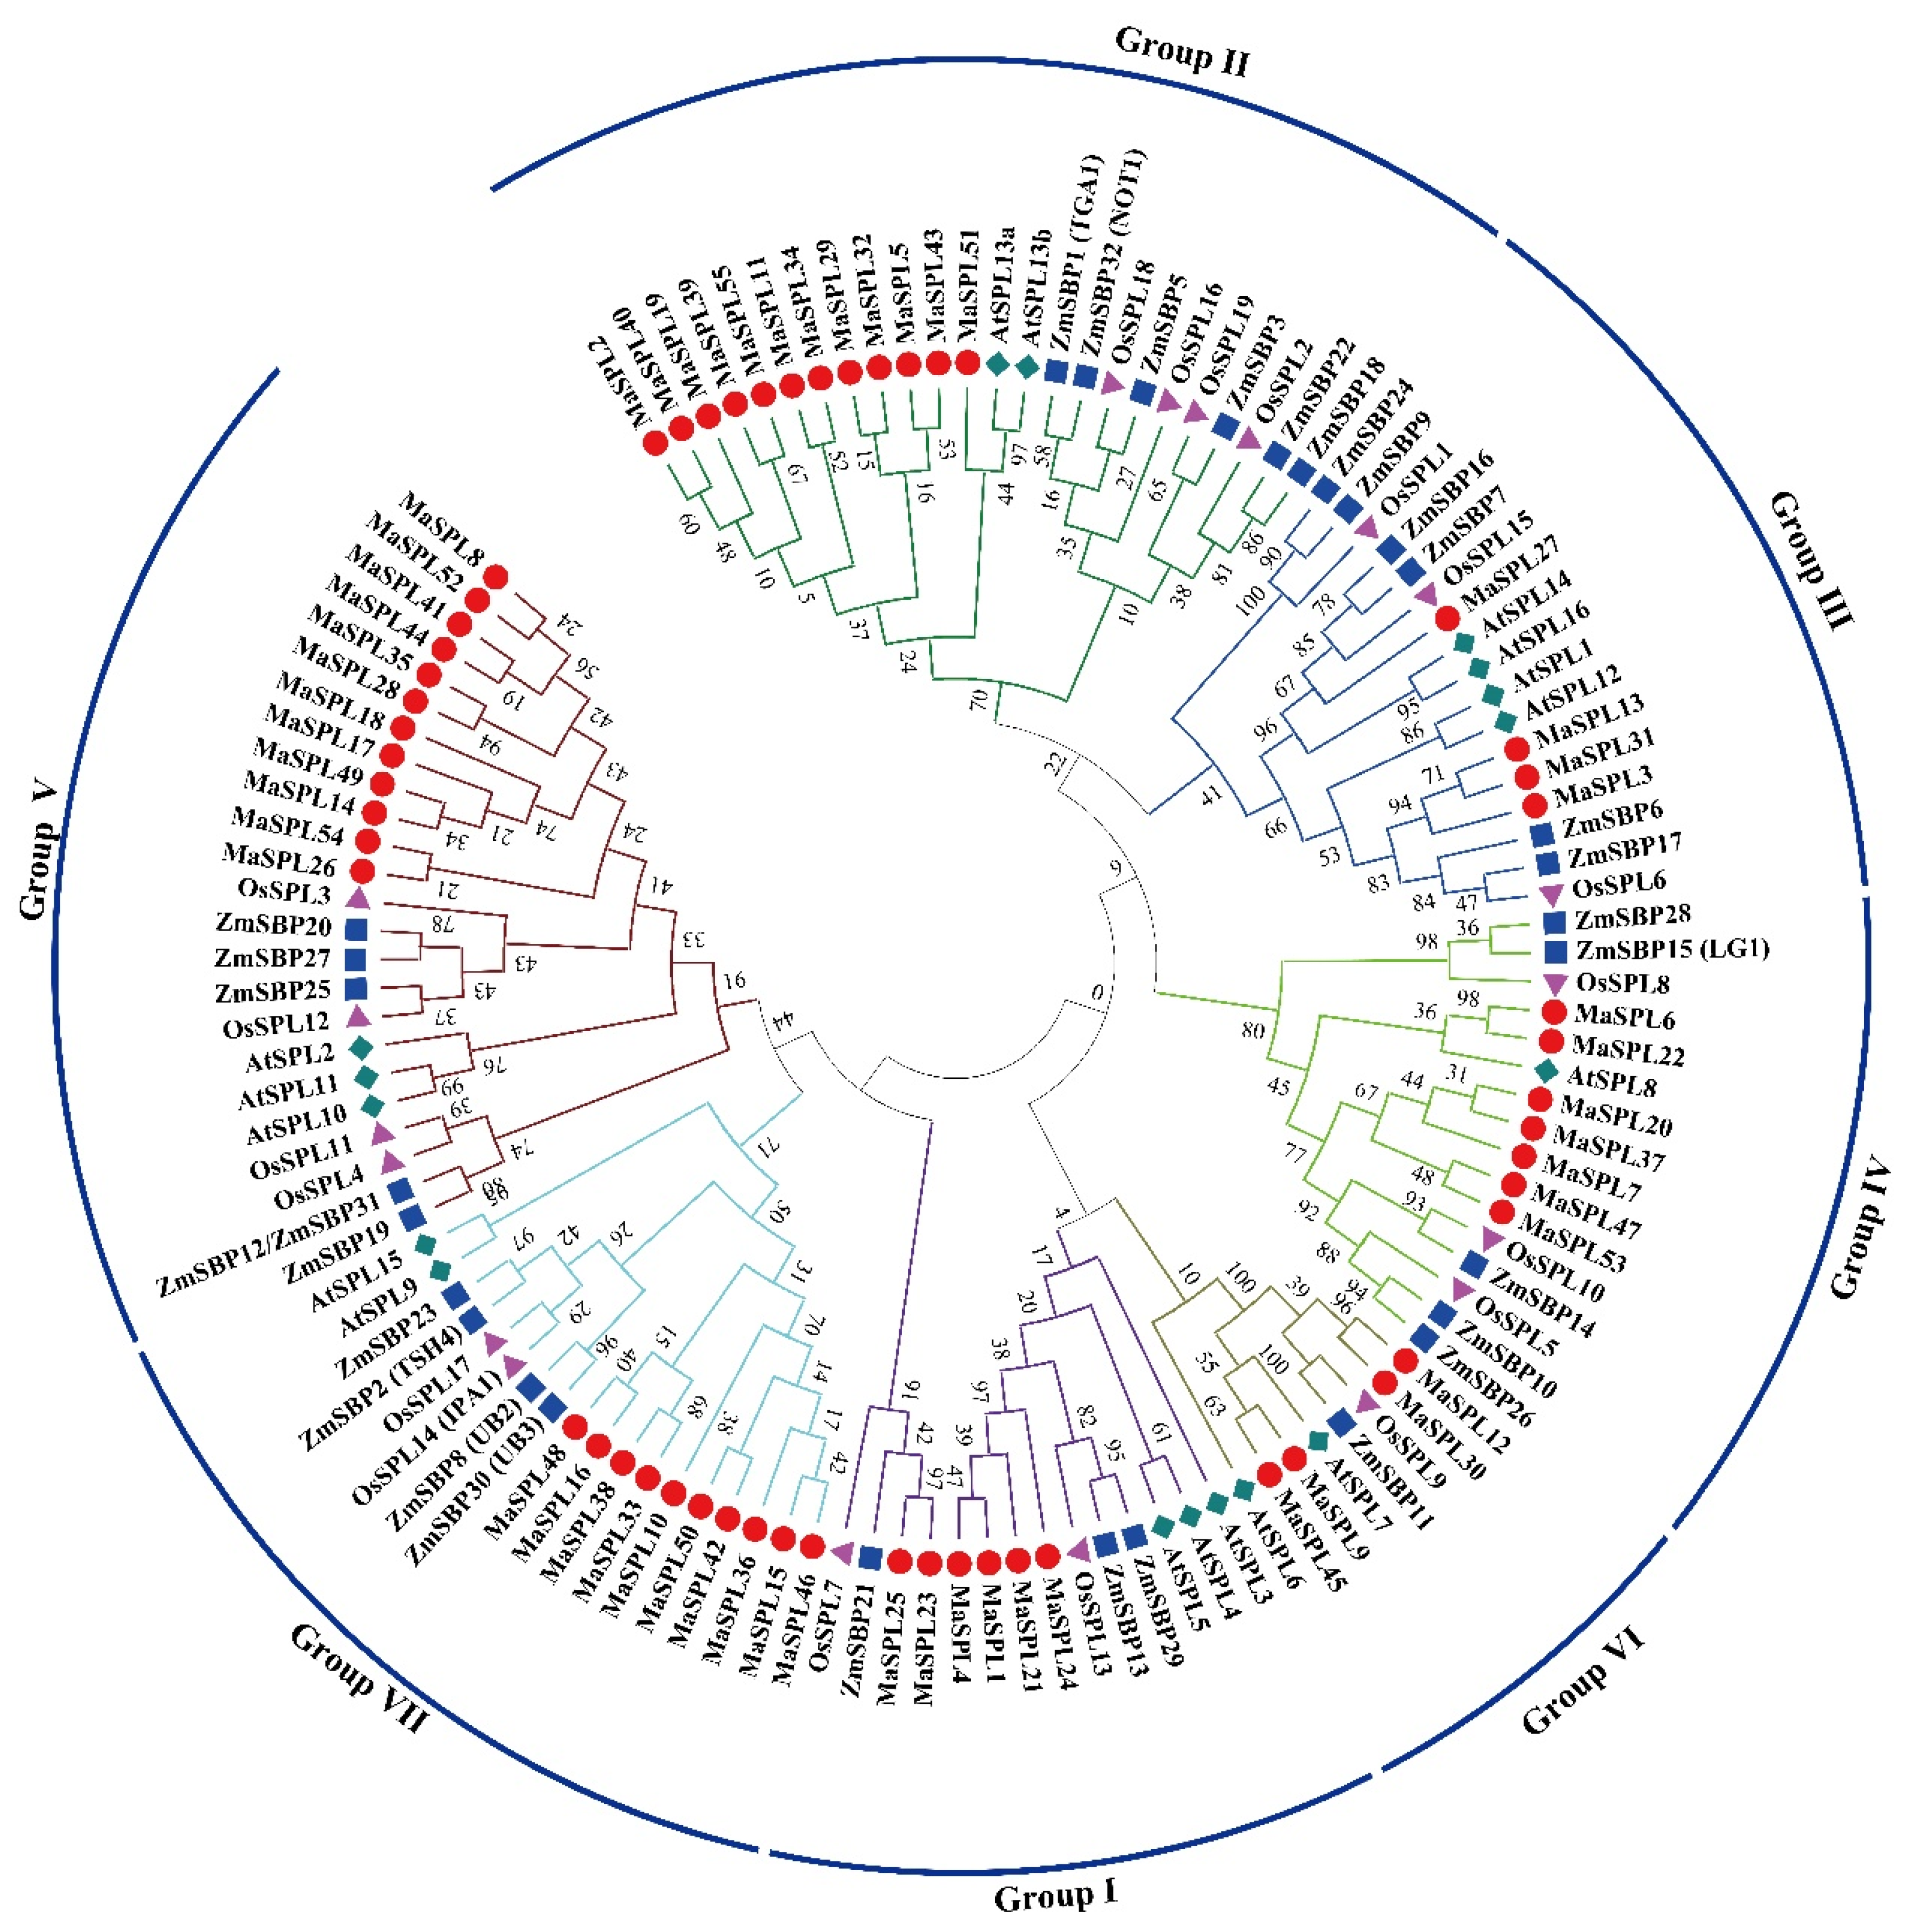
3.2. Phylogenetic Tree of M. acuminata DH Pahang, A. thaliana, O. sativa, and Z. mays SPL Proteins

To investigate the evolutionary relationships of SPL proteins between eudicots and monocots, we analyzed SPL proteins from the diploids A. thaliana, M. acuminata DH Pahang, O. sativa, and Z. mays. A phylogenetic tree was constructed using MEGA 7.0 software with the Maximum Likelihood (ML) method and 1000 bootstrap replicates (Figure 1). Clearly, the eudicot and monocot SPL genes were present in all seven groups, indicating that the appearance of most SPL genes in plants predates the monocot/eudicot divergence. The phylogenetic analysis also showed that SPL gene members from different plant species were not evenly distributed among the groups. Each group contained at least one MaSPL gene, and some SPL genes in A. thaliana have two or more counterparts in M. acuminata DH Pahang. For example, Group IV contained seven M. acuminata DH Pahang SPL genes, but there was only one A. thaliana member; Group II contained twelve MaSPL genes, but there were only two A. thaliana SPL genes. The results may indicate that the SPL genes of different plant species have undergone differential expansion.

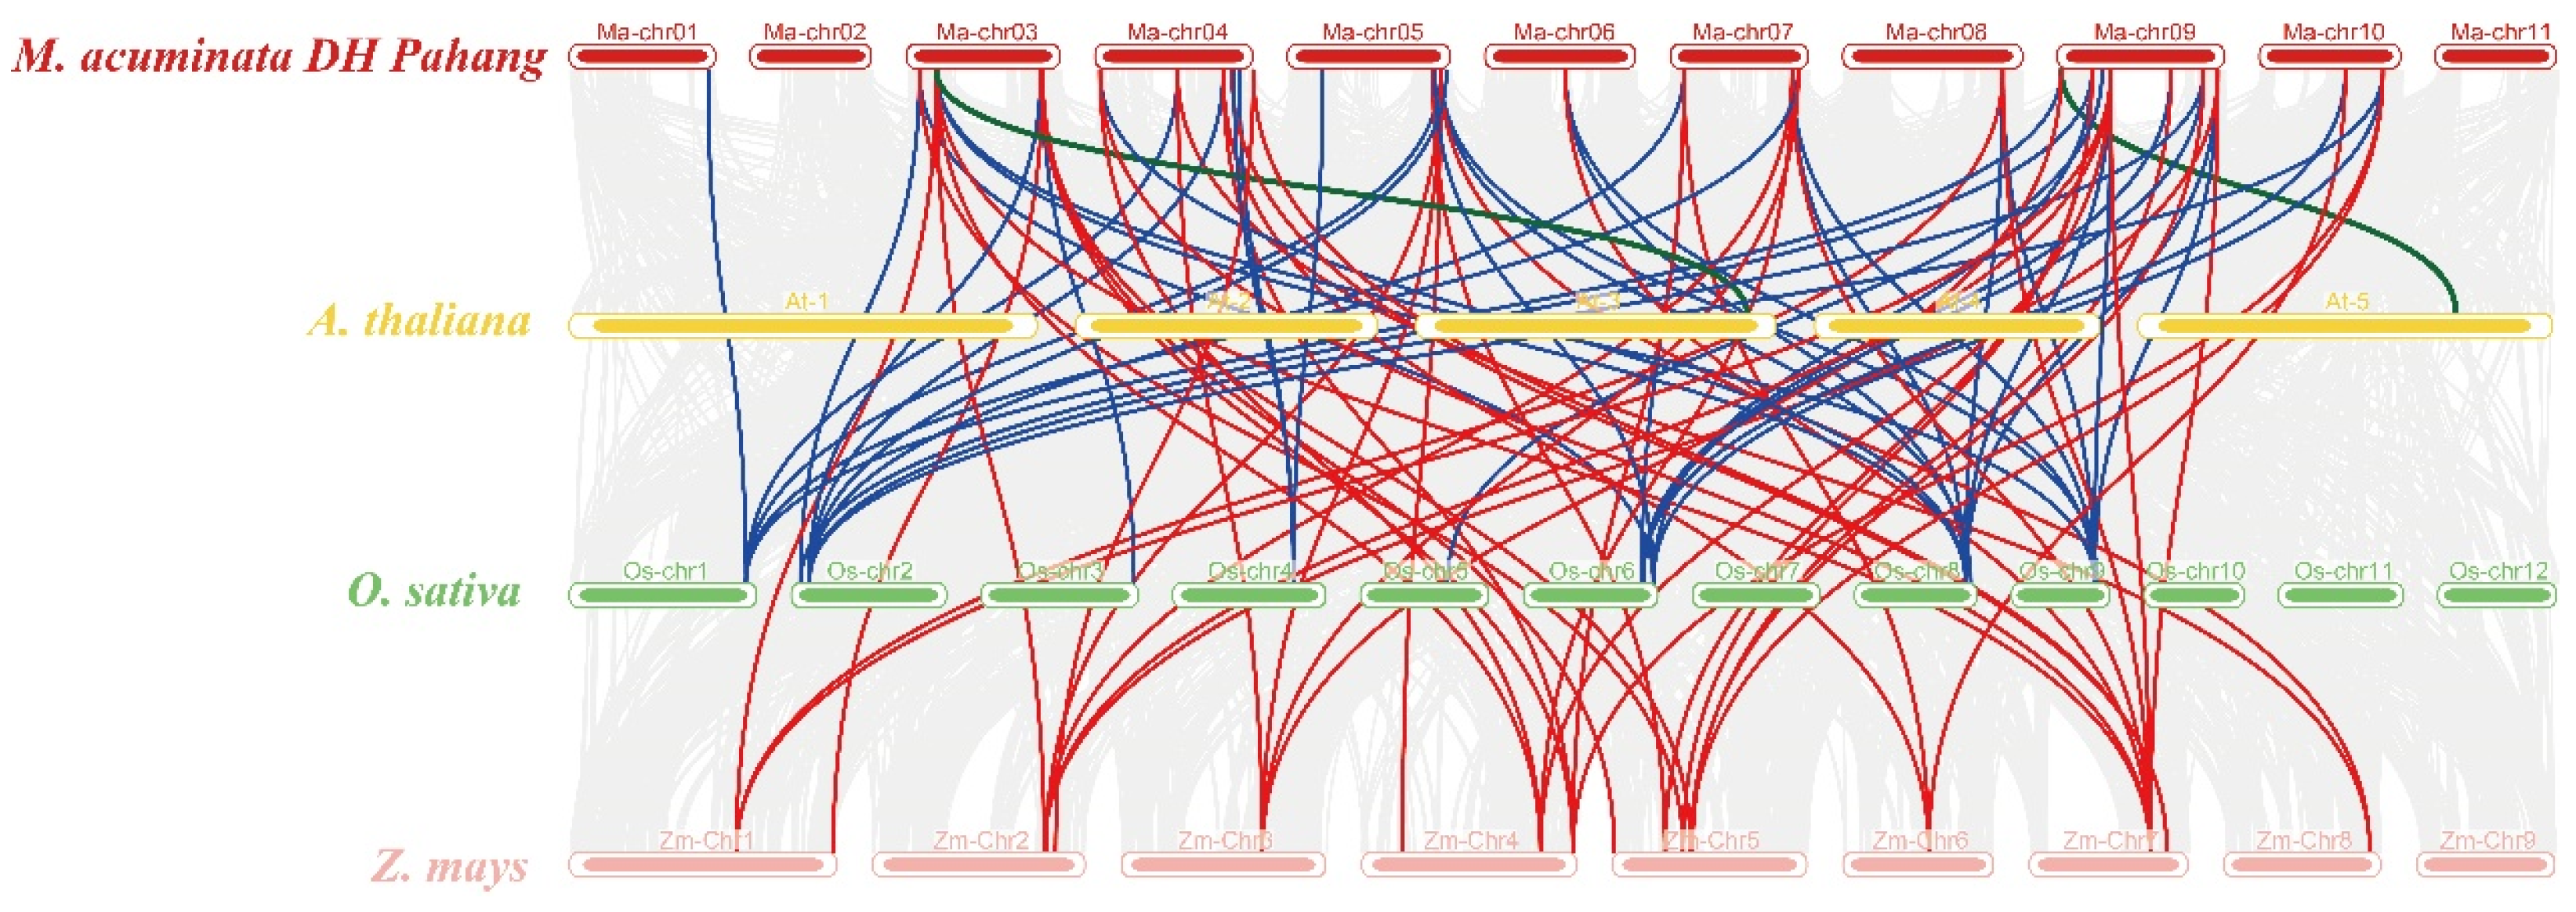
3.3. The Chromosomal Distribution, Duplication Events, and Syntenic Analysis of the Maspl Genes

Furthermore, we constructed a chromosome distribution map for the SPL gene family in M. acuminata DH Pahang. A total of 55 MaSPL genes identified in M. acuminata DH Pahang are distributed across eleven chromosomes (Figure S1). Ten MaSPL genes were present on chromosome 4, nine on chromosome 9, eight on chromosome 3, seven on chromosome 5, four on chromosomes 2, 6, and 7, three on chromosomes 8 and 10, two on chromosome 1, and only one on chromosome 11. Moreover, the evolutionary relationships among the MaSPL genes in M. acuminata DH Pahang were investigated through a duplication analysis. Among the collection of forty-five MaSPL genes, forty-four pairs of duplication genes were identified (Figure S1; Table S2).
To better understand the molecular functions and evolutionary origin of MaSPL genes, a comparative syntenic analysis between M. acuminata DH Pahang, A. thaliana, O. sativa, and Z. mays was established (Figure 2; Table S3). The synteny block analysis revealed that 46 orthologous SPL gene pairs were found between M. acuminata DH Pahang and Z. mays, 42 orthologous SPL gene pairs between M. acuminata DH Pahang and O. sativa, whereas two orthologous SPL gene pairs were identified between M. acuminata DH Pahang and A. thaliana (Figure 2; Table S3). In addition, 23 MaSPL genes (e.g., MaSPL1, MaSPL3, and MaSPL4) were not found in any duplication blocks, indicating that these SPL genes might have independently duplicated during evolution. It was also found that some MaSPL genes, such as MaSPL10, MaSP29, and MaSPL46, exhibit four collinear gene pairs with Z. mays. The results suggest the importance of these genes during the evolution of MaSPL genes in M. acuminata DH Pahang. Notably, MaSPL10 and MaSPL43 show collinear relationships with the SPL genes from A. thaliana, O. sativa, and Z. mays (Table S3).

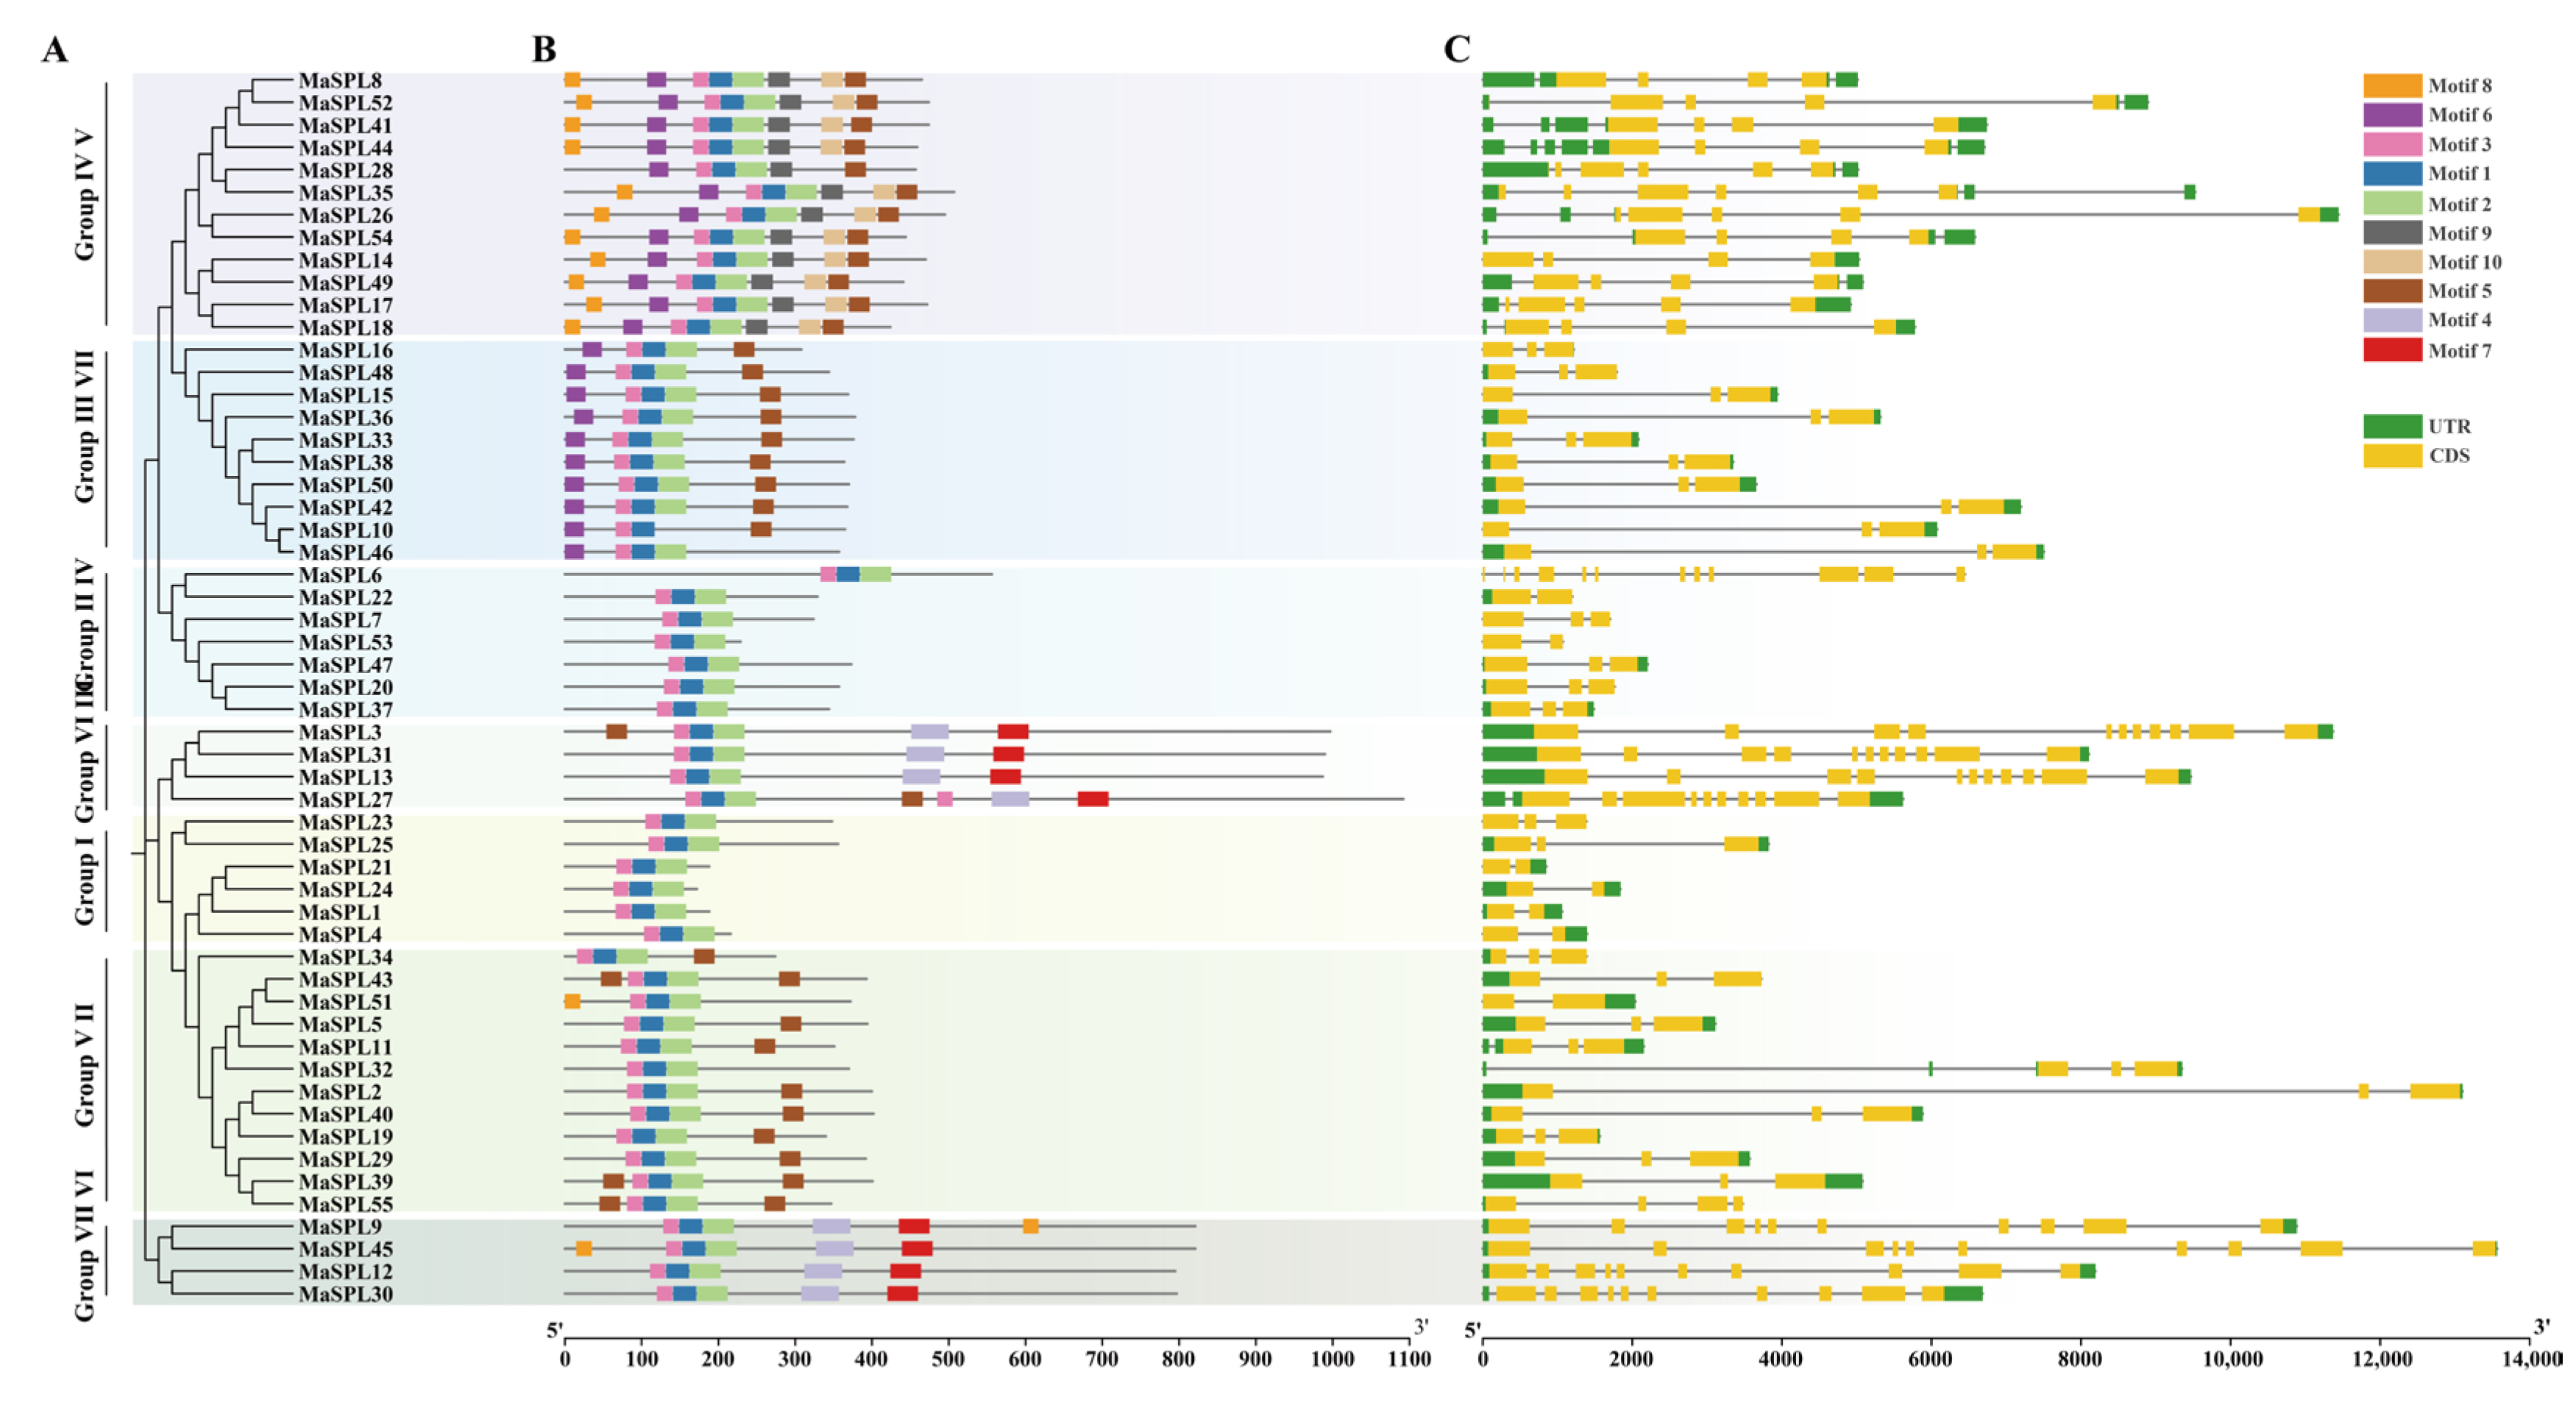
3.4. Phylogenetic Analysis, Conserved Motifs, and Gene Structure Analysis of MaSPLs in M. acuminata DH Pahang

To better understand the diversification of MaSPL genes in M. acuminata DH Pahang, the phylogenetic tree, gene structure, and motif diversity were analyzed (Figure 3). The phylogenetic tree showed that Groups I, II, III, IV, V, VI, and Ⅶ contained six, twelve, four, seven, twelve, four, and ten MaSPL proteins, respectively (Figure 3A). Further studies conclusively showed that all 55 MaSPL proteins have a complete SBP conserved domain (Figure S2). In addition, to gain further insight into the structural features of MaSPLs, a total of 10 conserved motifs encoding amino acid sequences of MaSPLs were identified in this study using the MEME (Multiple EM for Motif Elicitation) program (Figure 3B). The results demonstrated that all members of the MaSPL family contain conserved motifs, including motif 1, motif 2, and motif 3. MaSPLs in Group V exhibited the highest number of conserved motifs, except for MaSPL28, which lacked motifs 8 and 10. The remaining 11 members (e.g., MaSPL8, MaSPL14, and MaSPL17) were found to contain eight conserved motifs. Furthermore, the eight motifs exhibited a consistent distribution and were arranged in the following order: motif 8, motif 6, motif 3, motif 1, motif 2, motif 9, motif 10, and motif 5. Additionally, the MaSPL family members in Group I and Group IV exhibited a distinct pattern, with only three conserved motifs (motif 1, motif 2, and motif 3). In contrast, the MaSPLs in the remaining four groups exhibited a more diverse range of motif distributions, with four to seven motifs. The results indicate that the discrepancies in motif position and number between members of the same phylogenetic branch were minimal; however, the differences between members of different branches were more pronounced.
The MaSPL gene family also exhibited considerable variability within the gene structure, as illustrated in Figure 3C. Each MaSPL gene contains between two and twelve exons, with a maximum of twelve exons (MaSPL6) and a minimum of two exons (MaSPL1/4/21/22/24/51/53). Except for MaSPL6 in Group IV and MaSPL55 in Group II, the remaining MaSPL genes in Groups I, II, IV, and VII exhibited two to three exons, while those in Group V displayed four to six exons. The MaSPL genes in Groups III and VI exhibited ten to eleven exons. The preceding results indicate that the structure of MaSPLs in M. acuminata DH Pahang has undergone evolutionary change, with differences in the distribution position and number of exons observed among different members.

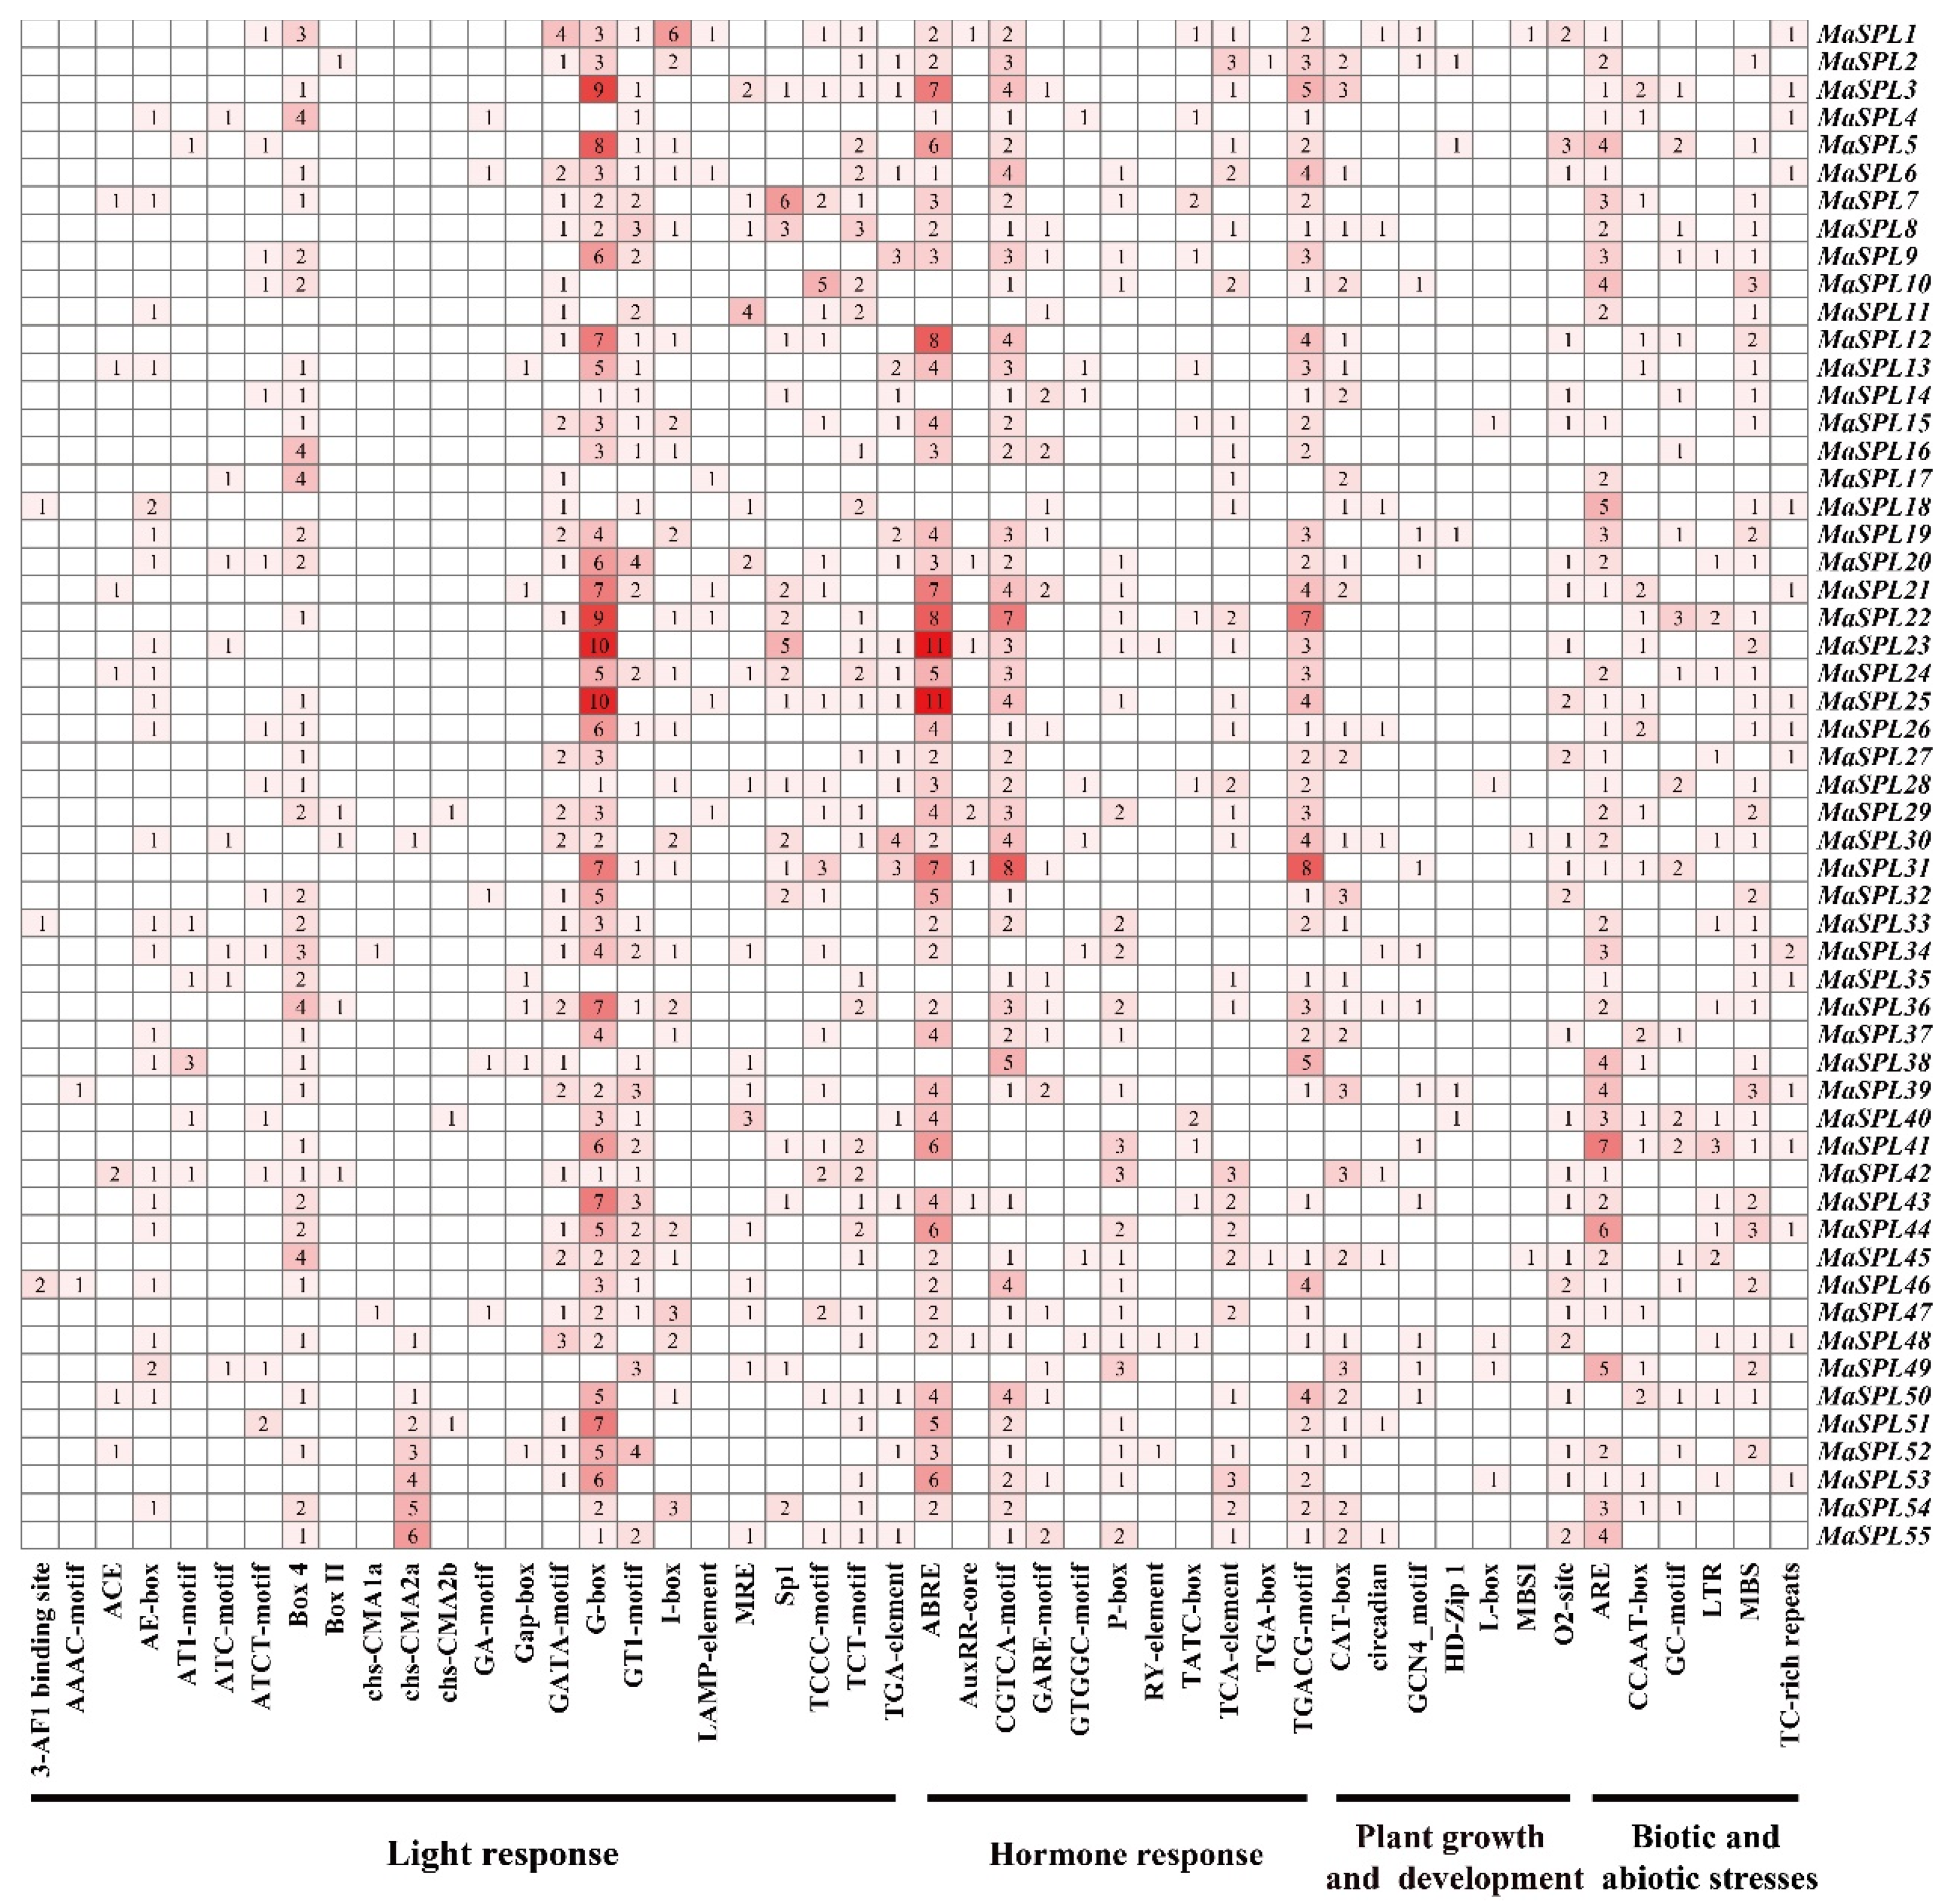
3.5. Analysis of Cis-Acting Elements in the Promoter Regions of MaSPL Genes in M. acuminata DH Pahang

The different cis-acting elements in the promoter of a gene indicate possible factors that affect the regulation of gene expression. The promoters of the 55 MaSPL genes (2 kb upstream of the start codon) in Musa acuminata DH Pahang were analyzed for putative cis-acting elements by using PlantCARE. There are four main types of cis-acting elements, including growth and development (e.g., CAT-box and L-box), hormone response (e.g., ABRE, P-box, TGACG motif, and TGA-box), light response (e.g., GT1 motif, G-box, and AT1 motif), and stress response (e.g., MBS, ARE, and TC-rich repeats) (Figure 4). For example, MaSPL22 contained the largest number of cis-acting elements (forty-nine), and MaSPL17 contained the smallest number of cis-acting elements (twelve). Notably, all MaSPL genes contained at least one cis-acting element for light, biotic/abiotic stress, growth and development, and phytohormone response (Figure 4). These results indicate the significant contributions of MaSPL genes to various biological processes as well as their involvement in response to light, abiotic/biotic stress, and hormones in Musa acuminata DH Pahang.

3.6. Expression Profile of MaSPL Genes in Different Tissues

To further identify the tissue-specific expression profiles of MaSPL genes, we used the transcriptome data (NCBI BioProject accessions: PRJNA394594) [55] and analyzed the differential expression of MaSPLs in banana roots, leaves, and fruits at different stages of development (0, 20, and 80 days after flowering, DAF) and ripening (8 and 14 days postharvest, DPH) (Figure 5). In general, several similarities in the SPL expression patterns could be identified. For example, MaSPL35 was identified as being predominantly expressed in the roots. MaSPL26 and MaSPL30 exhibited a predominant expression in the roots and leaves. Five MaSPLs (MaSPL3, MaSPL9, MaSPL13, MaSPL27, and MaSPL31) exhibited high expression in roots, leaves, and fruits at different stages of development and ripening. It is noteworthy that twelve MaSPLs (MaSPL5, MaSPL7, MaSPL24, MaSPL28, MaSPL33, MaSPL36, MaSPL39, MaSPL41, MaSPL47, MaSPL49, MaSPL52, and MaSPL55) were identified as being predominantly expressed in banana during the fruit development stage. MaSPL14 and MaSPL19 exhibited a progressive expression throughout the fruit development and post-harvest stages. In particular, MaSPL1 exhibited predominant expression during fruit development and early post-harvest stages.

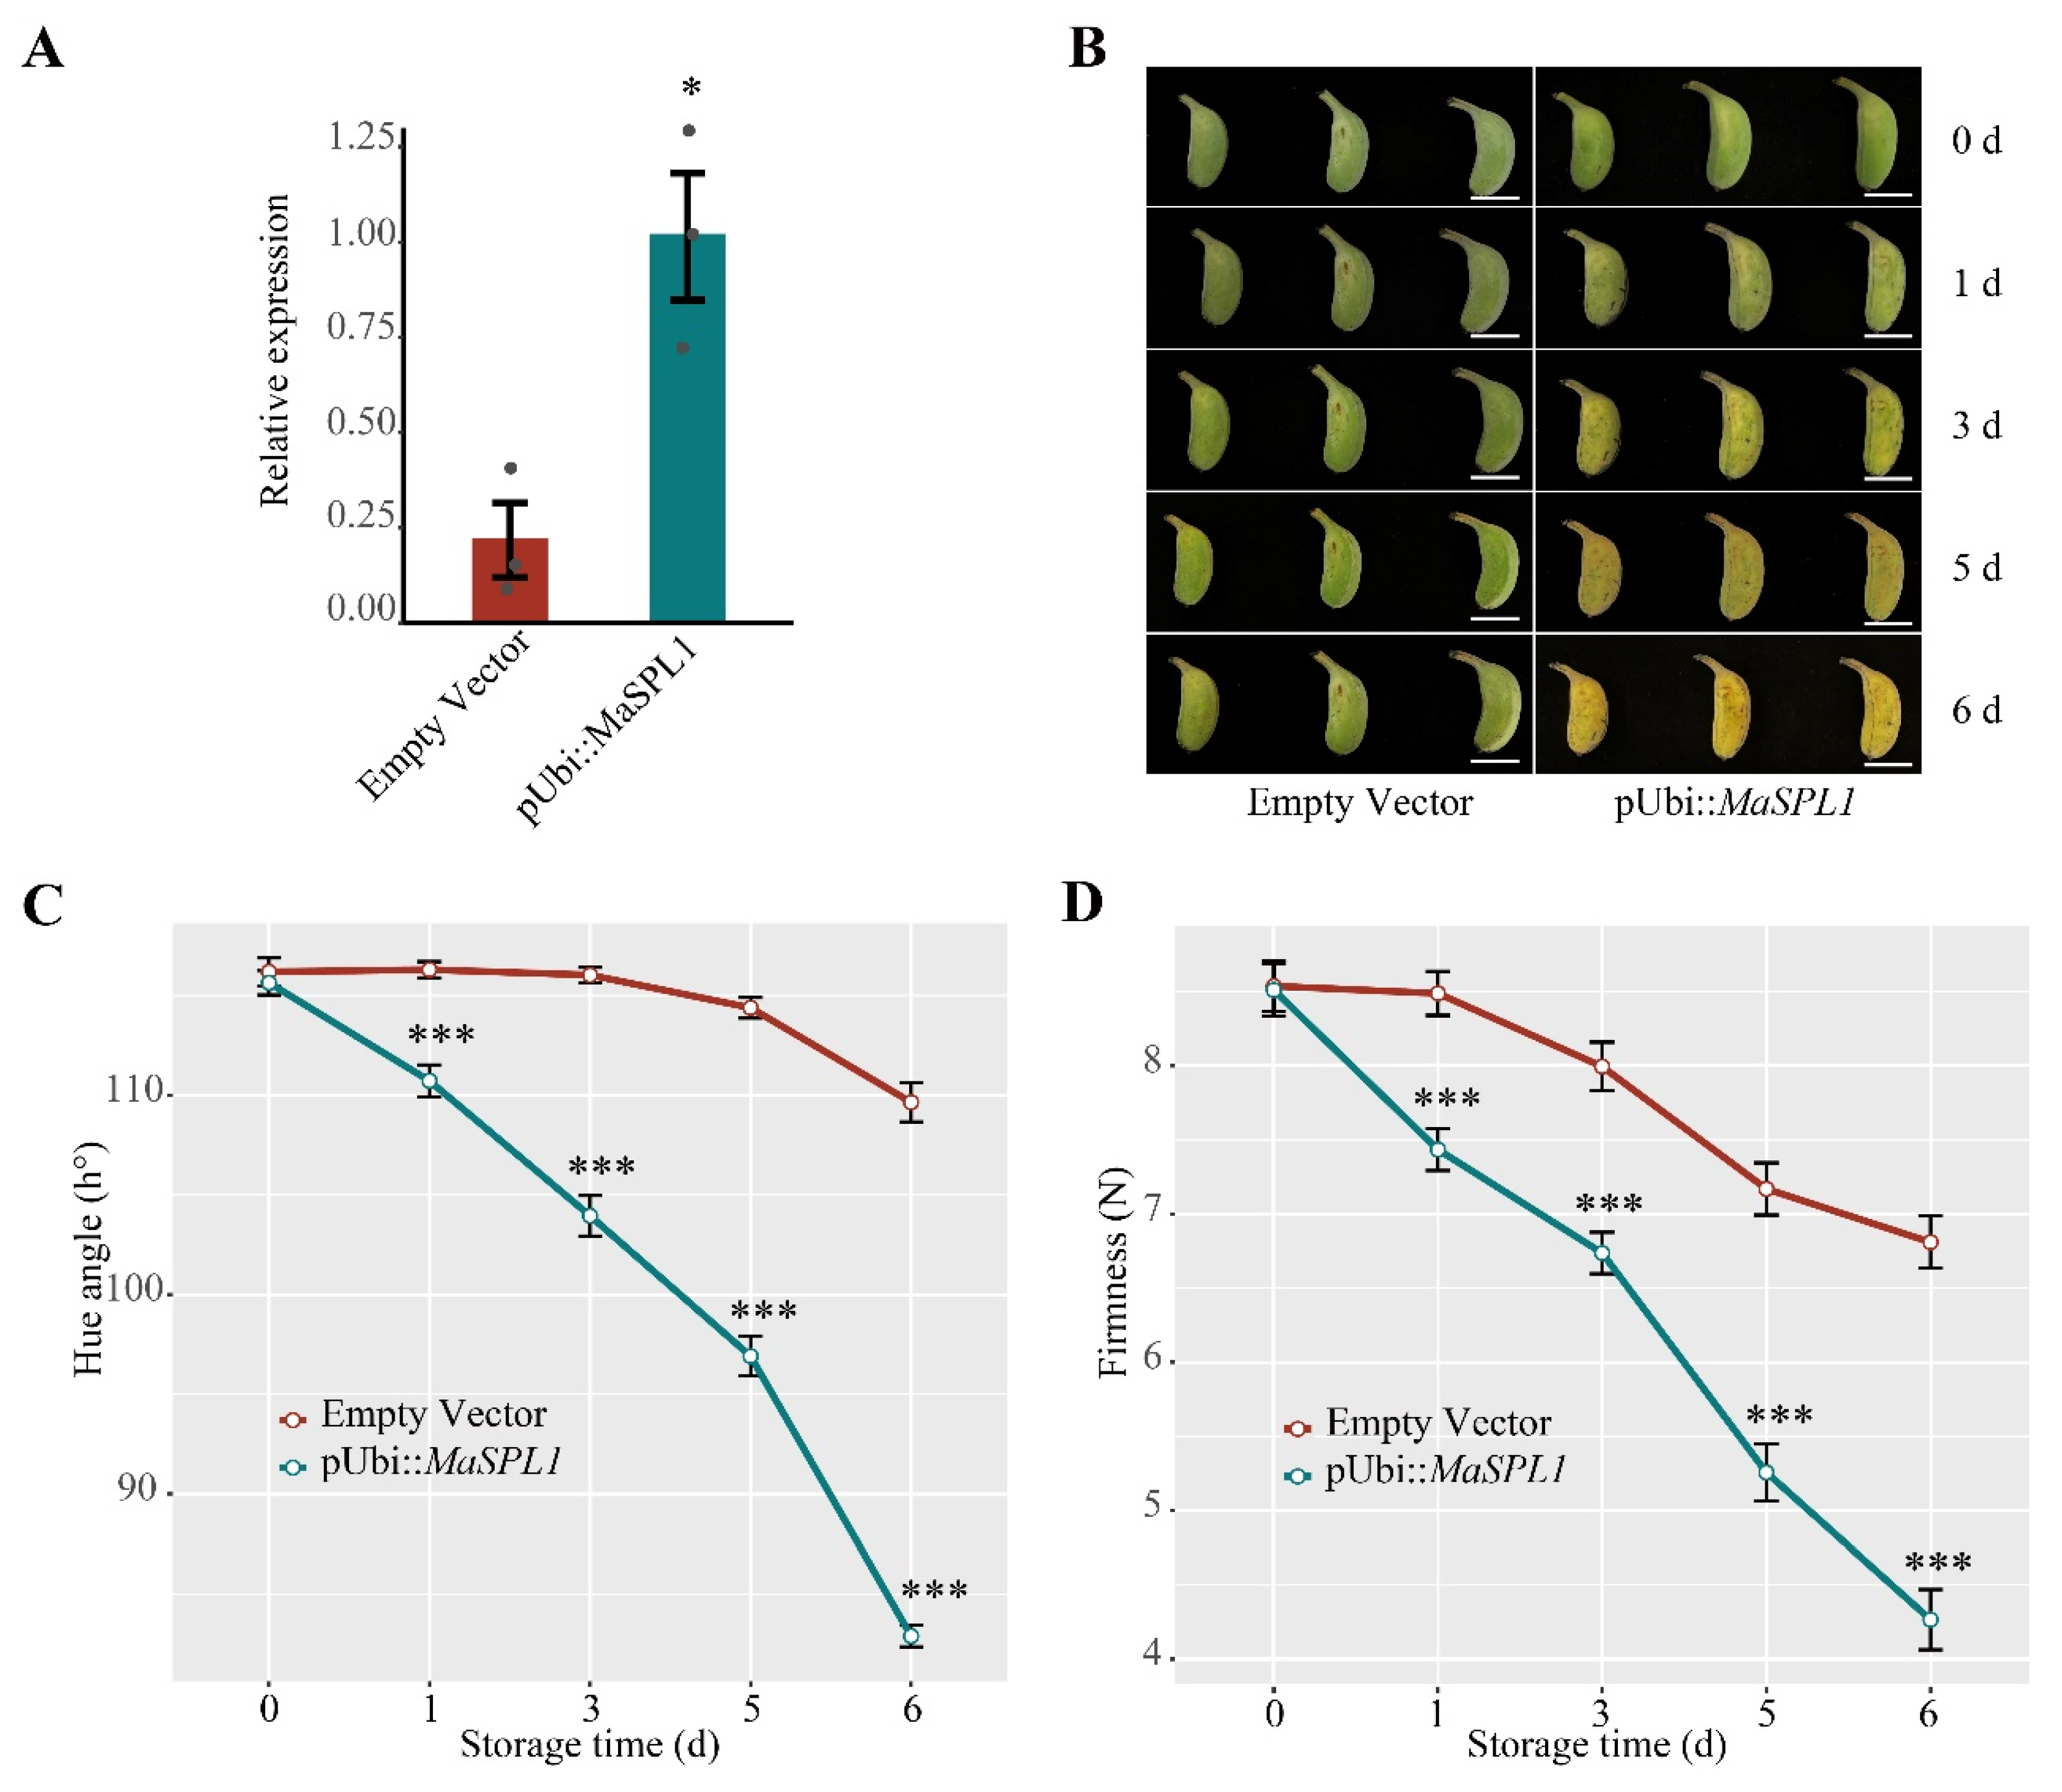
3.7. Transient Overexpression of MaSPL1 in Banana Fruits Accelerates the Fruit Ripening

To investigate the function of MaSPL1 in fruit ripening, MaSPL1 was transiently overexpressed in banana fruits (Figure 6A,B). The expression level of MaSPL1 in the transgenics was examined by RT-qPCR (Figure 6A). In contrast to the empty vector (control), the transient overexpression of MaSPL1 enhanced fruit ripening in banana, resulting in a faster yellowing (ripening) phenotype (Figure 6B). In MaSPL1-overexpressing fruits, the decline in the hue angle was advanced by three days during maturation (Figure 6C); meanwhile, the firmness level of fruits reduced throughout the ripening process (Figure 6D). These findings indicate that MaSPL1 plays a positive role in regulating fruit ripening in bananas.

4. Discussion

Over the past decades, the members of SPL (SQUAMOSA-PROMOTER BINDING PROTEIN-LIKE) transcription factors have been functionally characterized as crucial regulators for various plant developmental and stress-related processes [57,58]. Given the well-established roles in model plants like Arabidopsis and important crops, the SPL gene family in bananas has not been extensively explored. In this study, a total of 55 MaSPL genes were identified from the M. acuminata DH Pahang and classified into seven groups with the orthologs in A. thaliana, O. sativa, and Z. mays (Figure 1). By means of the phylogenetic analysis (Figure 3A), the conserved motif (Figure 3B) and the gene structure analyses (Figure 3C), it was revealed that MaSPL genes within the same group exhibited a similar motif arrangement and gene structure, which suggested conserved evolutionary relationship among these genes and also supported the phylogenetic analysis (Figure 1).
Here, based on the expression patterns in different tissues, the MaSPL family genes were mainly classified into three groups, including the constitutional high-expression group, the tissue-specific expression group, and the constitutional low-expression group within the given tissues (Figure 5). These expression patterns may reflect the fine regulation and selection of SPL gene family members in different tissues, particularly during the fruit development and post-harvest stages in bananas. In addition, the potential function of MaSPL genes in bananas can be more accurately predicted by analyzing expression patterns and phylogenetic relationships with SPL genes from other plant species (e.g., rice, maize, and Arabidopsis). For example, most MaSPL genes cluster independently into a specific branch on the phylogenetic tree, yet exhibit diverse gene expression patterns (Figure 1 and Figure 5). It is notable that TGA1 [31] and OsSPL16 [27,28,29] play a pivotal role in glume development and regulate the size, shape, and quality of the seed. In banana, a total of 12 genes homologous to TGA1 and OsSPL16 were identified, yet significant differences in expression patterns were observed (Figure 5). Only 4 of the 12 genes, MaSPL5, MaSPL19, MaSPL39, and MaSPL55, were found to be predominantly expressed during the developmental stages of banana fruit (Figure 5). Notably, previous studies have already confirmed that MaSPL39 (also known as MaSPL16) can directly bind with the “GTAC” element of the MaNAC029 promoter, activate the transcription level, and positively regulate fruit ripening in bananas [30]. Hence, these findings suggest the potential for significant differences in the functional evolution of Group II SPL genes and further corroborate that the MaSPL gene family has abundant biological functions. Further investigation, particularly through the development and characterization of transgenic banana lines overexpressing or silencing MaSPL genes [59], is necessary to validate their diverse biological functions, including the regulation of fruit morphology, postharvest characteristics, and other agronomic traits.
As a typical climacteric fruit, banana undergoes postharvest ripening through a genetically programmed, highly coordinated, and irreversible process regulated by plant hormones, environmental signals, and both transcriptional and post-translational mechanisms [60,61,62]. At the transcriptional level, several transcription factors, such as MabHLH28 [40], MaNAC169 [44], and MaSPL16 [30], have been shown to regulate key ripening-related genes associated with cell wall degradation and starch conversion. These transcription factors function by binding to the promoters of target genes, modulating their expression in response to developmental and hormonal cues. Importantly, in this study, MaSPL1 exhibited predominant expression during fruit development and the early postharvest stages (Figure 5). Transient overexpression of MaSPL1 in banana fruit provided compelling evidence of its pivotal role in postharvest ripening (Figure 6). While this study elucidated the biological function of MaSPL1 in banana fruit ripening, its specific regulatory mechanisms remain to be clarified. Key questions for future investigation include the following: (1) Does MaSPL1 regulate ethylene biosynthesis genes to enhance ethylene production and release? (2) Does MaSPL1 modulate the ethylene signaling pathway to amplify ethylene responses and accelerate fruit ripening? (3) Does MaSPL1 regulate the expression of cell wall-degrading enzyme genes to promote fruit softening? (4) Does MaSPL1 co-regulate banana fruit ripening by forming complexes with other regulatory factors or modulating their transcript levels? We should focus our research on these key issues to further elucidate the molecular regulatory mechanisms of MaSPL1 in banana fruit ripening. Further research, particularly using MaSPL1 transgenic lines developed through banana transgene transformation [59], is needed to confirm the critical role of MaSPL1 in fruit ripening and other agronomic traits, and to elucidate its precise molecular regulatory mechanisms.

5. Conclusions

In this study, we identified 55 putative SQUAMOSA PROMOTER BINDING PROTEIN-LIKE (SPL) transcription factors in M. acuminata ssp. malaccensis var. Pahang, classifying them into seven groups based on phylogenetic analysis. Further research revealed that the expression patterns of MaSPLs across different tissues and developmental stages exhibit distinct spatiotemporal characteristics, suggesting a potential role in banana growth and development. Notably, we found that MaSPL1 is predominantly expressed during fruit development and early postharvest stages, positively regulating fruit ripening in bananas. In summary, this study provides comprehensive information for further investigation of the specific roles of SPL genes in developmental processes, particularly during fruit development and post-harvest stages, in bananas. Future work involving transgenic banana lines overexpressing or silencing MaSPL genes [59] will be essential to elucidate their biological functions, including roles in fruit morphology, ripening, and other agronomic traits.

Supplementary Materials

The following supporting information can be downloaded at https://www.mdpi.com/article/10.3390/horticulturae11060576/s1, Figure S1: The chromosomal distribution, and duplication events of the MaSPL genes in M. acuminata DH Pahang; Figure S2: Schematic diagram of the conserved domain of MaSPL proteins in M. acuminata DH Pahang; Table S1: Identification of SPL Family Genes in Musa acuminata DH Pahang, Arabidopsis thaliana, Oryza sativa and Zea mays; Table S2: Duplication events for MaSPL gene pairs in Musa acuminata DH Pahang; Table S3: Synteny analysis of SPL genes between Musa acuminata DH Pahang and other plants (Arabidopsis thaliana, Oryza sativa and Zea mays); Table S4: Summary of primers used in this study.

Author Contributions

B.W.: Investigation, methodology, writing—original draft, writing—review and editing. T.D. (Tongxin Dou), O.S., W.H., G.D., F.B., C.L. (Chunyu Li), T.D. (Tao Dong), Q.Y., C.H., H.G., S.L. and C.L. (Cancan Liu): Supervision, methodology, formal analysis. J.L.: Conceptualization, writing—original draft, writing—review and editing, supervision. G.Y.: Conceptualization, writing—original draft, writing—review and editing, supervision, funding acquisition. Y.L.: Conceptualization, investigation, writing—original draft, writing—review and editing, supervision. All authors have read and agreed to the published version of the manuscript.

Funding

This work was supported by the Strategy of Rural Vitalization of Guangdong Provinces (2022-NJS-00-001), the National Natural Science Foundation of China (32261160375), the earmarked fund for CARS (CARS-31-01), and the IAEA CRP D23033.

Data Availability Statement

The original contributions presented in this study are included in the article. Further inquiries can be directed to the corresponding author.

Acknowledgments

We thank Jinshun Zhong from South China Agricultural University for revision and comments on the manuscript.

Conflicts of Interest

The authors declare no competing interests.

References

  1. Klein, J.; Saedler, H.; Huijser, P. A new family of DNA binding proteins includes putative transcriptional regulators of theAntirrhinum majus floral meristem identity geneSQUAMOSA. Mol. Genet. Genom. 1996, 250, 7–16. [Google Scholar] [CrossRef] [PubMed]
  2. Yamasaki, K.; Kigawa, T.; Inoue, M.; Tateno, M.; Yamasaki, T.; Yabuki, T.; Aoki, M.; Seki, E.; Matsuda, T.; Nunokawa, E.; et al. A Novel zinc-binding motif revealed by solution structures of DNA-binding domains of arabidopsis SBP-family transcription factors. J. Mol. Biol. 2004, 337, 49–63. [Google Scholar] [CrossRef]
  3. Birkenbihl, R.P.; Jach, G.; Saedler, H.; Huijser, P. Functional dissection of the plant-specific SBP-domain: Overlap of the DNA-binding and nuclear localization domains. J. Mol. Biol. 2005, 352, 585–596. [Google Scholar] [CrossRef]
  4. Huijser, P.; Klein, J.; Lönnig, W.; Meijer, H.; Saedler, H.; Sommer, H. Bracteomania, an inflorescence anomaly, is caused by the loss of function of the MADS-box gene squamosa in Antirrhinum majus. EMBO J. 1992, 11, 1239–1249. [Google Scholar] [CrossRef]
  5. Cardon, G.; Höhmann, S.; Klein, J.; Nettesheim, K.; Saedler, H.; Huijser, P. Molecular characterisation of the Arabidopsis SBP-box genes. Gene 1999, 237, 91–104. [Google Scholar] [CrossRef]
  6. Cai, C.; Guo, W.; Zhang, B. Genome-wide identification and characterization of SPL transcription factor family and their evolution and expression profiling analysis in cotton. Sci. Rep. 2018, 8, 1–13. [Google Scholar] [CrossRef]
  7. Tripathi, R.K.; Goel, R.; Kumari, S.; Dahuja, A. Genomic organization, phylogenetic comparison, and expression profiles of the SPL family genes and their regulation in soybean. Dev. Genes Evol. 2017, 227, 101–119. [Google Scholar] [CrossRef]
  8. Lu, Y.G.; Ouyang, B.; Zhang, J.H.; Wang, T.T.; Lu, C.; Han, Q.Q.; Zhao, S.N.; Ye, Z.B.; Li, H.X. Genomic organization, phy-logenetic comparison and expression profiles of annexin gene family in tomato (Solanum lycopersicum). Gene 2012, 499, 14–24. [Google Scholar] [CrossRef]
  9. Song, J.; Ma, D.; Yin, J.; Yang, L.; He, Y.; Zhu, Z.; Tong, H.; Chen, L.; Zhu, G.; Liu, Y.; et al. Genome-wide characterization and expression profiling of squamosa promoter binding protein-like (sbp) transcription factors in wheat (Triticum aestivum L.). Agronomy 2019, 9, 527. [Google Scholar] [CrossRef]
  10. Xie, K.B.; Wu, C.Q.; Xiong, L.Z. Genomic organization, differential expression, and interaction of SQUAMOSA promoter-binding-like transcription factors and microRNA156 in rice. Plant Physiol. 2006, 142, 280–293. [Google Scholar] [CrossRef]
  11. Wei, H.; Zhao, Y.; Xie, Y.; Wang, H. Exploiting SPL genes to improve maize plant architecture tailored for high-density planting. J. Exp. Bot. 2018, 69, 4675–4688. [Google Scholar] [CrossRef] [PubMed]
  12. Shao, Y.; Zhou, H.-Z.; Wu, Y.; Zhang, H.; Lin, J.; Jiang, X.; He, Q.; Zhu, J.; Li, Y.; Yu, H.; et al. OsSPL3, an SBP-domain protein, regulates crown root development in rice. Plant Cell 2019, 31, 1257–1275. [Google Scholar] [CrossRef]
  13. Kong, D.; Pan, X.; Jing, Y.; Zhao, Y.; Duan, Y.; Yang, J.; Wang, B.; Liu, Y.; Shen, R.; Cao, Y.; et al. ZmSPL10/14/26 are required for epidermal hair cell fate specification on maize leaf. New Phytol. 2021, 230, 1533–1549. [Google Scholar] [CrossRef]
  14. Unte, U.S.; Sorensen, A.-M.; Pesaresi, P.; Gandikota, M.; Leister, D.; Saedler, H.; Huijser, P. SPL8, an SBP-Box gene that affects pollen SAC development in Arabidopsis. Plant Cell 2003, 15, 1009–1019. [Google Scholar] [CrossRef]
  15. Yang, R.; Li, P.; Mei, H.; Wang, D.; Sun, J.; Yang, C.; Hao, L.; Cao, S.; Chu, C.; Hu, S.; et al. Fine-tuning of MiR528 accumulation modulates flowering time in rice. Mol. Plant 2019, 12, 1103–1113. [Google Scholar] [CrossRef]
  16. Yang, J.; Wei, H.; Hou, M.; Chen, L.; Zou, T.; Ding, H.; Jing, Y.; Zhang, X.; Zhao, Y.; Liu, Q.; et al. ZmSPL13 and ZmSPL29 act together to promote vegetative and reproductive transition in maize. New Phytol. 2023, 239, 1505–1520. [Google Scholar] [CrossRef]
  17. Yamaguchi, A.; Wu, M.-F.; Yang, L.; Wu, G.; Poethig, R.S.; Wagner, D. The MicroRNA-regulated SBP-Box transcription factor SPL3 is a direct upstream activator of LEAFY, FRUITFULL, and APETALA1. Dev. Cell 2009, 17, 268–278. [Google Scholar] [CrossRef]
  18. Wang, L.; Ming, L.C.; Liao, K.Y.; Xia, C.J.; Sun, S.Y.; Chang, Y.; Wang, H.K.; Fu, D.B.; Xu, C.H.; Wang, Z.J.; et al. Bract suppression regulated by the miR156/529-SPLs-NL1-PLA1 module is required for the transition from vegetative to reproductive branching in rice. Mol. Plant. 2021, 14, 1168–1184. [Google Scholar] [CrossRef]
  19. Ishii, T.; Numaguchi, K.; Miura, K.; Yoshida, K.; Thanh, P.T.; Htun, T.M.; Yamasaki, M.; Komeda, N.; Matsumoto, T.; Terauchi, R.; et al. OsLG1 regulates a closed panicle trait in domesticated rice. Nat. Genet. 2013, 45, 462–465. [Google Scholar] [CrossRef]
  20. Jiao, Y.; Wang, Y.; Xue, D.; Wang, J.; Yan, M.; Liu, G.; Dong, G.; Zeng, D.; Lu, Z.; Zhu, X.; et al. Regulation of OsSPL14 by OsmiR156 defines ideal plant architecture in rice. Nat. Genet. 2010, 42, 541–544. [Google Scholar] [CrossRef]
  21. Miura, K.; Ikeda, M.; Matsubara, A.; Song, X.-J.; Ito, M.; Asano, K.; Matsuoka, M.; Kitano, H.; Ashikari, M. OsSPL14 promotes panicle branching and higher grain productivity in rice. Nat. Genet. 2010, 42, 545–549. [Google Scholar] [CrossRef] [PubMed]
  22. Kong, D.; Li, C.; Xue, W.; Wei, H.; Ding, H.; Hu, G.; Zhang, X.; Zhang, G.; Zou, T.; Xian, Y.; et al. UB2/UB3/TSH4-anchored transcriptional networks regulate early maize inflorescence development in response to simulated shade. Plant Cell 2022, 35, 717–737. [Google Scholar] [CrossRef] [PubMed]
  23. Liu, Y.; Wu, G.; Zhao, Y.; Wang, H.H.; Dai, Z.; Xue, W.; Yang, J.; Wei, H.; Shen, R.; Wang, H. DWARF53 interacts with transcription factors UB2/UB3/TSH4 to regulate maize tillering and tassel branching. Plant Physiol. 2021, 187, 947–962. [Google Scholar] [CrossRef]
  24. Zhao, B.; Xu, M.; Zhao, Y.; Li, Y.; Xu, H.; Li, C.; Kong, D.; Xie, Y.; Zheng, Z.; Wang, B.; et al. Overexpression of ZmSPL12 confers enhanced lodging resistance through transcriptional regulation of D1 in maize. Plant Biotechnol. J. 2022, 20, 622–624. [Google Scholar] [CrossRef]
  25. Wang, J.; Zhou, L.; Shi, H.; Chern, M.; Yu, H.; Yi, H.; He, M.; Yin, J.; Zhu, X.; Li, Y.; et al. A single transcription factor promotes both yield and immunity in rice. Science 2018, 361, 1026–1028. [Google Scholar] [CrossRef]
  26. Zhang, X.-F.; Yang, C.-Y.; Lin, H.-X.; Wang, J.-W.; Xue, H.-W. Rice SPL12 coevolved with GW5 to determine grain shape. Sci. Bull. 2021, 66, 2353–2357. [Google Scholar] [CrossRef]
  27. Song, X.; Meng, X.; Guo, H.; Cheng, Q.; Jing, Y.; Chen, M.; Liu, G.; Wang, B.; Wang, Y.; Li, J.; et al. Targeting a gene regulatory element enhances rice grain yield by decoupling panicle number and size. Nat. Biotechnol. 2022, 40, 1403–1411. [Google Scholar] [CrossRef]
  28. Wang, S.; Li, S.; Liu, Q.; Wu, K.; Zhang, J.; Wang, S.; Wang, Y.; Chen, X.; Zhang, Y.; Gao, C.; et al. The OsSPL16-GW7 regulatory module determines grain shape and simultaneously improves rice yield and grain quality. Nat. Genet. 2015, 47, 949–954. [Google Scholar] [CrossRef]
  29. Wang, S.; Wu, K.; Yuan, Q.; Liu, X.; Liu, Z.; Lin, X.; Zeng, R.; Zhu, H.; Dong, G.; Qian, Q.; et al. Control of grain size, shape and quality by OsSPL16 in rice. Nat. Genet. 2012, 44, 950–954. [Google Scholar] [CrossRef]
  30. Wei, W.; Yang, Y.-Y.; Wu, C.-J.; Kuang, J.-F.; Chen, J.-Y.; Shan, W. MaSPL16 positively regulates fruit ripening in bananas via the direct transcriptional induction of MaNAC029. Hortic. Adv. 2023, 1, 1–13. [Google Scholar] [CrossRef]
  31. Dorweiler, J.; Stec, A.; Kermicle, J.; Doebley, J. Teosinte glume architecture 1: A genetic locus controlling a key step in maize evolution. Science 1993, 262, 233–235. [Google Scholar] [CrossRef] [PubMed]
  32. Zhu, X.; Gou, Y.; Heng, Y.; Ding, W.; Li, Y.; Zhou, D.; Li, X.; Liang, C.; Wu, C.; Wang, H.; et al. Targeted manipulation of grain shape genes effectively improves outcrossing rate and hybrid seed production in rice. Plant Biotechnol. J. 2023, 21, 381–390. [Google Scholar] [CrossRef]
  33. Lai, T.; Wang, X.; Ye, B.; Jin, M.; Chen, W.; Wang, Y.; Zhou, Y.; Blanks, A.M.; Gu, M.; Zhang, P.; et al. Molecular and functional characterization of the SBP-box transcription factor SPL-CNR in tomato fruit ripening and cell death. J. Exp. Bot. 2020, 71, 2995–3011. [Google Scholar] [CrossRef]
  34. Obando-Ulloa, J.M.; Jowkar, M.; Moreno, E.; Souri, M.K.; Martínez, J.A.; Bueso, M.C.; Monforte, A.J.; Fernández-Trujillo, J.P. Discrimination of climacteric and non-climacteric melon fruit at harvest or at the senescence stage by quality traits. J. Sci. Food Agric. 2009, 89, 1743–1753. [Google Scholar] [CrossRef]
  35. Luo, Q.; Wei, W.; Yang, Y.-Y.; Wu, C.-J.; Chen, J.-Y.; Lu, W.-J.; Kuang, J.-F.; Shan, W. E3 ligase MaNIP1 degradation of NON-YELLOW COLORING1 at high temperature inhibits banana degreening. Plant Physiol. 2023, 192, 1969–1981. [Google Scholar] [CrossRef]
  36. Si, J.; Fan, Z.Q.; Wu, C.J.; Yang, Y.Y.; Shan, W.; Kuang, J.F.; Lu, W.J.; Wei, W.; Chen, J.Y. MaHsf24, a novel negative modulator, regulates cold tolerance in banana fruits by repressing the expression of HSPs and antioxidant enzyme genes. Plant Biotechnol. J. 2024, 22, 2873–2886. [Google Scholar] [CrossRef]
  37. Wu, C.; Deng, W.; Shan, W.; Liu, X.; Zhu, L.; Cai, D.; Wei, W.; Yang, Y.; Chen, J.; Lu, W.; et al. Banana MKK1 modulates fruit ripening via the MKK1-MPK6-3/11-4-bZIP21 module. Cell Rep. 2023, 42, 112832. [Google Scholar] [CrossRef]
  38. Fan, Z.; Ba, L.; Shan, W.; Xiao, Y.; Lu, W.; Kuang, J.; Chen, J. A banana R2R3-MYB transcription factor MaMYB3 is involved in fruit ripening through modulation of starch degradation by repressing starch degradation-related genes and MabHLH6. Plant J. 2018, 96, 1191–1205. [Google Scholar] [CrossRef]
  39. Liu, F.; Dou, T.; Hu, C.; Zhong, Q.; Sheng, O.; Yang, Q.; Deng, G.; He, W.; Gao, H.; Li, C.; et al. WRKY transcription factor MaWRKY49 positively regulates pectate lyase genes during fruit ripening of Musa acuminata. Plant Physiol. Biochem. 2023, 194, 643–650. [Google Scholar] [CrossRef]
  40. Wu, C.J.; Cai, D.L.; Li, J.; Lin, Z.X.; Wei, W.; Shan, W.; Chen, J.Y.; Lu, W.J.; Su, X.G.; Kuang, J.F. Banana MabHLH28 positively regulates the expression of softening-related genes to mediate fruit ripening independently or via cooperating with MaWRKY49/111. Hortic. Res. 2024, 11, uhae053. [Google Scholar] [CrossRef]
  41. Wei, W.; Yang, Y.-Y.; Wu, C.-J.; Kuang, J.-F.; Lu, W.-J.; Chen, J.-Y.; Shan, W. MaNAC19–MaXB3 regulatory module mediates sucrose synthesis in banana fruit during ripening. Int. J. Biol. Macromol. 2023, 253, 127144. [Google Scholar] [CrossRef] [PubMed]
  42. Wei, W.; Yang, Y.-Y.; Chen, J.-Y.; Lakshmanan, P.; Kuang, J.-F.; Lu, W.-J.; Shan, W. MaNAC029 modulates ethylene biosynthesis and fruit quality and undergoes MaXB3-mediated proteasomal degradation during banana ripening. J. Adv. Res. 2022, 53, 33–47. [Google Scholar] [CrossRef] [PubMed]
  43. Wei, W.; Yang, Y.-Y.; Wu, C.-J.; Kuang, J.-F.; Chen, J.-Y.; Lu, W.-J.; Shan, W. MaMADS1–MaNAC083 transcriptional regulatory cascade regulates ethylene biosynthesis during banana fruit ripening. Hortic. Res. 2023, 10, uhad177. [Google Scholar] [CrossRef] [PubMed]
  44. Liu, F.; Sun, X.L.; He, J.; Shan, J.J.; Sheng, O.; Dou, T.X.; Li, Y.Y.; He, W.D.; Yang, Q.S.; Hu, C.H.; et al. Membrane-associated NAC transcription factor MaNAC169 is a positive regulator during banana fruit ripening. Postharvest Biol. Tec. 2025, 223, 113451. [Google Scholar] [CrossRef]
  45. Fu, M.; Zheng, Y.; Zhang, J.; Deng, C.; Zhang, J.; Jia, C.; Miao, H.; Wang, J.; Zheng, S.; Jin, Z.; et al. MaEIL4-MaMADS36-MaACS7 module transcriptionally regulates ethylene biosynthesis during banana fruit ripening. Hortic. Res. 2024, 12, uhae345. [Google Scholar] [CrossRef]
  46. Li, H.; Chen, Z.; Zhu, W.; Ni, X.; Wang, J.; Fu, L.; Chen, J.; Li, T.; Tang, L.; Yang, Y.; et al. The MaNAP1-MaMADS1 transcription factor module mediates ethylene-regulated peel softening and ripening in banana. Plant Cell 2024, 37. [Google Scholar] [CrossRef]
  47. Quevillon, E.; Silventoinen, V.; Pillai, S.; Harte, N.; Mulder, N.; Apweiler, R.; Lopez, R. InterProScan: Protein domains identi-fier. Nucleic Acids Res. 2005, 33, W116–W120. [Google Scholar] [CrossRef]
  48. Wang, J.Y.; Chitsaz, F.; Derbyshire, M.K.; Gonzales, N.R.; Gwadz, M.; Lu, S.N.; Marchler, G.H.; Song, J.S.; Thanki, N.; Yam-ashita, R.A.; et al. The conserved domain database in 2023. Nucleic Acids Res. 2023, 51, D384–D388. [Google Scholar] [CrossRef]
  49. Letunic, I.; Bork, P. 20 years of the SMART protein domain annotation resource. Nucleic Acids Res. 2018, 46, D493–D496. [Google Scholar] [CrossRef]
  50. Bailey, T.L.; Boden, M.; Buske, F.A.; Frith, M.; Grant, C.E.; Clementi, L.; Ren, J.; Li, W.W.; Noble, W.S. MEME SUITE: Tools for motif discovery and searching. Nucleic Acids Res. 2009, 37, w202–w208. [Google Scholar] [CrossRef]
  51. Chen, C.J.; Wu, Y.; Li, J.W.; Wang, X.; Zeng, Z.H.; Xu, J.; Liu, Y.L.; Feng, J.T.; Chen, H.; He, Y.H.; et al. TBtools-II: A “one for all, all for one” bioinformatics platform for biological big-data mining. Mol. Plant. 2023, 16, 1733–1742. [Google Scholar] [CrossRef] [PubMed]
  52. Kumar, S.; Stecher, G.; Tamura, K. MEGA7: Molecular evolutionary genetics analysis version 7.0 for bigger datasets. Mol. Biol. Evol. 2016, 33, 1870–1874. [Google Scholar] [CrossRef]
  53. Wang, Y.; Tang, H.; DeBarry, J.D.; Tan, X.; Li, J.; Wang, X.; Lee, T.-H.; Jin, H.; Marler, B.; Guo, H.; et al. MCScanX: A toolkit for detection and evolutionary analysis of gene synteny and collinearity. Nucleic Acids Res. 2012, 40, e49. [Google Scholar] [CrossRef] [PubMed]
  54. Lescot, M.; Déhais, P.; Thijs, G.; Marchal, K.; Moreau, Y.; Van de Peer, Y.; Rouzé, P.; Rombauts, S. PlantCARE, a database of plant cis-acting regulatory elements and a portal to tools for in silico analysis of promoter sequences. Nucleic Acids Res. 2002, 30, 325–327. [Google Scholar] [CrossRef]
  55. Wang, Z.; Miao, H.; Liu, J.; Xu, B.; Yao, X.; Xu, C.; Zhao, S.; Fang, X.; Jia, C.; Wang, J.; et al. Musa balbisiana genome reveals subgenome evolution and functional divergence. Nat. Plants 2019, 5, 810–821. [Google Scholar] [CrossRef]
  56. Chen, L.; Zhong, H.-Y.; Kuang, J.-F.; Li, J.-G.; Lu, W.-J.; Chen, J.-Y. Validation of reference genes for RT-qPCR studies of gene expression in banana fruit under different experimental conditions. Planta 2011, 234, 377–390. [Google Scholar] [CrossRef]
  57. Wang, H.; Wang, H.Y. The miR156/SPL module, a regulatory hub and versatile toolbox, gears up crops for enhanced agronomic traits. Mol. Plant. 2015, 8, 677–688. [Google Scholar] [CrossRef]
  58. Tian, J.; Wang, C.; Xia, J.; Wu, L.; Xu, G.; Wu, W.; Li, D.; Qin, W.; Han, X.; Chen, Q.; et al. Teosinte ligule allele narrows plant architecture and enhances high-density maize yields. Science 2019, 365, 658–664. [Google Scholar] [CrossRef]
  59. Hu, C.; Liu, F.; Sheng, O.; Yang, Q.; Dou, T.; Dong, T.; Li, C.; Gao, H.; He, W.; Liu, S.; et al. Efficient and transgene-free genome editing in banana using a REG-2 promoter–driven gene-deletion system. Mol. Hortic. 2023, 3, 1–4. [Google Scholar] [CrossRef]
  60. Cheng, C.; Wu, S.; Deng, G.; Sheng, O.; Yi, G.; Yang, Q. Recent advances and future directions in banana molecular biology and breeding. Mol. Hortic. 2024, 4, 1–25. [Google Scholar] [CrossRef]
  61. Li, Y.; Huang, W.; Gao, H.; Yi, G.; Yan, S. Regulation of starch metabolism in banana fruit: Mechanisms shaping the nutritional quality. Curr. Opin. Plant Biol. 2025, 84, 102698. [Google Scholar] [CrossRef]
  62. Miao, H.; Zhang, J.; Zheng, Y.; Jia, C.; Hu, Y.; Wang, J.; Zhang, J.; Sun, P.; Jin, Z.; Zhou, Y.; et al. Shaping the future of bananas: Advancing genetic trait regulation and breeding in the postgenomics era. Hortic. Res. 2025, 12, uhaf044. [Google Scholar] [CrossRef] [PubMed]
Figure 1. Phylogenetic tree of M. acuminata DH Pahang, A. thaliana, O. sativa, and Z. mays SPL proteins. The phylogenetic tree was constructed using MEGA 7.0 software with the Maximum Likelihood (ML) method, aligning the SPL proteins from the Musa acuminata ssp. malaccensis var. Pahang (M. acuminata DH Pahang) (55), A. thaliana (17), O. sativa (19), and Z. mays (30), followed by performing 1000 bootstrap replicates. They were divided into seven groups according to the evolutionary tree and were represented by different colors. The various icons represent the SPL genes in diverse species, with dark red circles representing M. acuminata, green squares representing A. thaliana, light fuchsia triangles representing Oryza sativa, and dark blue squares representing Zea mays. At, A. thaliana; Ma, M. acuminata; Os, O. sativa; Zm, Z. mays.
Horticulturae 11 00576 g001
Figure 2. Synteny analysis of SPL genes between M. acuminata DH Pahang and three representative plant species (A. thaliana, O. sativa, and Z. mays). Green lines delineate the syntenic SPL gene pairs between M. acuminata DH Pahang and A. thaliana. Blue lines delineate the syntenic SPL gene pairs between M. acuminata DH Pahang and O. sativa. Red lines delineate the syntenic SPL gene pairs between M. acuminata DH Pahang and Z. mays.
Horticulturae 11 00576 g002
Figure 3. Phylogenetic tree, compositions of the conserved protein motifs, and gene structures of MaSPL genes in M. acuminata DH Pahang. (A) A phylogenetic tree was constructed based on 55 MaSPL proteins divided into seven groups; (B) Conserved motifs of the MaSPL proteins; the conservative motif of the MaSPL gene is predicted by the MEME method, the numbers (1–10) in the colored rectangles indicate motif 1–10, and the length of the rectangle indicates the size of the motif; (C) Exons-introns and untranslated regions (UTRs) of MaSPL genes. Yellow boxes indicate exons; black horizontal lines indicate introns; Green boxes represent UTRs. The length of the protein can be estimated using the scale at the bottom.
Horticulturae 11 00576 g003
Figure 4. Cis-acting element in the promoter region of MaSPLs in M. acuminata DH Pahang. Numbers indicate the number of cis-regulatory elements in the promoter region of the MaSPL gene. Based on functional annotation, cis-acting elements of MaSPL genes can be classified into four categories: phytohormones, light response, plant growth and development, and biotic and abiotic stress. The intensity of the red color indicates the number of cis-acting elements.
Horticulturae 11 00576 g004
Figure 5. Expression profiles of MaSPL genes in different tissues. Heat map showing the expression profiles of 55 MaSPL genes in various tissues, including roots, leaves, and fruits at different stages of development (0, 20, and 80 DAF) and ripening (8 and 14 DPH). Expression levels of the MaSPL genes are shown as the log2 (FPKM+1), transformed FPKM values obtained from the RNA-Seq data. High expression levels are shown in red, and low expression levels are shown in blue. Zero DAF, 0 days after flowering; 20 DAF, 20 days after flowering; 80 DAF, 80 days after flowering; 0 DPH, 0 days postharvest; 80 days after flowering, corresponding to the day of harvest (0 days after harvest); 8 DPH, 8 days postharvest; 14 DPH, 14 days postharvest; FPKM, fragments per kb of transcript per million fragments mapped.
Horticulturae 11 00576 g005
Figure 6. Transient upregulation of M. acuminata SPL (SQUAMOSA promoter binding protein-like) 1 (MaSPL1) in banana fruits accelerates fruit ripening. (A) RT-qPCR analysis showed the expression of MaSPL1 in MaSPL1 overexpression and control banana fruit; (B) the appearance of banana fruits that transiently overexpressed MaSPL1 and the empty vector throughout ripening. Scale bar, 5 cm; (C) hue angle and (D) fruit firmness in MaSPL1 overexpression and control banana fruit. The data are presented as the mean ± S.E. of three or four biological replicates, and the statistical significance was estimated by the two-sided Student’s t-test (* p < 0.05, *** p < 0.001).
Horticulturae 11 00576 g006
Disclaimer/Publisher’s Note: The statements, opinions and data contained in all publications are solely those of the individual author(s) and contributor(s) and not of MDPI and/or the editor(s). MDPI and/or the editor(s) disclaim responsibility for any injury to people or property resulting from any ideas, methods, instructions or products referred to in the content.

