Article

Effects of Training Systems on Sugar Accumulation and Metabolism in ‘Kyoho’ Grape Berries

1
Fruit Research Institute, Fujian Academy of Agricultural Sciences, Fuzhou 350013, China
2
FAFU-Dal Joint College, Fujian Agriculture and Forestry University, Landscape Architecture (China-Canada Cooperation), Truro, NS B2N 5E3, Canada
*
Author to whom correspondence should be addressed.
Horticulturae 2025, 11(6), 578; https://doi.org/10.3390/horticulturae11060578
Submission received: 31 March 2025 / Revised: 10 May 2025 / Accepted: 20 May 2025 / Published: 23 May 2025
(This article belongs to the Section Viticulture)

Abstract

:
To investigate the effects of straight-line-shape (SL) and inverted-umbrella-shape (IU) training systems on sugar accumulation and metabolism in ‘Kyoho’ grape berries in Fujian, this study used 16-year-old ‘Kyoho’ grapevines trained in the two systems. Fruit samples were collected from 45 to 95 days after flowering (DAF) to measure soluble sugar content. Transcriptome sequencing was performed to analyze the differential expression of sugar metabolism-related genes, combined with KEGG enrichment analysis and RT-qPCR validation of key genes. The results showed that, at the same stage, the soluble sugar content in berries under the SL training system was significantly higher than that under the IU training system, especially from 45 to 65 DAF, where sugar accumulation was faster. Transcriptome analysis revealed that the SL training system showed 6274, 5597, and 2064 differentially expressed genes at 45, 65, and 95 DAF, respectively. Key sugar metabolism-related genes, such as fructokinase (FK), phosphofructokinase (PFK), and sucrose phosphate synthase (SPS), exhibited significantly higher expression levels in the SL training system than in the IU training system. KEGG enrichment analysis indicated that the SL training system significantly enriched sugar metabolism and transport pathways during the early fruit ripening stage. RT-qPCR validation confirmed that genes related to sugar metabolism and transport (such as FK7, SUS3, SPP1) were expressed at significantly higher levels in the SL training system than in the IU training system. In conclusion, the SL training system significantly promoted soluble sugar accumulation and accelerated fruit ripening in ‘Kyoho’ grapes by regulating the expression of sugar metabolism and transport-related genes, providing a theoretical basis for promoting the SL training system in production.

1. Introduction

Grape (Vitis vinifera L.), one of the world’s four major fruit tree species, is highly favored by consumers due to its soft and juicy berries, distinctive flavor, and rich content of nutrients such as polyphenolic compounds, vitamins, and minerals [1]. China is a leading global producer of grapes, and in recent years, significant advancements in cultivation techniques—particularly the widespread adoption of rain shelter facilities in southern regions—have effectively mitigated the adverse effects of excessive rainfall on grape growth, greatly promoting the sustainable development of the grape industry [2]. ‘Kyoho’ grape (Vitis vinifera × Vitis labrusca), an excellent table grape cultivar, was introduced to Fujian Province in the 1980s. Owing to its strong adaptability, high yield, and superior quality, it has rapidly become the dominant local variety, accounting for over 70% of the province’s grape production [3]. However, with the extensive adoption of rain shelter cultivation, vineyard microenvironments often exhibit high temperatures, high humidity, and low light intensity, leading to delayed fruit ripening, slow coloration, and quality deterioration. These issues have negatively impacted the industry’s vitality and its potential for high-quality, efficient development. Therefore, in-depth research on the regulatory mechanisms of sugar metabolism in grape berries is of great significance for improving fruit quality.
In the rain shelter cultivation system of Fujian Province, the synergistic optimization of training systems and facility environments has emerged as a core strategy for improving grape light-use efficiency and fruit quality [4]. Taking ‘Kyoho’ grape as an example, our preliminary research revealed that compared with the traditional high-head-trained inverted umbrella system, the single-horizontal-cordon (SHC) training system significantly increased the leaf net photosynthetic rate by 24.5% through optimized canopy light distribution. This advantage in light utilization directly translated into enhanced fruit quality. Data collected over two consecutive years demonstrated that under the SHC system, berries exhibited 15.6–18.9% higher soluble sugar content, a 23.8–47.4% greater sugar-to-acid ratio, and a 13.6–30.8% reduction in titratable acidity [4].
Sugar components in grape berries, particularly glucose, fructose, and sucrose, serve as critical determinants of fruit flavor and quality [5]. The accumulation of sugars and regulation of their metabolic pathways not only directly influence berry taste and nutritional value but also participate in modulating the fruit ripening process [6,7]. Research has demonstrated that key enzymes in sugar metabolism pathways—including sucrose synthase (SS), sucrose phosphate synthase (SPS), and invertase (INV)—play pivotal roles in sugar accumulation and metabolic processes [8,9]. Therefore, in-depth investigation of the regulatory mechanisms underlying sugar metabolism in grape berries is of significant importance for fruit quality improvement.
The training system serves as a critical factor influencing grape photosynthesis, berry development, and sugar accumulation. Different training architectures affect sugar metabolism and ripening processes by modulating canopy microenvironments and improving light penetration and air circulation [10,11]. Studies have demonstrated that optimized training systems can significantly enhance photosynthetic efficiency and promote sugar accumulation in grape berries [10,12]. For instance, vertically distributed training systems exhibit higher photosynthetic efficiency due to their uniform light distribution, which facilitates sugar accumulation [13]. While existing research has reported on the regulation of sugar metabolism-related gene expression during fruit development—including studies showing that VvSS and VvSPS comprise multiple gene family members whose encoded enzyme activities are closely associated with fructose and sucrose synthesis [14]—investigations remain insufficient regarding how training systems influence sugar accumulation through the regulation of sugar metabolism-related gene expression.
Previous studies by our research group have demonstrated that training system modification reduces canopy density compared to traditional free umbrella or horizontal curtain systems, thereby improving leaf photosynthetic performance and increasing the berry soluble solid content and sugar-to-acid ratio [4]. Based on these findings, the present study aims to investigate the effects of different training systems (straight-line-shape, SL; inverted-umbrella-shape, IU) on sugar accumulation and metabolic pathways in ‘Kyoho’ grape berries. Through comprehensive analysis of sugar content, activities of sugar metabolism-related enzymes, and gene expression patterns under different training systems, we seek to elucidate the molecular mechanisms underlying sugar metabolism regulation by training systems. The results will provide a theoretical foundation for optimizing grape cultivation techniques and improving fruit quality, while also serving as a valuable reference for other fruit tree cultivation systems.

2. Materials and Methods

2.1. Experimental Site and Plant Materials

The trial was conducted at the grape production base in Xianghuan Village, Saiqi Town, Fu’an City, Fujian Province, China (119°40′ E, 26°56′ N). This region is characterized by a subtropical monsoon climate with an altitude of 150 m, a frost-free period of 280–290 days, a mean annual temperature of 18.1–19.8 °C, an annual precipitation of 1400–1600 mm, and an accumulated temperature (≥10 °C) of 5700–6500 °C. The soil type is classified as loam.
The study examined 16-year-old Vitis vinifera × Vitis labrusca ‘Kyoho’ grapevines cultivated in multi-span rain shelter greenhouses (50.0 × 5.0 × 3.5 m per unit). Two training systems were evaluated:
(1)
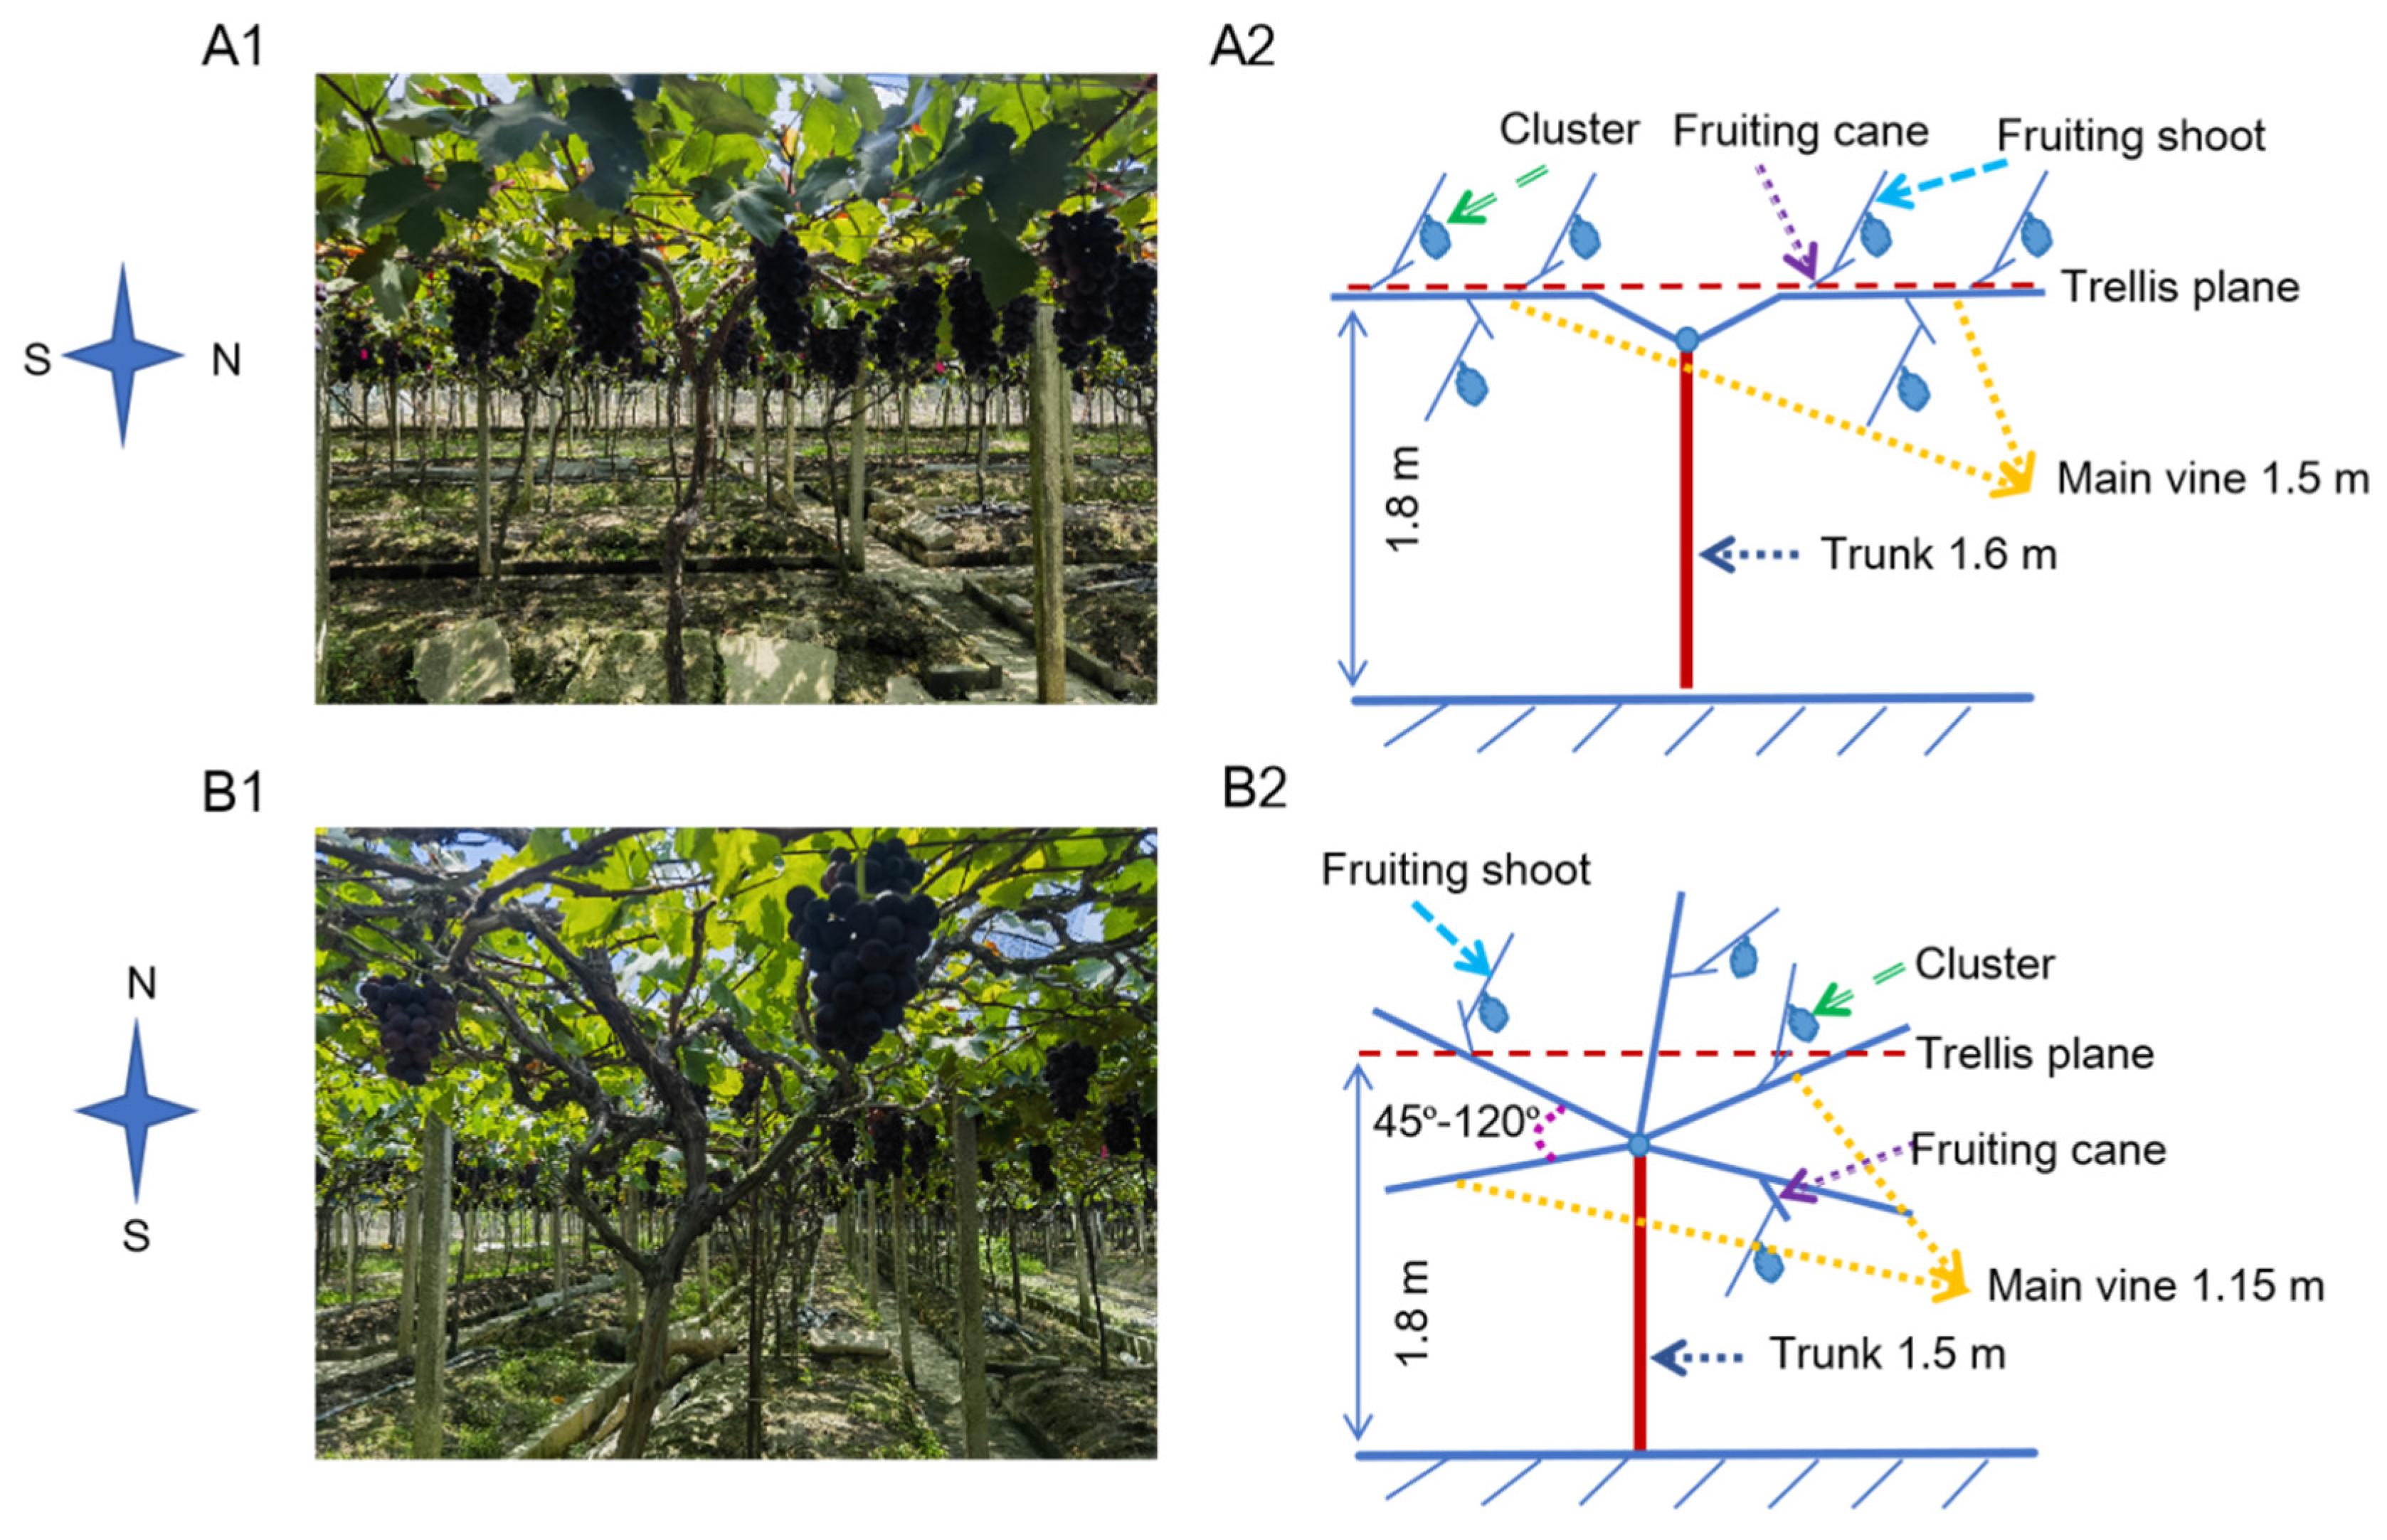
The SL system, planted with 3.0 × 2.3 m spacing, featured a 1.6 m vertical trunk with two permanent horizontal cordons developed from opposing lateral shoots (Figure 1A). These cordons were spur-pruned, retaining fruiting units every 20 cm (2–3 buds per spur during winter pruning).
(2)
The IU system, planted with 1.5 × 2.3 m spacing, maintained a 1.5 m vertical trunk with multiple lateral branches trained radially at 45–120° angles to form an open-center canopy (Figure 1B). It similarly employed spur pruning (2–3 fruiting spurs per cordon, 2–3 buds retained).
Figure 1. Schematic diagrams of two training systems for ‘Kyoho’ grapevines. (A) The SL system; (B) the IU system. 1 indicates the cultivation diagram; 2 indicates the schematic diagram.
Horticulturae 11 00578 g001
Both systems maintained horizontally oriented canopies.
The experiment was conducted from April 2022 to October 2023, with 18 vines per training system (SL and IU) randomly selected as three biological replicates (n = 6 vines per replicate) under standardized field management. Fruit sampling was performed at 10-day intervals from 45 to 95 DAF over two consecutive growing seasons. For each vine, 30 representative clusters (uniform in maturity, size, and pest/disease-free) were selected, and 9 berries per cluster (upper, middle, lower positions) were harvested, yielding 90 berries per training system. Following seed excision, the berries were flash-frozen in liquid nitrogen and stored at −80 °C for subsequent biochemical and molecular analyses.

2.2. Measurement Parameters and Methods

2.2.1. Determination of Fruit Phenotypic Traits, Color Parameters, and Biochemical Indices

Fruit sampling was conducted by randomly selecting 30 clusters per training system at each developmental stage. From each cluster, three berries were collected from upper, middle, and lower positions, yielding 90 berries per training system for analysis. Individual berry weight was measured using an analytical balance (JA2003N, Youke, Shanghai, China, ±0.001 g), with longitudinal and transverse diameters recorded via digital calipers (500-196-20, Yuanhengtong, Shenzhen, China, ±0.01 mm). Peeled berries were homogenized in liquid nitrogen and centrifuged at 5000 RPM for 10 min at 44 °C. The resulting supernatant was immediately analyzed for soluble solid content using a digital refractometer (PAL-1, Atago, Tokyo, Japan), which was calibrated with distilled water before each measurement series.
Berry skin color was quantified using an HP-200 precision colorimeter (Hanpu Chromatic Technology Co., Ltd., Shenzhen, China) with D65 illuminant and 10° observer. For each training system, 30 berries were randomly sampled (10 clusters × 3 positions: upper/middle/lower). Two equatorial measurements per berry were recorded in CIELAB color space [15]:
  • L*: lightness (0 = black, 100 = white);
  • a*: green (−) to red (+) spectrum;
  • b: blue (−) to yellow (+) spectrum;
  • C: chroma (saturation intensity);
  • h°: hue angle (0° = red, 90° = yellow, 180° = green).

2.2.2. Sugar Component Analysis

The total sugar content in fruit samples was quantified using the phenol–sulfuric acid method [16]. Briefly, 1.0 mL of processed fruit homogenate was mixed with 0.5 mL of 5% phenol solution, followed by the addition of 2.5 mL of concentrated sulfuric acid. The mixture was vortexed thoroughly and allowed to cool. Subsequently, the solution was incubated in a water bath at 30 °C for 20 min. The absorbance of the extracted solution was measured at a wavelength of 490 nm using a spectrophotometer. Total sugar content was calculated by extrapolating the absorbance values against a pre-established standard curve.
The quantification of sugar components was performed according to the method described by Wang et al. [17]. Briefly, liquid nitrogen-treated pulp samples were homogenized using a high-speed grinder to prepare grape homogenates, which were subsequently analyzed using a High-Performance Liquid Chromatography (HPLC) system (Thermo Scientific UltiMate 3000, Thermo Scientific, Waltham, MA, USA) under the following conditions: a ZORBAX carbohydrate analytical column (4.6 × 250 mm), a mobile phase of 63% (v/v) acetonitrile aqueous solution, a flow rate of 0.5 mL/min, an injection volume of 10 μL, a column temperature of 30 °C, and a refractive index (RI) detector maintained at 35 °C with a runtime of 20 min. Prior to analysis, 100 μL of fruit homogenate was diluted 10-fold and filtered through a 0.22 μm membrane filter. Quantification of major sugar components (glucose, fructose, and sucrose) was achieved by constructing standard curves using authentic reference standards.

2.2.3. Transcriptome Sequencing and Gene Expression Quantification

Total RNA was extracted from fruit samples using the RNeasy Plant Mini Kit, Qiagen, Dusseldorf, Germany, followed by reverse transcription into cDNA. Sequencing was performed on the Illumina HiSeq 3000 platform (Illumina, San Diego, CA, USA) to generate raw reads, which were aligned to the Vitis vinifera ‘Pinot Noir’ reference genome (PN40024 v4) using Bowtie2 v2.1.0 with default parameters. Raw reads underwent stringent quality control, including the removal of low-quality bases and adapter sequences, to obtain clean reads. De novo transcriptome assembly was conducted using clean reads, followed by clustering and redundancy removal to generate non-redundant transcripts for downstream analyses. Gene expression levels were quantified as FPKM (fragments per kilobase per million mapped reads). Differential expression analysis between treatments and controls was performed using the R package DESeq2, with differentially expressed genes (DEGs) defined as those exhibiting a false discovery rate (FDR)-adjusted p < 0.05 and |log2(fold change)| > 1.

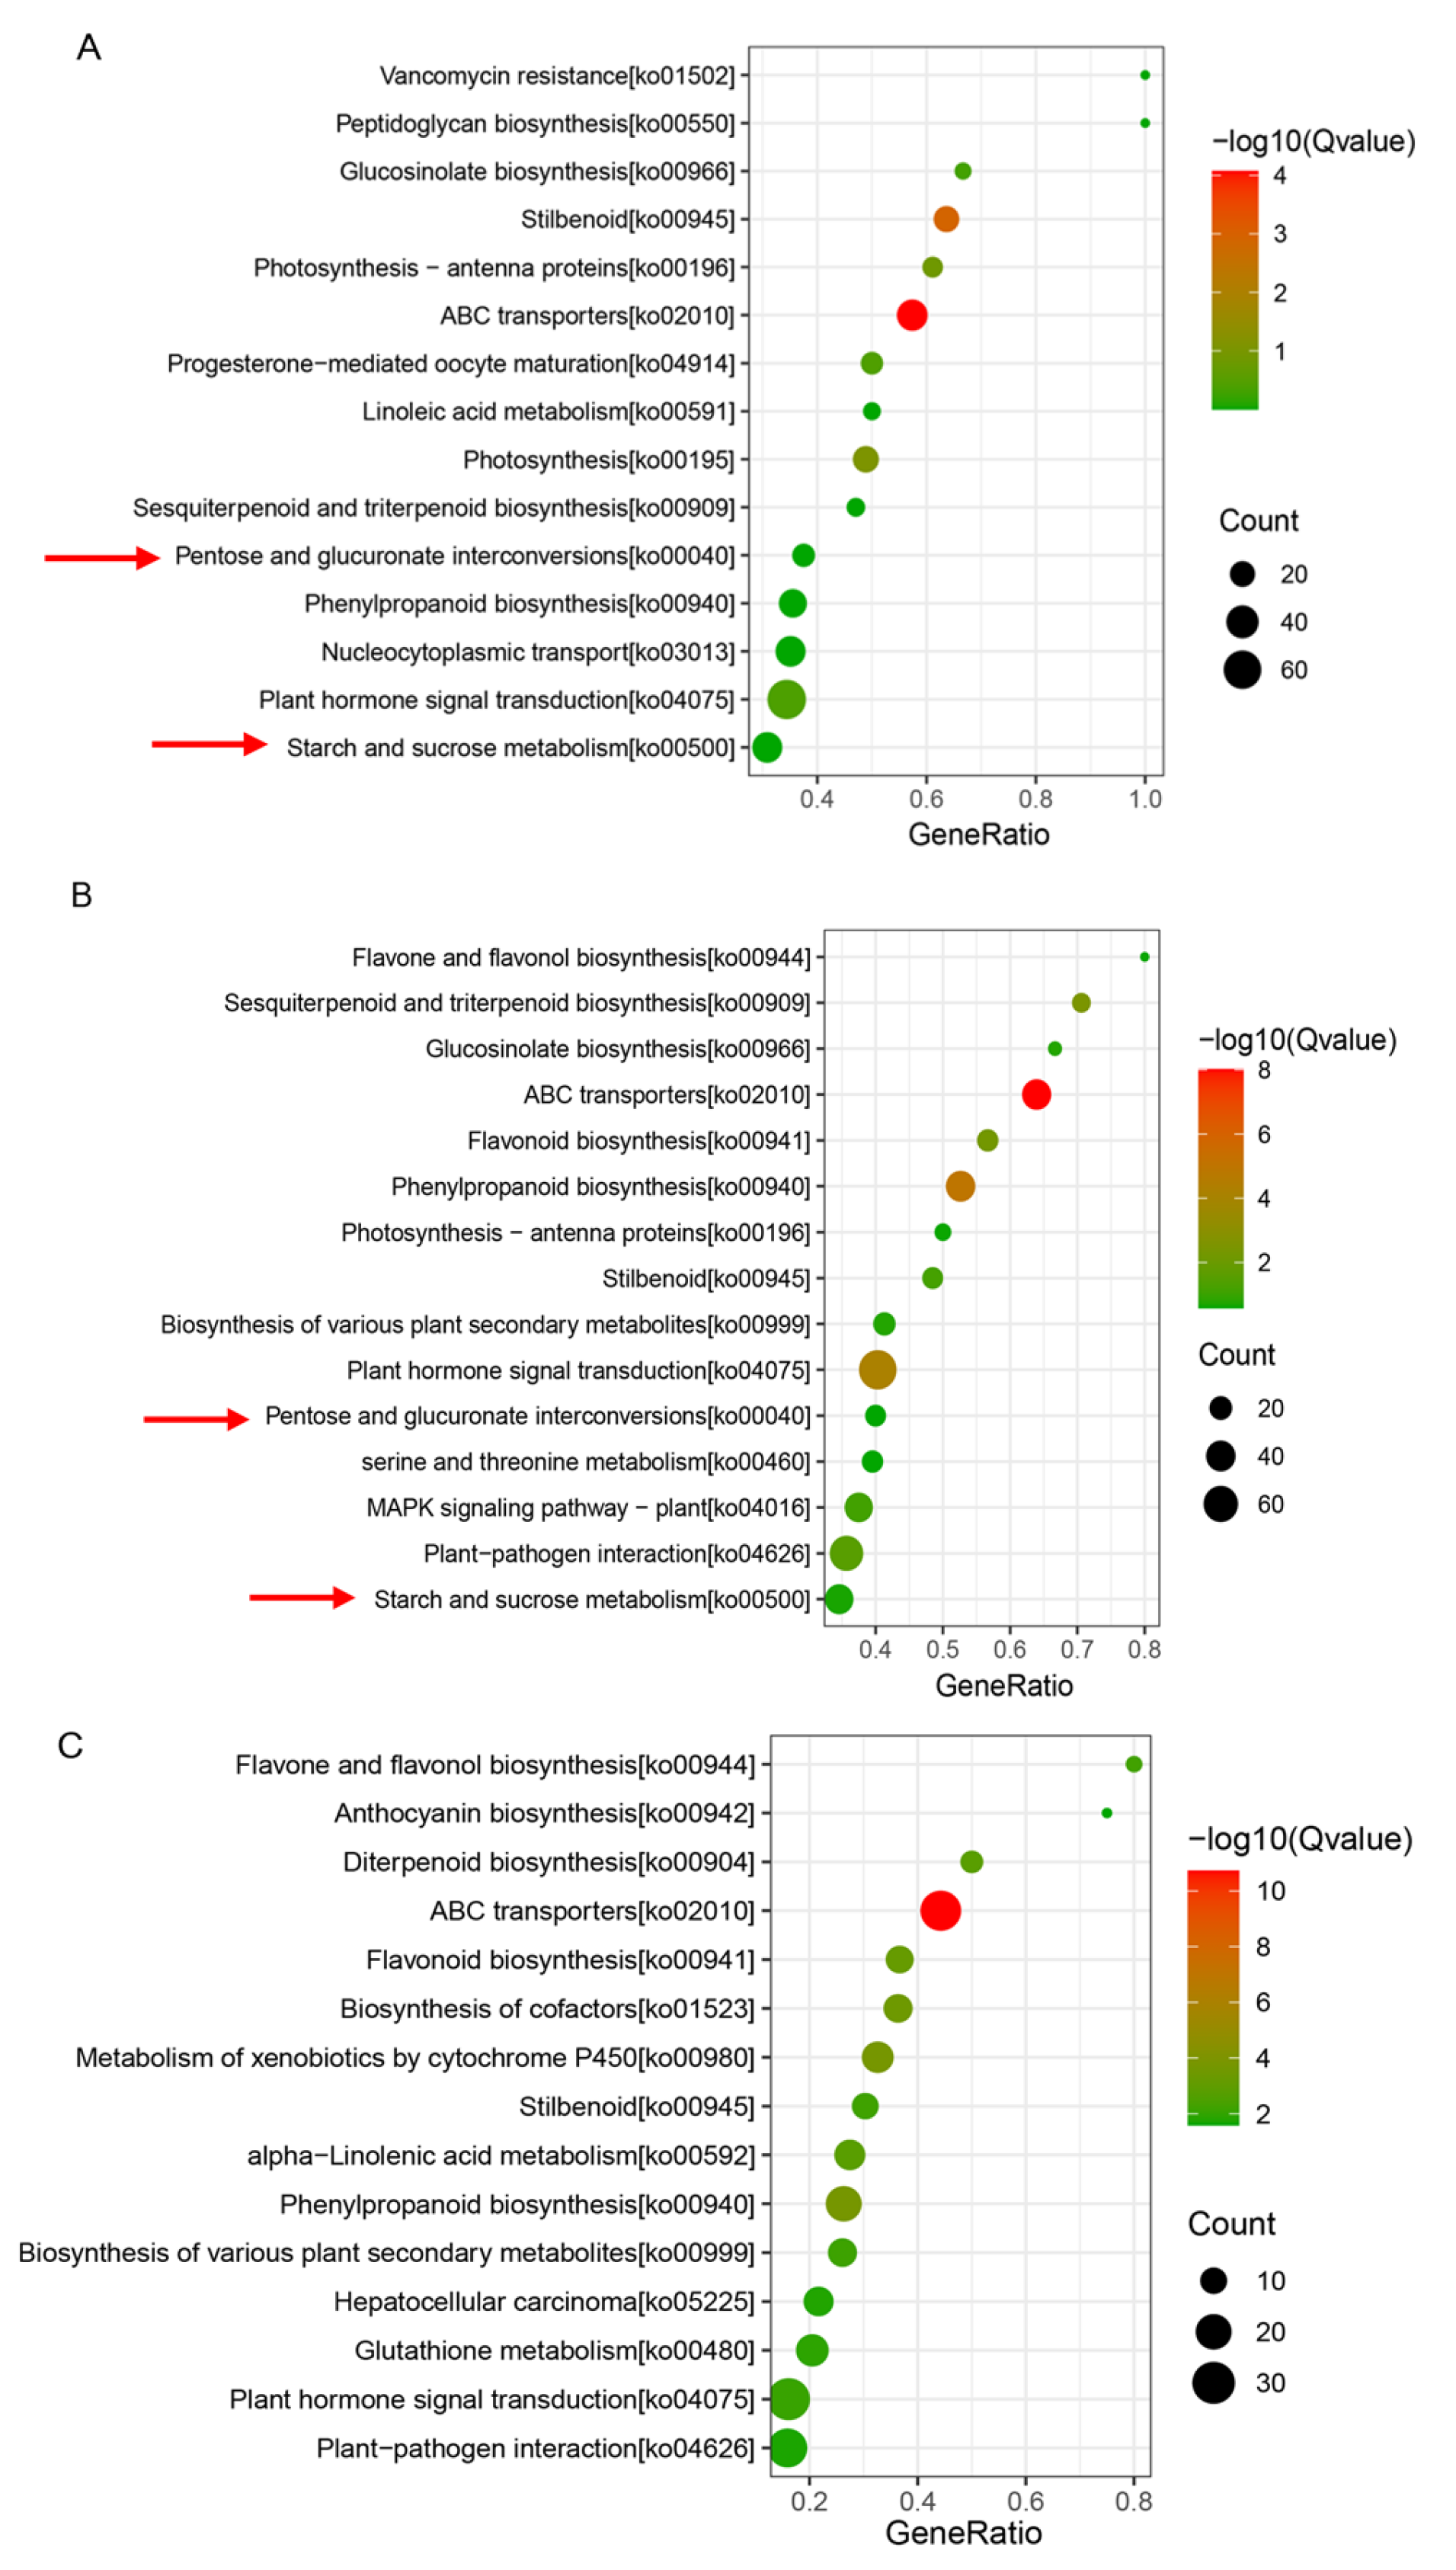
2.2.4. Metabolic Pathway Enrichment Analysis of DEGs

Functional annotation and pathway enrichment analysis of DEGs were performed using the KEGG Orthology (KO)-based annotation system. Statistically enriched pathways were identified through hypergeometric testing, with significance thresholds set at a false discovery rate (FDR) < 0.05 (Benjamini–Hochberg correction) and an absolute |log2(fold change)| > 1. KEGG metabolic pathway enrichment analysis was subsequently conducted using Bioconductor packages in R, followed by hierarchical clustering visualization of DEG expression patterns generated with TBtools software (v1.098).

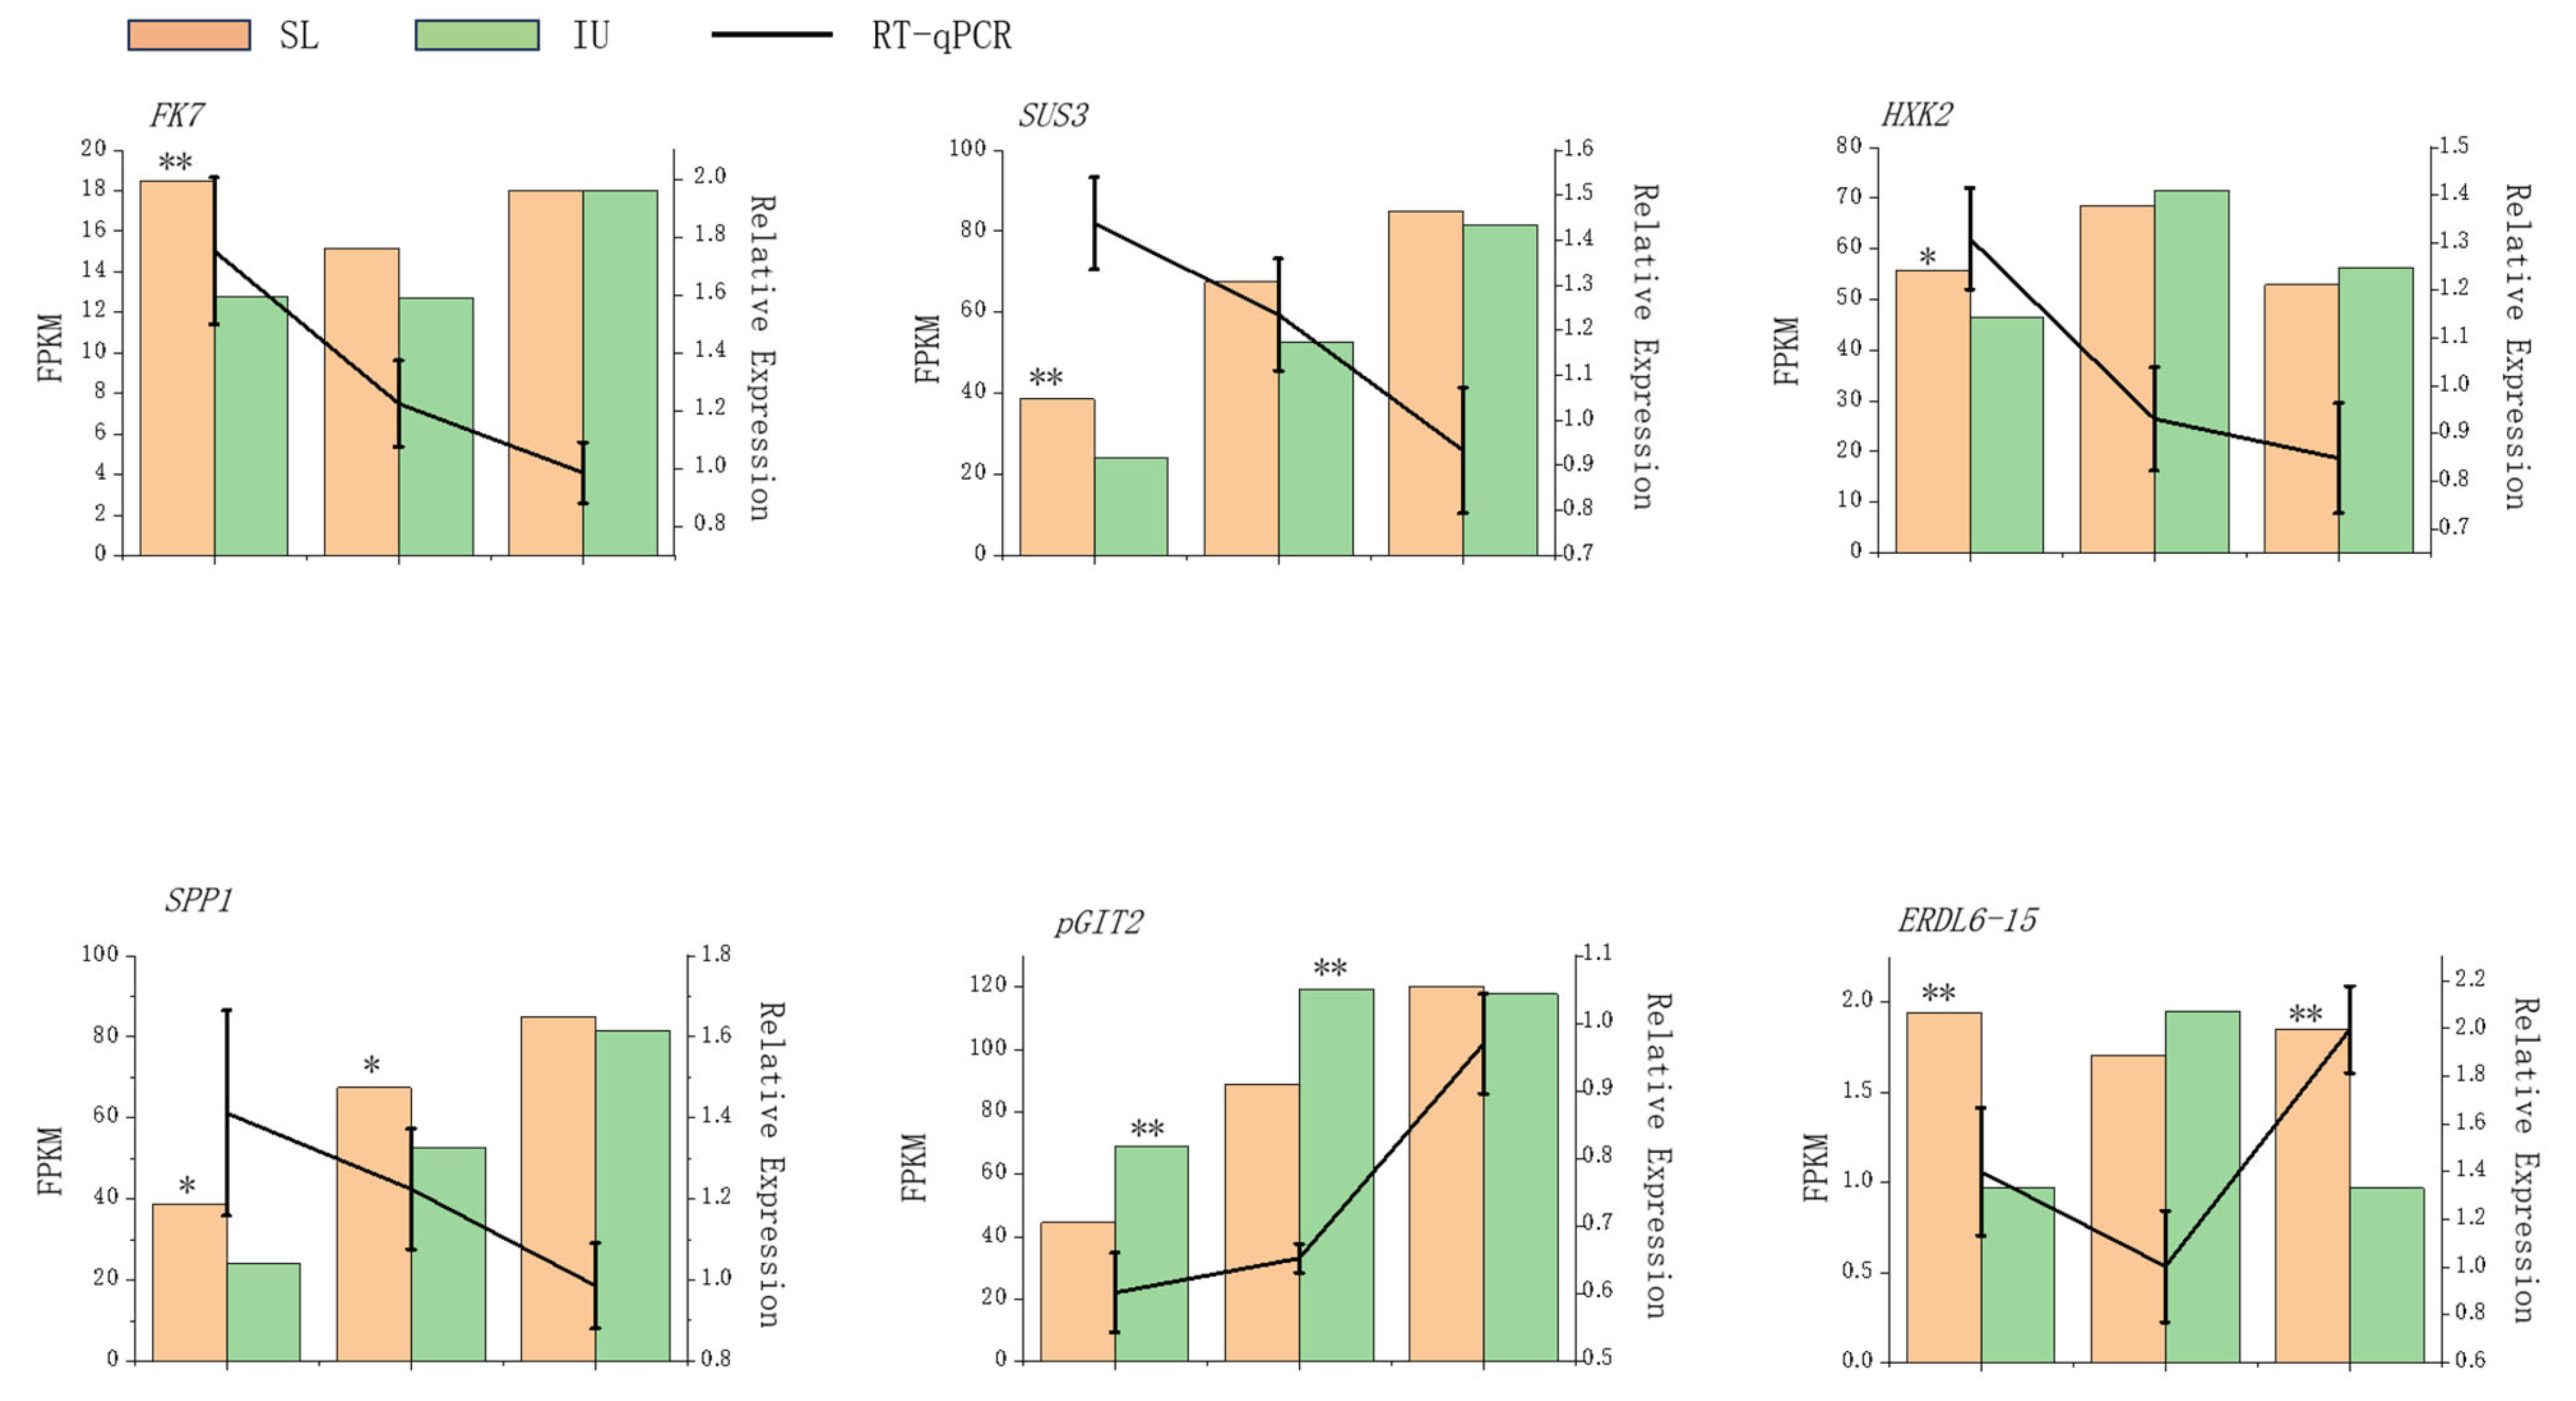
2.2.5. Quantitative Real-Time PCR (qRT-PCR)

Quantitative analysis was performed using a real-time PCR system with the following amplification protocol: a 10 μL reaction mixture containing 5 μL of 2× SYBR Green Premix, 3.2 μL of ddH2O, 0.4 μL of each primer (10 μM), and 1 μL of cDNA template. The thermal cycling conditions consisted of initial denaturation at 94 °C for 5 s, followed by 40 cycles of denaturation at 94 °C for 30 s, and annealing/extension at 60 °C for 40 s [18]. Grape ACTIN2/8 was used as the internal reference gene, and relative gene expression levels were calculated using the 2−ΔΔCT method. Each sample was analyzed in three biological replicates. Primer sequences are listed in Table 1.

2.3. Data Statistics and Analysis

Data processing and graphical visualization were conducted using SigmaPlot 12.0 and TBtools software. The statistical significance of intergroup differences was evaluated through one-way analysis of variance (ANOVA) followed by Duncan’s multiple range test (p < 0.05) using SPSS 22.0. Correlation analysis between sugar content and gene expression levels was performed via the CORREL function in Microsoft Excel 2013.

3. Results

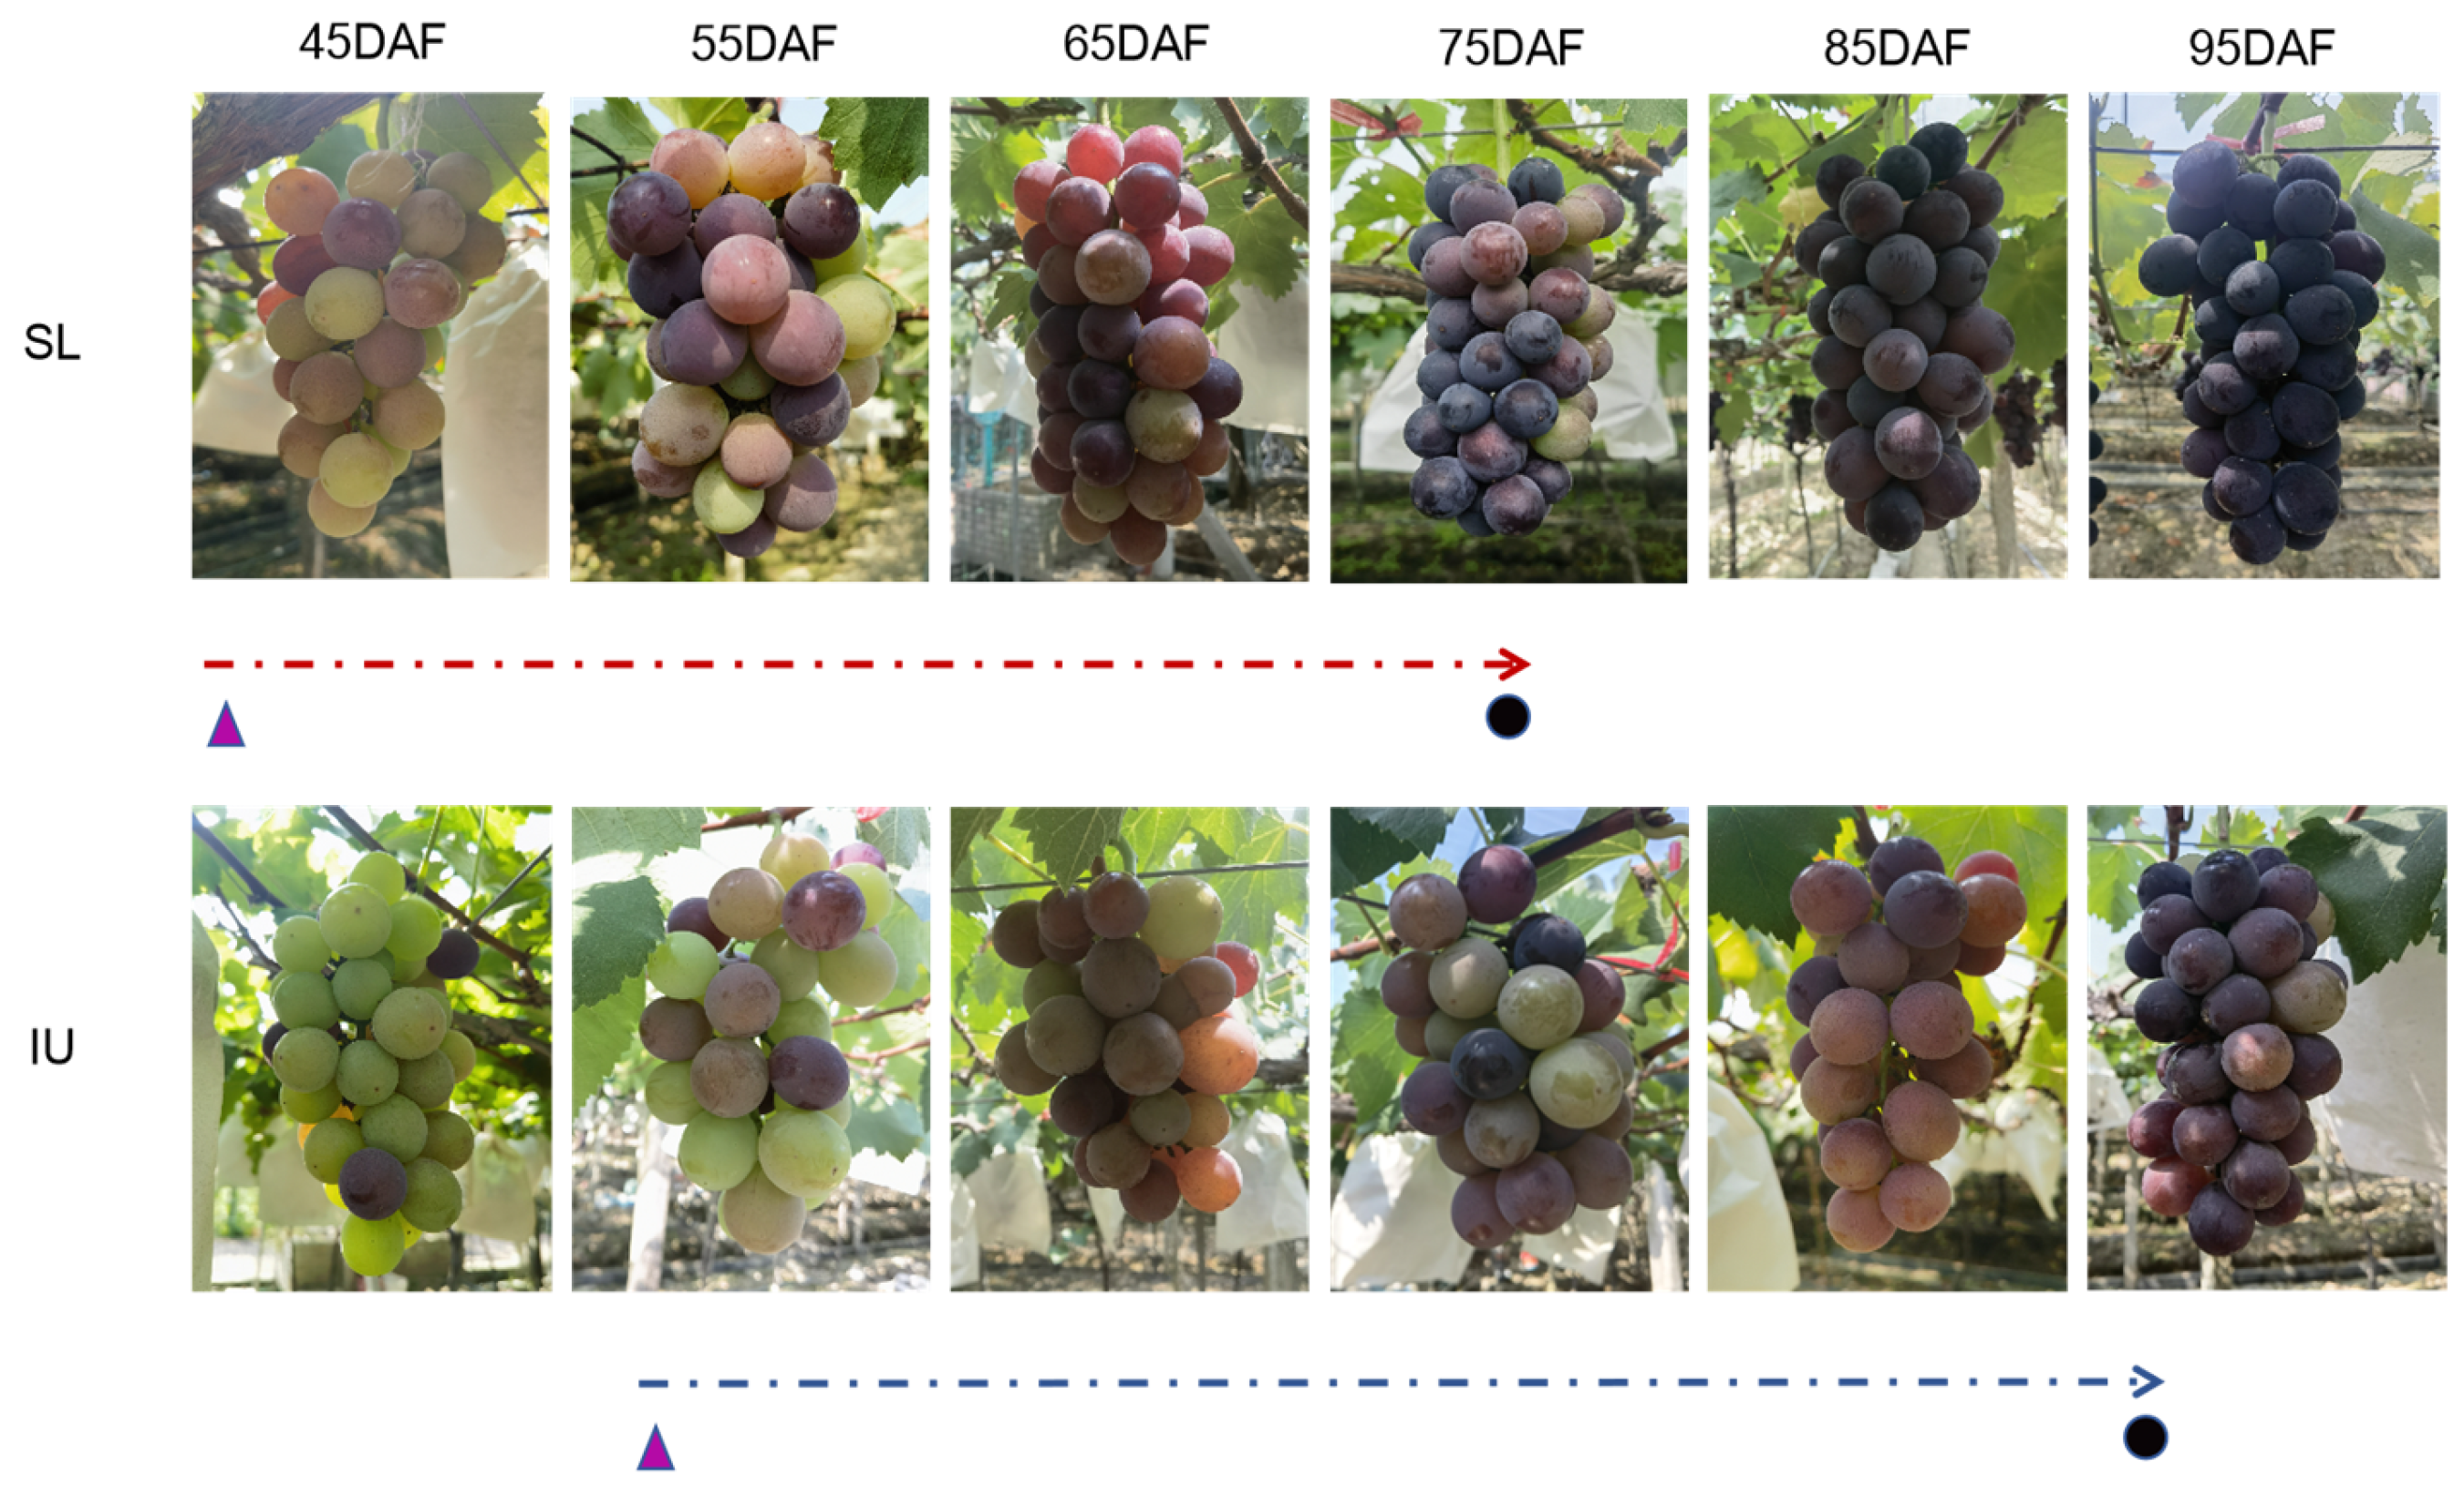
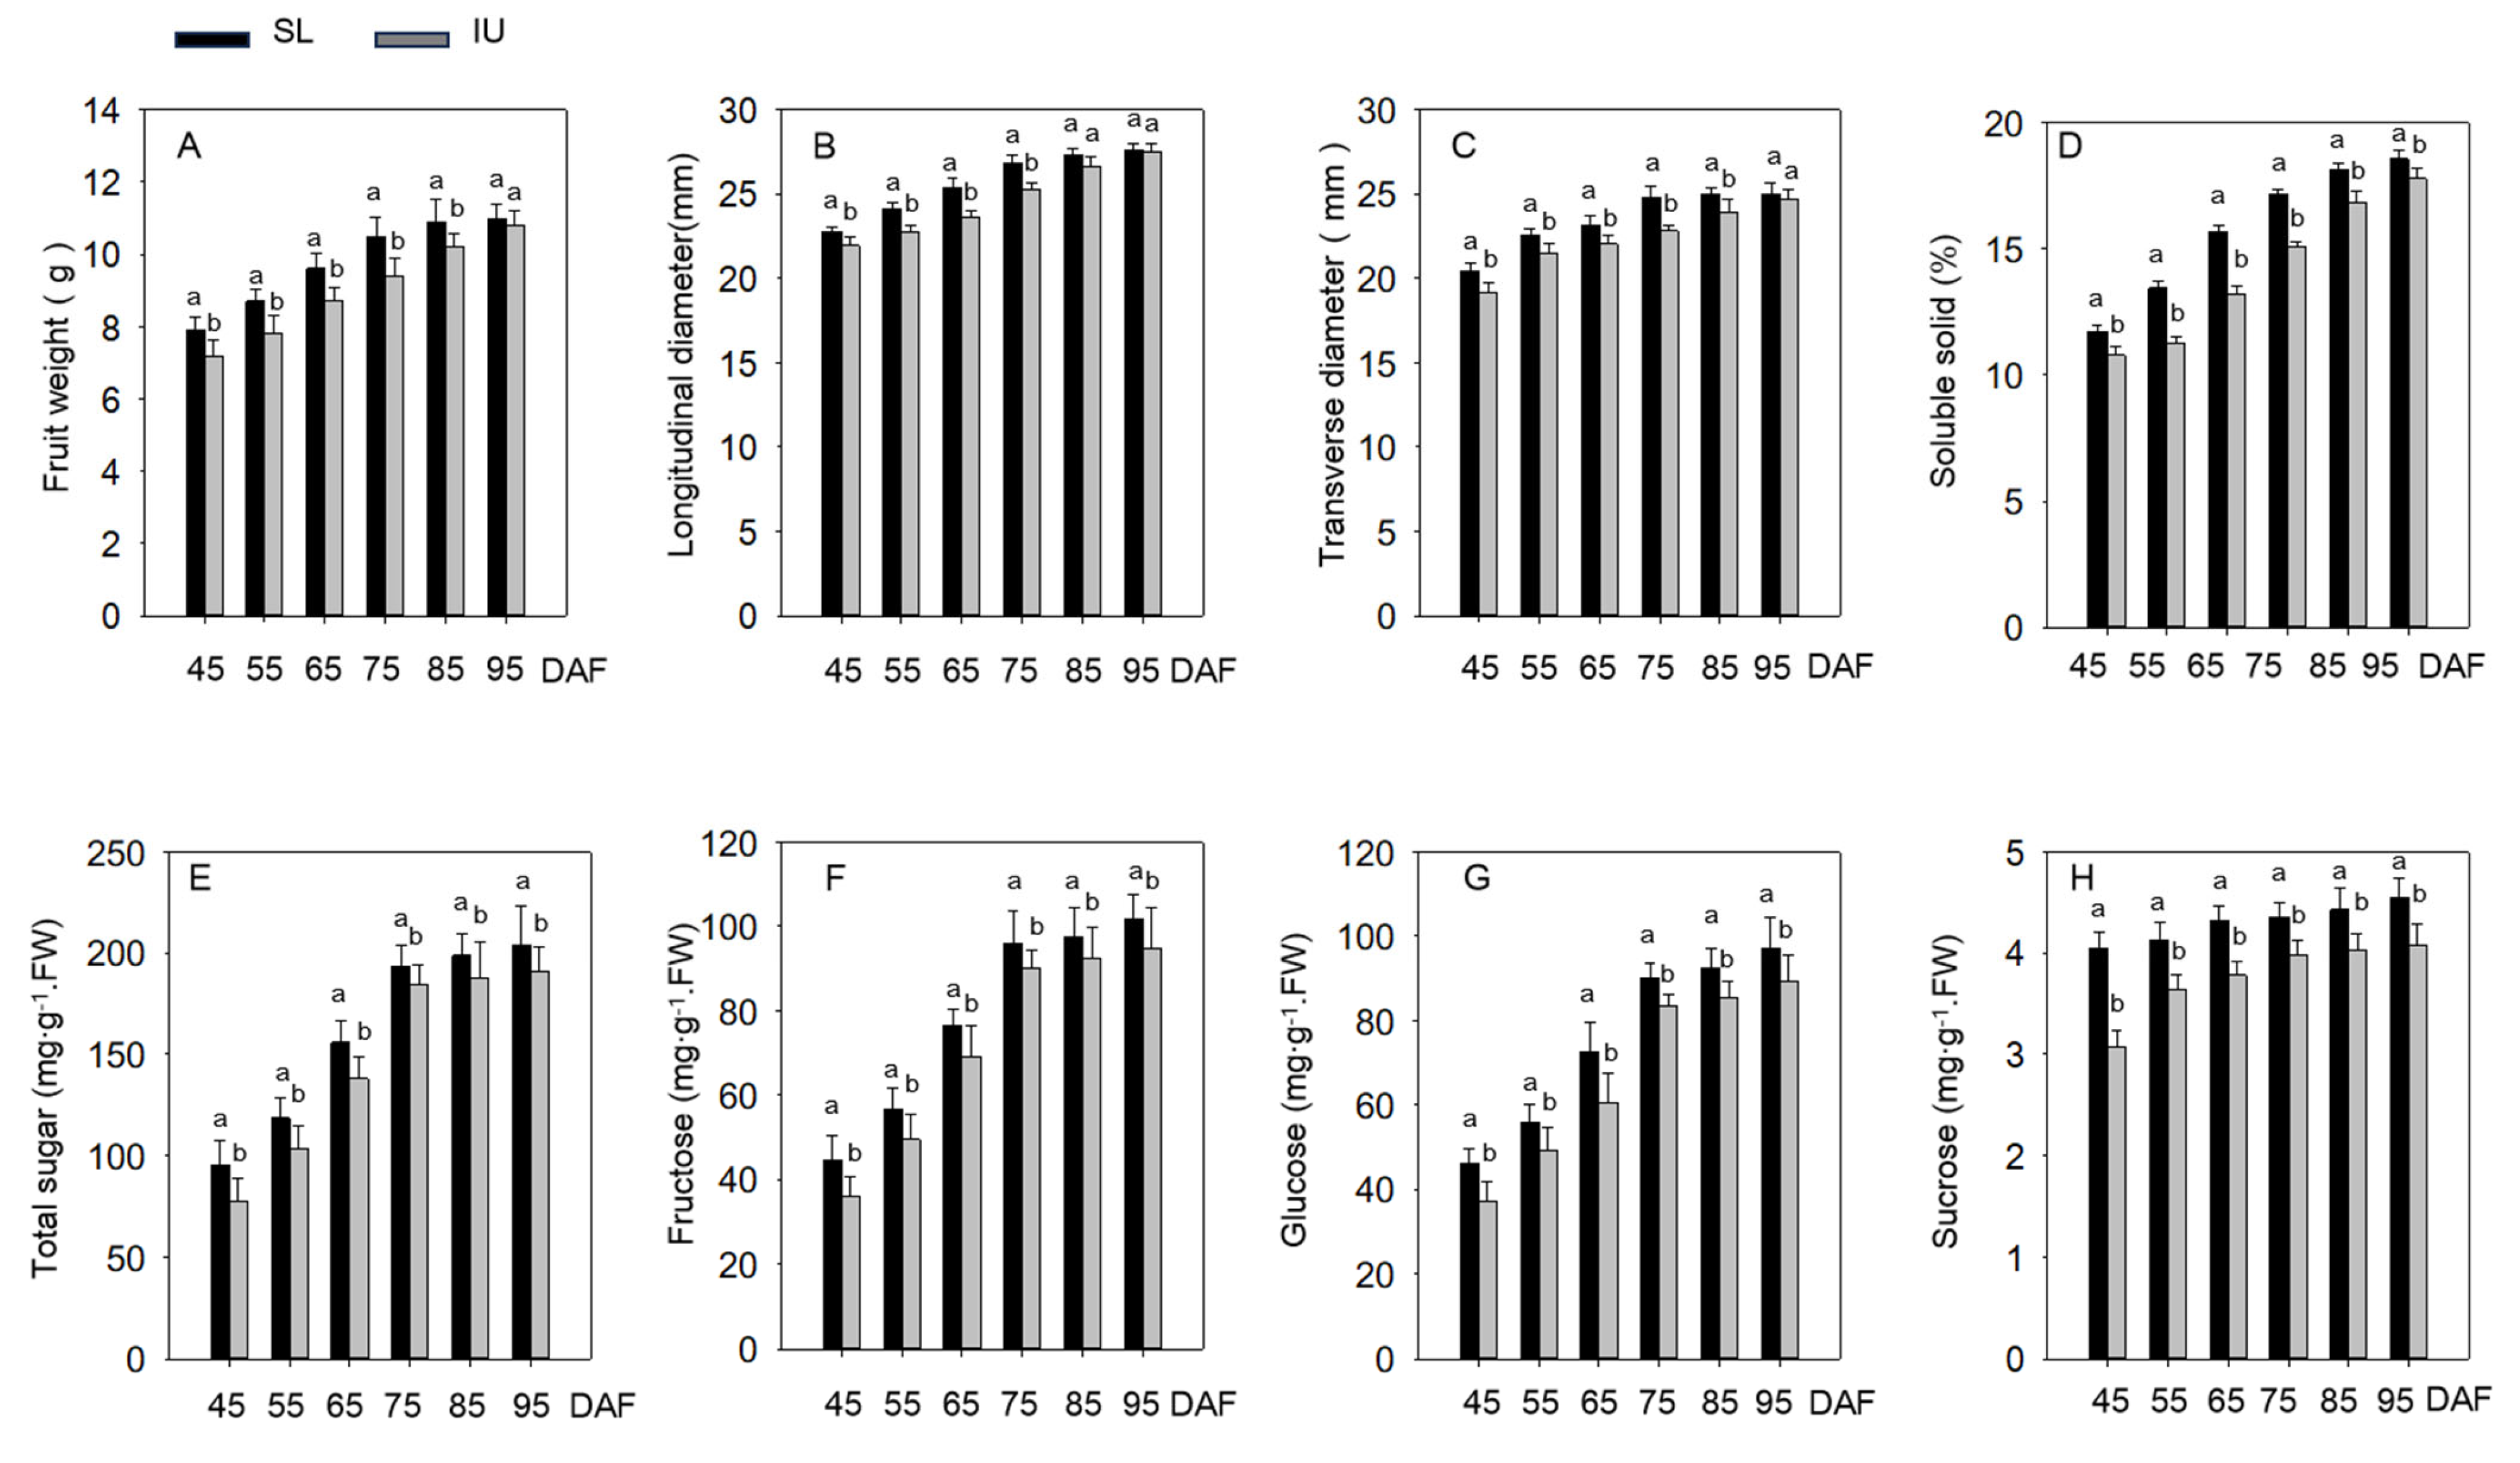
3.1. Effects of Training Systems on Grape Berry Development and Sugar Accumulation

Field observations indicated that berries from the SL training system attained full maturity significantly earlier than those from the IU system (Figure 2). Véraison initiation (i.e., first visible coloration) occurred at 45 DAF in SL-trained vines versus 55 DAF in IU-trained vines.
Figure 3A–D demonstrate that berry growth parameters (longitudinal diameter, transverse diameter, and single-berry weight) showed rapid increases between 45 and 75 DAF in both training systems. Notably, berry growth in SL-trained vines stabilized after 75 DAF (no significant increase, p > 0.05), while IU-trained berries maintained significant expansion (p < 0.05). Throughout the 45–95 DAF observation period, SL-trained berries consistently displayed lower values for both single-berry weight and soluble solid content (SSC) compared to IU-trained berries (p < 0.05). According to established maturity criteria for ‘Kyoho’ grapes (SSC ≥ 16%) [19], SL-trained berries reached commercial maturity by 75 DAF, whereas IU-trained berries required until 95 DAF. This 20-day advancement in maturity under the SL system represents a substantial phenological acceleration.
Figure 2. Berry coloration progression of ‘Kyoho’ grapes under different training systems. Developmental trajectories of berry maturation under SL (red lines) and IU (blue lines) training systems. Triangles (△) indicate véraison onset (5% berry coloration [20]), while circles (○) denote commercial maturity (SSC ≥ 16% for ‘Kyoho’ grapes [19]).
Horticulturae 11 00578 g002
This study measured the skin coloration of ‘Kyoho’ grapes under two training systems post-véraison (Table 2). Results showed decreasing L* values during maturation, indicating darker coloration. Increasing absolute a* and b* values demonstrated progressive accumulation of red and blue pigments. The SL system exhibited significantly higher C* values (chroma) across developmental stages, reflecting more intense coloration. Hue angles (h°) were in the range of 300–360°, confirming the characteristic purple–red to blue–black spectrum at full maturity. SL berries initiated pigmentation earlier than IU, though both systems achieved comparable final coloration, consistent with field observations. These findings demonstrate that the SL system promotes faster and more uniform skin coloration in ‘Kyoho’ grapes.
To further analyze the maturation dynamics of the two training systems, total soluble sugar content in berries was quantified. Results demonstrated a continuous increase in total soluble sugars during berry ripening, with 65–75 DAF identified as the plateau phase for sugar accumulation (Figure 3E–H). Fructose and glucose constituted the predominant sugar components in ‘Kyoho’ berries. For instance, under the SL system, at full maturity (95 DAF), fructose and glucose contents reached 101.89 mg/g and 97.18 mg/g, accounting for 49.96% and 47.65% of total sugars (203.96 mg/g), respectively, while sucrose content remained minimal at 4.55 mg/g (2.24% of total sugars).

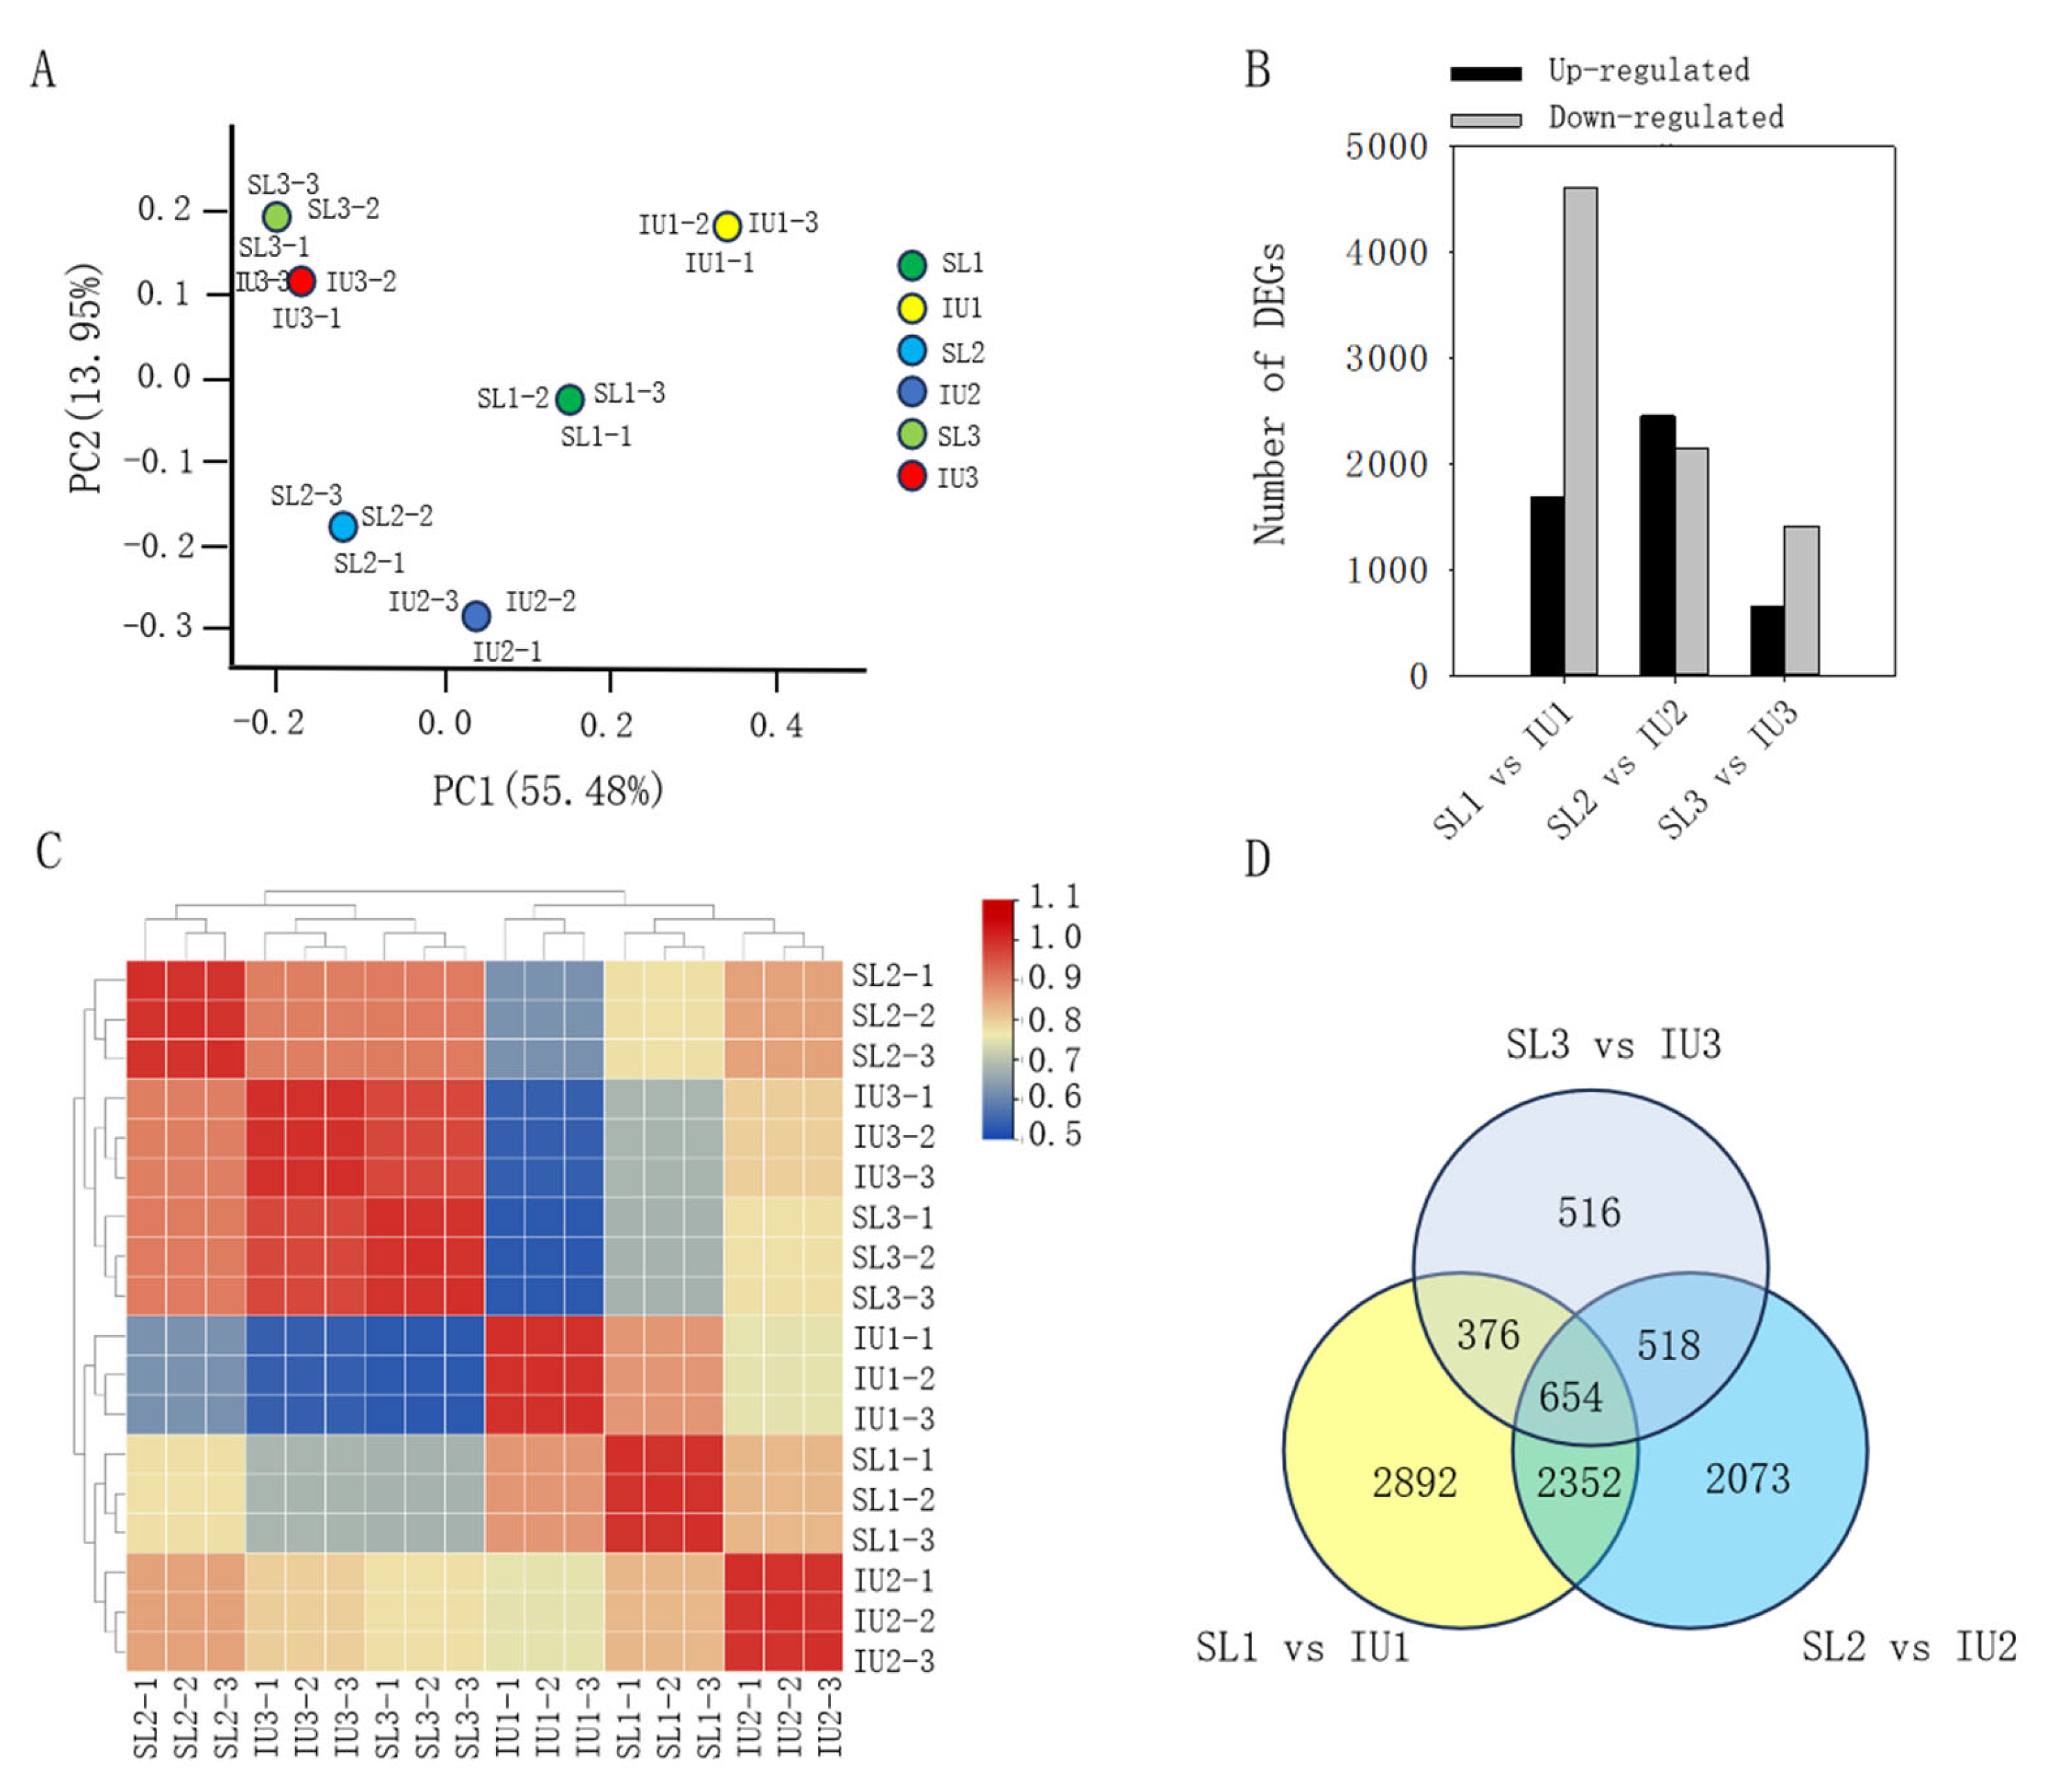
3.2. Transcriptome Profiling and Identification of DEGs

Transcriptome sequencing was conducted on grape berries collected at 45, 65, and 95 DAF from both SL and IU training systems, generating 18 cDNA libraries. Principal component analysis (PCA; Figure 4A) and correlation analysis (Figure 4C) confirmed high reproducibility among biological replicates. The comparative transcriptomic analysis revealed a total of 6274, 5597, and 2064 DEGs identified between SL and IU systems at 45, 65, and 95 DAF, respectively. Of these, 1675, 2450, and 654 DEGs were upregulated, whereas 4599, 3147, and 1410 were downregulated in SL relative to IU (Figure 4B,D). These results demonstrate a significantly greater abundance of DEGs during early ripening stages compared to later stages.
KEGG enrichment analysis of DEGs between the two training systems at different developmental stages revealed that, during the early ripening phase (45–65 DAF), DEGs from both the straight-line (SL) and inverted-umbrella (IU) systems were significantly enriched in sugar metabolism-related pathways (p < 0.05), including pentose and glucuronate interconversions and starch and sucrose metabolism(Figure 5). However, at 95 DAF, no significant enrichment in sugar metabolism pathways was observed between the two training systems. These results indicate that both systems facilitate substantial sugar synthesis, accumulation, and transport during the early ripening phase.
Notably, multiple genes played pivotal roles in sugar metabolism under different training systems. For instance, at 45 DAF, 1675 genes were upregulated in the SL system, including key enzymes such as fructokinase (FK), phosphofructokinase (PFK), sucrose phosphate synthase (SPS), and cell wall invertase (CWINV), all of which are integral to sugar metabolic pathways.

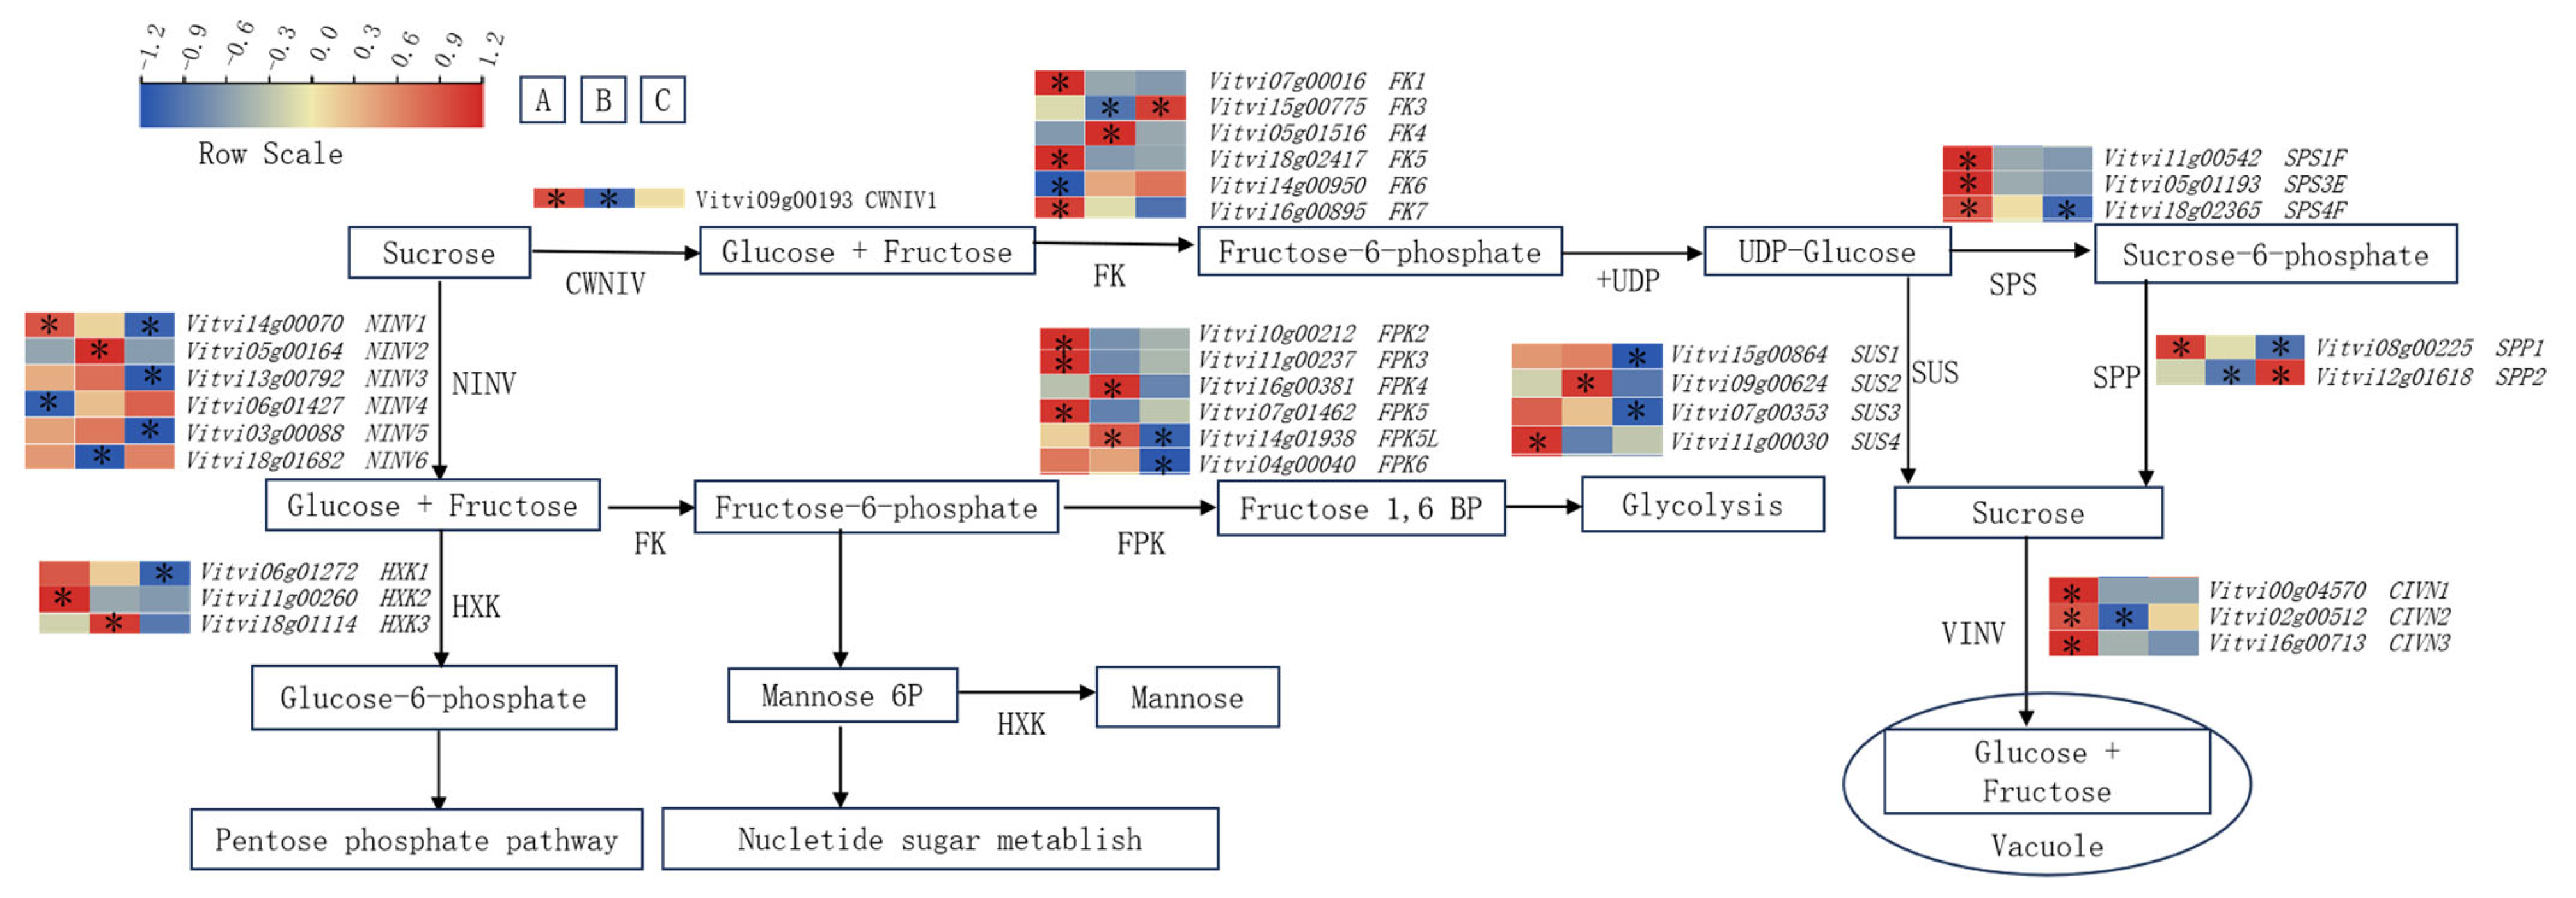
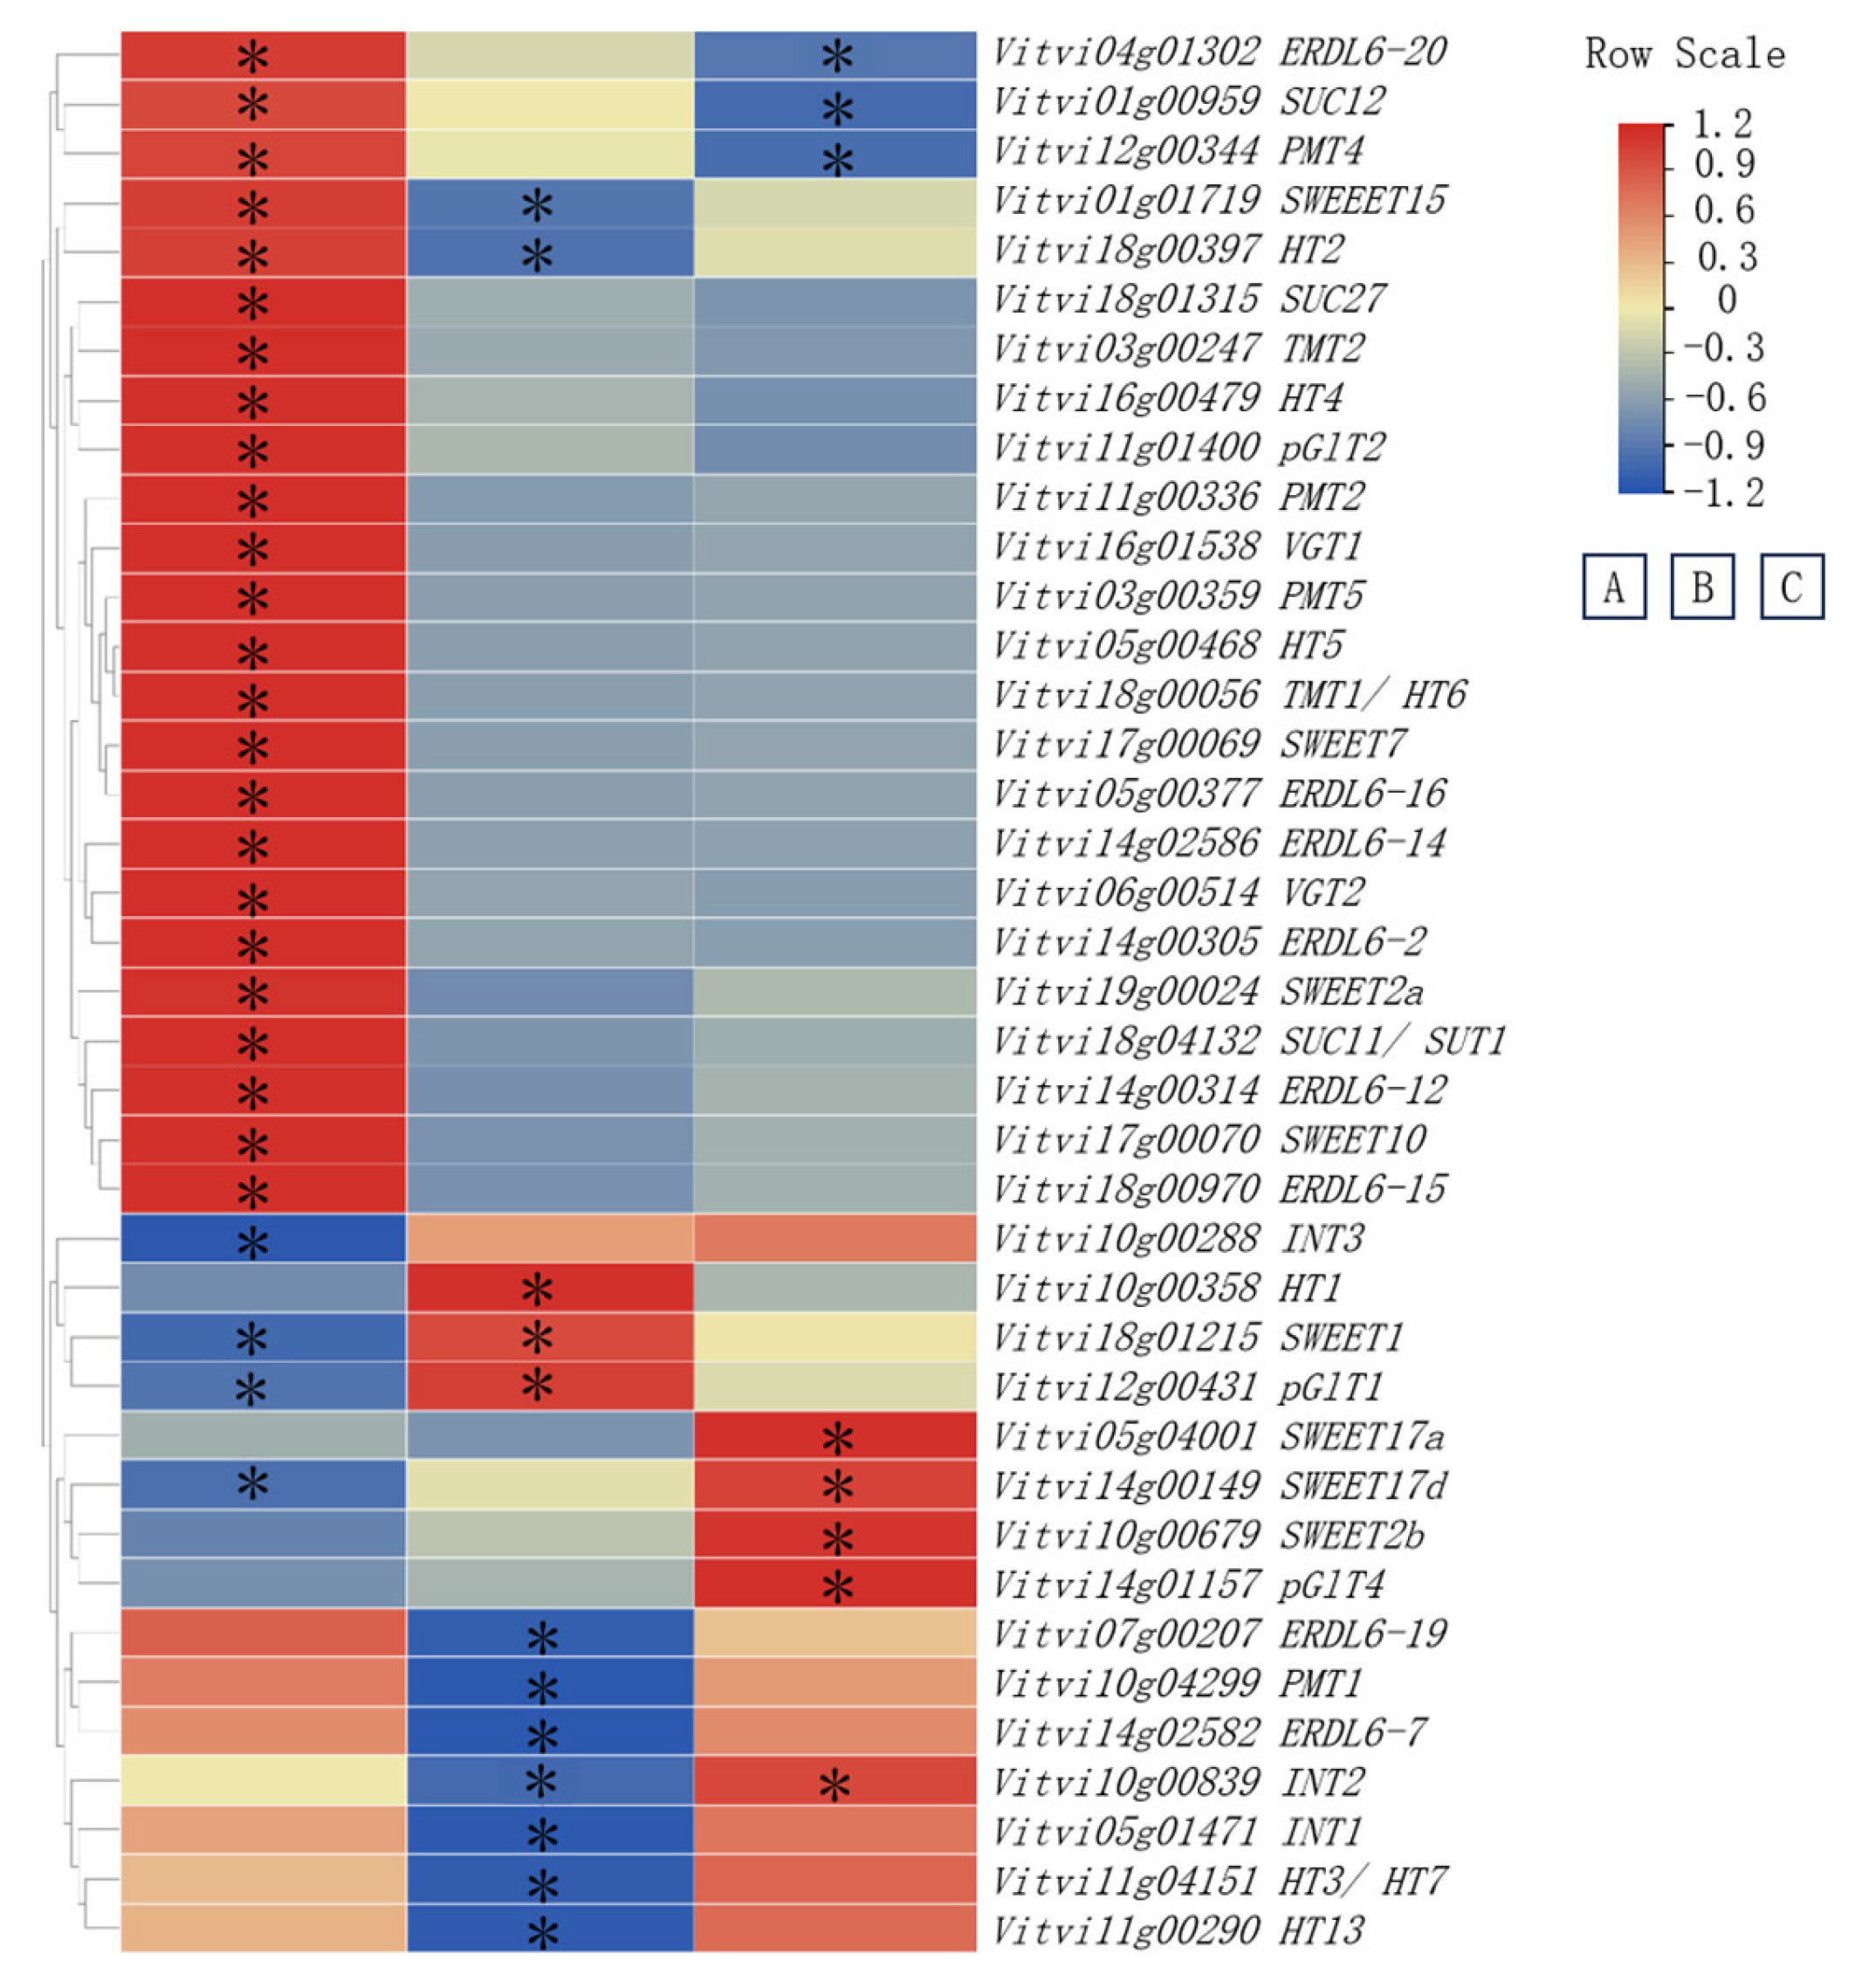
3.3. Impact of Training Systems on Sugar Metabolism and Transport-Related Genes in Grape Berries

Sugar metabolism is regulated by the expression of enzyme-encoding genes, and differential expression of these metabolic genes during berry development under different training systems leads to variations in sugar accumulation across developmental stages (Figure 6). Results demonstrated that, during the early véraison phase (45–65 DAF), the expression levels of key genes involved in sugar accumulation and metabolism, such as fructokinase (FK), phosphofructokinase (PFK), and sucrose phosphate synthase (SPS), were significantly higher in the straight-line (SL) system compared to the inverted-umbrella (IU) system (p < 0.05). However, by 95 DAF, the differences in expression levels of sugar metabolism-related genes between the two training systems diminished. For instance, the expression of sucrose synthase genes (VvSUS1/2/3/4) was markedly higher in the SL system than in the IU system during 45–65 DAF, whereas no significant differences were observed at 95 DAF (p > 0.05).
Sugar transporters play a critical role in the intracellular transport of monosaccharides, disaccharides, and polysaccharides, as well as in the allocation and accumulation of sugars. During the early véraison phase, the expression levels of most sugar transporter genes, including sucrose transporters (SUT/SUC), SWEET (Sugar Will Eventually Be Exported Transporter) family genes, and polyol/monosaccharide transporters (PMTs), were significantly higher in the straight-line (SL) system compared to the inverted-umbrella (IU) system (p < 0.05) (Figure 7). For instance, at 45DAF, the expression levels of HT2 and SWEET2a in the SL system were approximately fivefold higher than those in the IU system. However, during the late véraison phase, no significant differences in expression levels were observed between the two training systems (p > 0.05). For example, while RDL6-7, RDL12, RDL14, and RDL15 exhibited marked expression differences at 45 DAF, their expression levels showed no significant variation between the SL and IU systems at 65 DAF and 95 DAF (p > 0.05).
To further validate the reliability of the transcriptome sequencing results, RT-qPCR analysis was performed. The results (Figure 8) demonstrated that, across different ripening stages, the expression levels of FK7, SUS3, and SPP1 were significantly higher in the straight-line (SL) system compared to the inverted-umbrella (IU) system. During the early véraison phase, the expression of sugar transporter-related genes, such as HXK2 and ERDL6-15, was also elevated in the SL system relative to the IU system. These findings suggest that sugar transport in the SL system is more efficient during the early post-flowering stages compared to that in the IU system. This phenomenon may be attributed to the superior light interception and canopy ventilation in the SL system, which promote sugar accumulation and metabolism during berry development, thereby accelerating ripening.

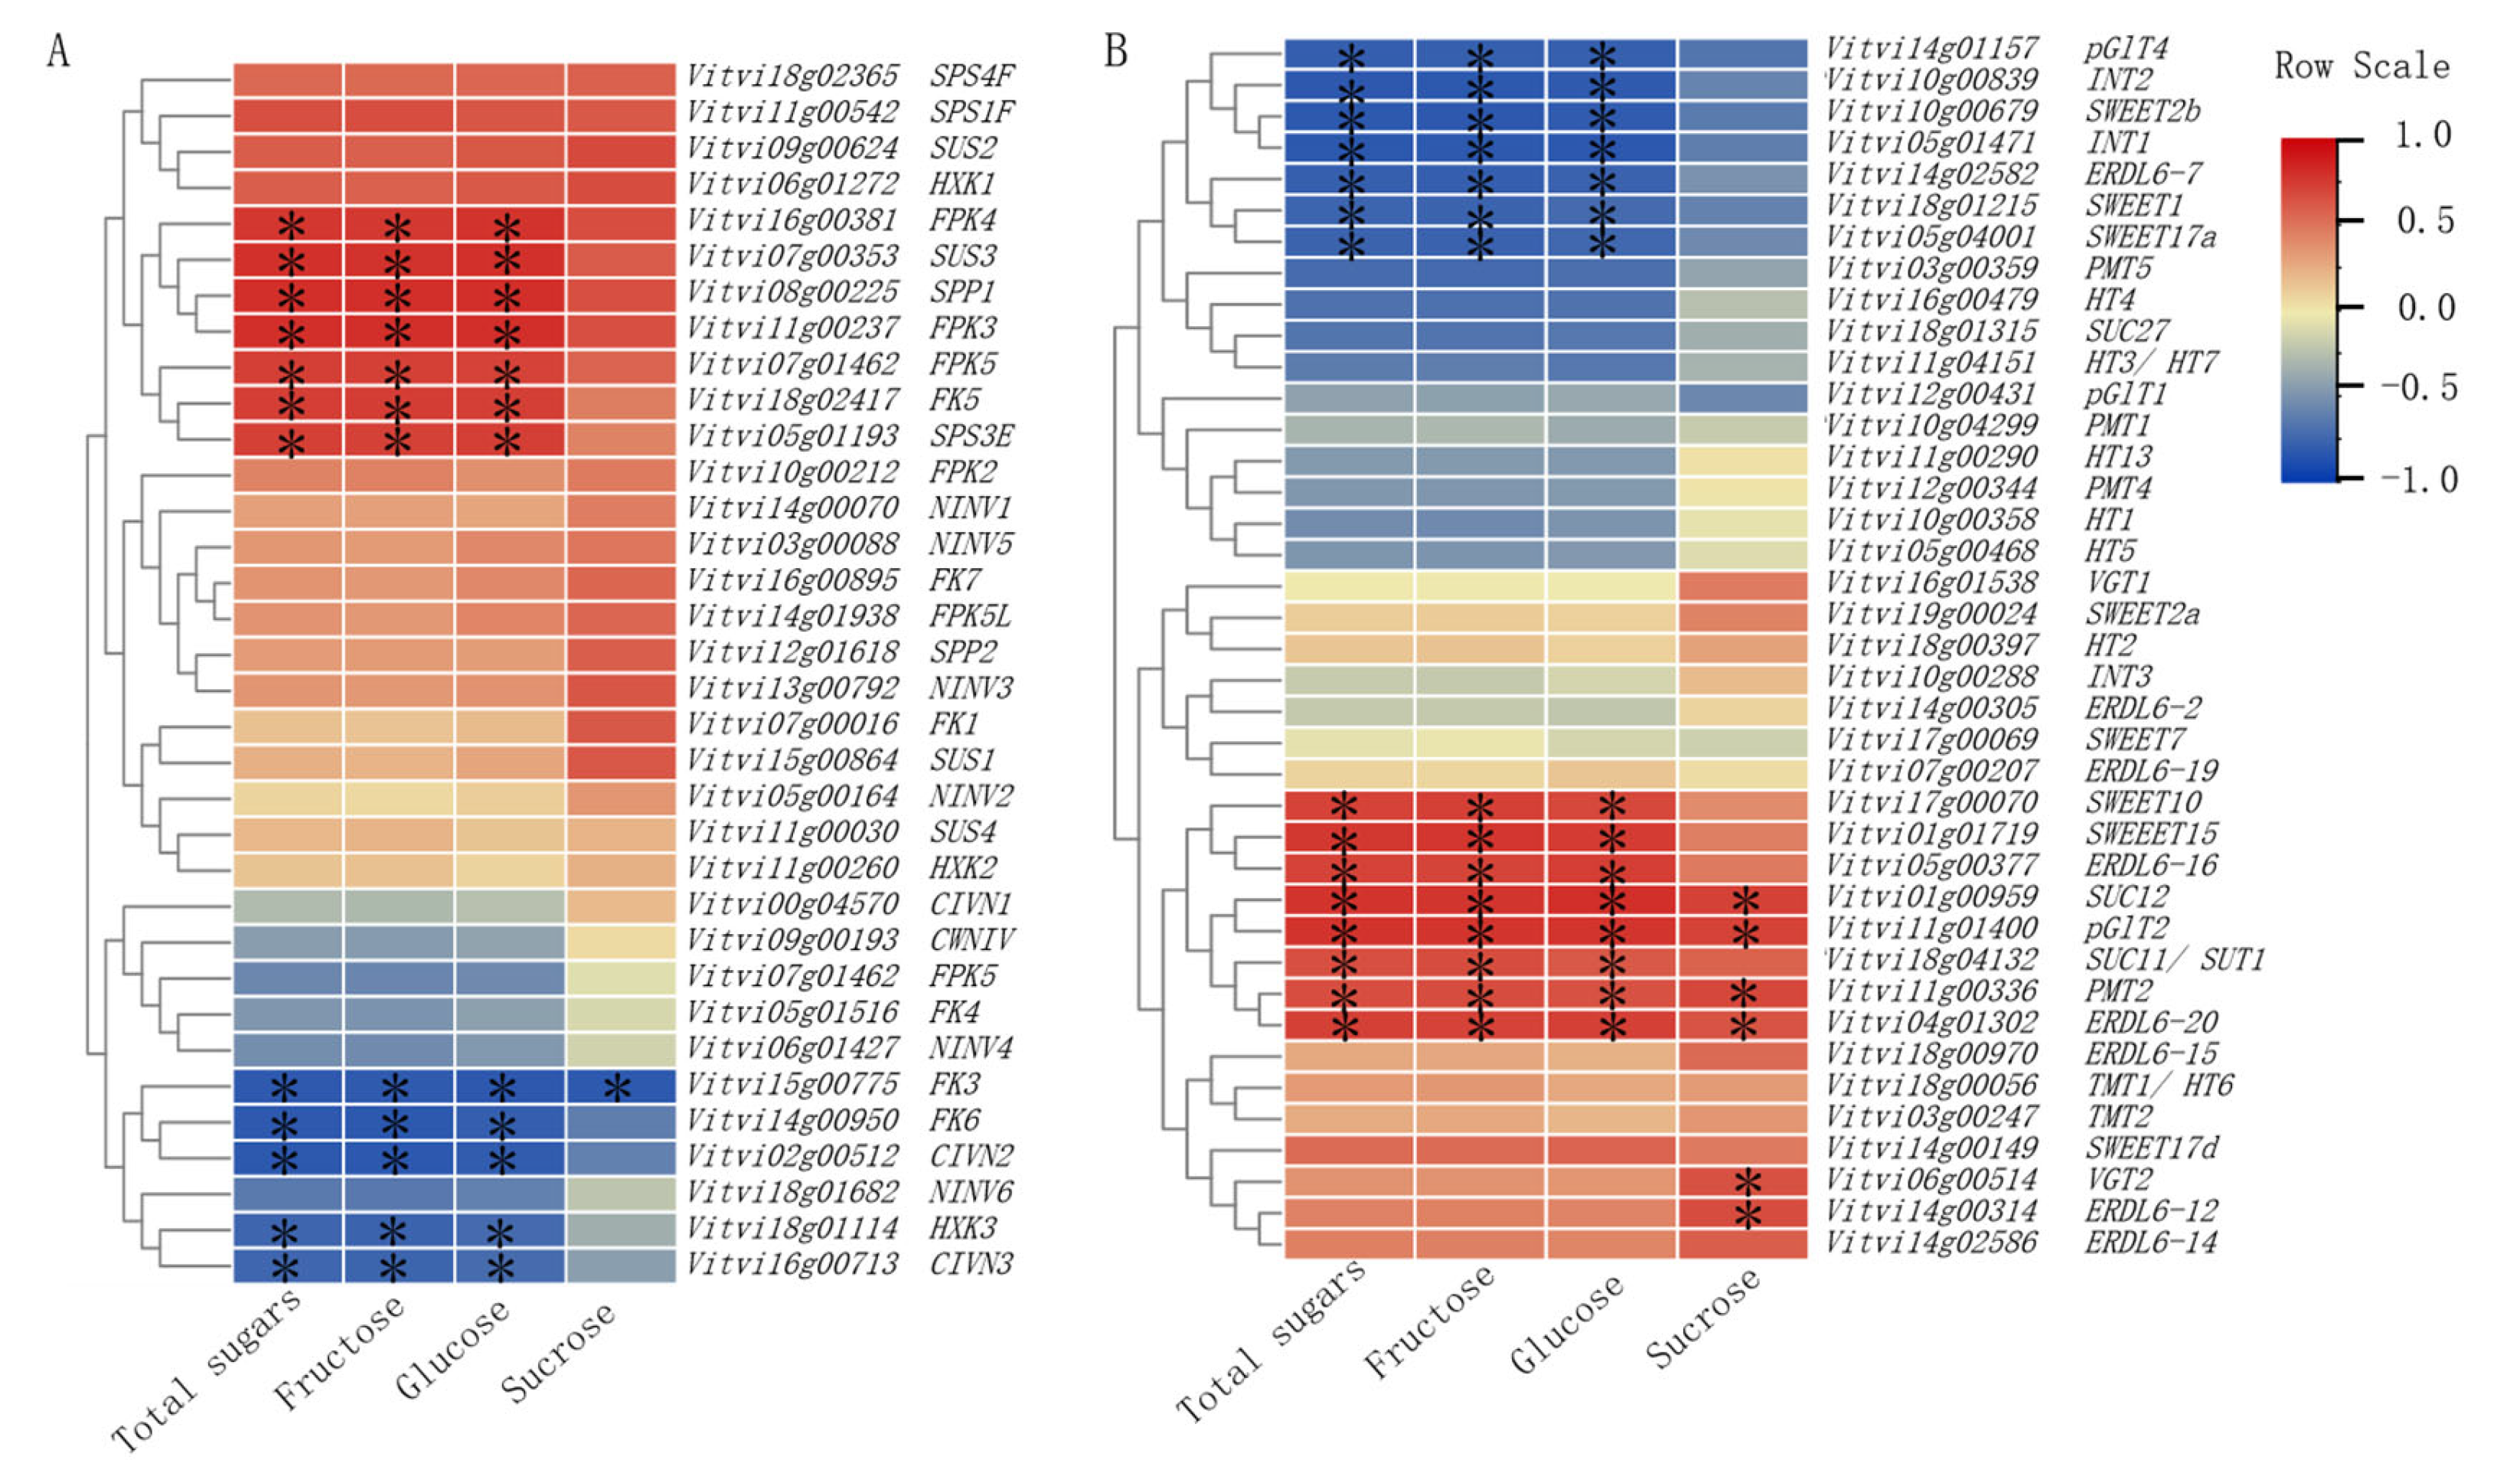
3.4. Correlation Analysis Between Sugar Components and Genes Involved in Sugar Metabolism and Transport

Correlation analysis was performed to identify sugar metabolism and transporter genes associated with sugar components, and the results are presented in Figure 9. Among the DEGs related to sugar metabolism, the expression levels of FPK4, SUS3, SPP1, FPK3, FPK5, FK5, and SPS3E showed significant positive correlations with total soluble sugar, fructose, and glucose contents (p < 0.05). In contrast, the expression levels of FK3, FK6, CIVN2, HXK3, and VCIVN3 exhibited significant negative correlations with total soluble sugar, fructose, and glucose contents (p < 0.05), with FK3 also showing a significant negative correlation with sucrose content (p < 0.05). Among the DEGs encoding sugar transporters, the expression levels of SWEET10, SWEET15, ERDL6-16, SUC12, pGlT2, SUC11/SUT1, PMT2, and ERDL6-20 were significantly positively correlated with total sugar, fructose, and glucose contents (p < 0.05). Additionally, SUC12, pGlT2, PMT2, VGT2, ERDL6-12, and ERDL6-20 showed significant positive correlations with sucrose content (p < 0.05). Conversely, the expression levels of pGlT4, INT2, SWEET2b, INT1, ERDL6-7, SWEET1, and SWEET17a were significantly negatively correlated with total sugar, fructose, and glucose contents (p < 0.05). In summary, the expression patterns of sugar metabolism and transporter genes were significantly correlated with sugar component contents, indicating that these genes play crucial roles in regulating sugar accumulation and allocation in grape berries.

4. Discussion

4.1. Relationship Between Sugar Accumulation and Berry Ripening

Sugars in grape berries (including glucose, fructose, and sucrose) are key determinants of fruit flavor and quality [21]. Sugar accumulation is closely associated with the ripening process, as sugar metabolism not only provides energy for fruit development but also participates in regulating ripening progression [22]. The present study demonstrated that ‘Kyoho’ grapes trained on the SL system exhibited significantly faster accumulation of sugars (fructose, glucose, and sucrose) during early véraison (45–65 DAF) compared to those under the IU system. During early berry development (cell expansion phase), sugar accumulation was relatively slow, primarily due to the high sugar demand for cell division and growth. In contrast, sugar accumulation accelerated during later developmental stages, particularly after véraison, leading to a substantial increase in sugar content [23,24]. Our findings indicate that the SL training system promotes rapid sugar accumulation in ‘Kyoho’ grapes between 45 and 65 DAF, suggesting that this system enhances sugar deposition during early véraison and subsequently accelerates the ripening process.

4.2. Impact of Training Systems on the Expression of Sugar Metabolism-Related Genes

The training system modulates sugar metabolism and ripening processes in grape berries by regulating canopy micro-environmental conditions and improving light penetration and air circulation [4,25,26]. Previous studies in this research program demonstrated that the straight-line training system, characterized by a well-organized canopy architecture and reduced leaf layer complexity, improved ventilation and light penetration. These structural advantages enhanced chlorophyll biosynthesis in ‘Kyoho’ grape leaves, elevating photosynthetic performance. Specifically, the actual photochemical efficiency Y(II) increased by 10.9%, indicating stronger photosynthetic activity and more active photoprotective mechanisms compared to the inverted-umbrella system. This superior photosynthetic capacity subsequently promoted sugar accumulation in berries [4].
In this study, ‘Kyoho’ grapevines trained on the SL system exhibited significantly higher expression levels of sugar metabolism-related genes—including fructokinase (FK), phosphofructokinase (PFK), and sucrose phosphate synthase (SPS)—during early véraison (45–65 DAF) compared to those under the IU system. This observation aligns with the accelerated accumulation of soluble sugars. Transcriptomic analysis revealed that DEGs in SL-trained berries were predominantly enriched in sugar metabolism and transport pathways, such as the interconversion of pentoses and glucuronates, further confirming the regulatory role of training systems on sugar-related gene expression [27]. Moreover, sugar transporter genes (e.g., sucrose transporters VvSUC11, VvSUC12, SWEET10, and SWEET15) showed significantly higher expression levels under the SL system, indicating that this training architecture enhances sugar translocation and allocation, thereby promoting berry sugar accumulation [28,29].
The selection of training systems holds significant practical implications for grape production [30]. Our study demonstrates that the SL training system significantly enhances sugar accumulation in ‘Kyoho’ grape berries and promotes earlier véraison and ripening, which aligns with previous research findings. The SL system improves the canopy microenvironment by increasing light intensity and air circulation, thereby enhancing photosynthetic efficiency and promoting sugar synthesis and accumulation [10,11].
Furthermore, the adoption of optimized training systems can effectively reduce disease and pest incidence [31] while improving fruit quality [12], providing crucial support for the sustainable development of grape production. Therefore, in viticultural production, selecting an appropriate training system (such as SL) can not only promote earlier fruit maturation and improve berry quality but also significantly enhance economic returns, demonstrating considerable potential for widespread adoption.

5. Conclusions

Training systems significantly influence sugar accumulation and ripening processes in grape berries. Under the SL system, ‘Kyoho’ grape berries exhibited significantly higher soluble sugar content compared to the IU system during fruit development, particularly from 45 to 65 DAF, with the SL system showing faster sugar accumulation rates. Total sugar content reached critical accumulation phases at 65 DAF and 75 DAF. Transcriptome analysis identified 6274, 5597, and 2064 DEGs in the SL system at 45 DAF, 65 DAF, and 95 DAF, respectively. Among these, key sugar metabolism-related genes, such as fructokinase (FK), phosphofructokinase (PFK), and sucrose phosphate synthase (SPS), were significantly upregulated in the SL system compared to the IU system, especially during the early véraison phase (45–65 DAF). Furthermore, KEGG enrichment analysis revealed that the SL system significantly enriched sugar metabolism and transport-related pathways during the early ripening stages, further supporting its role in promoting sugar accumulation. In conclusion, the SL system enhances soluble sugar accumulation and accelerates ripening in ‘Kyoho’ grape berries by regulating the expression of sugar metabolism-related genes, providing a theoretical basis for promoting the SL system in viticultural practices.

Author Contributions

X.L. and Y.L. conceived and designed the experiments and obtained the funding. X.L., J.L., T.C. and K.C. performed the experiments and analyzed the data. X.L. drafted the manuscript. All authors have read and agreed to the published version of the manuscript.

Funding

This work was supported by the Natural Science Foundation of Fujian Province (Science and Technology Agency in Fujian Province, 2022J01475); Central Guidance for Local Science and Technology Development Funds (Science and Technology Agency in Fujian Province, 2023L3025); Collaborative Innovation Project ‘5511’ of Fujian Province & Chinese Academy of Agricultural Sciences (Fujian Academy of Agricultural Sciences, XTCXGC2021006); The Seed Industry Innovation and Industrialization Project of Fujian Province (Fujian Provincial Department of Agriculture and Rural Affairs, zycxny2021010-4).

Data Availability Statement

The data supporting the results of this study are included in the present article.

Conflicts of Interest

The authors declare no conflicts of interest.

References

  1. Yilmaz, T.; Ates, F.; Turan, M.; Hatterman-Valenti, H.; Kaya, O. Dynamics of sugars, organic acids, hormones, and antioxidants in grape varieties ‘italia’ and ‘bronx seedless’ during berry development and ripening. Horticulturae 2024, 10, 229. [Google Scholar] [CrossRef]
  2. Wang, X.X.; Fan, X.C.; Li, A.; Zhang, C.B.; Fang, J.G.; Liu, C.H.; Shangguan, L.F. Investigation and analysis on cracking trait in grape berry. Acta Hortic. Sin. 2016, 43, 2099–2108. (In Chinese) [Google Scholar] [CrossRef]
  3. Bian, L.; Guo, D.L.; Yu, K.K.; Wei, T.L.; Pei, M.S.; Liu, H.N.; Yu, Y.H. Cloning and expression analysis of the cytokinin response regulator VlRR5 in Kyoho grapevine. Acta Hortic. Sin. 2021, 48, 1437–1445. (In Chinese) [Google Scholar] [CrossRef]
  4. Jiang, L.; Chen, Q.X.; Chen, T.; Xie, Q.; Lei, Y. Effects of training system modification on leaf photosynthetic characteristics and fruit quality in ‘Kyoho’ grapevines. North. Hortic. 2020, 17, 16–22. (In Chinese) [Google Scholar]
  5. Yin, H.; Wang, Z.; Wang, L.; Cao, J.; Wang, J.; Xi, Z. Effects of mesoclimate and microclimate variations mediated by high altitude and row orientation on sucrose metabolism and anthocyanin synthesis in grape berries. Hortic. Plant J. 2024, 10, 713–731. [Google Scholar] [CrossRef]
  6. Wu, B.H.; Liu, H.F.; Guan, L.; Fan, P.G.; Li, S.H. Carbohydrate metabolism in grape cultivars that differ in sucrose accumulation. Vitis 2011, 50, 51–57. [Google Scholar]
  7. Tian, L.; Jia, H.; Li, C.; Fan, P.; Xing, Y.; Shen, Y.Y. Sucrose accumulation during grape berry and strawberry fruit ripening is controlled predominantly by sucrose synthase activity. J. Hortic. Sci. Biotechnol. 2012, 87, 661–667. [Google Scholar] [CrossRef]
  8. Jiang, H.Y.; Li, W.; He, B.J.; Gao, Y.-H.; Lu, J.X. Sucrose metabolism in grape (Vitis vinifera L.) branches under low temperature during overwintering covered with soil. Plant Growth Regul. 2014, 72, 229–238. [Google Scholar] [CrossRef]
  9. Zhou, L.; Yang, Y.; Feng, H. Colored plastic film mulching regulates light quality and sucrose metabolism in wine grape in an arid desert oasis. J. Plant Growth Regul. 2023, 42, 7705–7714. [Google Scholar] [CrossRef]
  10. Liu, Y.; Cao, W.; Zhang, B.; Qin, H.; Wang, Y.; Yang, Y.; Xu, P.; Wang, Y.; Fan, S.; Li, C.; et al. Effects of different shaping methods and loading on fruit quality and volatile compounds in ‘Beibinghong’ grapes. Foods 2025, 14, 772. [Google Scholar] [CrossRef]
  11. Du, W.; Li, S.; Du, T.; Huang, W.; Zhang, Y.; Kang, H.; Yao, Y.; Gao, Z.; Du, Y. ‘Miguang’ grape response to pergola and single-curtain training systems. Horticulturae 2023, 9, 113. [Google Scholar] [CrossRef]
  12. Xia, H.Y.; Liu, Q.; Peng, J.Q.; Wu, W.; Gong, L.Z. Effects of f-shaped tree shape on photosynthetic characteristics and fruit quality in‘shine muscat’grapevines with rain-shelter cultivation. Acta Hortic. Sin. 2024, 51, 560–570. (In Chinese) [Google Scholar] [CrossRef]
  13. Li, Y.M.; You, J.L.; Nie, W.F.; Sun, M.H.; Xie, Z.S. Transcription profiles reveal age-dependent variations of photosynthetic properties and sugar metabolism in grape leaves (Vitis vinifera L.). Int. J. Mol. Sci. 2022, 23, 2243. [Google Scholar] [CrossRef]
  14. Jiang, S.Y.; Chi, Y.H.; Wang, J.Z.; Zhou, J.X.; Cheng, Y.S.; Zhang, B.L.; Ma, A.; Vanitha, J.; Ramachandran, S. Sucrose metabolism gene families and their biological functions. Sci. Rep. 2015, 5, 17583. [Google Scholar] [CrossRef]
  15. Fang, F.; Liu, B.; Fu, L.; Tang, H.; Li, Y.; Pang, X.; Zhang, Z. Water Supply via Pedicel Reduces Postharvest Pericarp Browning of Litchi (Litchi chinensis) Fruit. Foods 2024, 13, 814. [Google Scholar] [CrossRef]
  16. Nan, X.; Li, W.; Shao, M.; Cui, Z.; Wang, H.; Huo, J.; Chen, L.; Chen, B.; Ma, Z. Shading treatment reduces grape sugar content by suppressing photosynthesis-antenna protein pathway gene expression in grape berries. Int. J. Mol. Sci. 2024, 25, 5029. [Google Scholar] [CrossRef]
  17. Wang, Y.; Zhang, Z.; Liang, Y.; Han, Y.; Han, Y.; Tan, J. High potassium application rate increased grain yield of shading-stressed winter wheat by improving photosynthesis and photosynthate translocation. Front. Plant Sci. 2020, 11, 134. [Google Scholar] [CrossRef]
  18. Song, Y.; Hanner, R.H.; Meng, B. Genome-wide screening of novel RT-qPCR reference genes for study of GLRaV-3 infection in wine grapes and refinement of an RNA isolation protocol for grape berries. Plant Methods 2021, 17, 110. [Google Scholar] [CrossRef]
  19. Kong, Q.S. Chinese Grape Varieties; China Agric. Sci. Technol. Press: Beijing, China, 2004; p. 254. (In Chinese) [Google Scholar]
  20. Liu, C.H.; Shen, Y.J.; Chen, J. Descriptors and Data Standard for Grape (Vitis L.); China Agric. Press: Beijing, China, 2006; p. 96. (In Chinese) [Google Scholar]
  21. Zhong, H.; Yadav, V.; Wen, Z.; Zhou, X.; Wang, M.; Han, S.; Pan, M.; Zhang, C.; Zhang, F.; Wu, X. Comprehensive metabolomics-based analysis of sugar composition and content in berries of 18 grape varieties. Front. Plant Sci. 2023, 14, 1200071. [Google Scholar] [CrossRef]
  22. Lu, L.; Delrot, S.; Liang, Z. From acidity to sweetness: A comprehensive review of carbon accumulation in grape berries. Mol. Hortic. 2024, 4, 22. [Google Scholar] [CrossRef]
  23. Acharya, T.P.; Malladi, A.; Nambeesan, S.U. Sustained carbon import supports sugar accumulation and anthocyanin biosynthesis during fruit development and ripening in blueberry (Vaccinium ashei). Sci. Rep. 2024, 14, 24964. [Google Scholar] [CrossRef] [PubMed]
  24. Jiang, S.; Li, S.; Luo, J.; Wang, X.; Shi, C. QTL mapping and transcriptome analysis of sugar content during fruit ripening of Pyrus pyrifolia. Front. Plant Sci. 2023, 14, 1137104. [Google Scholar] [CrossRef]
  25. Liu, M.; Ji, H.; Jiang, Q.; Liu, T.; Cao, H.; Zhang, Z. Effects of full shading of clusters from véraison to ripeness on fruit quality and volatile compounds in Cabernet Sauvignon grapes. Food Chem. X. 2024, 21, 101232. [Google Scholar] [CrossRef] [PubMed] [PubMed Central]
  26. Shi, X.B.; Liu, F.Z.; Cheng, C.G.; Wang, X.D.; Wang, B.L.; Zheng, X.C.; Wang, H.B. Effects of canopy shapes of grape on canopy microenvironment, leaf and fruit quality in greenhouse. J. Appl. Ecol. 2015, 26, 3730–3736. [Google Scholar]
  27. Zhang, Z.; Zou, L.; Ren, C.; Ren, F.; Wang, Y.; Fan, P.; Li, S.; Liang, Z. VvSWEET10 mediates sugar accumulation in grapes. Genes 2019, 10, 255. [Google Scholar] [CrossRef]
  28. Lu, L.; Delrot, S.; Fan, P.; Zhang, Z.; Wu, D.; Dong, F.; García-Caparros, P.; Li, S.; Dai, Z.; Liang, Z. The transcription factors ERF105 and NAC72 regulate expression of a sugar transporter gene and hexose accumulation in grape. Plant Cell 2025, 37, koae326. [Google Scholar] [CrossRef]
  29. Bai, Q.; Chen, X.; Zheng, Z.; Feng, J.; Zhang, Y.; Shen, Y.; Huang, Y. Vacuolar Phosphate Transporter1 (VPT1) may transport sugar in response to soluble sugar status of grape fruits. Hortic. Res. 2023, 10, uhac260. [Google Scholar] [CrossRef]
  30. Li, J.C.; Duan, L.S.; Zhang, X.S. Effect of rainproof cultivation on grape disease incidence and light intensity under the shelter. J. Fruit Sci. 2009, 26, 847–850. (In Chinese) [Google Scholar]
  31. Yu, H.; Zhou, S.H.; Li, H.Y.; Huang, Y.; Cheng, G.; Liu, J.B.; Lan, Z.F. Investigation and analysis on resistance to gray mold of grape inflorescences under rain-shelter cultivation. Sino-Overseas Grapevine Wine 2024, 2, 22–27. (In Chinese) [Google Scholar] [CrossRef]
Figure 3. Effects of training systems on phenotypic and biochemical traits in ‘Kyoho’ grapes. (A) Berry fresh weight (n = 90), (B) longitudinal diameter (n = 90), (C) transverse diameter (n = 90), (D) soluble solid content, (E) total soluble sugars, (F) fructose, (G) glucose and (H) sucrose ((DH): n = 3 biological replicates). Data represent mean ± SE. Different lowercase letters indicate significant differences (p < 0.05, Duncan’s multiple range test).
Horticulturae 11 00578 g003
Figure 4. Summary of DEGs identified by RNA-seq analysis under SL and IU training systems at different developmental stages. (A) Principal component analysis (PCA); (B) number of DEGs in each comparison group; (C) correlation coefficient matrix heatmap for all samples; (D) Venn diagrams illustrating DEG overlap among comparison groups. Note: (1) SL1 and IU1 represent 45 DAF under SL and IU systems, respectively; (2) SL2 and IU2 represent 65 DAF under SL and IU systems, respectively; (3) SL3 and IU3 represent 95 DAF under SL and IU systems, respectively.
Horticulturae 11 00578 g004
Figure 5. KEGG-based metabolic pathway enrichment analysis of differentially expressed genes (DEGs) under different training systems during post-véraison stages. Y-axis: enriched KEGG pathways; X-axis: rich factor. (A) A total of 45 days after flowering (DAF); (B) 65 DAF; (C) 95 DAF. The red arrow in the figure indicate sugar metabolism pathways.
Horticulturae 11 00578 g005
Figure 6. Sugar accumulation and metabolism in grape cells during post-véraison stages: differential expression of sugar metabolism-related genes under SL and IU training systems. (A) A total of 45 DAF; (B) 65 DAF; (C) 95 DAF. Red and blue colors represent upregulated and downregulated genes, respectively, in the straight-line (SL) system compared to the inverted-umbrella (IU) system. Asterisks denote statistically significant differences at p < 0.05 after adjustment for multiple comparisons. (FDR-adjusted p < 0.05).
Horticulturae 11 00578 g006
Figure 7. Expression levels of sugar transporter genes in grape berries under different training systems during post-véraison stages: (A) 45 DAF; (B) 65 DAF; (C) 95 DAF. Red and blue colors represent upregulated and downregulated genes, respectively, in the SL system compared to the IU system. Asterisks denote statistically significant differences at p < 0.05 after adjustment for multiple comparisons.
Horticulturae 11 00578 g007
Figure 8. RT-qPCR analysis of FK7, SUS3, HXK2, SPP1, pGIT2, and ERDL6-15 expression levels in ‘Kyoho’ grape berries under different training systems at 45, 65, and 95 DAF. Data are presented as mean ± SE (from three biological replicates). Asterisks denote significant differences determined by Duncan’s multiple range test (* p < 0.05; ** p < 0.01).
Horticulturae 11 00578 g008
Figure 9. Pearson correlation analysis between glucose content and genes involved in glucose metabolism and transport. (A) Glucose metabolism; (B) glucose transport. Asterisks denote statistically significant differences at p < 0.05 after adjustment for multiple comparisons.
Horticulturae 11 00578 g009
Table 1. Primer sequences used in this study.
PrimerGene IDForward (5′-3′)Reverse (5′-3′)
ActinVitvi11g00056ATCAGGAAGGACCTCTATGGAACGACCTTAATCTTCATGCTGC
pGlT2Vitvi11g01400GGGTACTTATGGCAGCTTCATGCGCCACCATCCAATAA
ERDL6-15Vitvi18g00970GGAGTTGTGGCTATGGTAGTTGCCCTGCAAGGCCCTTTATATT
FK7Vitvi16g00895CCGTAATCCAAGCGCTGATAGAGTTGACCTACATGGTTCCTC
SUS3Vitvi07g00353CAAGGAATGGGTTTCGAGAGAGGAGCCTGAAGAATGTCCAAGAG
SPP1Vitvi08g00225CCGGATAATGGTTGGGTTCAGGGTCGTTGCTCTGTTTCT
HXK2Vitvi11g00260CATCGGGCTCCCTCATTAAACGCGCATATCAAGACCAATTC
Table 2. Effects of training systems on berry skin coloration in ‘Kyoho’ grapes.
Training SystemDays After Flowering (DAF)L*a*b*C
SL4532.45 ± 2.67 a4.02 ± 1.12 a−0.93 ± 0.64 b4.17 ± 1.78 a310.62 ± 22.15 a
5532.02 ± 2.32 b4.32 ± 1.46 a−1.08 ± 0.87 b4.35 ± 1.43 a317.86 ± 15.66 a
6531.74 ± 3.05 b4.91 ± 2.07 a−1.36 ± 0.63 b4.95 ± 1.06 a326.87 ± 18.73 a
7530.43 ± 1.72 b5.22 ± 2.54 a−1.63 ± 0.85 b5.26 ± 1.51 a331.03 ± 20.18 a
8529.75 ± 2.33 b5.84 ± 1.86 a−1.81 ± 1.02 b5.87 ± 2.60 a338.67 ± 19.26 a
9528.96 ± 1.25 b6.21 ± 1.72 a−1.97 ± 0.84 b6.23 ± 2.25 a347.62 ± 17.65 a
IU4533.96 ± 2.14 a3.25 ± 2.76 b−0.57 ± 0.25 a3.25 ± 2.57 b283.78 ± 24.53 b
5533.24 ± 0.97 a3.74 ± 2.48 b−0.72 ± 0.65 a3.77 ± 1.29 b294.38 ± 21.37 b
6532.65 ± 2.33 a4.2 ± 1.59 b−0.96 ± 0.79 a4.24 ± 1.32 b308.06 ± 18.75 b
7531.89 ± 1.88 a4.79 ± 1.66 b−1.25 ± 0.82 a4.79 ± 2.13 b317.56 ± 16.43 a
8530.79 ± 2.26 a5.02 ± 1.28 b−1.42 ± 1.05 a5.05 ± 2.45 b324.12 ± 20.91 a
9529.74 ± 2.59 a5.08 ± 2.43 b−1.6 ± 0.89 a5.12 ± 1.64 b339.71 ± 22.67 a
Note: Data represent mean ± SE (n = 3). Different lowercase letters indicate significant differences at p < 0.05 according to Duncan’s multiple range test.
Disclaimer/Publisher’s Note: The statements, opinions and data contained in all publications are solely those of the individual author(s) and contributor(s) and not of MDPI and/or the editor(s). MDPI and/or the editor(s) disclaim responsibility for any injury to people or property resulting from any ideas, methods, instructions or products referred to in the content.

