Article

Research on the Reproductive Strategies of Different Provenances/Families of Juglans mandshurica Maxim. Based on the Fruit Traits

1
Jilin Provincial Key Laboratory of Tree and Grass Genetics and Breeding, College of Forestry and Grassland Science, Jilin Agricultural University, Changchun 130118, China
2
College of Horticulture, Jilin Agricultural University, Changchun 130118, China
3
Linjiang Bureau of Natural Resources and Forestry, Linjiang 134699, China
*
Authors to whom correspondence should be addressed.
Horticulturae 2025, 11(5), 495; https://doi.org/10.3390/horticulturae11050495
Submission received: 27 March 2025 / Revised: 25 April 2025 / Accepted: 30 April 2025 / Published: 2 May 2025
(This article belongs to the Section Genetics, Genomics, Breeding, and Biotechnology (G2B2))

Abstract

:
This study systematically analyzed the fruit traits of four sources and 117 families of Juglans mandshurica Maxim. in Jilin Province. By measuring key traits such as fruit phenotype and nut phenotype, the relationship between fruit characteristics and environmental adaptability was explored, leading to the selection of superior materials with high oil content potential. The study used fruit from J. mandshurica of 117 families (random sampling) across four provenances as experimental materials and measured 13 fruit phenotypic traits, including fruit length and fruit width. Finally, principal component analysis and genetic variation parameters were conducted. The results of the variance analysis (ANOVA) indicated that except for the nut roundness index, all other traits exhibited highly significant differences among provenances and families (p < 0.01). The range of genetic and phenotypic variation coefficients for the various traits was 7.47–23.23% and 8.76–29.59%. The family heritability ranged from 0.968 to 0.988. Correlation analysis among fruit traits revealed a non-significant correlation between fruit width and seed yield, fruit type index and nut weight, kernel weight and kernel yield, as well as nut longitudinal diameter and kernel yield. However, significant correlations were observed among all other traits. The Pearson correlation analysis between fruit traits and environmental factors revealed a significant negative correlation between longitude and seed yield. Cluster analysis results, based on the Euclidean distance method, showed that materials from four provenances were categorized into three groups at a genetic distance of 5. Principal Component Analysis (PCA) revealed that the cumulative contribution rate of four principal components reached 87.00%. PCI demonstrated the highest contribution rate and included traits such as fruit length, nut longitudinal diameter, nut transverse diameter, nut side diameter, three-diameter mean, and nut weight. One elite provenance and five elite families were preliminarily selected. The realized gain for the selected provenance fruit traits was higher for fruit weight and kernel weight, with values of 2.41% and 3.67%, respectively. For the selected families, the genetic gain was highest for kernel yield and kernel weight, with values of 16.51% and 26.66%, respectively. The findings will provide insights into breeding strategies to enhance walnut oil yield. The identified traits may be used to guide breeding programs for developing high-oil-content varieties; However, further validation studies are required to confirm these traits and their applicability in large-scale breeding efforts.

1. Introduction

Juglans mandshurica Maxim. is a valuable deciduous hardwood species native to Northeast China. Its natural range extends from Jilin and Liaoning provinces westward to Inner Mongolia and southward to Shanxi, Henan, Hebei, and Shandong. In Heilongjiang Province, it occurs in mountainous regions including the Lesser Khingan Range and Wanda Mountains, becoming less common in northern areas. Internationally, the species is also found in North Korea, the Russian Far East, and Japan [1].
As a valuable tree species in Northeast China, the J. mandshurica is widely utilized in the production of high-end furniture and woodworking crafts due to its dense hardwood and attractive grain [2]. The seeds are highly nutritious, containing various essential fatty acids and amino acids required by the human body [3]. Additionally, the fresh root bark, branch bark, and immature fruit peel are rich in terpenes, flavonoids, quinones, and phenolic compounds, which have significant antibacterial and antitumor properties [4]. Therefore, germplasm selection should simultaneously consider the synergistic optimization of medicinal compound content and fruit agronomic traits to achieve the dual enhancement of both oil production and medicinal value. The natural forests of J. mandshurica in Northeast China have experienced extensive logging and destruction due to their high economic and medicinal value, leading to a significant decline in population numbers. This species was once classified as a Level II rare species, an endangered species, and a Level III protected plant in China [5]. The existing genetic resources have been severely depleted, posing challenges to its sustainable utilization. Currently, with the growing awareness of natural forest conservation, J. mandshurica germplasm resources have also recovered to a certain degree. However, due to its slow growth and the challenges of vegetative propagation and hybrid breeding, the research primarily focuses on growth traits [6] (tree height, diameter at breast height) and other target traits [7] (wood mechanical properties). Research on other target traits remains limited, leading to a narrow improvement focus and slow progress in genetic enhancement. To advance the development and conservation of existing germplasm resources, foster the cultivation of elite varieties, and accelerate the genetic improvement of J. mandshurica, it is essential to conduct targeted studies on fruit traits. Identifying and selecting families with elite fruit characteristics can significantly increase walnut oil yield, providing both economic and ecological benefits. This approach will support the development of high-yielding, oil-rich varieties, ensuring the sustainable improvement and utilization of J. mandshurica for walnut oil production.
The phenotypic traits of plant populations are influenced by geographic and environmental conditions. Understanding the characteristics and geographic distribution of a species provides valuable insights into the diversity of germplasm resources, genetic variation, and phylogenetic relationships across different regions [8]. This knowledge is essential for the regional classification of germplasm resources and is crucial in formulating rational development, utilization plans, and breeding strategies for J. mandshurica [9,10]. Research indicates that J. mandshurica exhibits abundant phenotypic variation in fruit traits across and within different regions, revealing a geographic variation trend from southeast to northwest. The genetic variation coefficients among provenances range from 1.86% to 10.56% [11]. Therefore, the aim of this study is to analyze the genetic variation patterns of the fruit traits in J. mandshurica. By analyzing 13 key traits, it also offers a reference for the selection of superior germplasm with high oil content. The specific research objectives are as follows: (1) quantify the contributions of genetic and environmental factors to trait variation; (2) investigate the correlations among high-yield, high-quality, and high-adaptability traits to reveal synergistic and trade-off relationships in breeding selection; (3) utilizing principal component analysis and other multi-indicator evaluation methods, this study aims to select superior germplasm resources with high yield, stable production, and strong adaptability; (4) integrate genetic diversity analysis results to propose germplasm conservation and sustainable utilization strategies, providing a scientific basis for variety improvement and resource protection.

2. Materials and Methods

2.1. Provenance Location and Experimental Materials

In September 2022, fruit collection was conducted on J. mandshurica trees with favorable growth traits and fruiting conditions in the natural distribution area of Jilin Province. Maternal trees with a diameter at breast height greater than 10 cm and a spacing of more than 100 cm between individual trees were selected. These fruits were brought back to the laboratory and stored at −20 °C for the subsequent measurement of fruit traits. The experimental materials included 117 families (tree numbers) from four provenances (seed source) based on random standards. The geographical location and environmental climate of different provenances are shown in Figure 1 and Table 1.

2.2. Experimental Methods

For each family, 30 healthy fruit samples of uniform size, free from pests and diseases, were randomly selected through general observation for the measurement of fruit phenotypic traits. Using a Vernier caliper (The equipment was sourced from Deli Group Co., Ltd., located in Ningbo, China.) measurements were taken for the length (mm) and width (mm) of the fruit with the green husk. Additionally, the longitudinal diameter (mm), transverse diameter (mm), and side diameter (mm) of the nut without the green husk were also measured. The measurement methods are shown in Figure 2. A 1/10,000 electronic analytical balance was used to measure the weight (g) of the fruit with the green husk, the nut weight (g) without the husk, and the kernel weight (g) within the nut. The following indices were calculated: fruit type index = fruit length/fruit width; nut roundness index = (side diameter + transverse diameter)/(2 × longitudinal diameter) [12]; three-diameter mean = (nut longitudinal diameter + nut transverse diameter + nut side diameter)/3 [13]; Seed yield (%) = (nut weight/fruit weight) × 100% [14]; and kernel yield (%) = (kernel weight/nut weight) × 100%. These measurements and indices provided a comprehensive assessment of the fruit traits.

2.3. Data Analysis

SPSS 26.0 data processing software was used to perform variance analysis, cluster analysis, correlation analysis, and principal component analysis.
The ANOVA model is as follows [15]:
X i = μ + α i + δ j ( i ) + e i j
where μ is the overall mean, α i is the provenance/family effect, δ j ( i ) is the random effect of family j within provenance i, and e i j is the experimental error.
The genetic coefficient of variation (GCV) is calculated using the following formula [16]:
G C V = σ g 2 X ¯ × 100 %
where σ g 2 is the genetic variance component of the trait, and X ¯ is the mean value of the trait.
The phenotypic coefficient of variation (PCV) is calculated using the following formula [16]:
P C V = σ P 2 X ¯ × 100 %
where σ P 2 is the phenotypic variance component of the trait, and X ¯ is the mean value of the trait.
This is the formula for family heritability (h2) [17]:
h 2 = σ F 2 σ F 2 + σ e 2 / k
where σ F 2 is the variance component of the family, σ e 2 is the variance component of the experimental error, and k is the number of repetitions.
The formula for calculating the phenotypic correlation coefficient is as follows [18]:
r A ( x y ) = σ a ( x y ) σ a ( x ) 2 . σ a ( y ) 2
where σ a ( x y ) is the phenotypic covariance between the two traits and σ a ( x ) 2   and σ a ( y ) 2 are the phenotypic variances of the two traits, respectively.
To perform a comprehensive evaluation of provenances and families, the principal component values and comprehensive scores were calculated. The calculation formulas are as follows [19]:
Y i = j = 1 n α i j X j ( j = 1 , 2 , 3 , , n )
W = i = 1 p Y i ω   i ( i = 1 , 2 , 3 , , p )
where Y i is the principal component value for the i-th component, α i j is the eigenvalue of trait j, X j   is the average of trait j, W is the comprehensive score, ω i is the contribution rate of the i-th principal component, n is the number of traits, and p is the number of extracted principal components.
The estimation of realized gain for each provenance is calculated according to Wang [20]:
G = ( X ¯ i X ¯ ) / X ¯ × 100 %
where X ¯ i is the mean value of a given family, and X ¯ is the overall mean.
The estimation of family genetic gain is calculated using the following formula [21]:
G = h 2 W / X ¯ × 100 %
where W is the selection differential, h 2 is the heritability of the trait, and X ¯ is the mean value of the trait.

3. Results

3.1. Variance Analysis

An analysis of variance was conducted on various fruit traits across different provenances and families of J. mandshurica, as detailed in Table 2. The results indicated that, except for the nut roundness index, all other fruit traits exhibited highly significant differences among provenances (p < 0.01). Similarly, the variance analysis for traits across different families revealed that all fruit traits differed significantly between families (p < 0.01). This suggests a substantial genetic variation in J. mandshurica fruit traits among provenances and families, which is advantageous for the evaluation and selection of elite provenances and families.

3.2. Genetic Variation Analysis

The genetic variation parameters for various fruit traits from 117 J. mandshurica families are presented in Table 3. The genetic and phenotypic variation coefficients for each trait ranged from 7.46% to 23.23% and from 8.76% to 29.59%, respectively. Among these traits, nut weight, kernel weight, seed yield, and kernel yield demonstrated relatively high variation coefficients, each exceeding 20%. The table shows that the coefficient of genetic variation (GCV%) for some traits is relatively high compared to the phenotypic variation coefficient (PCV%), indicating that these traits have strong genetic control and that genetic variation contributes significantly to phenotypic variation. It can be seen from the table that the heritability of traits across families ranged from 0.968 to 0.988, indicating a high level of heritability, as all values were above 0.5.

3.3. Analysis of Mean Values

An analysis of the mean values of fruit traits across the four provenances is presented in Table 4. The Hongshi provenance exhibited the highest mean values for fruit width, fruit weight, nut longitudinal diameter, nut transverse diameter, nut lateral diameter, nut weight, the mean of the three diameters, and kernel weight, measuring 40.53 mm, 39.9165 g, 44.27 mm, 28.88 mm, 28.69 mm, 12.2172 g, 33.95 mm, and 2.2683 g, respectively. However, the fruit shape index demonstrated the lowest mean among the four provenances at 1.33. Conversely, the Wangqing provenance exhibited the lowest mean values for fruit length, fruit width, nut longitudinal diameter, nut transverse diameter, nut lateral diameter, and mean of the three diameters, with measurements of 52.83 mm, 39.02 mm, 42.70 mm, 27.90 mm, 27.58 mm, and 32.73 mm. Moreover, the nut weight and kernel weight were measured at 10.2010 g and 2.0365 g, while seed yield was recorded at 28.48%. The kernel yield of the four provenances exhibited the highest mean at 20.23%. The Linjiang provenance demonstrated the highest mean values for fruit length and fruit shape index, measuring 54.31 mm and 1.36, with the maximum being 1.03 and 1.02 times the minimum, respectively. However, it exhibited the lowest mean values for the nut roundness index and kernel yield, which were 0.65 and 18.07%, respectively. The Huinan provenance exhibited the highest mean values for the nut roundness index and seed yield among the four provenances at 0.66 and 31.80%, with these maximums being 1.02 and 1.12 times the minimum. However, it demonstrated the lowest fruit mean weight at 36.2165 g.

3.4. Correlation of Physical Fruit Traits with Yields

The correlation analysis results of various fruit traits are presented in Table 5. As illustrated, fruit length was significantly positively correlated with fruit width, fruit weight, fruit type index, nut longitudinal diameter, nut transverse diameter, nut side diameter, nut weight, three-diameter mean, kernel weight, and seed yield. Strong correlations were observed with fruit type index, nut longitudinal diameter, and three-diameter mean (r > 0.5). Moreover, it was significantly negatively correlated with the nut roundness index and kernel yield, with a strong negative correlation with the nut roundness index (r > 0.5). Fruit width exhibited significant positive correlations with fruit weight, nut longitudinal diameter, nut transverse diameter, nut side diameter, nut weight, nut roundness index, three-diameter mean, and kernel weight, with a strong correlation with fruit weight (r > 0.5). It was also significantly negatively correlated with fruit type index and kernel yield and negatively correlated with seed yield. Fruit weight was significantly positively correlated with nut longitudinal diameter, nut transverse diameter, nut side diameter, nut weight, three-diameter mean, and kernel weight. It was significantly negatively correlated with fruit type index, nut roundness index, seed yield, and kernel yield. Additionally, the fruit type index was significantly positively correlated with nut longitudinal diameter, three-diameter mean, and seed yield, with a strong correlation with nut longitudinal diameter (r > 0.5). It was also significantly negatively correlated with nut transverse diameter, nut side diameter, and nut roundness index, with a strong negative correlation with nut roundness index (r > 0.5). Furthermore, the fruit type index was positively correlated with nut weight and negatively correlated with kernel weight and kernel yield. Nut longitudinal diameter was significantly positively correlated with nut transverse diameter, nut side diameter, nut weight, fruit weight, three-diameter mean, kernel weight, and seed yield, with strong correlations with fruit type index and three-diameter mean (r > 0.5). Moreover, it was significantly negatively correlated with the nut roundness index and negatively correlated with kernel yield. Nut transverse diameter exhibited significant positive correlations with nut side diameter, nut weight, three-diameter mean, nut roundness index, kernel weight, and seed yield, with strong correlations with nut side diameter, nut weight, three-diameter mean, and nut roundness index (r > 0.5). Additionally, it was significantly negatively correlated with kernel yield. Nut side diameter is significantly positively correlated with nut weight, three-diameter mean, nut roundness index, kernel weight, and seed yield, with strong correlations with nut weight, three-diameter mean, and nut roundness index (r > 0.5). It was significantly negatively correlated with kernel yield. Nut weight was significantly positively correlated with the three-diameter mean, nut roundness index, kernel weight, and seed yield, with strong correlations with the three-diameter mean, kernel weight, and seed yield (r > 0.5). It was also significantly negatively correlated with kernel yield. The three-diameter mean was significantly positively correlated with the nut roundness index, kernel weight, and seed yield. It was significantly negatively correlated with kernel yield. The nut roundness index exhibited a significant positive correlation with seed yield and a significant positive correlation with kernel weight. Furthermore, it was significantly negatively correlated with kernel yield. Kernel weight was significantly positively correlated with seed yield and kernel yield, with a strong correlation observed with kernel yield (r > 0.5). Furthermore, the seed yield was significantly negatively correlated with kernel yield. Additionally, the correlation analysis between fruit traits and environmental factors is presented in Table 6. The table indicates that seed yield was significantly negatively correlated with longitude, with a strong correlation (r > 0.5), while no significant correlations were observed between other fruit traits and environmental factors.

3.5. Clustering Analysis

The clustering analysis of J. mandshurica based on Euclidean distance is presented in Figure 3. As illustrated, at a genetic distance of 5, the four provenances were categorized into three groups. The first group included the Hongshi and Linjiang provenances, characterized by the highest mean values for fruit length (54.10 mm), fruit width (40.37 mm), fruit weight (38.9790 g), nut longitudinal diameter (44.18 mm), nut transverse diameter (28.86 mm), nut side diameter (28.56 mm), three-diameter mean (33.86 mm), nut weight (12.0263 g), and kernel weight (2.1879 g). Furthermore, the mean fruit type index in this group was the lowest at 1.35. The second group comprised the Huinan provenance, which demonstrated the highest mean values for nut roundness index and seed yield at 0.66 and 3.80%, respectively. This group exhibited the lowest mean values for fruit weight and shelling percentage, at 36.2165 g and 18.20%. The third group included the Wangqing provenance, characterized by the highest mean values for fruit type index and shelling percentage at 1.36 and 20.23%, respectively. However, this group recorded the lowest mean values for fruit length (52.83 mm), fruit width (39.02 mm), nut longitudinal diameter (42.70 mm), nut transverse diameter (27.90 mm), nut side diameter (27.58 mm), nut roundness index (10.65), three-diameter mean (32.73 mm), nut weight (10.2010 g), kernel weight (2.03651 g), and seed yield (28.48%).

3.6. Principal Component Analysis

A PCA was conducted on various fruit traits of J. mandshurica, with the results presented in Table 7. The eigenvalue of PCI was recorded at 5.08, contributing 39.05%. The traits with relatively high absolute values of eigenvectors included fruit length, nut longitudinal diameter, nut transverse diameter, nut side diameter, three-diameter mean, and nut weight, measuring 0.67, 0.73, 0.78, 0.79, 0.95, and 0.84, respectively. This indicates that these traits played a significant role in explaining the total variation. In particular, the high contribution rates of the three-diameter mean and nut weight suggest that these traits contributed substantially to the variation in fruit morphology and weight, making them important indicators for selecting elite germplasm. The eigenvalue of PCII was recorded at 2.80, contributing 21.51%. The absolute values of the eigenvectors for fruit type index and nut roundness index were relatively high, at 0.63, 0.77, and 0.95. Furthermore, the eigenvalue of PCIII was recorded at 1.91, contributing 14.68%. The absolute values of the eigenvectors for fruit width, fruit mass, and seed yield were relatively high, measuring 0.70, 0.77, and 0.69, respectively. Lastly, the eigenvalue of PCIV was recorded at 1.53, contributing 11.76%. The absolute values were relatively high for kernel weight and shelling percentage, at 0.75 and 0.96, respectively. The cumulative contribution rate of the four principal components was 87.00%, covering most of the information regarding the phenotypic traits of the tested materials.

3.7. Selection of Elite Provenances and Families

The linear equations for the scores of each principal component can be obtained from the results of the principal component analysis:
Y 1 = 0.67 x 1 + 0.60 x 2 + 0.43 x 3 + 0.09 x 4 + 0.73 x 5 + 0.78 x 6 + 0.79 x 7 + 0.84 x 8 + 0.95 x 9 + 0.07 x 10 + 0.60 x 11 + 0.55 x 12 0.08 x 13 ; Y 2 = - 0.66 x 1 + 0.11 x 2 - 0.16 x 3 - 0.77 x 4 - 0.63 x 5 + 0.40 x 6 + 0.43 x 7 + 0.15 x 8 - 0.04 x 9 + 0.95 x 10 + 0.07 x 11 + 0.25 x 12 0.07 x 13 ; Y 3 = - 0.15 x 1 - 0.70 x 2 - 0.77 x 3 + 0.50 x 4 + 0.04 x 5 + 0.06 x 6 + 0.04 x 7 + 0.20 x 8 + 0.06 x 9 + 0.01 x 10 + 0.15 x 11 + 0.69 x 12 0.01 x 13 ; Y 4 = - 0.10 x 1 + 0.00 x 2 - 0.03 x 3 - 0.09 x 4 - 0.04 x 5 - 0.09 x 6 - 0.09 x 7 - 0.03 x 8 - 0.09 x 9 - 0.06 x 10 + 0.75 x 11 - 0.05 x 12 + 0.96 x 13 .
Taking the contribution rate of each principal component as the weight of calculating the comprehensive score, the comprehensive evaluation score formula is obtained: W = 39.05   % Y 1 + 21.51   % Y 2 + 14.68   % Y 3 + 11.76   % Y 4 . The final calculated combined scores and rankings of each provenance and family are shown in Table 8 and Table 9. The Hongshi provenance was selected as the elite provenance. The average values of fruit width, fruit type index, nut longitudinal diameter, nut transverse diameter, nut side diameter, nut weight, three-diameter mean, nut roundness index, kernel weight, seed yield, and kernel yield were 40.21 mm, 38.0415 g, 44.08 mm, 28.83 mm, 28.43 mm, 11.8353 g, 33.78 mm, 0.65, 2.1075 g, 31.29%, and 18.07%, and the provenance reality gains were 0.39%, 2.41%, 0.22%, 0.07%, 0.45%, 1.59%, 0.24%, 0.13%, 3.67%, 0.09%, and 2.00%, respectively (Table 10). The families were selected with a 5% inclusion rate, and families HS-08, WQ-07, LJ-06, HS-18, and LJ-15 were selected as elite families. The mean values of the selected families were 58.79 mm, 44.83 mm, 42.9828 g, 48.93 mm, 34.33 mm, 34.25 mm, 16.0484 g, 39.17 mm, 0.70, 2.9854 g, 38.51%, and 19.59%, and the family genetic gain was 1.53%, 2.82%, 4.59%, 0.05%, 0.06%, 0.02%, 6.22%, 0.05%, 0.50%, 26.66%, 2.07%, and 16.51%, respectively (Table 10).

4. Discussion

The selection process is the most critical aspect of elite cultivar breeding. The greater the variation in traits, among and within provenances, the more potential there is for selective breeding [22]. The selection of elite provenances will inevitably lead to a narrowing of genetic diversity. Therefore, it is necessary to continuously supplement new elite provenances in the breeding population [23]. To investigate the phenotypic variation in fruit traits of J. mandshurica from different provenances, this study conducted an analysis of 13 fruit traits across four provenances in Jilin Province. The results of the variance analysis exhibited highly significant differences for all traits, both among provenances and among families. This finding is consistent with the research by Yu on J. mandshurica, which also identified substantial and significant variation in fruit traits across provenances and families [24]. These findings suggested the potential for developing elite provenances and families, providing a basis for germplasm resource evaluation. This demonstrates that the significant phenotypic variations in J. mandshurica fruits across provenances and families provide valuable genetic resources for elite cultivar selection while necessitating the ongoing diversification of breeding populations to preserve genetic diversity.
The coefficient of variation is an important measure used to assess the degree of trait variation, which plays a crucial role in the breeding of elite tree species [25]. In this study, traits with relatively low genetic coefficients of variation included fruit length, fruit width, fruit type index, and five other traits (with genetic coefficients of variation below 10%). Conversely, the traits with higher genetic coefficients of variation were nut weight, kernel weight, and seed yield, suggesting that these traits can be relatively stable and inherited by the next generation. When examining phenotypic coefficients of variation, lower values were observed for fruit length, fruit width, and the three-diameter mean (all below 10%). In contrast, traits with higher phenotypic coefficients of variation, such as nut weight, kernel weight, seed yield, and kernel yield, indicated significant potential as selection indicators due to their rich phenotypic diversity. Furthermore, the study demonstrated that the GCV accounted for a large proportion of the PCV for all traits, which aligns with the findings of Li in their analysis of fruit traits across 12 provenances [26]. This suggested that the growth variation among families is mainly controlled by genetic factors, providing valuable insights for the selection of elite provenances and families. The mean data indicated significant differences in fruit traits among various provenances and families of J. mandshurica. In this study, the mean values for various fruit and nut phenotypic traits of J. mandshurica in Jilin Province were higher than those of Carya cathayensis in the Dabie Mountains of Anhui Province [27]. However, the mean fruit type index and kernel yield were lower than those of walnuts from Guizhou Province [28]. This may be due to geographic differences, suggesting that geographic and environmental factors can influence the fruit traits of J. mandshurica. Heritability reflects the ability of a parent plant to pass a trait to its offspring. Moreover, a higher heritability indicates that the trait can be stably inherited. In this study, the heritability range of J. mandshurica families was 0.968–0.988, indicating a higher level of heritability, which exceeds the heritability of growth traits in Fraxinus mandshurica [29]. This indicated that the fruit traits of J. mandshurica can be stably inherited. Additionally, fruit weight and nut weight exhibited the highest heritability, suggesting that these two traits possess the greatest potential for genetic gain. The findings confirm that J. mandshurica exhibits highly heritable fruit traits with substantial genetic variation, particularly in nut-related characteristics, making them ideal targets for selective breeding programs.
Mean analysis is a statistical method that reflects the average level of a trait within a population. Due to the interaction between genetics and the environment, significant differences in traits exist among different groups. By comparing means, the dependencies between traits can be analyzed [
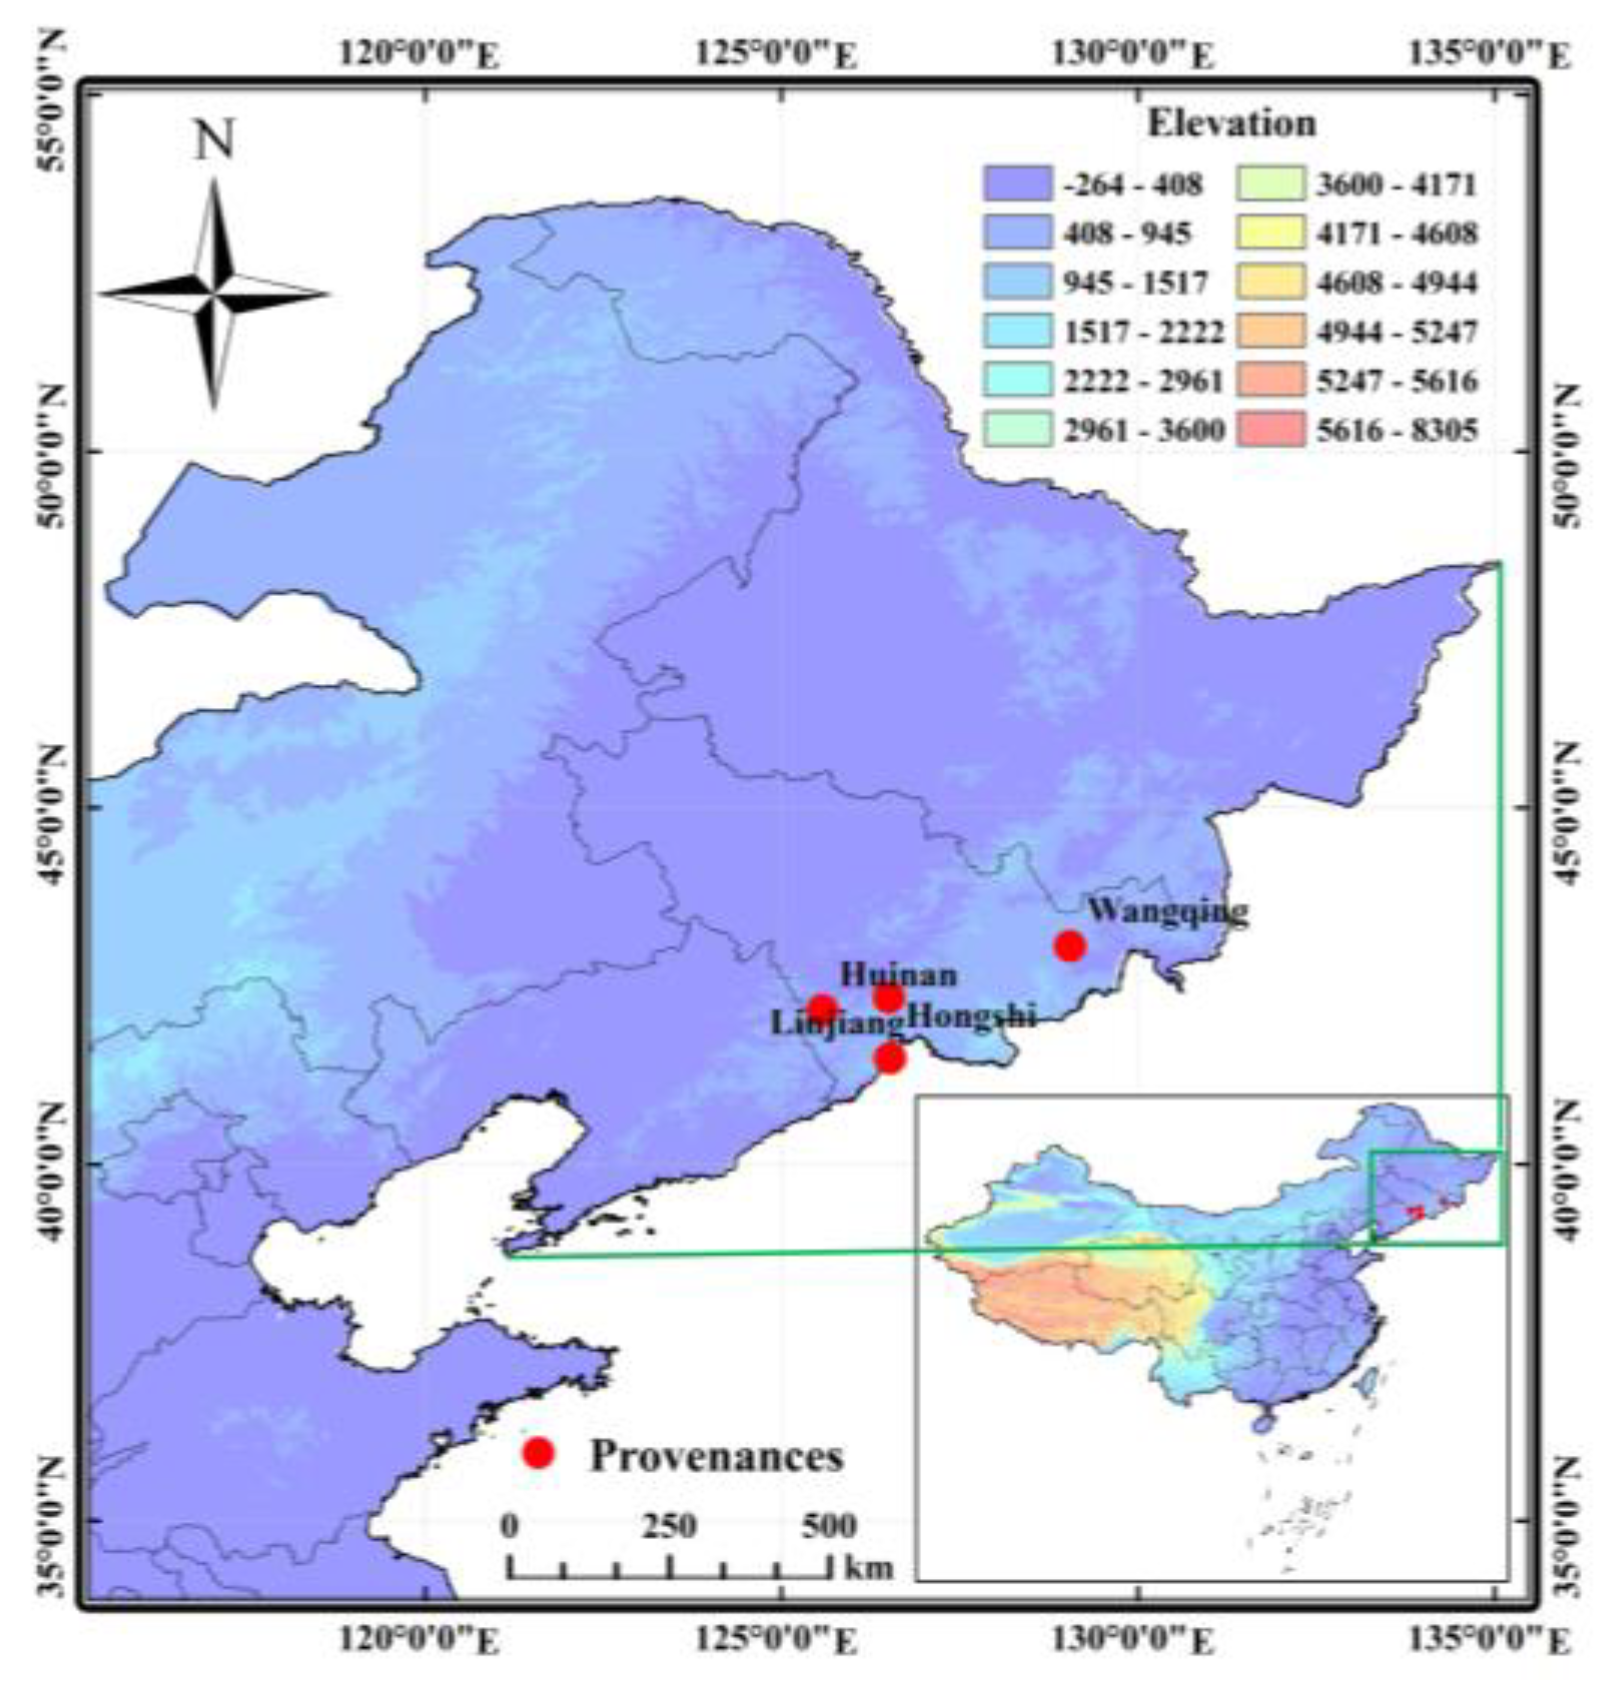
30]. In this study, the Hongshi provenance demonstrated the highest mean values for eight fruit traits among all provenances, such as fruit width and nut longitudinal diameter, while it exhibited the lowest mean fruit type index. Conversely, the Wangqing provenance recorded the lowest mean values for nine fruit traits, including fruit length and fruit width. However, it recorded the highest kernel yield among all provenances. The reason may be that, to support kernel development, the fruit and nut reduce their own weight to ensure sufficient energy for kernel growth, thereby increasing the kernel yield. In addition, differences in geographic location among provenances may lead to considerable variability in the mean values of fruit traits in J. mandshurica. Similarly, a study by Han on Acer truncatum found significant differences in seed traits among provenances [31], indicating abundant variation in fruit traits. This diversity is beneficial for the evaluation and selection of J. mandshurica from different provenances. The results demonstrate significant differences in fruit traits among J. mandshurica provenances, with the Hongshi provenance exhibiting optimal performance in most morphological traits while the Wangqing provenance shows the greatest potential in kernel yield.
The relationships between variables can be represented through correlation analysis. In a study by Pang, it is suggested that comprehensive analysis is elite to direct correlation analysis, as multiple indicators are needed to reflect the correlations between traits, and environmental factors can influence the physiological growth traits of trees [32]. Furthermore, the research by Tore confirmed that geographical and ecological conditions also play a decisive role in determining the fruit quality of plants [33]. In this study, correlation analysis of various traits revealed that nut longitudinal diameter exhibited a high positive correlation with fruit length, and the three-diameter mean was highly positively correlated with nut longitudinal, transverse, and side diameters, with correlation coefficients of 0.872, 0.826, and 0.814, respectively, all reaching highly significant levels. This suggests that the fruit phenotype influences nut development, likely because a larger fruit volume provides more space within the fruit for nut growth, resulting in a greater longitudinal diameter. Additionally, the nut roundness index demonstrated a high negative correlation with fruit length, fruit type index, and nut longitudinal diameter, with correlation coefficients of −0.531, −0.594, and −0.585, respectively, all reaching highly significant levels. This suggested that the fruit type index influences the nut roundness index: as the fruit length increases, the transverse and side diameters of the nut decrease, further indicating that the fruit phenotype affects nut development. Correlation analysis with environmental factors revealed a significant negative correlation between longitude and seed yield, while other traits did not reach significant levels with geographical conditions. This indicates that longitude has a substantial effect on seed yield, possibly because the lower longitudes of these four provenances are associated with higher precipitation and longer sunlight exposure, which in turn increase nut weight, thereby boosting seed yield. Additionally, the correlation coefficients between annual rainfall and various traits were relatively high, further suggesting that annual rainfall significantly impacts fruit traits. Conversely, altitude demonstrated the lowest correlation with the traits, indicating a minimal effect on fruit traits. Also, a study by Deng shows that the seedling stage is most sensitive to external environments during tree regeneration [34]. These results further confirm that geographical and environmental factors influence the traits of J. mandshurica fruit and seeds. This may be because J. mandshurica adjusts its phenotype to adapt to external environmental conditions, allowing more seeds space for growth and development. The findings conclusively demonstrate that both intrinsic trait correlations and extrinsic geographical factors significantly shape the phenotypic expression of J. mandshurica fruit characteristics, and longitude may affect seed traits.
Cluster analysis in data analysis enables the discovery of underlying structures and patterns in complex datasets. Selecting the appropriate clustering algorithm and parameter settings is critical for the validity and reliability of the results of these analyses. Cluster analysis based on squared Euclidean distance can categorize materials from different provenances according to distinct trait types [35], thereby enhancing the value of each type of J. mandshurica fruit seed. In this study, cluster analysis was conducted on the fruit traits of four 
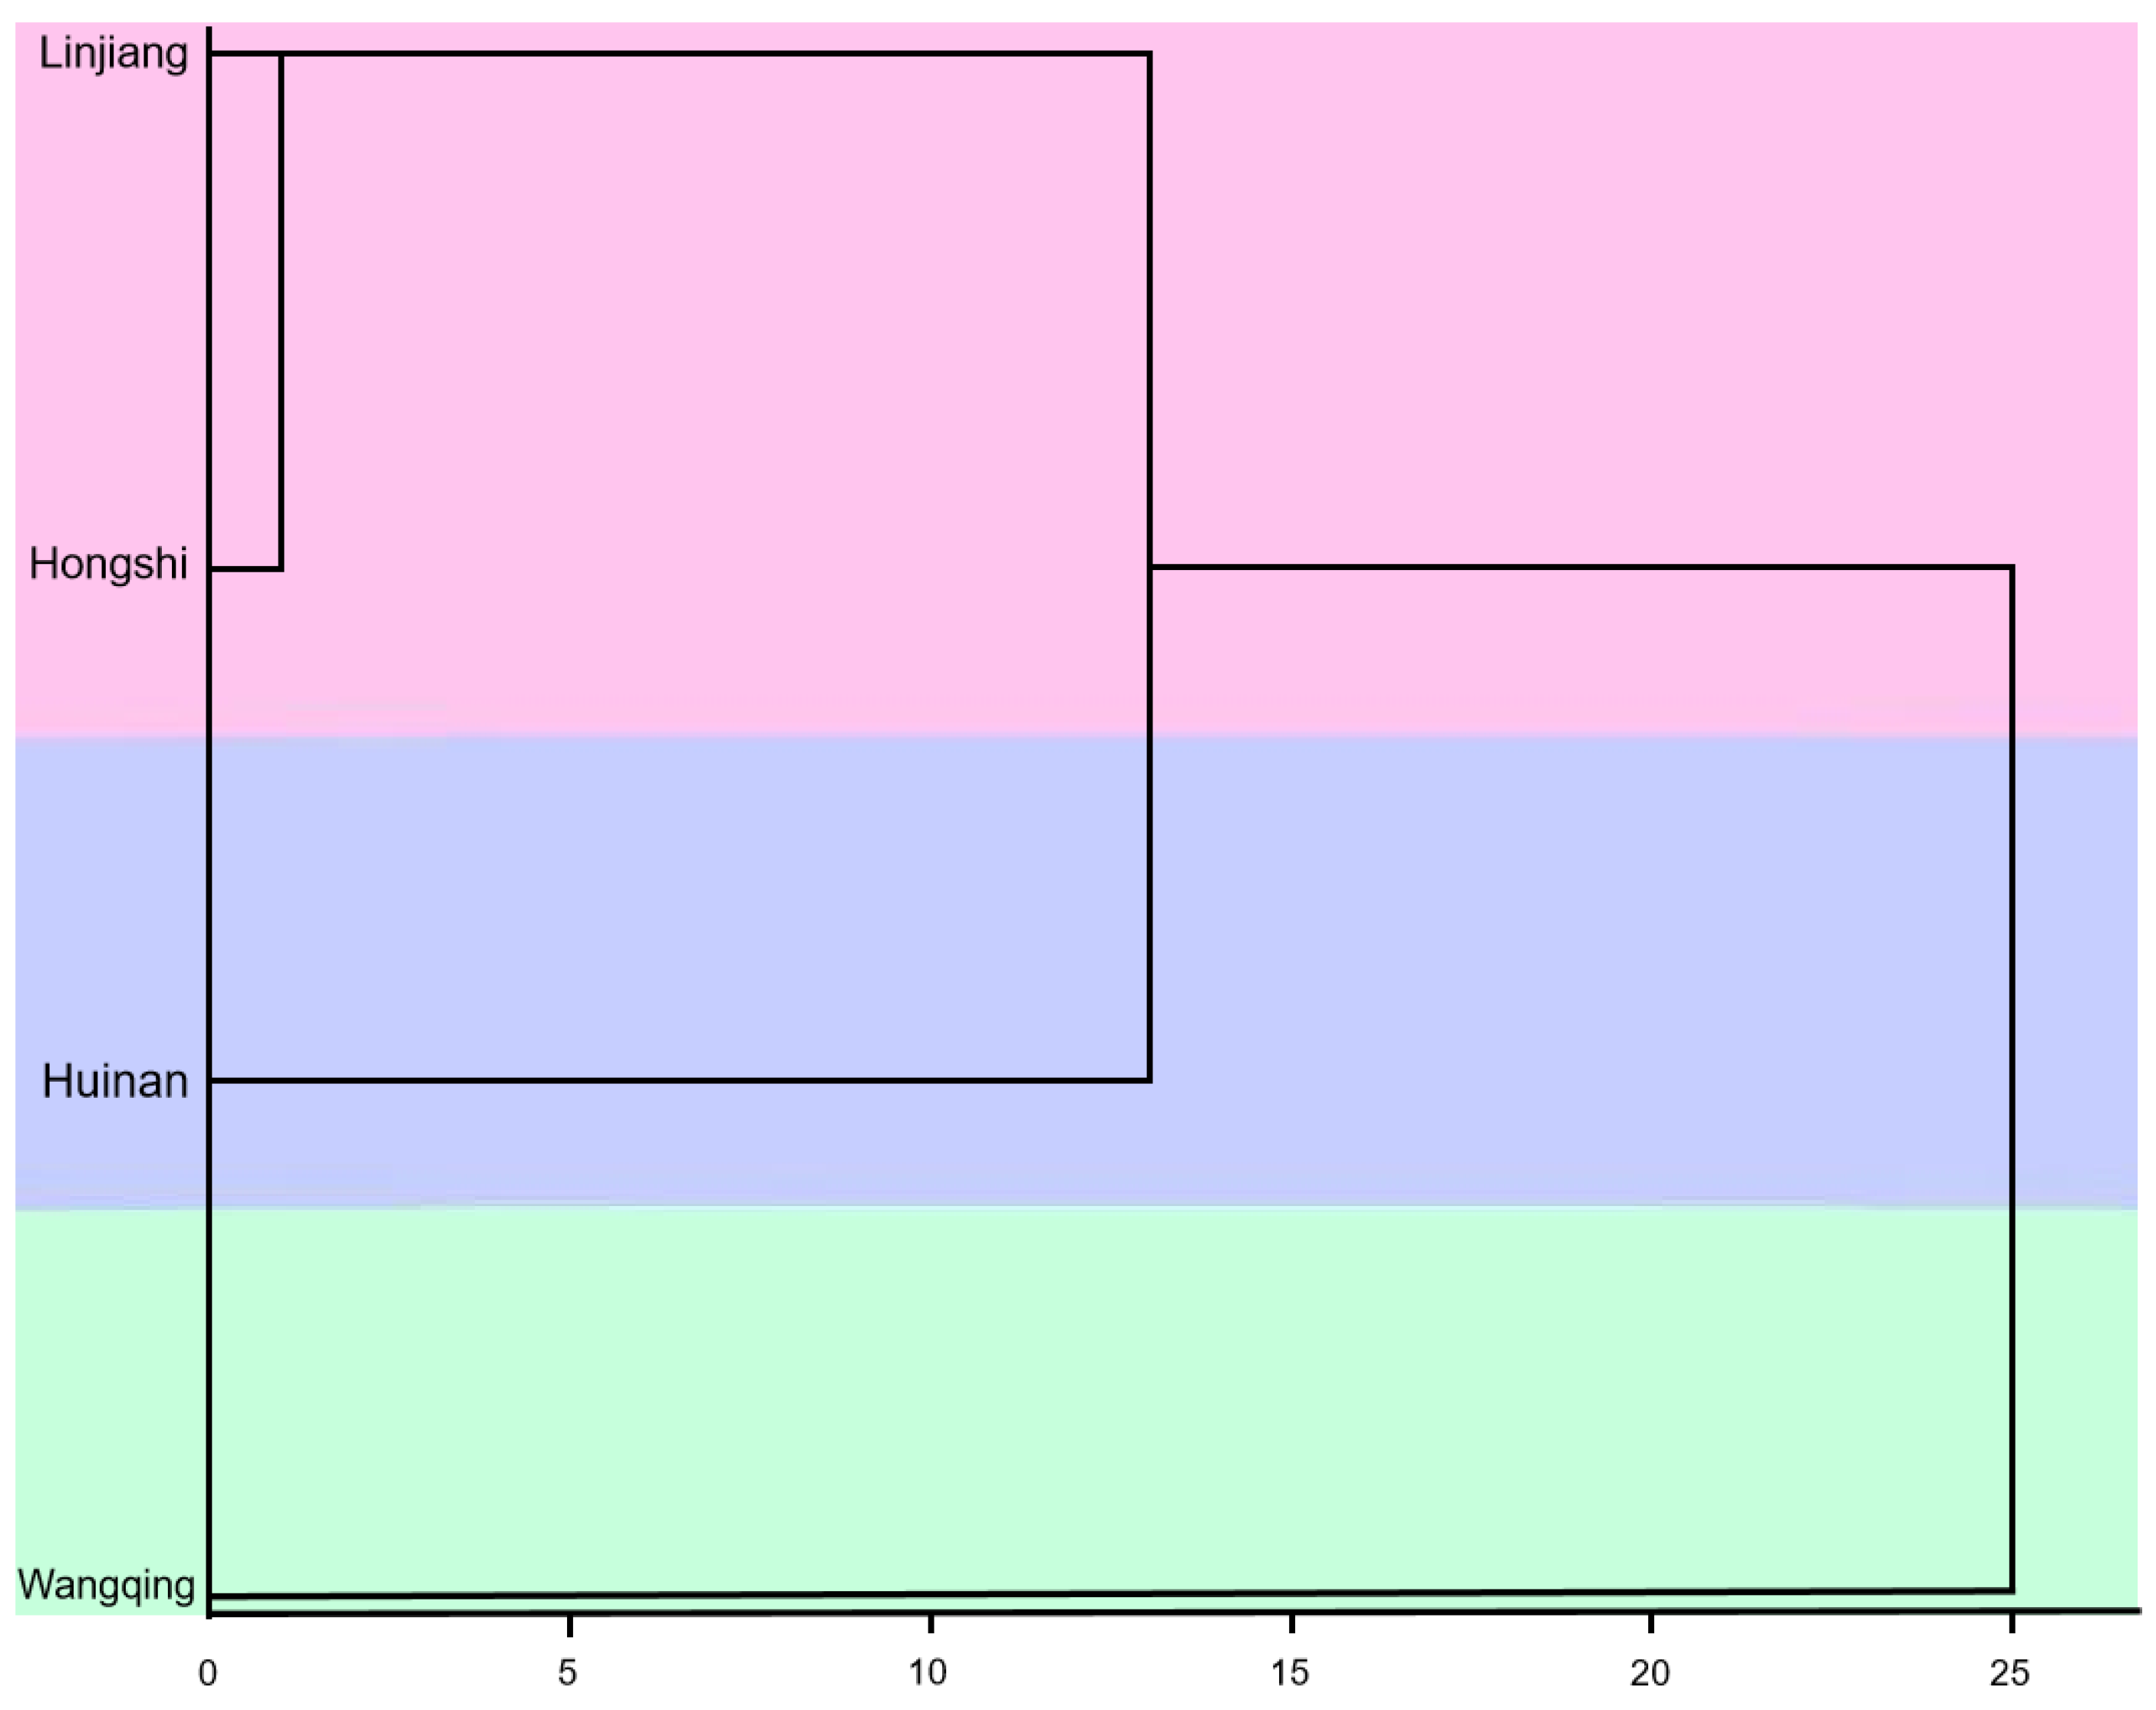
J. mandshurica provenances. When the genetic distance was set to 5, the analysis grouped the materials into three clusters. The first cluster included the Hongshi and Linjiang provenances, which have higher mean values for nine traits, including fruit length and fruit width, and a lower mean fruit type index. This suggested that materials in this group exhibit prominent fruit phenotypic traits with larger weights. The second cluster included the Huinan provenance, characterized by a higher nut roundness index and seed yield, as well as lower fruit weight and kernel yield. This indicated that materials in this group have prominent nut phenotypic traits and a rounder nut shape. The third cluster included the Wangqing provenance, characterized by a higher fruit type index and kernel yield, indicating that materials in this group have distinct kernel traits and a higher kernel yield. The cluster analysis effectively classified J. mandshurica provenances into three distinct groups based on fruit characteristics, with each cluster exhibiting unique combinations of superior traits for either fruit morphology, nut quality, or kernel production potential.
PCA can condense multiple variables into a few representative indicators, clearly reflecting the original set of variables [36]. In this study, the eigenvalues of the four principal components were 5.08, 2.80, 1.91, and 1.53, with a cumulative contribution rate as high as 87.00%, encompassing most of the information on fruit traits. PCI demonstrated the highest contribution rate and included traits such as fruit length, nut longitudinal diameter, nut transverse diameter, nut side diameter, three-diameter mean, and nut weight. This indicated that the morphology and weight of the nut have a significant impact on the fruit phenotype. This may be because the fruit needs to provide the necessary nutrients and space for nut growth, leading to changes in fruit length and width based on nut morphology. The three-diameter mean of the nut affects kernel development as a larger three-diameter allows more space for kernel growth, while smaller means restrict it, resulting in variations among provenances. Finally, the linear equations were established based on the two principal components, which carried out the comprehensive evaluation of multiple traits, and selected one elite provenance and five elite families. The results revealed that the Hongshi provenance achieved the highest comprehensive score, establishing it as an elite provenance. With a selection rate of 5%, five families, including HS-08 and HS-18, were selected as elite families. Among these, five elite families, such as LJ-06 and LJ-15, belong to the elite provenance and hold the potential for further promotion and application in J. mandshurica cultivation. The selected families performed excellently in kernel weight, indicating a significant increase in kernel production, high genetic gain, and the capacity to produce more J. mandshurica kernels for refining oil. Future research could further explore the correlations between phenotypic traits and environmental factors to better elucidate the influence of environmental conditions on the growth and development of J. mandshurica. Additionally, in-depth studies on the genetic mechanisms underlying these traits will help accelerate breeding processes and enhance crop production efficiency.

5. Conclusions

This study analyzed the seed traits of four provenances of J. mandshurica from Jilin Province, revealing significant variation in traits such as nut morphology and fruit morphology. The genetic variation coefficient ranged from 7.46% to 23.23%, indicating considerable genetic diversity. Cluster analysis and principal component analysis identified clear differences in adaptive patterns, with the Hongshi provenances showing elite traits in environmental adaptability and the fruit having a high oil content. In the correlation analysis of traits, a significant correlation was observed between longitude and seed yield, while no correlations were found between phenotypic traits and environmental factors. Due to limitations in fieldwork conditions, this study could not provide additional data or analysis on the relationships between climatic factors, soil factors, and seed traits. Further research on the correlation between phenotypic characteristics and environmental factors will be conducted in the future. Furthermore, most seed traits exhibited significant or highly significant correlations with each other. The strong correlations among traits help reduce redundancy in multi-trait comprehensive evaluations, thereby improving screening efficiency.

Author Contributions

Writing—original draft, Y.C.; data curation, Y.C. and Q.Z.; investigation, C.L., J.Y., L.X. and H.L.; methodology, Y.C., Q.Z. and X.Z.; software, X.P. and D.P.; validation, Z.Y., M.K. and Y.P.; visualization, X.P.; project administration, X.Z.; funding acquisition, X.P. and X.Z.; supervision, Q.Z. and X.Z.; writing—review and editing, Q.Z., R.G. and X.Z. All authors have read and agreed to the published version of the manuscript.

Funding

This work was supported by the Open Fund Project of the State Key Laboratory of Tree Genetics and Breeding (K2022101) and the Special Fund Project for Biosafety and Genetic Resource Management (KJZXSA202208).

Data Availability Statement

The data that support the findings of this study are available from the corresponding author upon reasonable request.

Acknowledgments

The authors are grateful to the anonymous reviewers for their comments.

Conflicts of Interest

The authors declare no conflicts of interest.

References

  1. Zhou, Y.L. Heilongjiang Trees Annals; Heilongjiang Science and Technology Press: Harbin, China, 1986. [Google Scholar]
  2. Wang, Q.J.; Wang, X.Z.; Liu, L.B. Walnut catalpa economic timber forest construction technology. Pract. Technol. 2003, 5, 14–15. [Google Scholar]
  3. Zhang, S.M.; Xi, J.W.; Hong, J.Y.; Xia, G.H.; Li, Y.; Huang, X.Z. A study on phenotypic diversity of fruit and leaf traits in Carya dabieshanensis. For. Res. 2020, 33, 152–161. [Google Scholar] [CrossRef]
  4. Zhang, Q.H.; Zhang, X.X.; Yang, Y.C.; Xu, L.F.; Feng, J.; Wang, J.Y.; Tang, Y.; Pei, X.; Zhao, X. Genetic diversity of Juglans mandshurica populations in northeast China based on SSR markers. Front. Plant Sci. 2022, 13, 931578. [Google Scholar] [CrossRef] [PubMed]
  5. Editorial Committee of Chinese Botany. Flora of China; Science Press: Beijing, China, 2004. [Google Scholar]
  6. Liu, J.H.; Li, Z.X.; Zhang, H.G.; Song, L.X.; Yang, Y. Analysis of Variation in Growth Traits of Different Species and Families of Juglans mandshurica. J. Northeast. For. Uni. 2023, 51, 9–17. [Google Scholar]
  7. Liu, Z.H.; Ma, X.H.; Xie, Q. Comparison of wood anatomical characteristics between Black Walnut and Juglans mandshurica. J. Northeast. For. Univ. 2019, 47, 49–52. [Google Scholar] [CrossRef]
  8. Zhang, H. Population Structure and Genetic Analysis of Endangered Plant. Master’s Thesis, Ludong University, Yantai, China, 2021. [Google Scholar]
  9. Jin, X. Effect of different sediment treatments on physiological metabolism and germination of Juglans mandshurica. Liaoning For. Sci. Technol. 2022, 6, 32–34. [Google Scholar]
  10. Najme, C.; Kazem, A.; Saadat, S.; Stefano, P. Phenotypic and pomological diversity of selected native walnut (Juglans regia) populations: Implications for breeding and cultivation programs. Euphytica 2024, 220, 98. [Google Scholar] [CrossRef]
  11. Chen, S.Y.; Yang, H.; Han, J.; Zhang, D.W.; Zhao, S.S.; Zhang, Z.H. Provenance variation of seed traits of Juglans mandshurica in Changbai mountains, northeastern China. J. Beijing. For. Univ. 2015, 37, 32–40. [Google Scholar] [CrossRef]
  12. Liu, H.; Ma, Q.G.; Zhang, J.Y.; Wen, M.; Song, X.B.; Zhang, J.P. Phenotypic diversities of nuts of walnut populations originated from seedlings in Liangshan prefecture. For. Res. 2017, 30, 771–778. [Google Scholar] [CrossRef]
  13. Lou, L.; Chen, J.; Geng, Y.Y.; Sun, J.C.; Fu, P.; Zheng, X.R. Phenotypic diversity analysis of Juglans cathayensis seeds in Guizhou. Guizhou Agric. Sci. 2017, 45, 13–15. [Google Scholar]
  14. Chang, J.; Ren, H.D.; Yao, X.H.; Wang, K.L.; Zhou, Y.; Zhou, Z.Q. Nut fruit characteristies and nutrients of Carya cathayensis clones. For. Res. 2017, 30, 166–173. [Google Scholar] [CrossRef]
  15. Xu, J.R. Quantitative Senetics in Forestry; Higher Education Press: Beijing, China, 2006. [Google Scholar]
  16. Zhang, H.; Zhang, Y.H.Y.; Zhang, D.W.; Dong, L.H.; Liu, K.J.; Wang, Y. Progeny performance and selection of superior trees within families in Larix olgensis. Euphytica 2020, 216, 60. [Google Scholar] [CrossRef]
  17. Wu, S.J.; Chen, G.C.; Xu, J.M.; Li, G.Y.; Song, P.N.; Guo, W.Z. Variation analysis and selection for Eucalyptus grandis provenances and families in southern Jiangxi. For. Environ. Sci. 2017, 33, 1–7. [Google Scholar]
  18. Zhao, X.Y.; Hou, W.; Zheng, H.Q.; Zhang, Z.Y. Analyses of genotypic variation in white poplar clones at four sites in China. Silvae Genet. 2013, 62, 187–195. [Google Scholar] [CrossRef]
  19. Chen, L. The Researches on Seedling Characters Difference of Fokienia hodginsi from Different Provenances and Excellent Provenance Selection. Master’s Thesis, Fujian Agriculture and Forestry University, Fuzhou, China, 2015. [Google Scholar]
  20. Wang, F.; Ma, M.; Wang, J.X.; Zhang, H.G. Analysis of Genetic Variation and Selection of Superior Families and Clones of Larix kaempferi. For. Engr. 2023, 39, 48–57. [Google Scholar] [CrossRef]
  21. Liang, D.Y.; Ding, C.J.; Zhao, G.H.; Leng, W.W.; Zhang, M.; Zhao, X.Y.; Qu, G. Variation and selection analysis of Pinus koraiensis clones in northeast China. J. For. Res. 2018, 29, 611–622. [Google Scholar] [CrossRef]
  22. Chen, X.Y.; Shen, X.H. Forest Breeding; Higher Education Press: Beijing, China, 2005. [Google Scholar]
  23. Que, Q.M.; Ouyang, K.X.; Li, C.M.; Li, B.Y.; Song, H.Y.; Li, P.; Pian, R.; Li, H.; Chen, X.; Peng, C. Geographic variation in growth and wood traits of Neolamarckia cadamba in China. For. Res. 2022, 2, 12. [Google Scholar] [CrossRef]
  24. Yu, G.B. Collection of Juglans mandshurica germplasm resources and fruit types in northeast China. For. Sci. Technol. 2020, 5, 19–22. [Google Scholar] [CrossRef]
  25. Mwase, F.W.; Savill, S.P.; Hemery, G. Genetic parameter estimates for growth and form traits in common ash (Fraxinus excelsior, L.) in a breeding seedling orchard at Little Wittenham in England. New For. 2008, 36, 225–238. [Google Scholar] [CrossRef]
  26. Li, Z.X.; Wang, W.H.; Zhang, H.X.; Liu, J.H.; Shi, B.Y.; Dai, W.Z.; Liu, K.; Zhang, H. Diversity in fruit morphology and nutritional composition of Juglans mandshurica Maxim in northeast China. Front. Plant Sci. 2022, 13, 820457. [Google Scholar] [CrossRef]
  27. Zhang, S.M. Analysis on Diversity of Nut Phenotypic Traits and Nutritional Components of Carya dabieshanensis. Master’s Thesis, Zhejiang A & F University, Hangzhou, China, 2019. [Google Scholar]
  28. Lu, Z.K.; Zeng, Y.J.; Wang, G.; Hou, N.; Chen, S.Q. Phenotypic traits diversities of walnut germplasm resources in Guizhou. Acta Bot. Boreali-Occident. Sin. 2023, 43, 462–473. [Google Scholar] [CrossRef]
  29. Liu, X. Analysis of Differences in Growth and Photosynthetic Physiological Characteristics of Fraxinus mandshurica. Master’s Thesis, Jilin Agricultural University, Changchun, China, 2023. [Google Scholar]
  30. Yu, H.Y.; Xin, J.K.; Wang, X.M.; Song, W.W.; Zhang, Y.M.; Zhang, L.; Yang, Y.; Bi, C. Study on variation selection of growth traits of Pinus koraiensis parental clones. Shelterbelt. Technol. 2023, 4, 63–67. [Google Scholar] [CrossRef]
  31. Han, M.H.; Ren, F.; Yan, L.P.; Wang, Y.H.; Liang, Y.; Zhong, W.G. Fruit and seed phenotypic diversity of natural populations of Acer truncatum in Shandong. J. Cent. South Univ. For. Technol. 2023, 43, 173–184+192. [Google Scholar] [CrossRef]
  32. Pang, F.H.; Yang, J.W.; Pang, Z.L.; Du, R.Q. The correlation analysis between Populus Simonii ecophysiological indexes and environmental factors. Acta Ecol. Sin. 2010, 30, 3188–3197. [Google Scholar]
  33. Tore, S.; Arne, S. Performance and Phenotypic stability of Norway Spruce provenances, families, and clonesgrowing under diverse climatic conditions in four nordic countries. Forests 2021, 12, 230. [Google Scholar] [CrossRef]
  34. Deng, J.J.; Fang, S.A.; Fang, X.M.; Jin, Y.Q.; Kuang, Y.W.; Lin, F.M.; Liu, J.; Ma, J.; Nie, Y.; Ouyang, S.; et al. Forest understory vegetation study: Current status and future trends. For. Res. 2023, 3, 6. [Google Scholar] [CrossRef]
  35. Baykan, E.; Henzinger, M.; Marian, L.; Weber, I. A Comprehensive study of features and algorithms for URL-Based topic Classi-fication. ACM Trans. Web 2011, 5, 1–29. [Google Scholar] [CrossRef]
  36. Jolliffe, I.T.; Cadima, J. Principal component analysis: A review and recent developments. Philos. Trans. A. Math. Phys. Eng. Sci. 2016, 374, 20150202. [Google Scholar] [CrossRef]
Figure 1. Different geographical locations of provenances.
Horticulturae 11 00495 g001
Figure 2. Measurement methods of the fruit and nut (a. fruit length; b. fruit width c. nut longitudinal diameter; d. nut transverse diameter; e. nut side diameter).
Horticulturae 11 00495 g002
Figure 3. Cluster analysis of fruit traits for different J. mandshurica provenances.
Horticulturae 11 00495 g003
Table 1. Environmental factors of different provenances.
ProvenancesCodeFamilies (Tree Numbers)Altitude/mLongitudeLatitudeFrost-Free Period/d Mean Annual Temperature/°CMean Annual Precipitation (mm)Mean Annual Sunshine Hours/h
WangqingWQ20806129.0543.061253.95802700
LinjiangLJ45338126.5341.491253.0 8751894
HuinanHN30454125.5842.161385.07372296
HongshiHS22756126.5142.341053.77652560
Table 2. ANOVA of different fruit traits among J. mandshurica provenances and families.
TraitsVariance SourcedfMSFTraitsVariance SourcedfMSF
Fruit lengthprovenances3452.35916.888 **Fruit lengthfamilies116566.99866.967 **
Fruit widthprovenances3330.10624.693 **Fruit widthfamilies116270.58756.989 **
Fruit weightprovenances31942.28250.592 **Fruit weightfamilies116892.85784.894 **
Fruit type indexprovenances30.0915.058 **Fruit type indexfamilies1160.31741.693 **
Nut longitudinal diameterprovenances3470.87921.735 **Nut longitudinal diameterfamilies116444.70459.916 **
Nut transverse diameterprovenances3245.21424.986 **Nut transverse diameterfamilies116187.48548.388 **
Nut side diameterprovenances3196.54620.655 **Nut side diameterfamilies116185.56551.707 **
Nut weightprovenances3499.27167.292 **Nut weightfamilies116174.28983.660 **
Three-diameter meanprovenances3290.48234.844 **Three-diameter meanfamilies116179.40967.259 **
Nut roundness indexprovenances30.0010.198Nut roundness indexfamilies1160.11849.700 **
Kernel weightprovenances37.20218.627 **Kernel weightfamilies1167.38649.087 **
Seed yieldprovenances31497.64826.873 **Seed yieldfamilies1161086.64750.935 **
Kernel yieldprovenances3703.73435.164 **Kernel yieldfamilies116321.96931.652 **
Notes: ** significant at the 0.01 level.
Table 3. Genetic variation parameters of fruit traits in J. mandshurica.
TraitsMeanRangeSDGCV/%PCV/%h2
Fruit length/mm53.65 45.25–66.845.21 8.04%9.70%0.985
Fruit width/mm39.88 32.43–49.253.69 7.46%9.25%0.982
Fruit weight/g37.7088 32.7845–54.92436.3276 14.38%16.76%0.988
Fruit type index1.35 1.14–1.680.13 7.51%10.01%0.975
Nut longitudinal diameter/mm43.60 35.07–55.624.70 8.76%10.76%0.983
Nut transverse diameter/mm28.45 22.93–39.443.17 8.70%11.11%0.979
Nut side diameter/mm28.18 22.41–39.293.11 8.74%11.03%0.981
Nut weight/g11.5084 7.1811–19.26702.800920.82%24.30%0.988
Three-diameter mean/mm33.41 28.60–44.092.93 7.27%8.76%0.985
Nut roundness index0.65 0.50–0.820.08 9.50%11.71%0.983
Kernel weight/g2.1138 0.9043–3.58900.6265 23.23%29.59%0.980
Seed yield/%30.95 15.28–55.547.55 19.25%24.36%0.980
Kernel yield/%18.61 11.50–30.254.54 17.32%24.37%0.968
Table 4. Mean values of fruit traits for different J. mandshurica provenances.
TraitsLinjiangHuinanWangqingHongshi
Fruit length/mm54.31 ± 5.0253.03 ± 4.8652.83 ± 5.1853.89 ± 5.87
Fruit width/mm40.21 ± 3.4639.49 ± 3.3139.02 ± 4.0840.53 ± 4.06
Fruit weight/g38.0415 ± 6.122636.2165 ± 5.482136.7753 ± 5.569539.9165 ± 7.6379
Fruit type index1.36 ± 0.121.35 ± 0.161.36 ± 0.131.33 ± 0.12
Nut longitudinal diameter/mm44.08 ± 4.4142.99 ± 4.7942.70 ± 4.5544.27 ± 5.03
Nut transverse diameter/mm28.83 ± 3.1427.93 ± 2.7027.90 ± 3.7628.88 ± 3.01
Nut side diameter/mm28.43 ± 2.9827.81 ± 2.6927.58 ± 3.8528.69 ± 3.03
Nut weight/g11.8353 ± 2.917811.3680 ± 2.291110.2010 ± 2.426412.2172 ± 3.0886
Three-diameter mean/mm33.78 ± 2.8132.91 ± 2.4232.73 ± 3.4533.95 ± 3.06
Nut roundness index0.65 ± 0.070.66 ± 0.090.65 ± 0.080.66 ± 0.08
Kernel weight/g2.1076 ± 0.62342.0613 ± 0.59632.0365 ± 0.60732.2683 ± 0.6642
Seed yield/%31.29 ± 6.6231.80 ± 6.9828.48 ± 8.2931.34 ± 8.82
Kernel yield/%18.07 ± 4.3818.20 ± 4.0020.23 ± 5.4718.81 ± 4.27
Table 5. Correlation analysis among fruit traits in J. mandshurica.
TraitsFruit LengthFruit WidthFruit WeightFruit Type IndexNut Longitudinal DiameterNut Transverse DiameterNut Side DiameterNut WeightThree-Diameter MeanNut Roundness IndexKernel WeightSeed Yield
Fruit width0.469 **
Fruit weight0.466 **0.660 **
Fruit type index0.544 **−0.480 **−0.154 **
Nut longitudinal diameter0.872 **0.355 **0.322 **0.526 **
Nut transverse diameter0.275 **0.411 **0.196 **−0.120 **0.348 **
Nut side diameter0.271 **0.442 **0.216 **−0.156 **0.328 **0.791 **
Nut weight0.402 **0.393 **0.310 **0.0160.478 **0.591 **0.631 **
Three-diameter mean0.661 **0.494 **0.319 **0.182 **0.776 **0.826 **0.814 **0.691 **
Nut roundness index−0.531 **0.067 **−0.100 **−0.594 **−0.585 **0.503 **0.519 **0.134 **0.053 **
Kernel weight0.252 **0.266 **0.205 **−0.0040.345 **0.381 **0.400 **0.616 **0.463 **0.042 *
Seed yield0.095 **−0.025−0.342 **0.103 **0.258 **0.452 **0.475 **0.772 **0.469 **0.196 **0.471 **
Kernel yield−0.083 **−0.067 **−0.045 **−0.010−0.031−0.103 **−0.115 **−0.220 **−0.094 **−0.085 **0.604 **−0.185 **
Notes: ** correlation is significant at the 1% level, and * correlation is significant at the 5% level.
Table 6. Correlation analysis between different fruit traits and environmental factors in J. mandshurica.
TraitsAltitudeLongitudeLatitudeFrost-Free Period Mean Annual TemperatureMean Annual Precipitation Mean Annual Sunshine Hours
Fruit length−0.457−0.408−0.796−0.483−0.7580.889−0.665
Fruit width−0.231−0.557−0.642−0.664−0.5040.798−0.399
Fruit weight0.253−0.14−0.213−0.945−0.5840.4240.037
Fruit type index−0.2450.4840.1290.7270.001−0.325−0.181
Nut longitudinal diameter−0.226−0.445−0.643−0.69−0.6390.795−0.427
Nut transverse diameter−0.199−0.327−0.616−0.71−0.7450.764−0.427
Nut side diameter−0.166−0.469−0.594−0.723−0.5710.759−0.355
Nut weight−0.382−0.772−0.724−0.468−0.2710.849−0.479
Three-diameter mean−0.202−0.419−0.624−0.708−0.6540.779−0.408
Nut roundness index−0.091−0.794−0.185−0.0660.6010.2550.042
Kernel weight0.248−0.333−0.196−0.879−0.3210.4090.098
Seed yield−0.645−0.989 *−0.7790.0260.1470.808−0.602
Kernel yield0.8510.9350.923−0.193−0.002−0.9000.824
Notes: * correlation is significant at the 5% level.
Table 7. Principal component analysis of different fruit traits in J. mandshurica.
Principal Component FactorsComponent ⅠComponent ⅡComponent ⅢComponent Ⅳ
Eigenvalue5.08 2.80 1.91 1.53
Contribution/%39.05 21.51 14.68 11.76
Cumulative contribution/%39.05 60.56 75.24 87.00
Fruit length0.67 −0.66 −0.15 −0.10
Fruit width0.60 0.11 −0.70 0.00
Fruit weight0.43 −0.16 −0.77 0.03
Fruit type index0.09 −0.77 0.50 −0.09
Nut longitudinal diameter0.73 −0.63 0.04 −0.04
Nut transverse diameter0.78 0.40 0.06 −0.09
Nut side diameter0.79 0.43 0.04 −0.09
Nut weight0.84 0.15 0.20 −0.03
Three-diameter mean0.95 −0.04 0.06 −0.09
Nut roundness index0.07 0.95 0.01 −0.06
Kernel weight0.60 0.07 0.15 0.75
Seed yield0.55 0.25 0.69 −0.05
Kernel yield−0.08 −0.07 −0.01 0.96
Table 8. Comprehensive score and ranking of provenances.
Provenances Comprehensive ScoreRanking
Hongshi71.611 1
Linjiang71.071 2
Huinan69.725 3
Wangqing67.904 4
Table 9. Comprehensive score and ranking of elite families.
FamiliesComprehensive ScoreRankingFamiliesComprehensive ScoreRankingFamiliesComprehensive ScoreRankingFamiliesComprehensive ScoreRanking
HS-0886.789 1LJ-1974.364 31HN-2869.653 61WQ-0665.770 91
WQ-0786.311 2LJ-3474.291 32LJ-0269.414 62HN-1165.738 92
LJ-0684.543 3WQ-0373.914 33HS-2169.197 63WQ-1665.688 93
HS-1882.409 4LJ-1473.848 34LJ-3669.126 64LJ-2665.532 94
LJ-1580.384 5HN-2473.747 35LJ-1668.966 65WQ-1865.334 95
HN-2579.670 6HN-3073.453 36HN-2268.915 66LJ-1264.968 96
LJ-2279.201 7LJ-0173.267 37WQ-1768.851 67HN-1664.962 97
LJ-3278.761 8HN-1273.248 38LJ-0768.595 68LJ-4064.532 98
LJ-0578.746 9HN-2373.213 39LJ-3068.568 69HN-2164.186 99
LJ-2178.566 10LJ-4173.085 40HS-1568.068 70LJ-1764.183 100
HS-0178.190 11HN-0972.803 41WQ-0567.870 71HN-0464.113 101
LJ-4477.918 12HN-2072.094 42HS-0467.810 72HN-1863.819 102
HS-1277.605 13HS-0672.017 43LJ-0367.743 73LJ-0963.619 103
LJ-2377.565 14WQ-0471.730 44HS-2267.420 74HN-1563.531 104
LJ-3777.412 15LJ-3171.650 45HS-1467.354 75LJ-3363.348 105
HS-1776.753 16WQ-1271.545 46LJ-4567.347 76LJ-2462.859 106
LJ-1876.726 17HN-0271.239 47LJ-2867.339 77WQ-0862.838 107
HN-1776.603 18HN-0871.088 48WQ-1567.029 78HS-0562.332 108
WQ-0976.517 19HS-1171.054 49LJ-3966.999 79WQ-1461.550 109
HN-1976.500 20HS-0270.840 50HS-1666.921 80LJ-1161.286 110
HN-1076.406 21WQ-1070.823 51WQ-2066.862 81HN-0360.629 111
HN-1476.023 22LJ-3570.821 52WQ-1966.755 82WQ-1160.144 112
LJ-4275.939 23HS-2070.693 53HN-1366.669 83HS-1960.017 113
HS-1375.931 24LJ-2970.455 54HN-0666.427 84WQ-0159.748 114
HS-0375.867 25LJ-2570.420 55LJ-0466.398 85HS-0958.977 115
HN-2975.489 26LJ-0870.274 56LJ-1366.362 86HN-0758.973 116
LJ-4375.215 27LJ-2069.913 57HN-0566.291 87WQ-0258.624 117
LJ-2774.909 28WQ-1369.767 58LJ-1066.200 88
HS-0774.617 29HN-0169.707 59HN-2766.144 89
HS-1074.554 30HN-2669.673 60LJ-3865.839 90
Table 10. Provenance reality gain and family genetic gain.
Elite Provenances and Families
TraitsReality Gain/%TraitsGenetic Gain/%
Fruit length−0.38 Fruit length1.53
Fruit width0.39 Fruit width2.82
Fruit weight2.41 Fruit weight4.59
Fruit type index−0.80 Fruit type index−1.38
Nut longitudinal diameter0.22 Nut longitudinal diameter0.05
Nut transverse diameter0.07 Nut transverse diameter0.06
Nut side diameter0.45 Nut side diameter0.02
Nut weight1.59 Nut weight6.22
Three-diameter mean0.24 Three-diameter mean0.05
Nut roundness index0.13 Nut roundness index0.50
Kernel weight3.67 Kernel weight26.66
Seed yield0.09 Seed yield2.07
Kernel yield2.00 Kernel yield16.51
Disclaimer/Publisher’s Note: The statements, opinions and data contained in all publications are solely those of the individual author(s) and contributor(s) and not of MDPI and/or the editor(s). MDPI and/or the editor(s) disclaim responsibility for any injury to people or property resulting from any ideas, methods, instructions or products referred to in the content.

