Article

Comparative Global Metabolome Profile and Transcriptome Sequence Analysis of the Rough and Smooth Peel of the Orah Mandarin (Citrus reticulata)

Tropical and Subtropical Cash Crops Research Institute, Yunnan Academy of Agricultural Sciences, Baoshan 678000, China
*
Authors to whom correspondence should be addressed.
These authors contributed equally to this work.
Horticulturae 2025, 11(5), 496; https://doi.org/10.3390/horticulturae11050496
Submission received: 24 March 2025 / Revised: 20 April 2025 / Accepted: 27 April 2025 / Published: 4 May 2025

Abstract

:
Background: The Orah mandarin is an economically important variety of Citrus reticulata for citrus growers in Yunnan Province, China. Generally, the fruit peel is smooth, an attractive feature for consumer preferences. Recently, rough peels have been observed in several orchards, making the fruit aesthetically less desirable. Little is known about the mechanism of rough skin development. Methods: In this study, we used global metabolomics and a comparative transcriptomic approach to characterize the differences between smooth (CK) and rough (CP) Orah mandarin peels. Results: Our results indicate that CP fruits have a significantly larger diameter, peel weight and thickness, total soluble solids, and titratable acid content compared to CK. Metabolomic analysis detected 810 metabolites, of which 192 were differentially accumulated in CP and CK. CP is characterized by higher levels of flavonoids, amino acids and derivatives, terpenoids, and alkaloids. We also report nine compounds detected exclusively in CP, including dambonitol, 3-methyl-L-histidine, deacetylnomilinic acid, obacunoic acid, and 6-O-acetylarbutin. The transcriptome results showed that the expression of genes enriched in flavonoids, lipid, and amino acid metabolism and related pathways were consistent with the metabolome profiles. We also discuss the possible involvement of phytohormones in peel roughening. Conclusions: Overall, we present, for the first time, a detailed comparative metabolome and transcriptome profile in smooth and rough Orah mandarin peels. Our data and discussion highlight the potential mechanisms and provide a theoretical basis for the improvement of rough peel Orah mandarins.

1. Introduction

The Orah mandarin (Citrus reticulata var. Orah) is a very famous citrus variety and belongs to the family of late-maturing broad-skinned citrus fruits [1]. Its main characteristics, such as high sugar content, good fruit quality, high yield, suitability for storage and transportation, tolerance to various stresses, and easy cultivation, have expanded its cultivation in many regions of China [2]. The appearance of mandarin fruit peel is one of the most important characteristics from the point of view of aesthetics and consumer preference. Recently, some variations in Orah mandarin fruit peel have been observed, such as multiple seeds, a rough surface, and uneven fruit size [3]. We also observed variations in peel appearance in some orchards in Yunnan Province of China, such that some fruits have smooth peels while others have rough peels.
Most research on Citrus fruits has focused on the intrinsic quality rather than the extrinsic quality. Particularly, the research in mandarins has focused on the biochemical and molecular basis of pigmentation of peel development [4] and peel senescence [5]. However, no study has been dedicated to understanding the differences at both transcriptomic and metabolomic levels between smooth and rough mandarin peels. Such studies are essential to deepen our understanding and elucidate the molecular mechanisms of peel roughening. A recent study indicated that climatic factors may contribute to the quality of Orah mandarin fruit [3]. Furthermore, if the fruit grows under the same environmental conditions, it is not known what other transcriptomic or metabolomic differences exist in smooth and rough peels. Similar phenotypic observations, known as peel roughening disorder, have been made in the Sasuta mandarin. In the case of Shamouti oranges, rapid growth during fruit development was reported to be an important factor for peel roughening disorder [6]. Research conducted almost five decades ago on Shamouti oranges indicated that during the young fruitlet stage, the higher gibberellin-like and cytokinin-like activities were potential reasons for such peel roughness. In addition, higher levels of cytokinins and gibberellins (GAs) were found in rough peels at later stages of fruit growth [7]. This was also confirmed by the observation that peel roughness was induced after exogenous application of GA3 during early fruit development in Citrus tankan Hayata [8]. Likewise, other studies indicated that bearing angle and branch basal shoot (spring, leafy, and relatively shorter shoot) are important factors that are associated with peel roughness [9,10]. Recently, two studies have reported the molecular-level results related to peel roughness in Citrus unshiu Marc [11]. and Citrus limon L. [12]. The study on C. unshiu reported that several transcription factors, i.e., bHLH, which are involved in GA metabolism, were differentially expressed. At the metabolome level, carbohydrates, organic acids, amino acids and derivatives, alcohols, and amines were key differential metabolite classes in the developing fruits [11]. The key KEGG pathways that were differentially regulated during the roughness development in C. unshiu were terpenoids, flavonoids, amino acids, and lipid metabolism-related pathways [11]. In the study on C. limon, in addition to the above-mentioned pathways, MAPK signaling, plant hormone signaling, phenylpropanoid biosynthesis, and ribosome pathways were examined. Additionally, asymmetric cell division and cell-wall biosynthesis-related gene expression were also associated with peel roughness [12].
To date, there have been no reports on the development of the rough skin of Orah mandarin fruits. Considering that Orah mandarins are an important citrus fruit in Yunnan, as well as other areas of China, it is important to explore the key differences in rough and smooth peels to inform citrus breeders. Here, we explored the combined metabolomics and transcriptomics approach to highlight the key metabolomic and transcriptomic differences in smooth and rough peels of Orah mandarin. Through this research, we provide a detailed list of potential pathways, genes, and metabolites that are differentially regulated in smooth and rough Orah mandarin peels. Our study provides a theoretical basis for improving the appearance quality and breeding of Orah mandarin fruit.

2. Materials and Methods

2.1. Plant Material

The experiment was conducted in Ruili City, Dehong Prefecture, Yunnan Academy of Agricultural Sciences Tropical and Subtropical Economic Crop Research Institute, China, from 2023 to 2024. The experimental citrus variety was the Orah mandarin (Citrus reticulata). The virus-free seedlings were grafted for 10 months. The plants were grown in soil with a pH of 5.89 and 2.47% organic matter. The available nitrogen, phosphorus, and potassium were 112.00 mg kg−1, 89.37 mg kg−1, and 196.69 mg kg−1, respectively. Effective calcium, magnesium, copper, zinc, iron, and manganese were 1516.18 mg kg−1, 105.61 mg kg−1, 1.48 mg kg−1, 3.14 mg kg−1, 85.17 mg kg−1, and 12.79 mg kg−1, respectively. The average soil bulk density was 1.71 g cm−3, and the maximum field water holding capacity was 27.75%. The growing region belongs to the South Asian tropical monsoon climate type, with an average annual temperature of 18.4–21.0 °C. The highest and lowest temperatures are 38.8 °C and −2.1 °C, respectively. The annual sunshine duration is 2281–2453 h. The annual rainfall is 1400–1700 mm.
The samples of both the rough (CP) and smooth (CK) fruits were collected as follows. The fruits were harvested on 19 March 2024. From each of the 13 areas in the base orchard, five plants bearing both types of fruits i.e., those with rough skin and those with smooth skin. The selection of 13 locations was done to ensure that minimal environmental differences exist. Nine rough-skinned fruits were picked from each of the lower and top parts of each of the selected five fruit trees and stored in a sampling bag. The fruits from the lower and upper parts of the trees were kept separate. Similarly, five trees with smooth fruits were selected from the 13 areas of the base orchard. We picked nine smooth fruits by following the same strategy as done for CP. Then, we randomly selected five peels for each peel type, i.e., smooth (CK) and rough (CP), with white skin layer (flavedo and albedo), from the fruits in the lower and top parts and stored them in a liquid nitrogen tank. The sampling from the top and lower parts of the sampling trees was collected in order to reduce light gradient effects, uneven nutrient allocation, reduce sampling errors, and comply with agricultural standards. After returning to the laboratory, the peels were stored in a −80 °C refrigerator. The peels were selected randomly (from those collected from the upper and lower parts of the trees). The remaining fruits were used as measurements of physiological indicators such as fruit weight, longitudinal/transverse diameter, soluble sugar, and titratable acid. The total soluble solids (TSS) and titratable acidity were determined using a digital acidity meter (Pocket PAL-BXIACID1, ATAGO, Tokyo, Japan).

2.2. Metabolome Profiling

2.2.1. Sample Preparation and Extraction

Freeze-dried samples were crushed in a mixer mill (MM 400, Retsch GmbH, Haan, North Rhine-Westphalia, Germany) with a zirconia bead for 1.5 min at 30 Hz. Then, 1.2 mL 70% methanol solution was added to 100 mg of the powder, mixed by vortexing for 30 s (six times) after every half hour, and stored at 4 °C overnight. The next morning, the mixture was centrifuged at 12,000 rpm for 10 min, followed by filtration through a 0.22 μm microfilter (SCAA-104, ANPEL, Shanghai, China, http://www.anpel.com.cn/; accessed on 2 May 2025). The filtrate was then analyzed by UPLC-MS/MS.

2.2.2. UPLC Conditions and ESI-Q TRAP-MS/MS Analysis

A UPLC-ESI-MS/MS system (UPLC, SHIMADZU Nexera X2, Shanghai, China, https://www.shimadzu.com/; accessed on 2 May 2025; MS, Applied Biosystems 4500 Q TRAP, https://sciex.com/; accessed on 2 May 2025) was used for the analysis. The analysis was performed as follows. UPLC: column, Agilent SB-C18 (1.8 μm, 2.1 mm × 100 mm); mobile phase, solvent A: pure water with 0.1% formic acid, and solvent B: acetonitrile with 0.1% formic acid. Samples were measured with a gradient program; starting conditions were 95% A and 5% B. Within 9 min, a linear gradient to 5% A, 95% B was programmed, and a composition of 5% A, 95% B was kept for 1 min. Later, a composition of 95% A, 5.0% B was adjusted within 1.10 min and kept for 2.9 min. The flow velocity, column temperature, and injection volume were 0.35 mL per minute, 40 °C, and 4 μL, respectively. The effluent was alternatively connected to an ESI-triple quadrupole-linear ion trap (QTRAP)-MS.
Linear ion trap and triple quadrupole scans were acquired on a triple quadrupole-linear ion trap mass spectrometer (Q TRAP), AB4500 Q TRAP UPLC/MS/MS system (AB SCIEX, Framingham, MA, USA) equipped with an ESI Turbo Ion-Spray interface (AB SCIEX, Framingham, MA, USA), operating in positive and negative ion mode and controlled by Analyst 1.6.3 software (AB Sciex). The operation parameters of the ESI source were as follows: ion source, turbo spray; source temperature 550 °C; ion spray voltage 5500 V (positive ion mode)/−4500 V (negative ion mode); ion source gas I, gas II, curtain gas was set at 50, 60, and 25.0 psi, respectively; the collision-activated dissociation was high. Instrument tuning and mass calibration were performed with 10 and 100 μmol/L polypropylene glycol solutions in QQQ and LIT modes, respectively. QQQ scans were acquired as MRM experiments with collision gas (nitrogen) set to medium. Declustering potential and collision energy for individual multiple reaction monitoring transitions was done with further DP and CE optimization. A specific set of multiple reaction monitoring transitions was monitored for each period according to the metabolites eluted within that time period.

2.2.3. Metabolome Data Analysis

The data were unit variance scaled, and an unsupervised principal component analysis (PCA) was performed using the prcomp function in R (R version 4.4.3, www.r-project.org). Hierarchical cluster analysis (HCA) and Pearson correlation coefficients (PCC) were calculated in R. Significantly differentially accumulated metabolites (DAMs) between samples were determined by variable importance projection (VIP) ≥ 1 and absolute Log2FC (fold change) ≥ 1. The identified metabolites were annotated using the KEGG Compound database (16 February 2025, http://www.kegg.jp/kegg/compound/) and then mapped to the KEGG Pathway database (16 February 2025, http://www.kegg.jp/kegg/pathway.html). The pathways to which DAMs were mapped were then fed into the metabolite sets enrichment analysis, and their significance was determined by the hypergeometric test’s p-values.

2.3. Transcriptome Sequencing

The RNA was extracted from the frozen samples, and only high-quality RNA was used for further processing. For library preparation, mRNAs were separated and fragmented using NEB fragmentation buffer (New England Biolabs, Ipswich, MA, USA), and libraries were constructed according to the standard instructions for the NEBNext Ultra library preparation kit (New England Biolabs, Ipswich, MA, USA). Libraries were quantified using a Qubit 2.0 fluorometer (ThermoFisher Scientific, Shanghai, China), and the insert size was determined using an Agilent 2100 bioanalyzer (Agilent Technologies Inc., Santa Clara, CA, USA). Finally, the effective concentration of the libraries was quantified using qRT-PCR. The libraries were then sequenced on an Illumina Novaseq 6000 platform.
The raw sequencing data were filtered using SOAPnuke (v2.1.0) [13] to obtain clean reads. The clean reads after quality control were then aligned to the reference genome (C. reticulata; https://www.citrusgenomedb.org/organism/Citrus/reticulata; accessed on 21 January 2025) by using HISAT2 [14]. Bowtie2 was then used to align the quality-controlled sequences to the reference transcript sequences [15]. RSEM [16] was used to obtain Fragments Per Kilobase per Million bases (FPKM). The genes were then annotated in GO [17], KEGG [18], NR [19], KOG [20], and Swiss-Prot [21]. PCA and PCC, based on the FPKM of all samples, were measured in R. DESeq2, which was used to obtain the differentially expressed genes (DEGs) [22]. The DEGs were then screened on the bases of FDR < 0.05, log2FC > 1, or log2FC < −1. The DEGs were then enriched onto KEGG pathways [23]. The differentially expressed transcription factors (TFs) were annotated in PlantTFDB [24].

3. Results

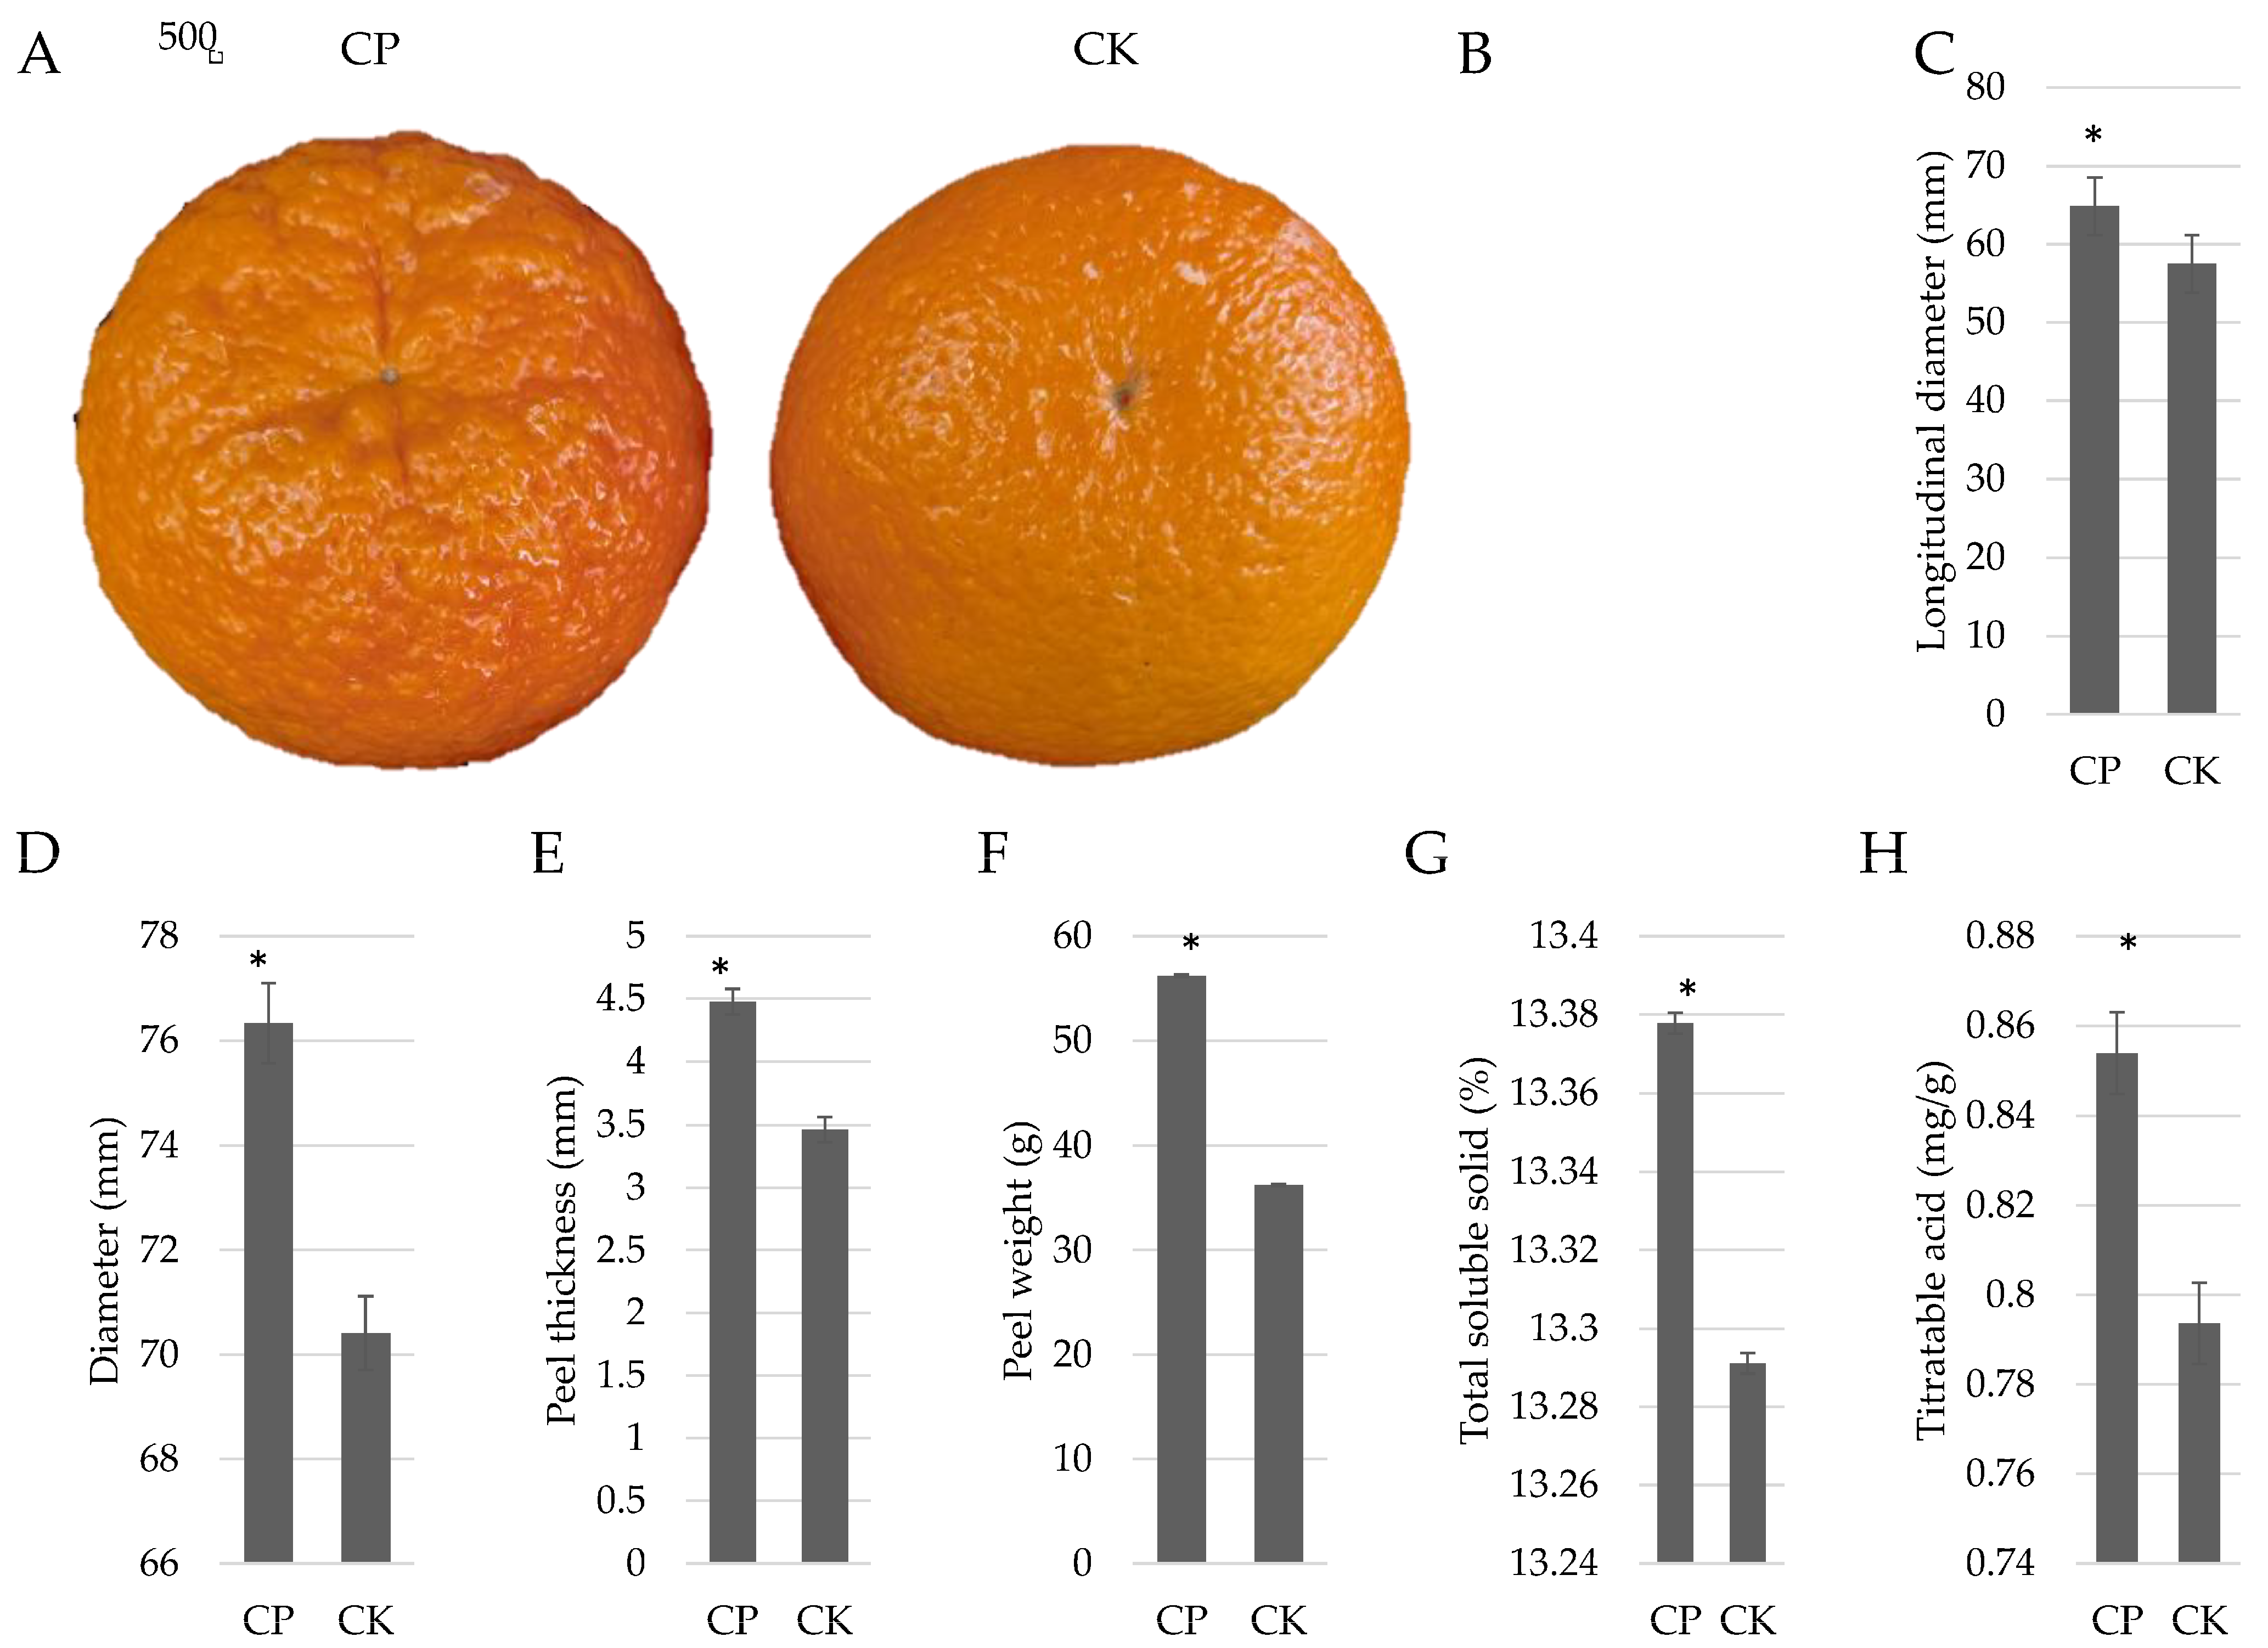
3.1. Physiological Indicators of Orah Mandarin

Visually, the fruit peels of the CP Orah mandarin differ from those of CK (Figure 1A), with the former having a rough peel and the latter having a smooth peel. Overall, the CP fruits had a significantly larger diameter and higher peel weight and thickness compared to the CK fruits (Figure 1B–F). The TSS and titratable acid contents were also significantly higher in CP over CK (Figure 1G,H). These factors indicate that CP fruits have good market potential. However, their rough skin makes them less desirable in terms of consumer preferences. Therefore, to further identify key differences in the gene expression and metabolite accumulation in both peel types, we used Illumina sequencing and global metabolomic profiling by UPLC-MS/MS, respectively.

3.2. Global Metabolome Profiles of CP and CK Orah Mandarin Peels

The UPLC-MS/MS-based CP and CK analysis identified a total of 810 compounds belonging to more than 10 classes (Figure 2A). The highest number of compounds belonged to flavonoids (235), followed by lipids (115), phenolic acids (106), and others (Figure 2B). To explore the quantitative differences in all the metabolites within each compound class, we summed the relative metabolite intensities. CP peels exhibited higher alkaloids, amino acids and derivatives, flavonoids, and terpenoids compared to CK. The remaining compound classes were present at higher levels in CK. (Figure 2C). These results are consistent with previous reports in other species, e.g., Citrus unshiu’s rough peels were different from smooth peels for sugars, organic acids, amino acids, and derivatives [11]. Principal component analysis based on the relative metabolite intensities showed that PC1 and PC2 explained 50.68% and 14.65% of the variability, respectively (Figure 2D). Consistently, the OPLS-DA models also showed similar results (Figure 2E). Additionally, within and between the peel types, the PCC was higher than 0.89, indicating the reliability of the sampling and data (Figure 2F).
Furthermore, we screened the metabolites based on the stringent criteria, i.e., VIP ≥ 1 and absolute Log2FC (fold change) ≥ 1, which resulted in 192 metabolites, with 111 up- and 81 down-accumulated in CP compared to CK (Figure 3A,B; Table S1). The most highly accumulated compounds in smooth peels, i.e., CK, were 4-hydroxybenzaldehyde, 8-methoxypsoralen, 3-hydroxybenzoic acid, p-coumaryl alcohol, and apigenin-7-O-glucoside-4′-O-rutinoside. Contrarily, CP peels exclusively accumulated nine compounds, including dambonitol, 3-methyl-L-histidine, deacetylnomilinic acid, obacunoic acid, and 6-O-acetylarbutin (Figure 3C). A general trend in the comparative differential metabolite class accumulation was that alkaloids, amino acids and derivatives, flavonoids, organic acids, and terpenoids were mostly higher in CP than CK. We found that the CK generally exhibited higher relative contents of lignans and coumarins, lipids, nucleotides and derivatives, vitamins B and C, pyridoxine, pyridoxal, and several phenolic acids (Table S1). This observation is consistent with an earlier study on Citrus lemon L. Burm. F., where fatty acids and conjugates, lignans and coumarins, and several amino acids were found to be higher in smooth-skinned C. lemon peels [12]. The DAMs were significantly enriched in a large number of pathways (192 KEGG pathways). The pathways in which the DAMs were highly significantly enriched include amino acid, lipid, vitamin, flavonoid (and isoflavonoid)-related pathways (Figure 3D). These enrichment results further indicate that the rough and smooth peels differ in the compound classes indicated above.
Of the nine alkaloids, seven had higher relative metabolite intensities in CP. Piperidine had the highest content in CP (2.11-fold) compared to CK. Two alkaloids, i.e., phenylethanolamine and 7,8-dimethoxyplatydesmine, had higher relative metabolite intensities in CK (Table S1).
There were 22 amino acids and derivatives that were differentially accumulated in the two peels. Except for L-tyramine and L-leucyl-L-leucine, all other metabolites of this class were present at higher levels in CP (Table S1).
Among compounds classified as flavonoids, the UPLC-MS/MS detected several dihydroflavones, flavonoid carbonosides, and flavonols. Interestingly, CK had higher dihydroflavone than CP, together with some flavonoids, e.g., apigenin-7-O-glucoside-4′-O-rutinoside, luteolin-7,3′-di-O-glucoside, etc. All flavonols and flavonoid carbonosides were mostly in higher quantities in CP than in CK (Table S1).
An interesting observation in our study was that most of the detected differentially accumulated coumarins were present in higher quantities in CK, with 7-methoxycoumarin and auraptene being the most accumulated, whereas the only lignan detected, i.e., syringaresinol-4′-O-(6″-acetyl)glucoside, was 3.90-fold higher in CP than in CK (Table S1).
Four subclasses of lipids were differentially accumulated, i.e., free fatty acids, LPC, LPE, glycerol esters, and PC. Most free fatty acids were more abundant in CK (Table S1).
Among nucleotides and derivatives, adenosine, 2-aminopurine, and adenine, together with three others, were present in higher quantities in CK. In contrast, four nucleotide derivatives, i.e., 2-deoxyribose-1-phosphate, 6-methylmercaptopurine, 2-deoxyribose-5′-phosphate, and 1-methylguanidine, had relatively higher levels in CK (Table S1).
Ten of the sixteen organic acids were more abundant in CP, with γ-aminobutyric acid and 6-aminocaproic acid having higher relative metabolite intensities (Table S1).
Like other classes, saccharides and alcohols were also more accumulated in CP than in CK, except for D-galataric acid, D-saccharic acid, D-glucurono-6,3-lactone, and D-(-)-threose, whereas CK was rich in vitamins and terpenoids such that CP had lower content of all detected vitamins and terpenoids (except 2-hydroxyoleanolic acid) (Table S1).
Most phenolic acids (18 out of 29) were higher in CK; notably, feruloylmalic acid had the highest content among all. Other key observations were the higher accumulation of salicin, salicylic acid-2-O-glucoside, and 4-O-sinapoylquinic acid in the rough peel types (Table S1).
Although our results did not show differential detection of phytohormones, we observed that CP had higher 4-aminosalicylic acid, 1-O-salicyl-D-glucose, and salicylic acid-2-O-glucoside, while CK had higher jasmonic acid (JA) and abscisic acid (ABA). In addition, adenine, a product of trans-zeatin degradation, was higher in CK than in CP. Similarly, higher terpenoid content in CP could hint towards more resources being directed toward GA biosynthesis (Figure S1).
Overall, the comparative metabolomic profile of CP and CK highlights differences in key compound classes, differential metabolites, and the pathways to which the DAMs are enriched. The smooth peels exhibit higher levels of vitamins, terpenoids, coumarins, dihydroflavones, and some nucleotides, whereas the rough peel was characterized by higher flavonoid (flavonoids, flavonols, and flavonoid carbonosides), nucleotides and derivatives, organic acids, saccharides, and alcohols. To further elaborate on the differences, we analyzed the comparative transcriptome profiles of the CP and CK peels.

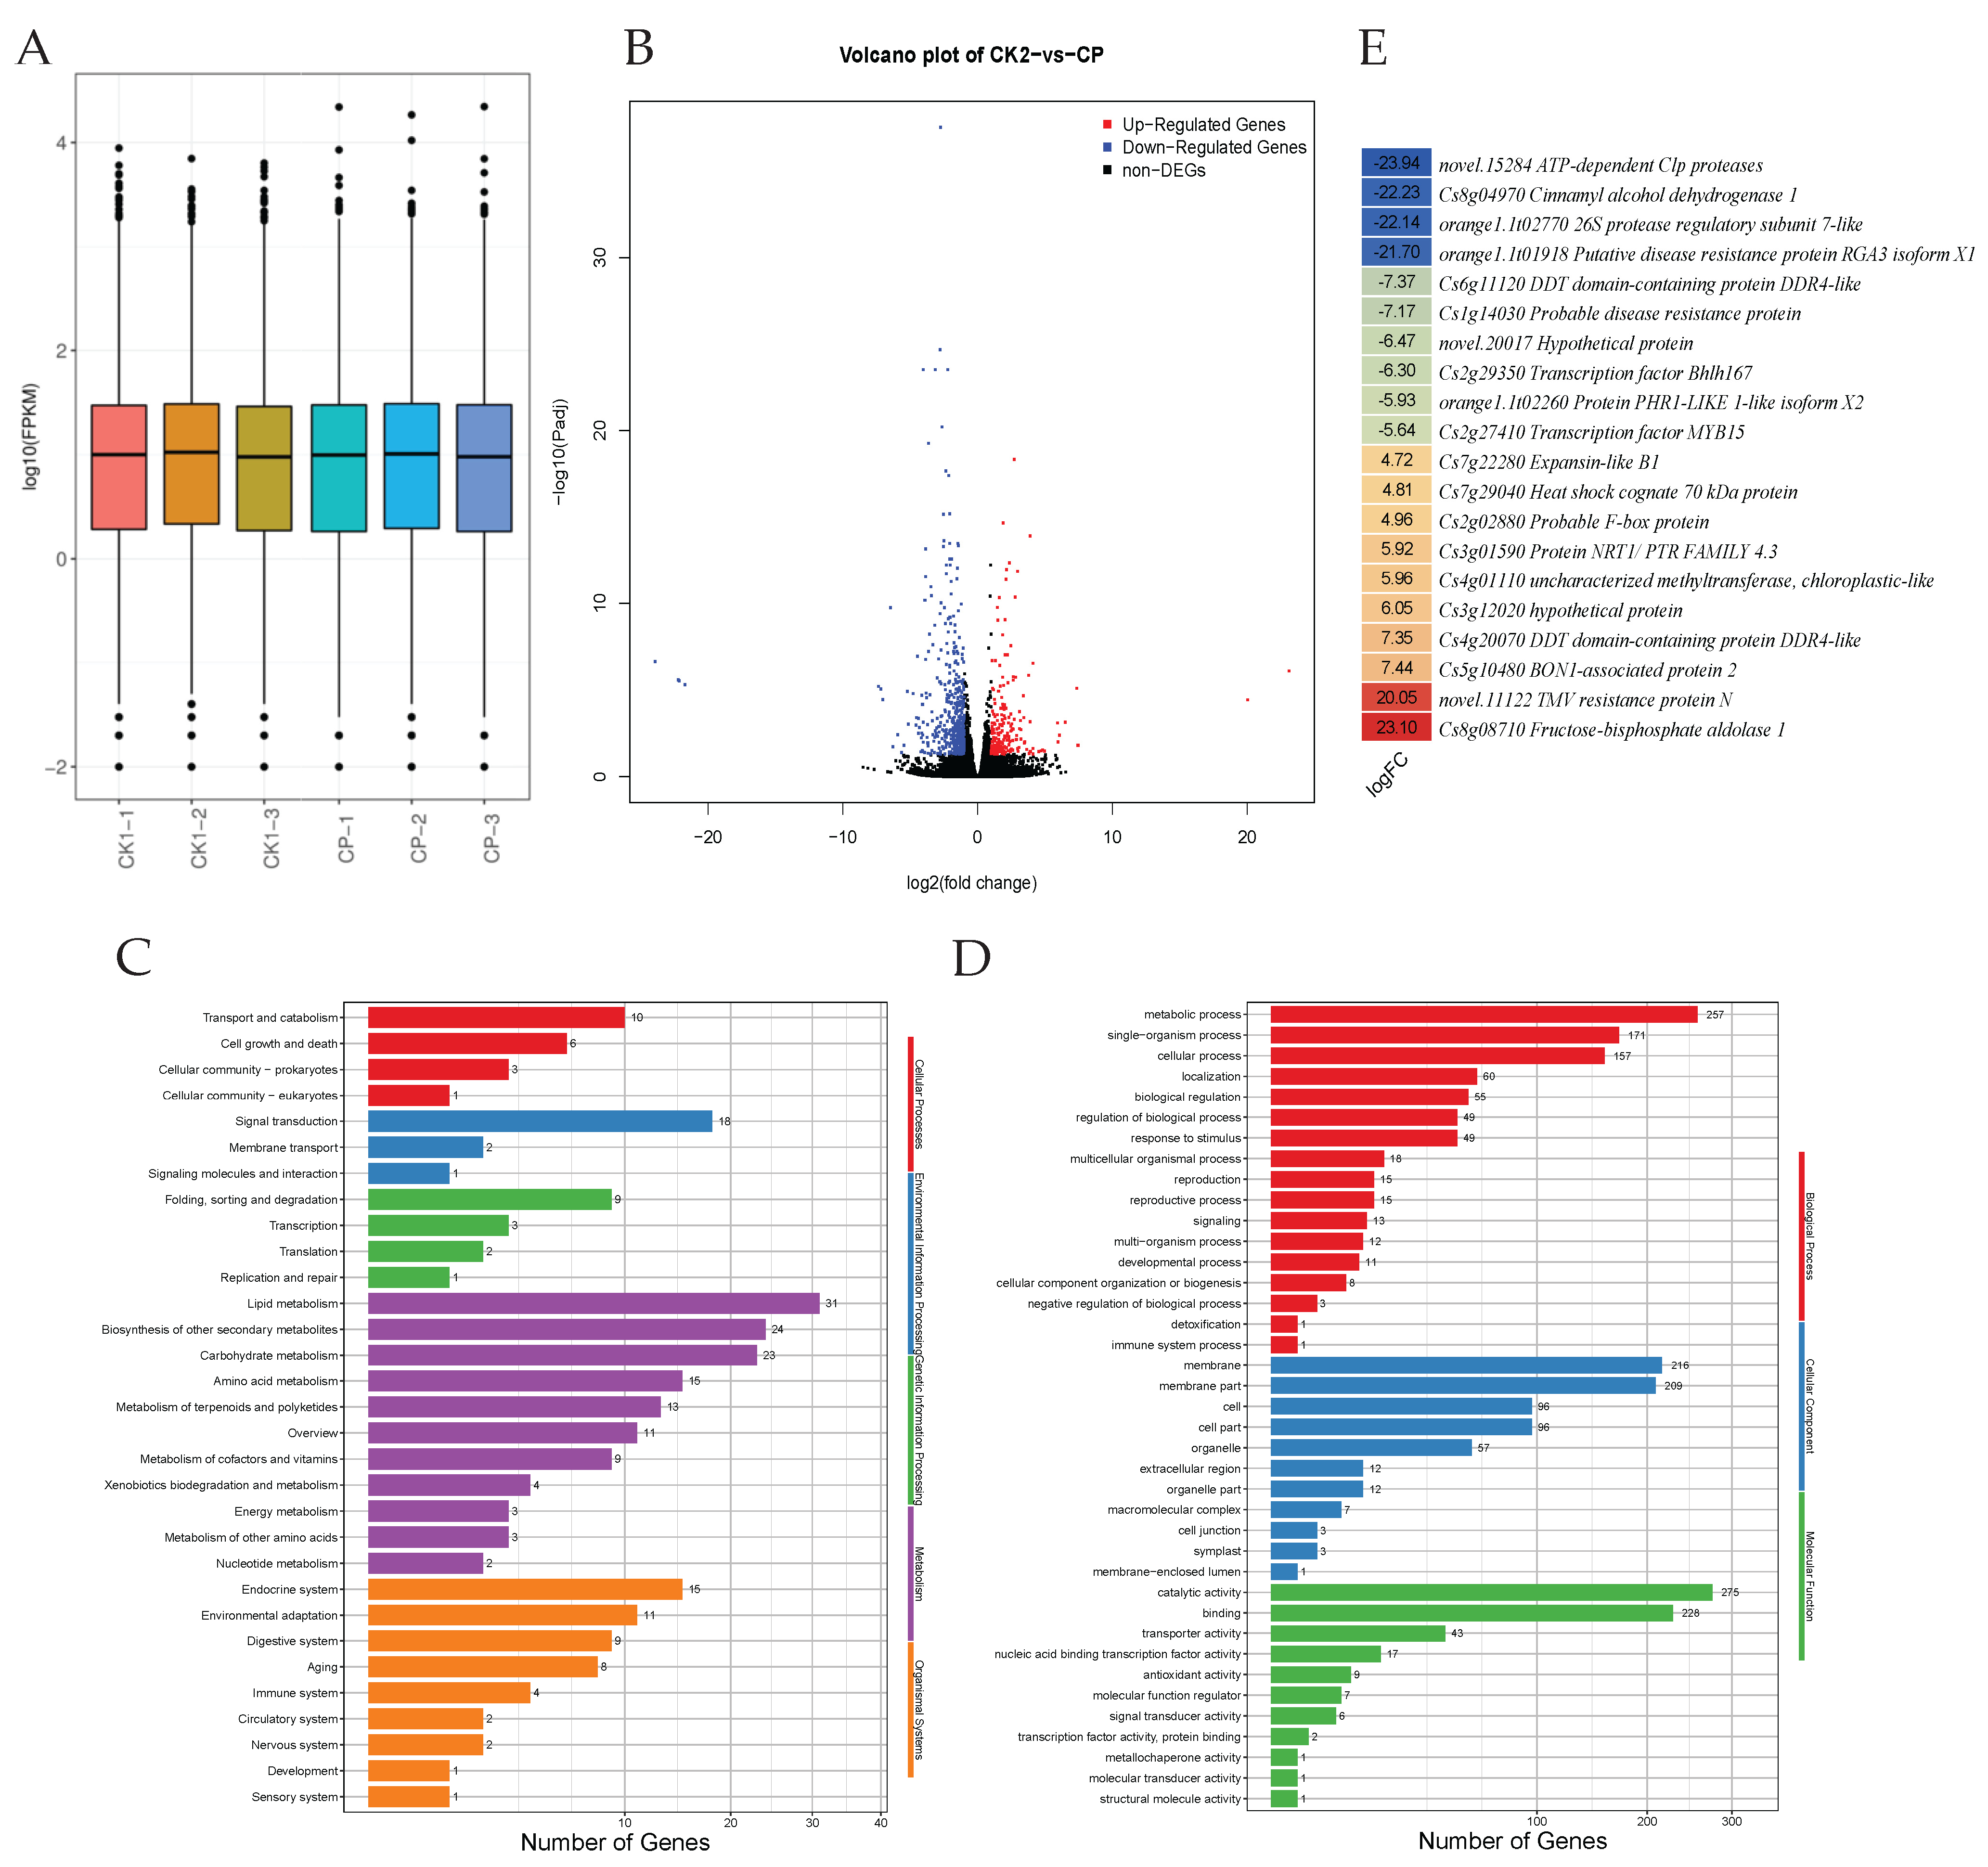
3.3. Comparative Transcriptome Profiles of Smooth and Rough Orah Mandarin Peels

The transcriptome sequencing of six libraries yielded a total of 125,443,455 clean base pairs with a Q20, Q30, and GC% of >97.4, >92.5, and >42.9%, respectively. The average number of clean read pairs for the six libraries was 20,907,243 (Table S2A). Overall gene expression density is given in Figure 4A. The PCC between the CK and CP was greater than 0.94 (Table S2B), indicating that the sampling of replicates for transcriptome analysis was reliable.
A total of 23,197 genes were expressed in the two treatments. Based on the filtering criteria, a total of 639 DEGs were identified, with 201 up- and 438 down-regulated in CP compared to CK (Figure 4B; Table S3). Among the DEGs, 589 were known, and the remaining were novel. The DEGs were mostly classified into transport and catabolism (cellular process), lipid metabolism (metabolism), folding, sorting, degradation and transcription (genetic information processing), and environmental adaptation (organismal system), as per KEGG annotation (Figure 4C), whereas the higher number of DEGs were classified in metabolic process (biological process), membrane (cellular process), and catalytic activity (molecular function), according to GO annotation (Figure 4D). Among the DEGs, novel.15284 (ATP-dependent Clp protease ATP-binding subunit ClpB with a Log2FC of −23.49) was the top down-regulated gene in CP compared to CK. The other top down-regulated genes include Cs8g04970 (cinnamyl alcohol dehydrogenase), orange1.1t02770 (26S proteasome regulatory subunit T1), orange1.1t01918 (putative disease resistance protein RGA1), and Cs6g11120 (DDR domain-containing protein DDR4-like). Contrarily, the top up-regulated genes in CP compared to CK were Cs8g08710 (fructose-bisphosphate aldolase, class I), novel.11122 (TMV resistance protein N), Cs5g10480 (BON1-associated protein 2), Cs4g20070 (zinc finger FYVE domain-containing protein 26), and Cs3g12020 (superoxide dismutase, Cu-Zn family) (Figure 4E). These gene expression differences indicate the involvement of multiple pathways in the observed phenotypes. The 639 DEGs were enriched in 140 KEGG pathways. The top pathways to which the DEGs were significantly enriched included MAPK signaling—plant, glycerophospholipid metabolism, peroxisome, fatty acid metabolism, valine, leucine and isoleucine degradation (as well as biosynthesis), pantothenate and CoA biosynthesis, butanone metabolism, alpha-linolenic acid metabolism, fatty acid biosynthesis (as well as elongation), galactose metabolism, phenylpropanoid biosynthesis, and cutin, suberin, and wax biosynthesis (Table S4).
To further validate and correlate the metabolome-based differences observed in CP and CK peels, below we have specifically explored the gene expression related to the lipids, sugars, amino acids, flavonoids, terpenoids, and other important pathways. Moreover, we present the key changes in genes enriched in plant hormones as well as MAPK signaling pathways.
Twenty-two DEGs annotated as 12 genes were enriched in phenylpropanoid biosynthesis and flavonoid biosynthesis. Those enriched in flavonoid biosynthesis had higher expression in CK, e.g., chalcone synthase, flavonol synthase, and shikimate O-hydroxycinnamoyltransferase. The higher expression of these genes is consistent with the higher naringenin, vitexin, hesperetin, eriodictyol, and homoeriodictyol in CK. This could be because all the genes enriched in the phenylpropanoid biosynthesis pathway (upstream of the flavonoid biosynthesis pathway) had a higher expression in CK than CP (Tables S3 and S4).
Thirty-three DEGs annotated as 11 genes were enriched in nine pathways related to amino acid metabolism. Notable observation in valine, leucine, and isoleucine biosynthesis pathway was the higher expression of two branched-chain amino acid aminotransferases (Cs3g16430 and Cs3g16440), 1-aminocyclopropane-1-carboxylate synthase (Cs4g13870), and alcohol dehydrogenase (Cs3g20800) in CP. However, another branched-chain amino acid aminotransferase had higher expression in CK. Also, an acetolactate synthase I/III small subunit had higher expression in CK than in CP. This gene is involved in the final steps leading to ethylene biosynthesis. These observations indicate that in CK, amino acid biosynthesis, e.g., other genes that might affect the expression of genes in amino acid biosynthesis, could be playing roles (Tables S3 and S4).
Thirty-one DEGs were annotated as 22 genes and were enriched in 14 lipid metabolism-related pathways; 28 had higher expressions in CK, which is consistent with the observed higher lipid contents in the smooth peels. The key genes that had higher expressions in CK include 3-ketoacyl-CoA synthase (KCS), glycerol-3-phosphate acyltransferase (GPAT), hydroxymethylglutaryl-CoA-synthase (HMGCS), etc. The notable pathways to which these DEGs were enriched include fatty acid biosynthesis, fatty acid elongation, glycerophospholipid metabolism, biosynthesis of unsaturated fatty acids, cutin, suberine, and wax biosynthesis, etc. Therefore, it is possible that the differential expression of genes in these pathways is responsible for the observed higher lipid contents in CK over CP (Tables S3 and S4).
In terms of signaling-related pathways, we observed expression differences in MAPK signaling as well as plant hormone signaling pathways. Three out of four DEGs enriched in the MAPK signaling pathway, i.e., two respiratory burst oxidases and one ethylene receptor, had higher expression in CP than CK, whereas four DEGs enriched in the plant hormone signaling pathway, i.e., two jasmonate ZIM domain-containing proteins and two protein phosphatase 2Cs, had higher expression in CK than CP. These observations suggest possible roles of phytohormones such as ethylene and JA (Tables S3 and S4).
Overall, the comparison of the differential gene expression between CK and CP indicates that the former has a higher expression of a relatively larger number of genes. Similarly, the gene expression related to several metabolite classes, i.e., flavonoids, lipids, amino acids, etc., shows consistent results. These genes are valuable targets for understanding the differences in peel smoothness/roughness. Further experiments should explore the two variants of the Orah mandarin from the perspective of observing the changes in gene expression as well as metabolome from their fruit development.

4. Discussion

Orah mandarin is one of the most famous citrus varieties in China, particularly in Yunnan Province. With an increasing export volume, it has been playing an important role in improving Chinese growers’ livelihood (https://www.nanning.gov.cn/english/topNewsInfo/topNews/t6261492.html; accessed on 20 February 2025). The competitiveness of the fruit in the market is affected by a range of factors. The first and foremost factor, directly associated with the consumer preference, is the fruit’s appearance, including peel color, smoothness (or roughness), and size [25]. In this regard, researchers have been working in several directions, such as understanding the mechanism by which bagging can affect the peel pigmentation of Orah mandarin [25]. Some researchers have classified the Orah mandarins based on their geographical location in association with the degrees of variation in fruit development [3]. However, a common observation that fruits on some Orah mandarin trees exhibit rough peels rather than smooth peels concerns the growers. Fruits with rough peels are not preferred by consumers, even if the fruit has a better nutritional profile, as observed in our findings from morphological as well as biochemical analyses (Figure 1). To understand the key differences between rough and smooth peels of Orah mandarin in terms of expressed genes and accumulated metabolites, here, we applied transcriptome sequencing and a metabolomics approach. Below, we discuss the key observed differences in this regard and provide preliminary but detailed data on the further exploration of potential rough peel development mechanisms. This data is valuable for providing a theoretical basis for the improvement of mandarin fruits with rough peels for increasing their market acceptability.
Although scarce, earlier research on Citrus species has shown that peel roughening is a complex process. It is influenced by soil, air humidity, type of rootstock, low fruit load, off-crop, bearing angle, growth conditions of the bearing basal shoot, etc. [7]. At the cellular level, an increase in cell layer as well as diameter after full bloom has been reported in C. unshiu [9]. Recent research on this species has also indicated that rough peels are characterized by lower oil cell density, clearly shaped parenchymatic cells, and relatively higher intercellular spaces, while the smooth peels exhibit a thicker cell arrangement. The oil cells in rough fruits were mostly non-uniform in size, and their inner walls were rough [11]. Another key factor is the level of phytohormones, including GAs, cytokinins, and brassinosteroids, etc. [7]. Our results that CK had higher ABA hint at a possible role (Figure S1) since this hormone has been previously implicated in fruit load [26], a key factor in roughness development. Jasmonic acid has been implicated in cracking-susceptible fruit cultivars, e.g., litchi [27], where hormone balance contributes to fruit cracking. Since fruit cracking is an uncoordinated cell growth [28], and because the rough citrus fruits also have non-uniform cell layers in them, a possible relationship between JA and peel roughening could not be ignored [11]. This proposition is further strengthened by the observed expression changes in JA-signaling related genes, i.e., jasmonate ZIM domain-containing proteins and protein phosphatase 2Cs, which are key co-receptors of JA [29]. Moreover, higher terpenoid content in CP is somewhat related to GA content, though no GAs were detected. Earlier research has indicated that GA promotes roughness, and the fact that GA is biosynthesized as a part of the terpenoid biosynthesis pathway [30] suggests potential involvement of GAs. Based on these observations, our results also hint towards the potential role of GA, JA, ABA, and CKs in the roughness of Orah mandarin peels. Detailed studies involving endogenous phytohormone level determination, exogenous application, and microscopy will further confirm our preliminary observations based on transcriptome sequencing. Similarly, characterization of the enlisted genes and their manipulation in mandarin can further elaborate their putative roles in peel roughening.
Most of the research in this direction was conducted decades ago. However, recent developments in omics technologies such as metabolomics and transcriptomics are enabling researchers to broaden our understanding of the molecular mechanisms of plant traits [31]. In this regard, the accumulated metabolites can direct researchers to the putative compounds and related pathways, such as the fact that the rough peel of C. unshiu has been characterized by the presence of higher quantities of amino acids and derivatives, beta-homoserine and glutamine, and others [11,32]. This trend has been observed in other citrus species such as C. limon [12]. Our results also present similar conclusions. These results, together with the differential regulation of the 11 amino acid biosynthesis genes and the earlier findings [12], indicate an increased amino acid and derivative content in rough peels. The key functions of these amino acids towards the development of the roughness in peels are yet unclear. However, our data provides nine exclusively detected compounds in CP (Figure 3C). Among these, deacetylnomillinic acid is a key intermediate in limonin biosynthesis [33]. Together with higher limonin contents, it suggests a phytotoxic effect in CP. Limonin has been shown to exhibit phytotoxic effects in cabbage and carrot [34]. The question of whether the exclusive presence of limonoids (deacetylnomillinic acid, limonin, and obacunoic acid) is associated with peel roughness is an interesting future topic. These compounds have already been identified in citrus seeds [35]. Other compound classes, such as flavonoids, organic acids, and terpenoids, were present in higher quantities in rough peels, an observation consistent with earlier research [11,12,32]. Flavonoids might influence plant growth regulators, e.g., GA [36], and, ultimately, phytohormone signaling [37]. It is possible that there is a relationship between flavonoids, GA, and rapid growth during the peel’s texture development. It is known that rapid growth during fruit development is an important factor for peel roughening disorder [6]. However, higher flavonoid content in smooth peels and consistent expression of genes enriched in flavonoid biosynthesis, and the phenylpropanoid biosynthesis pathway, is consistent with increased lignan content. Lignans are biosynthesized from the phenylpropanoid biosynthetic pathway [38]. Therefore, the roughness could also be caused by lower levels of lignans and coumarins. Higher lignans in smooth fruit peels indicate a well-controlled cell progression despite cell wall thickening [39]. A related observation is that cinnamoyl-alcohol dehydrogenase was the highly expressed gene in smooth peels compared to rough ones. Alterations in this enzyme expression can result in dramatic changes in lignin content [40]. We say this because earlier research has indicated thicker cell arrangements in smooth-skinned citrus fruits [11]. Future research on the flavonoids in relation to plant growth regulators (phytohormones), lignin content, and cell morphology can reveal more conclusive evidence. On the other hand, high lipid (fatty acid) content and consistently the higher expression of several genes enriched in lipid metabolism, lipid elongation, and other pathways in smooth fruits could be an indication of higher epicuticular wax, a key characteristic of shiny and smooth fruit peels [41]. In this regard, detailed lipid (and fatty acid) profiling of the rough mandarin peels in comparison to smooth ones can establish a link between the smoothness and lipid content. Such experiments would be valuable from a consumer preference perspective.

5. Conclusions

The comparative metabolome and transcriptome analysis of the rough and smooth peels of Orah mandarin indicates that the former peel is characterized by higher flavonoid, terpenoids, alkaloids, and amino acid and derivative contents. On the other hand, the smooth peels of Orah mandarin are characterized by higher content of lipids, lignans and coumarins, organic acids, tannins, saccharides and alcohols, stilbenes, vitamins, and phenolic acids. The key pathways that are potentially involved in peel roughening include lipid, vitamin, and flavonoid metabolism, and associated pathways. Moreover, our results suggest an important role of phytohormones, i.e., ABA, GA, and JA, in the observed fruit peel differences (Figure 5). Future research must focus on time series experiments for detailed explorations of these pathways, together with histological, biochemical, and morphological analysis.

Supplementary Materials

The following supporting information can be downloaded at: https://www.mdpi.com/article/10.3390/horticulturae11050496/s1, Figure S1. Bar chart of the relative metabolite intensities of phytohormone (or related) metabolites detected in the global metabolome profiles of rough and smooth Orah mandarin peels. Table S1. List of differentially accumulated metabolites in smooth (CK) and rough (CP) Orah mandarin peels. Table S2A. Summary statistics of transcriptome sequencing of six Orah mandarin peel cDNA libraries. Table S2B. Pearson’s correlation coefficient (based on gene expression) between the replicates of Orah mandarin peels (smooth, CK, and rough, CP). Table S3. List of differentially expressed genes in smooth (CK) and rough (CP) Orah mandarin peels. Table S4. KEGG pathways in which the differentially expressed genes were significantly enriched.

Author Contributions

Conceptualization, H.L., C.L., Y.D. and X.Z.; methodology, H.L., C.L., S.W., X.F., Y.L. and J.M.; software, S.W. and J.M.; validation, H.L. and C.L.; formal analysis, H.L. and C.L.; investigation, H.L., C.L., S.W., X.F., X.Z., M.D., J.D., H.Y., J.Y., Y.D. and J.M.; resources, H.L.; data curation, H.L. and C.L.; writing—original draft preparation, H.L. and C.L.; writing—review and editing, J.D., Y.D. and X.Z.; project administration, Y.D. and X.Z. All authors have read and agreed to the published version of the manuscript.

Funding

This research was funded by the Natural Science Foundation of Yunnan Province of China [Grant No. 202301AT070006]; The Special Projects for Basic Research of the Yunnan Academy of Agricultural Sciences [Grant No. 2023KYZX-10]; National Key Research and Development Program of China [Grant No. 2022YFF130240403]; Yunnan Fundamental Research Projects [Grant No. 202101BD070001-036].

Data Availability Statement

Transcriptome data are submitted to NCBI SRA bioproject/accession number: PRJNA8215686. All data generated in this study is given within the manuscript or Supplementary Material. Additionally, datasets can be requested to corresponding author of the manuscript.

Acknowledgments

We thank Tiankun Yang for assistance with the experiments. We also thank Yuqiang Lina Guo and Jian Huang for valuable discussion, Zhongliang Peng, Huaifeng Yi, and Hangxiu Liu for assistance with the samples. Thanks also go to Mingxue Xiao for their help in the field.

Conflicts of Interest

The authors declare no conflicts of interest.

References

  1. Dang, J.; Li, C.; Sun, D.; Guo, Q.; Liang, G. A tetraploid-dominated cytochimera developed from a natural bud mutant of the nonapomictic mandarin variety ‘Orah’. Mol. Breed. 2024, 44, 20. [Google Scholar] [CrossRef] [PubMed]
  2. Liu, G.; Wei, P.; Tang, Y.; Li, J.; Yi, P.; Deng, Z.; He, X.; Ling, D.; Sun, J.; Zhang, L. Screening and Characteristics Analysis of Polysaccharides from Orah Mandarin (Citrus reticulata cv. Orah). Foods 2023, 13, 82. [Google Scholar] [CrossRef]
  3. He, Y.; Li, W.; Zhu, P.; Wang, M.; Qiu, J.; Sun, H.; Zhang, R.; Liu, P.; Ling, L.; Fu, X. Comparison between the vegetative and fruit characteristics of ‘Orah’ (Citrus reticulata Blanco) mandarin under different climatic conditions. Sci. Hortic. 2022, 300, 111064. [Google Scholar] [CrossRef]
  4. Rodrigo, M.J.; Alquézar, B.; Alós, E.; Lado, J.; Zacarías, L. Biochemical bases and molecular regulation of pigmentation in the peel of Citrus fruit. Sci. Hortic. 2013, 163, 46–62. [Google Scholar] [CrossRef]
  5. Li, T.; Zhang, J.; Zhu, H.; Qu, H.; You, S.; Duan, X.; Jiang, Y. Proteomic analysis of differentially expressed proteins involved in peel senescence in harvested mandarin fruit. Front. Plant Sci. 2016, 7, 725. [Google Scholar] [CrossRef]
  6. Erner, Y.; Monselise, S.; Goren, R. Rough fruit condition of the Shamouti orange-occurrence and patterns of development. Physiol. Veg. 1975, 13, 435–443. [Google Scholar]
  7. Erner, Y.; Goren, R.; Monselise, S. The rough fruit condition of the Shamouti orange—Connections with the endogenous hormonal balance. J. Hortic. Sci. 1976, 51, 367–374. [Google Scholar] [CrossRef]
  8. Liu, J.; Huang, C.; Chen, D. The effects of some plant growth regulators on fruit coloring and quality of Tankan (Citrus tankan Hayata). Guangdong Agric. Sci. 1987, 4, 3. [Google Scholar]
  9. Liu, F. Study on the Anatomical Morphology and Quality Changes of Rough of Satsuma. Master’s Thesis, Huazhong Agricultural University, Wuhan, China, 2012. [Google Scholar]
  10. Kubo, T.; Hiratsuka, S. Effect of bearing angle of Satsuma mandarin fruit on rind roughness, pigmentation, and sugar and organic acid concentrations in the Juice. J. Jpn. Soc. Hortic. Sci. 1998, 67, 51–58. [Google Scholar] [CrossRef]
  11. Lu, X.-P.; Li, F.-F.; Xiong, J.; Cao, X.-J.; Ma, X.-C.; Zhang, Z.-M.; Cao, S.-Y.; Xie, S.-X. Transcriptome and metabolome analyses provide insights into the occurrence of peel roughing disorder on Satsuma Mandarin (Citrus unshiu Marc.) fruit. Front. Plant Sci. 2017, 8, 1907. [Google Scholar] [CrossRef]
  12. Liu, H.-M.; Long, C.-R.; Wang, S.-H.; Fu, X.-M.; Zhou, X.-Y.; Mao, J.-M.; Yang, H.-X.; Du, Y.-X.; Li, J.-X.; Yue, J.-Q. Transcriptome and metabolome comparison of smooth and rough Citrus limon L. peels grown on same trees and harvested in different seasons. Front. Plant Sci. 2021, 12, 749803. [Google Scholar] [CrossRef]
  13. Chen, Y.; Chen, Y.; Shi, C.; Huang, Z.; Zhang, Y.; Li, S.; Li, Y.; Ye, J.; Yu, C.; Li, Z. SOAPnuke: A MapReduce acceleration-supported software for integrated quality control and preprocessing of high-throughput sequencing data. Gigascience 2018, 7, gix120. [Google Scholar] [CrossRef]
  14. Kim, D.; Paggi, J.M.; Park, C.; Bennett, C.; Salzberg, S.L. Graph-based genome alignment and genotyping with HISAT2 and HISAT-genotype. Nat. Biotechnol. 2019, 37, 907–915. [Google Scholar] [CrossRef] [PubMed]
  15. Langmead, B.; Salzberg, S.L. Fast gapped-read alignment with Bowtie 2. Nat. Methods 2012, 9, 357–359. [Google Scholar] [CrossRef]
  16. Li, B.; Dewey, C.N. RSEM: Accurate transcript quantification from RNA-Seq data with or without a reference genome. BMC Bioinform. 2011, 12, 1–16. [Google Scholar] [CrossRef] [PubMed]
  17. Ashburner, M.; Ball, C.A.; Blake, J.A.; Botstein, D.; Butler, H.; Cherry, J.M.; Davis, A.P.; Dolinski, K.; Dwight, S.S.; Eppig, J.T. Gene ontology: Tool for the unification of biology. Nat. Genet. 2000, 25, 25–29. [Google Scholar] [CrossRef] [PubMed]
  18. Kanehisa, M. KEGG bioinformatics resource for plant genomics and metabolomics. In Plant Bioinformatics: Methods and Protocols; Humana Press: Totowa, NJ, USA, 2016; pp. 55–70. [Google Scholar]
  19. Pruitt, K.D.; Tatusova, T.; Maglott, D.R. NCBI reference sequences (RefSeq): A curated non-redundant sequence database of genomes, transcripts and proteins. Nucleic Acids Res. 2007, 35, D61–D65. [Google Scholar] [CrossRef]
  20. Koonin, E.V.; Fedorova, N.D.; Jackson, J.D.; Jacobs, A.R.; Krylov, D.M.; Makarova, K.S.; Mazumder, R.; Mekhedov, S.L.; Nikolskaya, A.N.; Rao, B.S. A comprehensive evolutionary classification of proteins encoded in complete eukaryotic genomes. Genome Biol. 2004, 5, 1–28. [Google Scholar] [CrossRef]
  21. Apweiler, R. Functional information in SWISS-PROT: The basis for large-scale characterisation of protein sequences. Brief. Bioinform. 2001, 2, 9–18. [Google Scholar] [CrossRef]
  22. Varet, H.; Brillet-Guéguen, L.; Coppée, J.-Y.; Dillies, M.-A. SARTools: A DESeq2-and EdgeR-based R pipeline for comprehensive differential analysis of RNA-Seq data. PLoS ONE 2016, 11, e0157022. [Google Scholar] [CrossRef]
  23. Arakawa, K.; Kono, N.; Yamada, Y.; Mori, H.; Tomita, M. KEGG-based pathway visualization tool for complex omics data. Silico Biol. 2005, 5, 419–423. [Google Scholar] [CrossRef]
  24. Jin, J.; Zhang, H.; Kong, L.; Gao, G.; Luo, J. PlantTFDB 3.0: A portal for the functional and evolutionary study of plant transcription factors. Nucleic Acids Res. 2014, 42, D1182–D1187. [Google Scholar] [CrossRef] [PubMed]
  25. Wen, K.; Li, X.; Yin, T.; Chen, C.; Zi, Y.; Zhao, K.; Pu, J.; Yan, W.; Wang, X.; Zhou, X. Integrated transcriptome and metabolome analyses reveal the mechanism by which bagging treatment affects peel reddening in Orah mandarin. Postharvest Biol. Technol. 2025, 221, 113336. [Google Scholar] [CrossRef]
  26. Shalom, L.; Samuels, S.; Zur, N.; Shlizerman, L.; Doron-Faigenboim, A.; Blumwald, E.; Sadka, A. Fruit load induces changes in global gene expression and in abscisic acid (ABA) and indole acetic acid (IAA) homeostasis in citrus buds. J. Exp. Bot. 2014, 65, 3029–3044. [Google Scholar] [CrossRef]
  27. Wang, J.-G.; Gao, X.-M.; Ma, Z.-L.; Chen, J.; Liu, Y.-N.; Shi, W.-Q. Metabolomic and transcriptomic profiling of three types of litchi pericarps reveals that changes in the hormone balance constitute the molecular basis of the fruit cracking susceptibility of Litchi chinensis cv. Baitangying. Mol. Biol. Rep. 2019, 46, 5295–5308. [Google Scholar] [CrossRef]
  28. Wang, Y.; Guo, L.; Zhao, X.; Zhao, Y.; Hao, Z.; Luo, H.; Yuan, Z. Advances in mechanisms and omics pertaining to fruit cracking in horticultural plants. Agronomy 2021, 11, 1045. [Google Scholar] [CrossRef]
  29. Zhao, X.; He, Y.; Liu, Y.; Wang, Z.; Zhao, J. JAZ proteins: Key regulators of plant growth and stress response. Crop J. 2024, 12, 1505–1516. [Google Scholar] [CrossRef]
  30. Zi, J.; Mafu, S.; Peters, R.J. To gibberellins and beyond! Surveying the evolution of (di) terpenoid metabolism. Annu. Rev. Plant Biol. 2014, 65, 259–286. [Google Scholar] [CrossRef]
  31. Sharma, V.; Gupta, P.; Kagolla, P.; Hangargi, B.; Veershetty, A.; Ramrao, D.P.; Suresh, S.; Narasanna, R.; Naik, G.R.; Kumar, A. Metabolomics intervention towards better understanding of plant traits. Cells 2021, 10, 346. [Google Scholar] [CrossRef]
  32. Pervaiz, T.; Park, S.; Rezk, A.; Hur, M.; Obenland, D.; Arpaia, M.L.; El-Kereamy, A. Metabolomic analyses provide insights into the preharvest rind disorder in Satsuma Owari Mandarin. Front. Plant Sci. 2023, 14, 1263354. [Google Scholar] [CrossRef]
  33. Bennett, R.D. Acidic limonoids of grapefruit seeds. Phytochemistry 1971, 10, 3065–3068. [Google Scholar] [CrossRef]
  34. Ibrahim, M.; Oksanen, E.; Holopainen, J. Effects of limonene on the growth and physiology of cabbage (Brassica oleracea L.) and carrot (Daucus carota L.) plants. J. Sci. Food Agric. 2004, 84, 1319–1326. [Google Scholar] [CrossRef]
  35. Shi, Y.-S.; Zhang, Y.; Li, H.-T.; Wu, C.-H.; El-Seedi, H.R.; Ye, W.-K.; Wang, Z.-W.; Li, C.-B.; Zhang, X.-F.; Kai, G.-Y. Limonoids from Citrus: Chemistry, anti-tumor potential, and other bioactivities. J. Funct. Foods 2020, 75, 104213. [Google Scholar] [CrossRef]
  36. Taylor, L.P.; Grotewold, E. Flavonoids as developmental regulators. Curr. Opin. Plant Biol. 2005, 8, 317–323. [Google Scholar] [CrossRef]
  37. Brunetti, C.; Fini, A.; Sebastiani, F.; Gori, A.; Tattini, M. Modulation of phytohormone signaling: A primary function of flavonoids in plant–environment interactions. Front. Plant Sci. 2018, 9, 1042. [Google Scholar] [CrossRef] [PubMed]
  38. Liu, Q.; Luo, L.; Zheng, L. Lignins: Biosynthesis and biological functions in plants. Int. J. Mol. Sci. 2018, 19, 335. [Google Scholar] [CrossRef]
  39. Li, W.; Lin, Y.-C.J.; Chen, Y.-L.; Zhou, C.; Li, S.; De Ridder, N.; Oliveira, D.M.; Zhang, L.; Zhang, B.; Wang, J.P. Woody plant cell walls: Fundamentals and utilization. Mol. Plant 2024, 17, 112–140. [Google Scholar] [CrossRef]
  40. Stasolla, C.; Scott, J.; Egertsdotter, U.; Kadla, J.; O’Malley, D.; Sederoff, R.; van Zyl, L. Analysis of lignin produced by cinnamyl alcohol dehydrogenase-deficient Pinus taeda cultured cells. Plant Physiol. Biochem. 2003, 41, 439–445. [Google Scholar] [CrossRef]
  41. Malik, A.U.; Hasan, M.U.; Khalid, S.; Mazhar, M.S.; Shafique Khalid, M.; Khan, M.N.; Saleem, B.A.; Khan, A.S.; Anwar, R. Biotic and abiotic factors causing rind blemishes in citrus and management strategies to improve the cosmetic quality of fruits. Int. J. Agric. Biol. 2021, 25, 298–318. [Google Scholar] [CrossRef]
Figure 1. Physiological indicators of Orah mandarin fruits with differing peel appearance. (A) Fruits with rough (CP) and smooth (CK) peels. (B) Fruit mass, (C) longitudinal diameter, (D) diameter, (E) peel thickness, (F) peel weight, (G) total soluble solids, and (H) titratable acid in both fruit types. The bars are means (n = 3). The error bars represent the standard deviation. The differences were computed by student’s t-test at p < 0.01. * Represents significant differences between CP and CK.
Horticulturae 11 00496 g001
Figure 2. Global metabolomic profiles of smooth (CK) and rough (CP) Orah mandarin peels. (A) Heatmap of relative metabolite intensities of compounds in major classes. (B) Bar plot of the number of metabolites detected from each compound class. (C) Sum of relative metabolite intensities of compound classes in CK and CP peels. (D) Principal component analysis, (E) orthogonal partial least squares discriminant analysis, and (F) Pearson’s correlation coefficient based on relative metabolite intensities of detected metabolites in CK and CP. Numbers (1–3) with CP and CK represent replicates.
Horticulturae 11 00496 g002
Figure 3. Differential metabolome profiles of smooth (CK) and rough (CP) Orah mandarin peels. (A) Heatmap of the relative metabolite intensities of DAMs. (B) Volcano plot of DAMs based on Log2foldchange (x-axis) and variable importance in projection (y-axis). (C) Top-accumulated DAMs in CP (red) and CK (green). (D) Scatter plot showing KEGG pathways (top 20), to which the DAMs were significantly enriched.
Horticulturae 11 00496 g003
Figure 4. Differential gene expression between smooth (CK) and rough (CP) Orah mandarin peels. (A) Overall gene expression density. (B) Volcano plot showing differentially expressed genes. (C) KEGG and (D) GO classification of the differentially expressed genes in rough and smooth Orah mandarin peels. (E) Heatmap of Log2 fold change values of the top up- and down-regulated genes between CK and CP.
Horticulturae 11 00496 g004
Figure 5. Potential regulatory pathways involved in peel roughening in Orah mandarin. The figures on the right and left show the smooth and rough Orah mandarin peels, respectively. The colors in the metabolite class, i.e., red and green, show the higher or lower accumulation, respectively. The direction of red and green colors indicates if the metabolite was higher in either of the peel types. The graphs related to fruit size and biochemical parameters also show higher (red) and lower (green) values; the mean of three replicates with ± standard deviation. Important KEGG pathways (metabolism (light blue) and signaling (light yellow)), to which the differentially accumulated metabolites and expressed genes were enriched, are shown.
Horticulturae 11 00496 g005
Disclaimer/Publisher’s Note: The statements, opinions and data contained in all publications are solely those of the individual author(s) and contributor(s) and not of MDPI and/or the editor(s). MDPI and/or the editor(s) disclaim responsibility for any injury to people or property resulting from any ideas, methods, instructions or products referred to in the content.

