Article

Response of Tomato Quality Parameters to Water Deficit Under Soil Salinity and Simulation Based on Stem Water Potential

1
Institute of Farmland Irrigation, Chinese Academy of Agricultural Sciences, Xinxiang 453002, China
2
Institute of Western Agriculture, Chinese Academy of Agricultural Sciences, Changji 831100, China
3
National Field Scientific Observation and Research Station on Effcient Water Use of Oasis Agriculture, Wuwei 733009, China
*
Authors to whom correspondence should be addressed.
Horticulturae 2025, 11(2), 114; https://doi.org/10.3390/horticulturae11020114
Submission received: 21 November 2024 / Revised: 19 January 2025 / Accepted: 20 January 2025 / Published: 22 January 2025
(This article belongs to the Special Issue Irrigation and Fertilization Management in Horticultural Production)

Abstract

:
Soil salinity and water deficit are important challenges for sustainable agricultural development in arid and semi-arid regions. While soil salinity and water deficits may result in lower crop yields, they may improve crop quality. The quantitative relationship between water–salt stress, crop yield, and quality is key to achieving stable yield and enhanced quality through the coordinated regulation of soil water and salt. The interaction between soil salinity and deficit irrigation on tomato quality needs to be further understood, and the model simulating the response of tomato quality to deficit irrigation under simulated soil salinity needs to be further optimized. In this study, a two-year experiment was conducted in northwest China consisting of combinations of three soil salinity levels (0 g, 3 g, and 5 g mixed salt added to 1000 g air-dried soil, respectively) and four water regimes relative to the field capacity (θf) (W0, W1, W2, and W3 refer to 95% θf, 80% θf, 70% θf, and 60% θf as the upper limit of soil water content, respectively). The responses of plant stem water potential (φ), fruit osmotic potential (φπ), fruit Na+ content, fruit fresh weight, fruit water content, total soluble solids (TSS), lycopene (Ly), soluble sugars content (SSC), and color index (CI) to the degree of water deficit and the stage of water deficit were analyzed under soil salinity. The results show that both soil salinity and water deficit significantly reduced φ, but there is no significant interaction. TSS, SSC, and CI are all significantly affected by soil salinity, degree of water deficit, and stage of water deficit, and there is a significant interaction between the degree of water deficit and soil salinity. Fruit fresh weight, TSS, Ly, SSC, and CI are all strongly correlated with φ, and the straight lines of regression of each index with φ are significantly affected by soil salinity content. Soil salinity significantly increased the Na+ content in the fruit, and water deficit significantly enhanced the effect of soil salinity on the Na+ content of tomato fruit. A functional model to simulate fruit quality was developed based on the response of fruit quality parameters to φ and the effect of fruit Na+ accumulation under the compound effect of soil salinity and water deficit. The validation results of the model show that this function model effectively simulates tomato fruit quality under the combined effects of soil salinity and water deficit, providing a theoretical basis for soil water–salt management in arid and semi-arid regions.

1. Introduction

As a popular food product, processing tomato provides a large amount of nutrients, such as lycopene and phenolic compounds, that are required by the human body [1]. Improvements in consumption level, food safety, and nutritional value are increasingly emphasized by consumers. Improving the quality of processing tomato to meet consumer demand is conducive to promoting the healthy development of the processing tomato industry. Although water deficit and soil salinity may lead to reductions in tomato yield, they can also improve tomato fruit quality to some extent [2,3]. Considering the characteristics of the major growing areas for processing tomatoes in China, regulating water and salt levels in the root zone is a safe and effective way to improve crop quality. Combined with the characteristics of the main growing region of processing tomatoes, it is a safe and effective way to improve crop quality through soil water and salt regulation in the root zone.
The results of studies on the effect of water deficit on tomato quality generally indicate that water deficit can improve tomato quality to some extent [4,5,6]. The impact of water deficit on tomato quality is mainly related to the degree and period of the deficit. In terms of the period, most studies suggest that water deficit during the fruit ripening stage has a greater effect on tomato quality than during the reproductive growth stage [5,7]. Although different tomato quality indexes vary in their sensitivity to water deficit, the primary quality indexes of tomato fruit tend to improve as the degree of water deficit increases, provided that a certain yield is guaranteed. The effect of water deficit on tomato quality involves complex physiological and biochemical processes [8,9,10]. Therefore, current simulations of tomato fruit quality under water deficit conditions are mainly based on regression relationships between water consumption and fruit quality parameters or statistical models. The reasons for changes in fruit quality due to water deficit are primarily explained by the concentration effect and the increase in nutrient synthesis. Water deficit affects fruit water input, leading to a decrease in fruit water content, which may be the main cause of the concentration effect [11]. Soluble sugars, organic acids, and other soluble substances are not only nutrients that influence fruit quality indexes, but they are also important osmotic regulators closely related to osmotic regulation [12]. The synthesis and transformation of nutrients in the fruit under water deficit may be primarily related to the plant’s osmotic regulation. Under water deficit, the water input and osmotic regulation in the fruit are closely related to the water status of the plant [13]. Plant stem water potential is a commonly used indicator to reflect the water status of plants [14,15,16]. However, the relationship between plant water potential and fruit quality remains unclear.
Salt stress is also a major abiotic stress that affects the water status of plants. However, different from water deficit, salt stress also leads to ion accumulation within plants, thereby influencing the physiological and biochemical reactions of plants. Sodium accumulation affects the material input and accumulation of fruits by influencing photosynthesis on the one hand, and, on the other hand, it affects fruit quality by influencing the transformation of substances within fruits [17,18]. As an inexpensive osmoregulator, ion absorption under osmotic stress significantly affects the synthesis and transformation of organic osmoregulator within plants. Firstly, under osmotic stress, plants prioritize the absorption of inorganic ions for osmotic regulation to allocate more fixed energy to growth [19,20]. Secondly, ion accumulation significantly affects enzyme activities in the fruit, such as sucrose invertase, neutral invertase, and citrate synthase [21,22,23,24]. All of these factors increase the difficulty of quantifying the impact of salt stress and combined water-salt stress on fruit quality. In addition, considering the effects of combined water–salt stress interactions on fruit quality adds to the difficulty of modeling tomato fruit quality under water–salt stress. As a result, there is currently a lack of simple, feasible, and highly accurate simulation methods. Both plant osmotic stress and ion accumulation are closely related to the water status of plants, and the change in plant water status is the comprehensive result of the combined effect of water–salt coupling stress, which may already include the influence of this interaction. In addition, the ion concentration around the root system also significantly affects the ion accumulation of plants. Both plant osmotic stress and ion accumulation are closely related to plant water status, which is the result of the combined effects of water–salt combined stress and already includes interaction effects. Furthermore, the effect of ion concentration around the root system on fruit quality by influencing plant ion accumulation should also be considered.
Currently, research on the quantification and simulation of the effects of abiotic stress on tomato fruit quality has primarily focused on water deficit. Studies on simulating the impact of water deficit on tomato fruit quality mainly draw from water production function models. This study explores the interactions between water deficit and soil salinity combined stress on tomato fruit quality. Based on the response of fruit quality indexes to plant stem water potential under water stress, salt stress, and water–salt coupled stress, the role played by ion accumulation in affecting fruit quality was clarified. By drawing from water production functions and using stem water potential as the medium, this study establishes a function model for simulating fruit quality under water–salt coupled stress, considering the impact of soil ion content. It was hypothesized that stem water potential could be linked to fruit quality indicators through fruit water content.

2. Materials and Methods

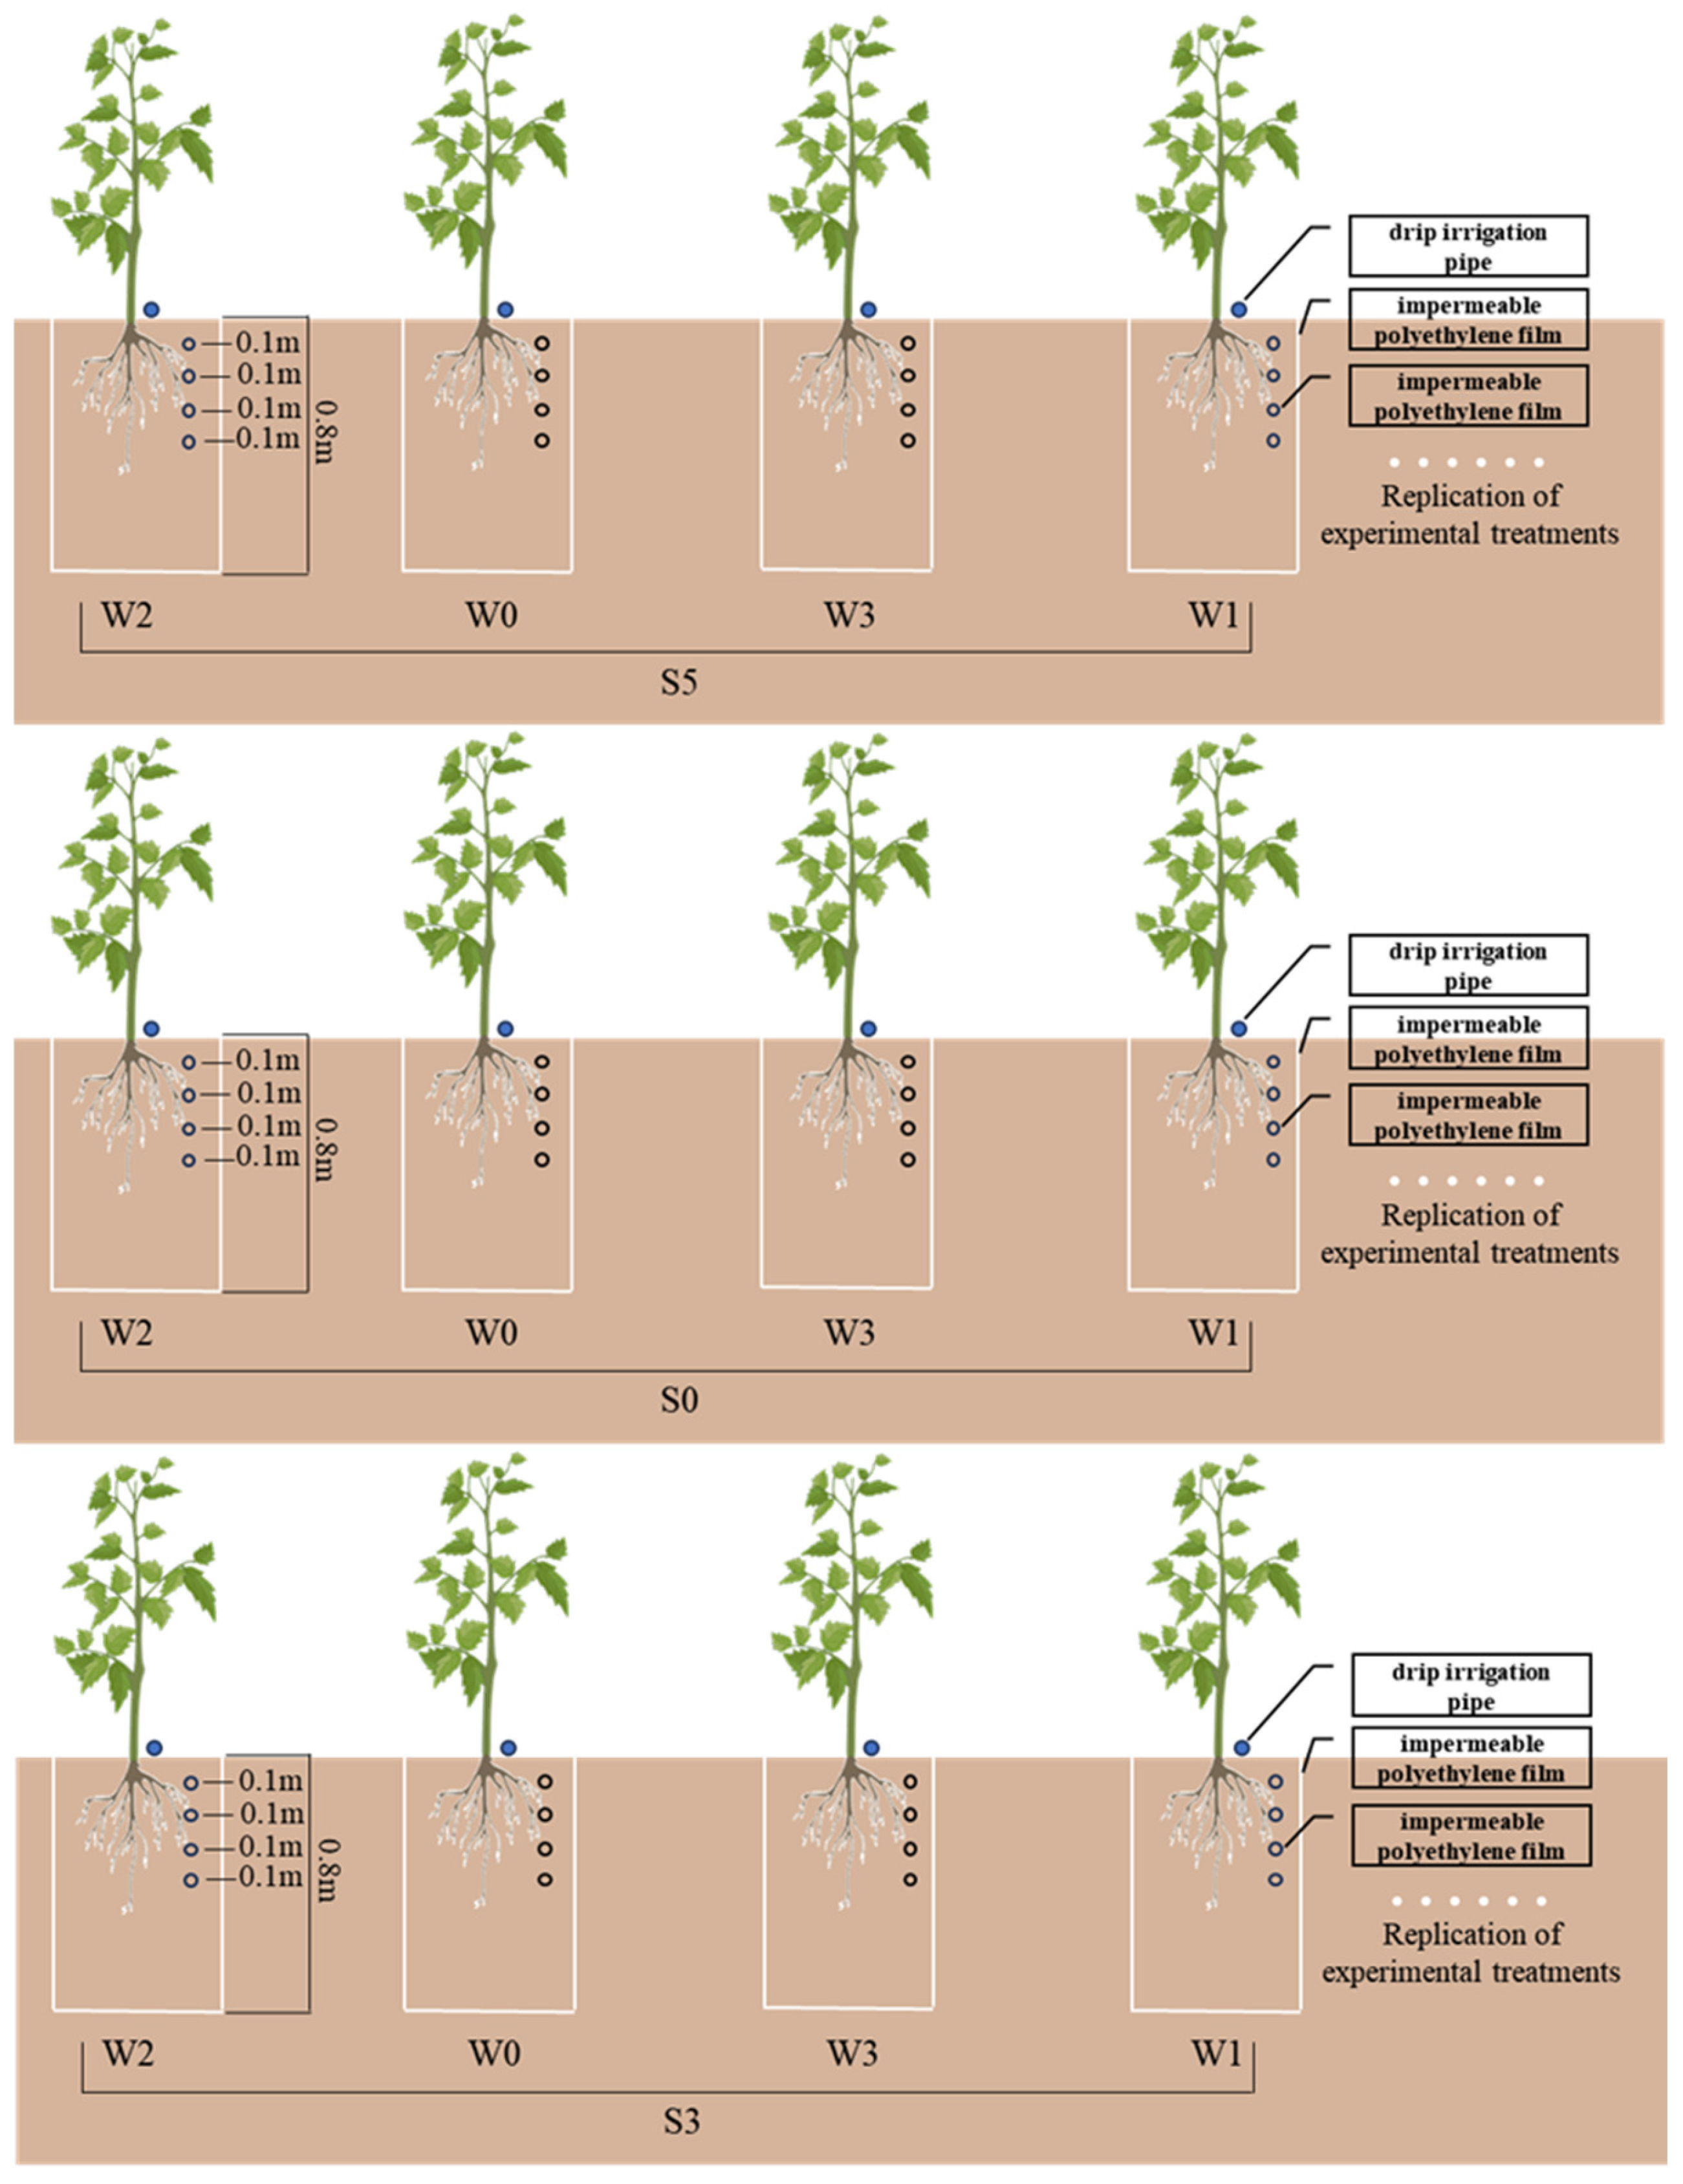
2.1. Experimental Site and Materials

Two experiments were carried out at the Shiyanghe Experimental Station of China Agricultural University, Wuwei city, China (37°52′ N, 102°50′ E, 1581 m altitude). The experiment used an unheated naturally ventilated greenhouse, 76 m × 8 m in size and made of a steel frame covered with 0.2 mm polyethylene film. Air temperature (Ta, °C), relative humidity (RH, %), and solar radiation (Rs, W m−2) were acquired using an Em50 data collector (METER Group, Inc., Washington, DC, USA) shown in Zhang et al., (2022) [25]. Tomatoes (Solanum lycopersicum cv. Ligeer 87-5) of self-topping processing varieties were grown. The seeds were germinated in the local nursery, and the seedlings were subsequently transplanted once they had developed three or four leaves. The experiments for two seasons began on 1 June 2019 and 1 June 2020, respectively. Tomato seedlings were planted in growth tanks (4.5 m long, 0.5 m wide, and 0.8 m deep) with 12 plants per growth tank. The soils within the growth tanks were dug out and air-dried then sieved; the bottom and perimeter of the growth tank was separated from the surrounding soil by impermeable polyethylene film, and finally the sieved air-dried soils were backfilled into the growth tanks. Based on the set soil salinity treatment, the salt mixture was uniformly added to the sifted air-dried soil prior to backfilling the sifted air-dried soil. Due to the amount of mixed salt added, soil pH varied between 6.0 and 7.8 for different growth tanks. Fertilization was based on manual recommendation. The fertilizers applied were 200 mg kg−1 soil N (CH4N2O), 400 mg kg−1 soil P (Ca(H2PO4)), and 50 mg kg−1 soil K (KH2PO4). The soil was sandy loam with 49% sand, 46% silt, and 5% clay. The mean soil dry bulk density was determined to be 1.47 g cm−3, with a field capacity (θf) of 0.27 cm3 cm−3 within the planned depth of the wetted soil layer (40 cm).

2.2. Treatments

The three soil salinity treatments were S0 (no salt added), S3 (3 g mixed salt added to 1000 g air-dried soil), and S5 (5 g mixed salt added to 1000 g air-dried soil), and the soil electrical conductivities of the 1:5 soil water extract (EC) were 0.51 dS m−1, 1.04 dS m−1, and 1.63 dS m−1 respectively. The mixed salt comes from the surface salt crust of heavily salinized land in Xinjiang was chemically analyzed to determine the content of major cations and anions. The main ions and mass ratios of the mixed salt are as follows: K+ (0.38 ± 0.13%), Na+ (7.63 ± 2.46%), Ca2+ (18.9 ± 4.85%), Mg2+ (2.78 ± 2.27%), Cl (15.91 ± 5.06%), and SO2− (54.39 ± 5.07%), which can be found in Zhang et al. (2023) [26]. The soil in each tank was covered with plastic mulch, and plants were irrigated with drippers placed under the mulch. Four levels of irrigation, full irrigation (W0, 95% of θf as the upper limit), mild water deficit (W1, 80% of θf as the upper limit), moderate water deficit (W2, 70% of θf as the upper limit), and severe water deficit (W3, 60% of θf as the upper limit) were applied with three soil salinity regimes. The treatments were arranged in a 3 × 4 factorial scheme, and experimental treatments were laid out as the completely randomized split-plot experiment design (Figure 1).
The experimental plots were irrigated through the drip irrigation system. The commencement of the irrigation process was consistent across all treatment groups. Irrigation was initiated for all treatments once the average volumetric water content of the planned wetted soil layer (0–40 cm) of the full irrigation treatment reached a value of approximately 75 ± 2% of θf. When the fully irrigated treatment began to irrigate, the water deficit treatment was not irrigated if the soil water content of the water deficit treatment did not fall below the set upper soil water content limit. The quantity of irrigation applied to each treatment was calculated based on the difference between the initial soil water content and the predetermined upper limit for water content. The irrigation amount and irrigation times for all treatments are shown in Table 1. Three replicates were established for each treatment. The entire reproductive period of tomato is divided into seedling, reproductive growth, and fruit ripening stages: the seedling stage is from plant establishment to plant flowering; the reproductive growth period is from flowering to first fruit maturity; and the fruit ripening period is from the ripening of the first fruit to the harvesting of all fruits. Water deficit was imposed at the reproductive growth stage (RW) and maturity stage (MW), respectively.

2.3. Measurements

The data previously collected by our team on tomato root distribution indicated that the majority of roots were present within the 0–40 cm soil layer. Volumetric soil water content (θ) was continuously monitored using 5TE sensors (Meter, Inc., Washington, DC, USA) buried in the root zone at 10, 20, 30, and 40 cm below the soil surface. The soil water content, which was monitored on an ongoing basis, was primarily utilized to ascertain the irrigation timing. The electrical conductivity of soil saturation extract (EC) was measured by a conductivity meter (FG30-FiveGo; Mettler Toledo, Inc., Greifensee, Switzerland). Soil samples were collected at depths of 10, 20, 30, and 40 cm from the soil surface using a soil auger (Royal Eijkelkamp, Inc., Arnhem, The Netherlands). The samples were taken before and after irrigation and were used to determine the water content and electrical conductivity (EC) of the root zone.
Pre-dawn stem water potential (φ) was measured using a SKPM 1400 pressure chamber (Skye Instruments Ltd., Wales, UK) between 4 a.m. and 6 a.m. The leaves near the stem were wrapped in tin foil and, after ten minutes, the leaf water potential and the stem water potential would reach equilibrium, at which point the leaf water potential represented the plant stem water potential. The leaves are removed from the plant and the water potential was determined using SKPM 1400 pressure chamber (portable) (Skye Instruments Ltd., Wales, UK) in the greenhouse workroom [27]. The pre-dawn stem water potential was measured on three occasions during the course of three irrigation cycles and at the reproductive and mature stages of the plants, respectively. Each irrigation cycle was measured on three occasions, at one day, three days, and five days after irrigation.
Four fruits were taken from each experimental plot (four fruit clusters were retained per plant and one fruit was selected from each cluster) for a total of twelve tomatoes from three plots of one experimental treatment. Twelve fruits represent one experimental treatment. The single fruit weight and color index of tomatoes were determined first, after which the fruits were washed with distilled water and divided into two parts; one part was used to determine the water content of the fruits, and the other part was ground and mixed for the determination of TSS, Ly, and SSC. Fruit CI was determined using the SP60 colorimeter (SP60, X-rite, Incorpor-ated, Grand Rapids, MI, USA). Fruit TSS was determined using the hand-held digital brix meter (ATAGO, Co. Ltd., Tokyo, Japan). Soluble sugar content was determined by anthrone colorimetry. The lycopene content was determined according to the method described by Colle et al. (2013) [28].

2.4. Modeling of Fruit Quality Function Under Water–Salt Stress

In this study, a segmented function was used as the basic function based on the differences in the effects on the final fruit quality of water deficit at different growth stages. In addition, the functional form to quantify the effect of soil salinity was determined based on the response of tomato fruit to water deficit under different soil salinities. Based on the response of tomato fruit quality parameters to combined water and salt stress, the function model to simulate fruit quality under water and salt stress was developed by considering the fruit ion accumulation influence factor with reference to the water production function of the multiplicative model. The following is the simulation model of tomato fruit quality that includes the ion accumulation influence factor.
Q a Q m = ( ( 1 E C a E C m ) ( E C a E C m k ) + 1 ) β i = 1 n ( φ a i φ m i ) λ q i
In the aforementioned model, Qa represents the actual quality index of the fruit; Qm represents the fruit quality index under full irrigation conditions; φai represents the actual stem water potential of the plant at growth stage i; φmi represents the stem water potential at growth stage i under non-stress conditions; and λqi is the crop quality stem water potential sensitivity index at growth stage i in the model. The parameters are shown in Table 2. To facilitate the application of the model, this paper, in conjunction with the functional relationship between soil water content and salinity [26], obtains the final model (Q-Multiplicative).
The Q-Multiplicative is as follows:
Q a Q m = 1 E C a E C m E C a E C m k + 1 β i = 1 n a θ a i θ r θ 0 θ r d + E C a E C m C 1 + θ 0 θ τ a θ m θ r θ 0 θ r d λ q i
where θ0 is saturated water content; θr is wilting coefficient; θi is actual soil water content at fertility stage i; and a and d are the shape parameters of the curve. C is a crop-specific parameter, which represents the decreased value of stem water potential caused by the unit increase in EC, and τ is the influence coefficient of soil water content on reducing stem water potential by EC. The parameters θ0 and θr, were obtained by fitting of h-θ using RETC 1.0; θ0 and θr are shown in Table 2. The parameters a, d, C, and τ were estimated by the least squares method; see Table 2.

2.5. Statistical Analyses

Statistical analysis was performed using SPSS Statistics 24.0 (IBM, New York, NY, USA). A two-way ANOVA was performed for the effects of salinity regime, water deficit, and their interaction on single fruit weight and fruit quality. The one-way ANOVA (Duncan’s new multiple range test) was used to determine if there were significant differences in single fruit weight and fruit quality among treatments. Data were subjected to normality test and homogeneity of variance test prior to the ANOVA. The coefficient of determination is used to describe how well the data fit a linear function.

2.6. Evaluation of Model Performance

Model validity was assessed as measured by the slope b and coefficient of determination (R2) of the linear regression equation between the measured and simulated values over the origin. Furthermore, the indicators of estimation errors and the quality of modeling were calculated, including the root mean square error (RMSE), average absolute error (AAE), modeling efficiency (EF), and the Willmott parameter of agreement (dIA).
The b is calculated as follows:
b = i = 1 n M i S i i = 1 n M i 2
The R2 is calculated as follows:
R 2 = 1 i = 1 n S i b × M i 2 i = 1 n S i = 1 S ¯ 2
RMSE characterizing the variance of the errors is calculated as follows:
R M S E = 1 n i = 1 n S i M i 2
AAE expressing the size of estimation errors is calculated as follows:
A A E = 1 n i = 1 n S i M i
EF, defined by the ratio of the mean square error to the variance in the measured data, is calculated as follows:
E F = 1 i = 1 n S i M i 2 i = 1 n M i M ¯ 2
where   M ¯ is the measured mean value. dIA indicates the agreement between the measured and simulated values, and is given as follows:
d I A = 1 i = 1 n S i M i 2 i = 1 n S i M ¯ + M i M ¯ 2
when dIA = 1, a perfect agreement between the measured and simulated value is attained; when dIA = 0, there is no agreement [29].

3. Results

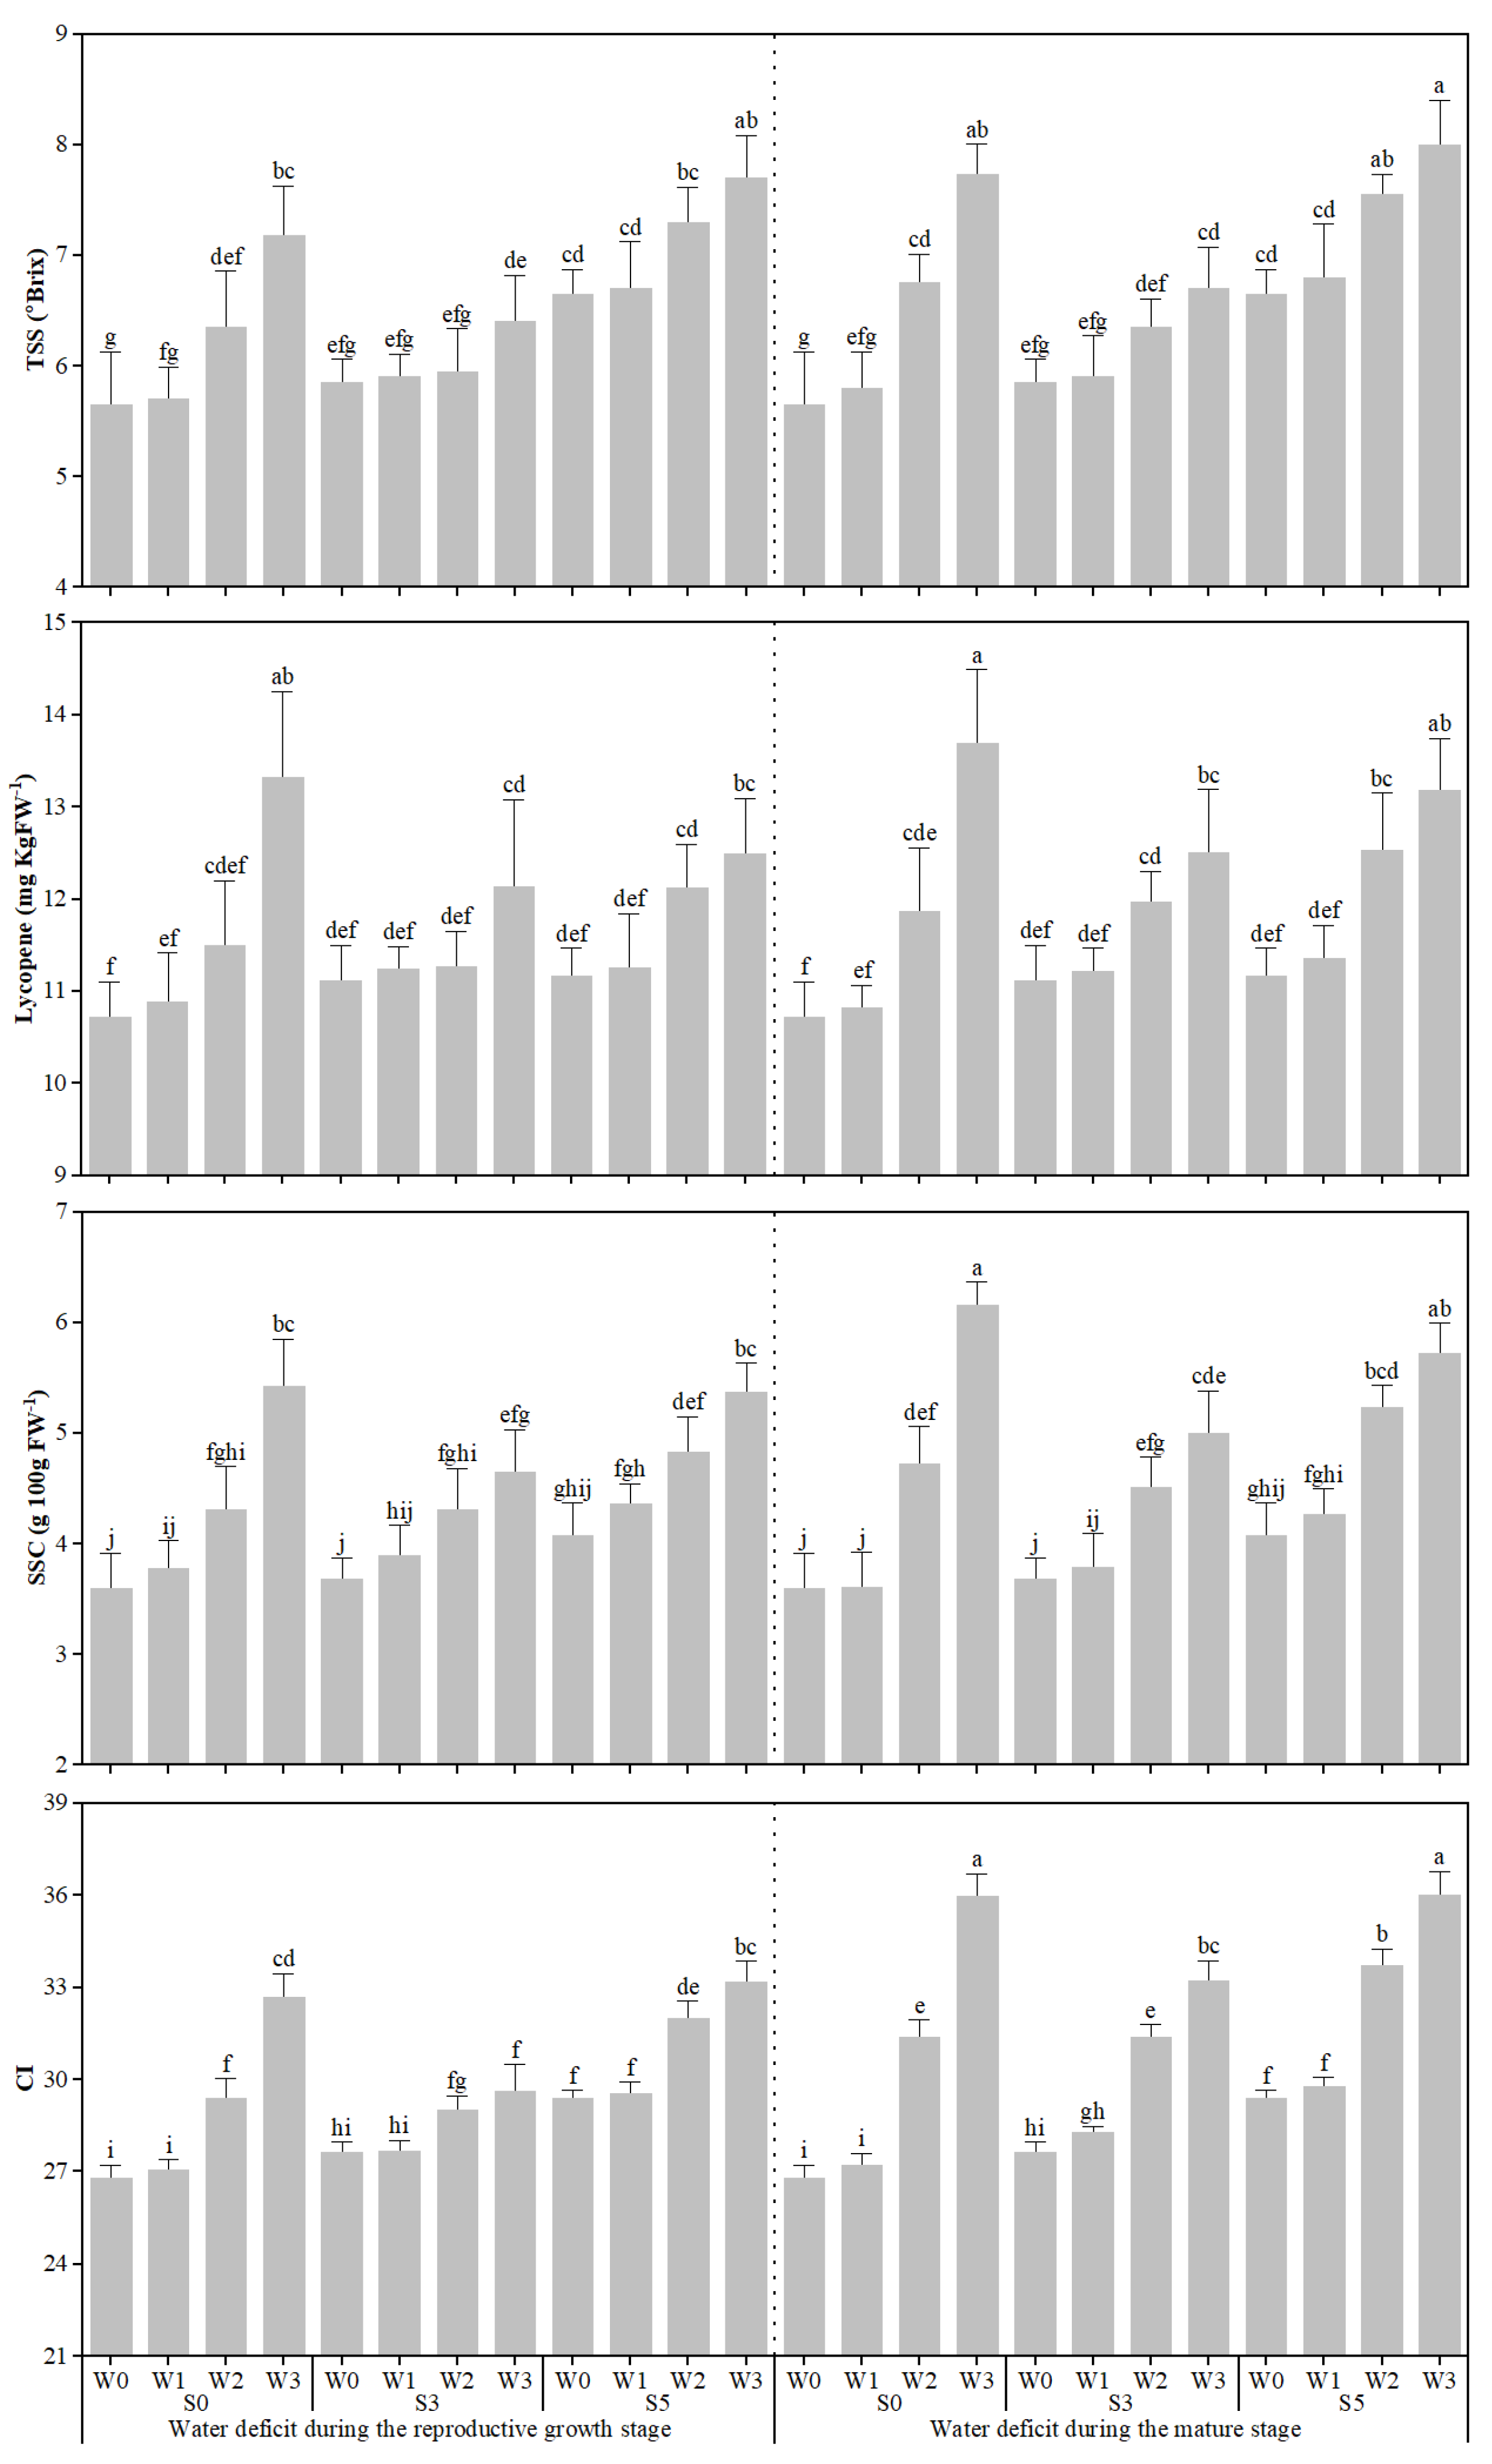
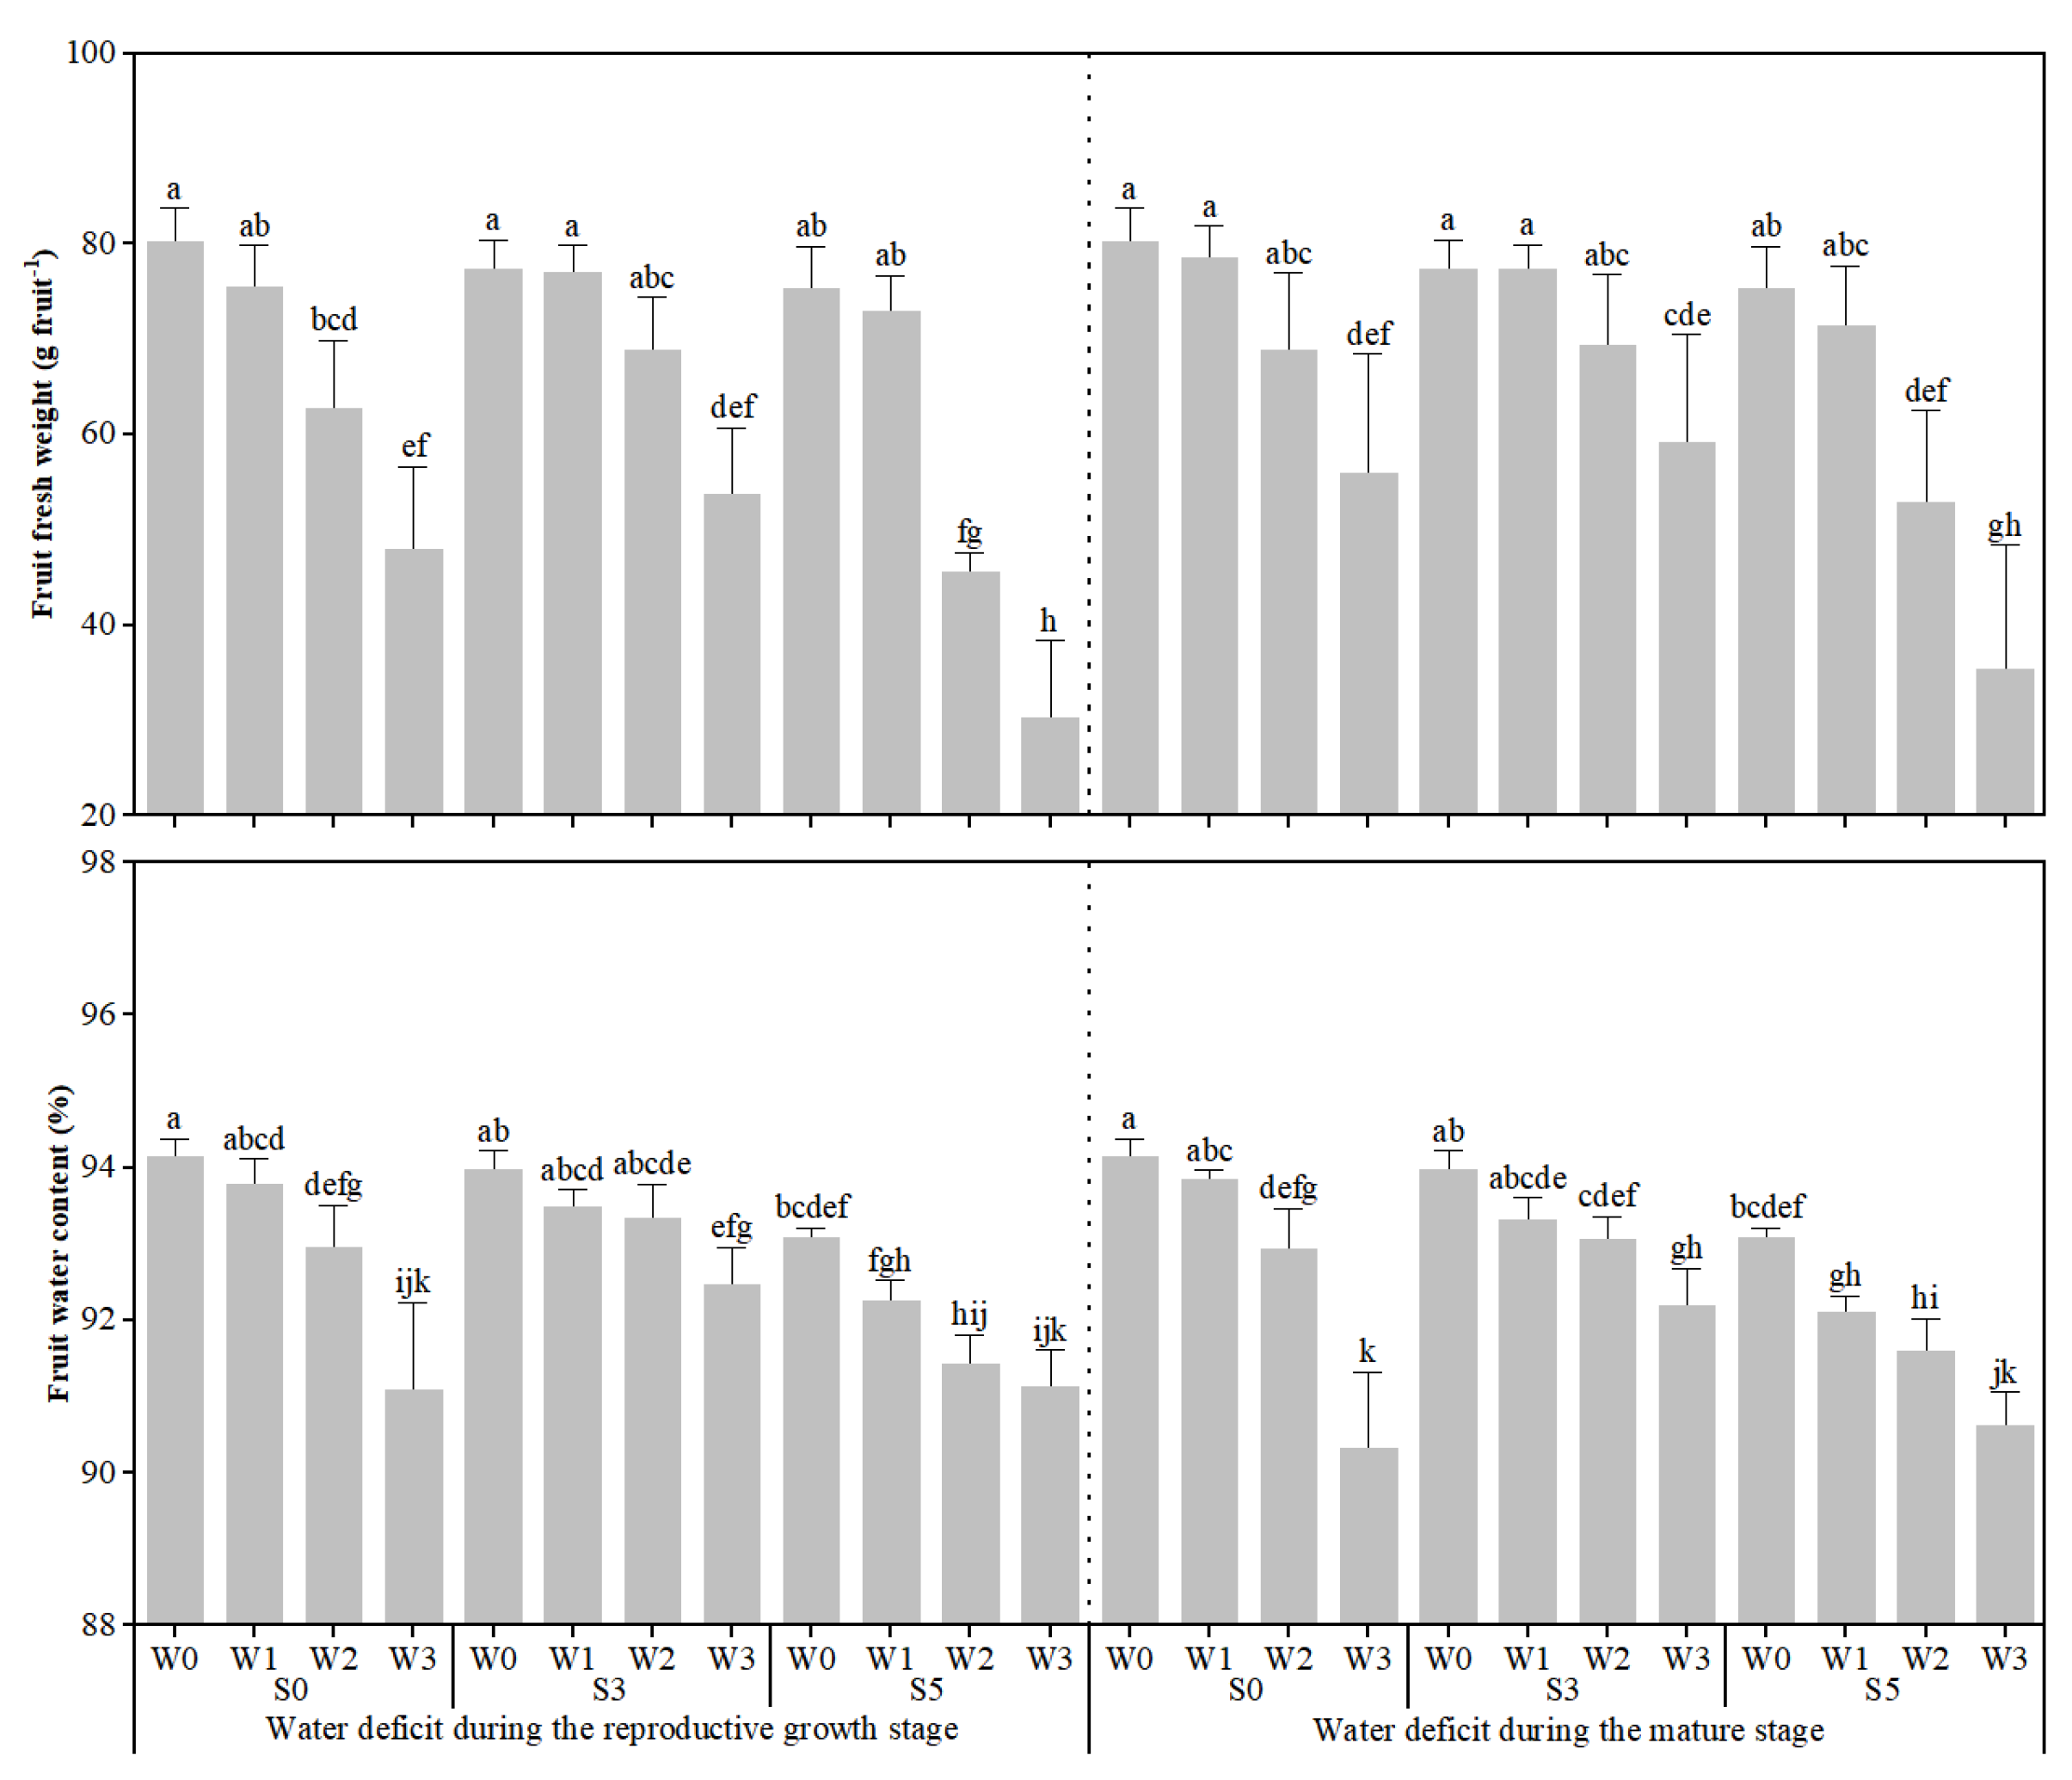
3.1. Response of Fruit Quality, Fruit Fresh Weight, and Fruit Water Content to Different Stages of Water Deficit Under Soil Salinity

Analysis of variance (ANOVA) showed that soil salinity, degree of water deficit, and stage of water deficit significantly affected the total soluble solids (TSS), soluble sugar content (SSC), and color index (CI) of tomato fruits, and lycopene (Ly) was significantly affected by soil salinity and degree of water deficit (Table 3). There was a significant interaction between soil salinity and water deficit on TSS, SSC, Ly, and CI. The increase in both soil salinity and water deficit increased the quality of tomato fruits (Figure 2). The interaction between water deficit and soil salinity on quality parameters was related to soil salinity content. Fruit quality of S3W3 treatment was significantly lower than that of S0W3 treatment. The S3 soil salinity reduced the effect of water deficit on quality enhancement, and the interaction between soil salinity and water deficit level on fruit quality enhancement was antagonistic. Fruit quality was generally lower in the S5W3 treatment than in the S0W3 treatment, but there was no significant interaction. For different stages of water deficit, water deficit during the fruit’s mature stage enhanced fruit quality more than the reproductive growth stage. There was a significant interaction between the degree of water deficit and the stage of water deficit on SSC and CI. Under S0 soil salinity, both SSC and CI were significantly higher in the W3 water deficit treatment during fruit ripening than those in the W3 water deficit treatment during reproductive growth.
Soil salinity and water deficit both significantly reduced fruit fresh weight and had a significant interaction effect (Table 3). The interaction between soil salinity and water deficit varied with soil salinity content. For the same water deficit, fruit fresh weights of S3 soil salinity treatments were higher than those of S0 soil salinity treatments, and the interaction between soil salinity and water deficit on the reduction in tomato fruit fresh weight was antagonistic; fruit fresh weights of S5 soil salinity treatments were lower than those of S0 soil salinity treatments, and the interaction between soil salinity and water deficit on the reduction in tomato fruit fresh weight was antagonistic (Figure 3). The effect of water deficit at the fruit’s mature stage on the fresh weight of the tomato was less than that of the water deficit at the reproductive growth stage, but the difference was not significant. Soil salinity and water deficit both significantly reduced fruit water content with significant interaction. Soil salinity reduced the effect of water deficit on fruit water content, and the interaction between soil salinity and water deficit was antagonistic (Figure 3).
Fruit TSS, Ly, SSC, and CI were all significantly and linearly correlated with fruit water content (Figure 4). The straight lines of regression between fruit water content and quality parameters were not significantly different for different soil salinities, either for water deficit at the reproductive growth stage or at the fruit ripening stage. The enhancement of fruit quality by soil salinity, water deficit, and the combined effects may be realized mainly through the reduction in fruit water content.

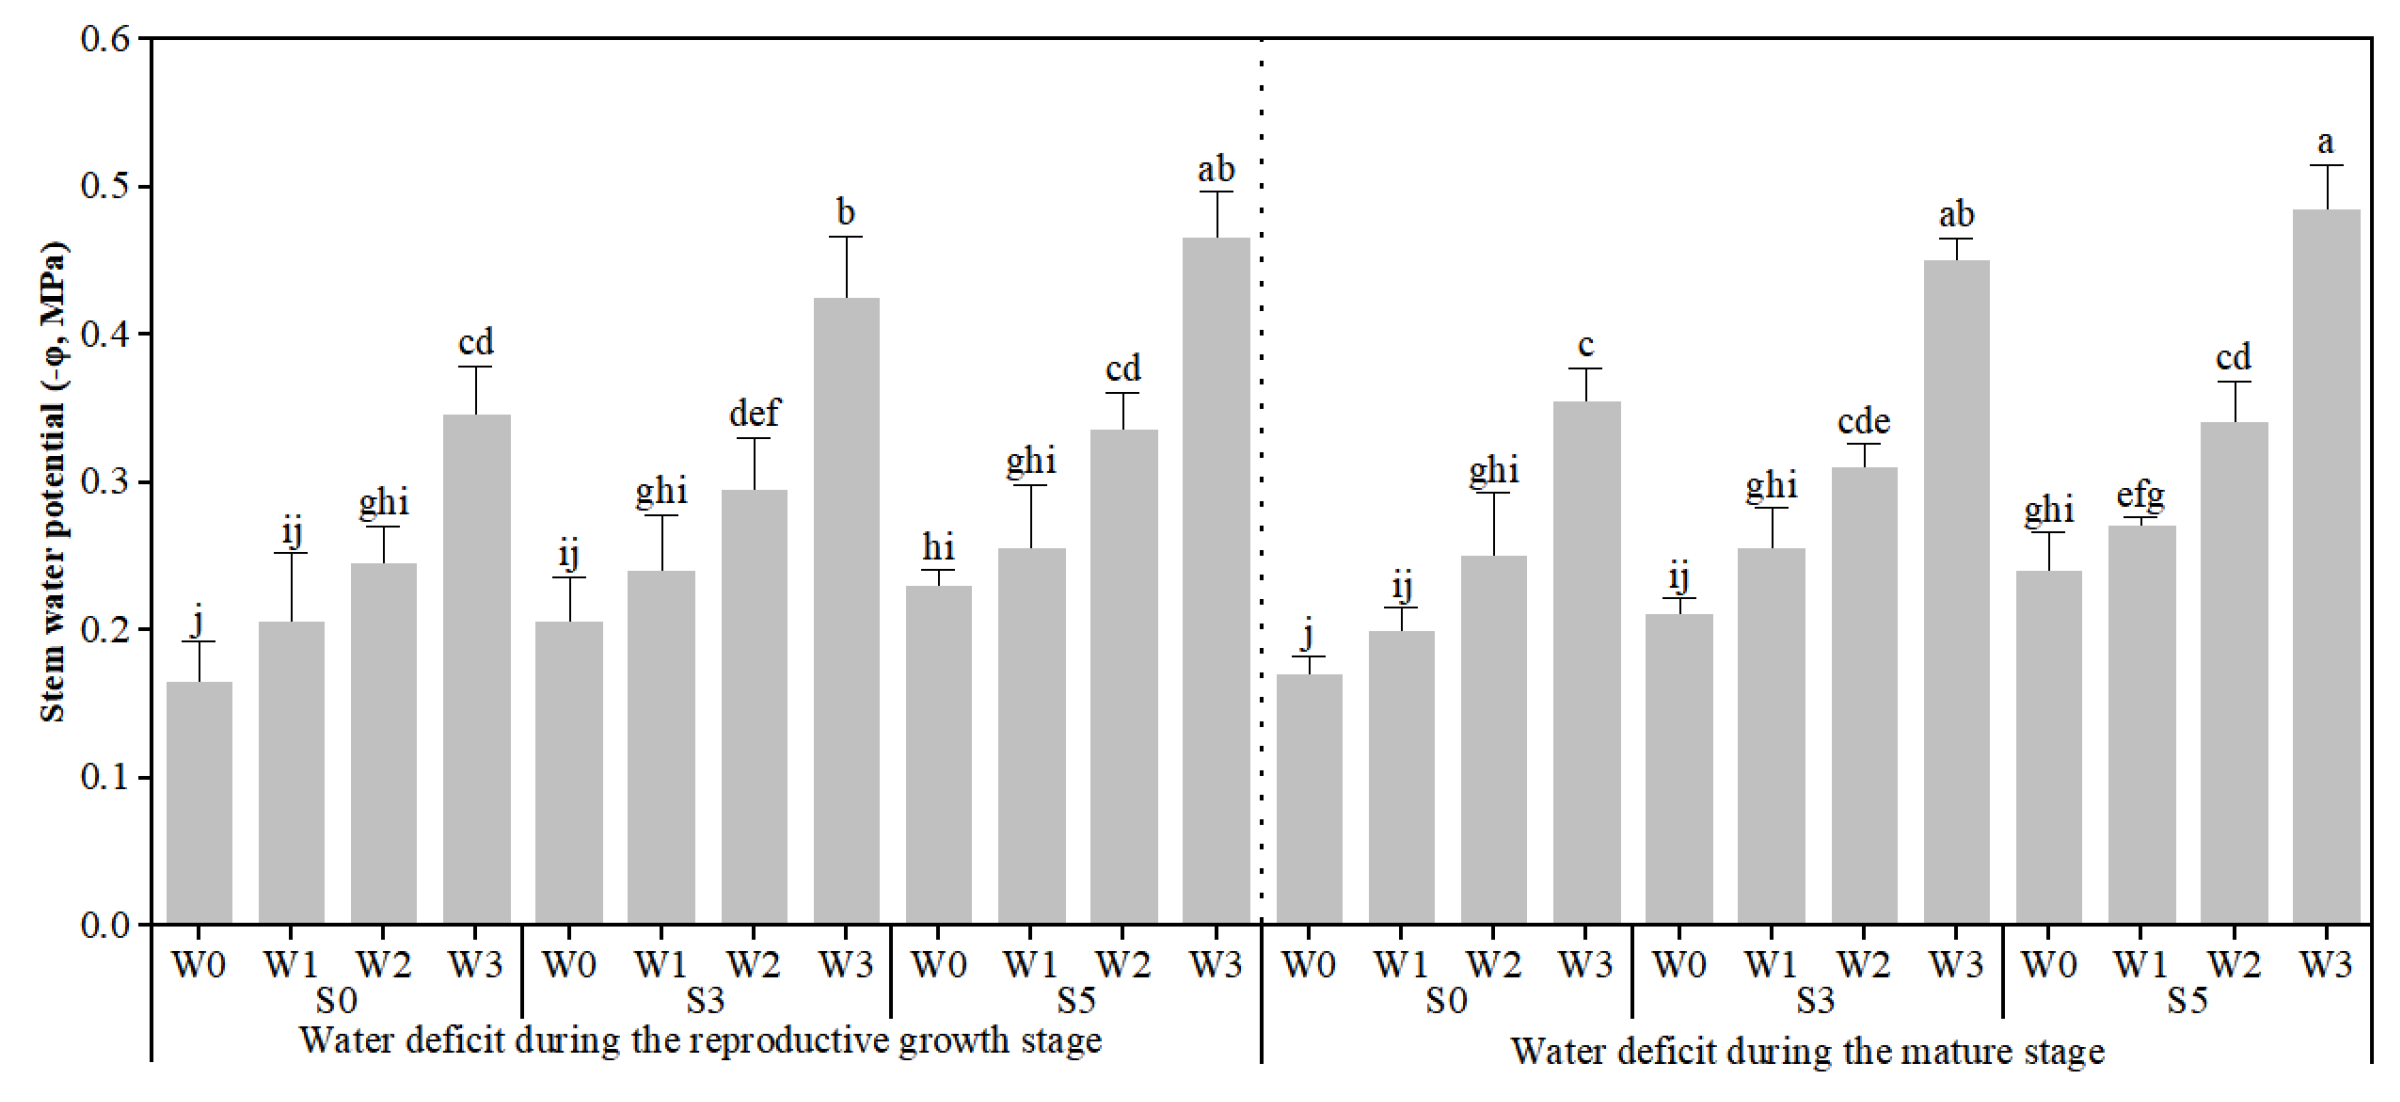
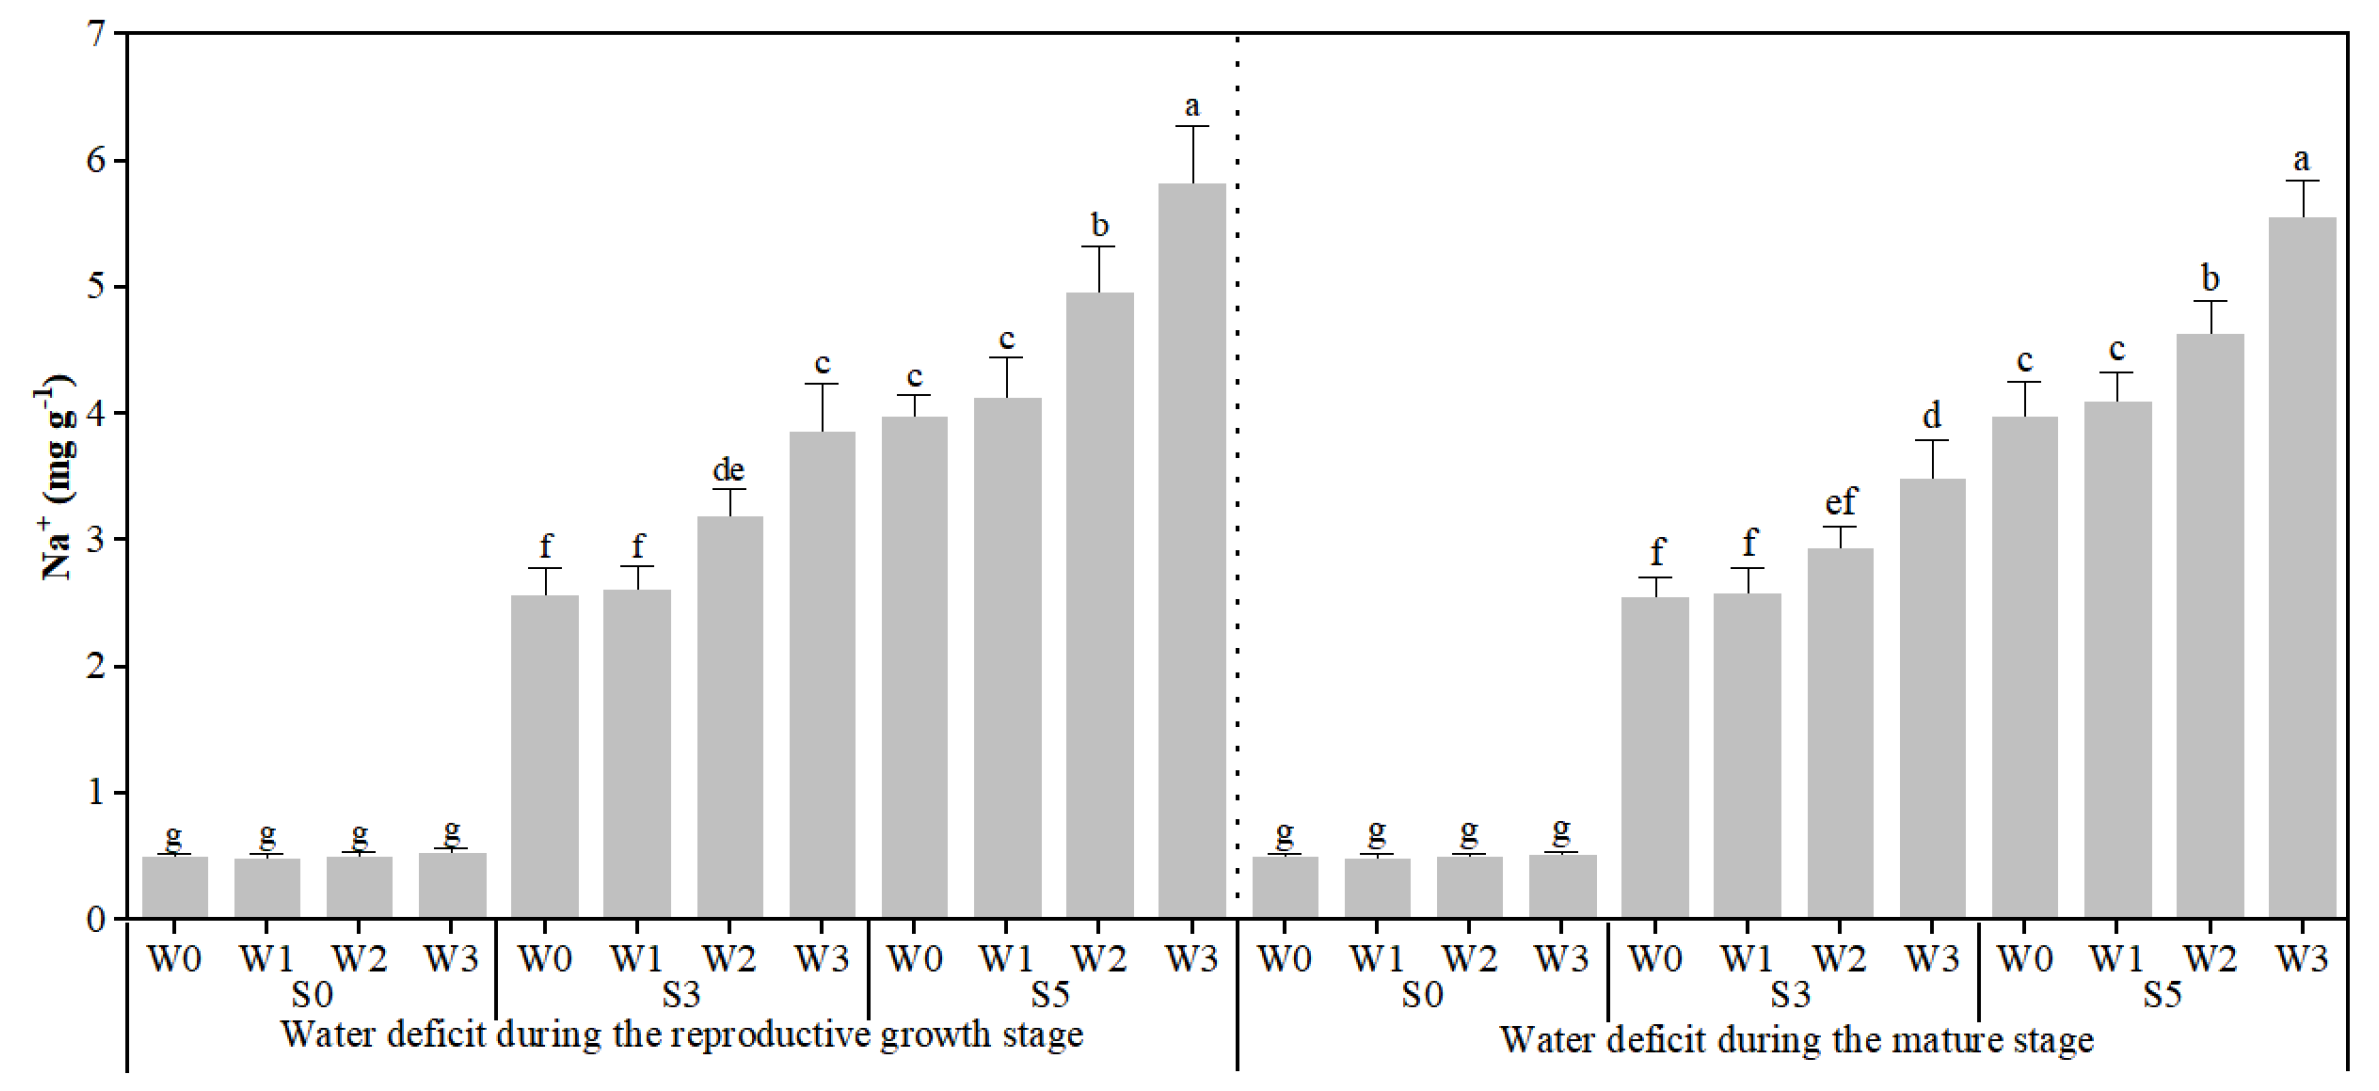
3.2. Response of Plant Stem Water Potential, Fruit Osmotic Potential, and Fruit Sodium Content to Different Stages of Water Deficit Under Soil Salinity

The soil salinity and water deficit both significantly affected plant stem water potential (φ) and had significant interaction effects (Table 3). The stem water potential decreased with increasing soil salinity and water deficit, and soil salinity enhanced the decreasing effect of water deficit on plant stem water potential (Figure 5). The effect of water deficit on stem water potential was not significantly affected by the stage of water deficit.
Soil salinity, water deficit, and stage of water deficit all significantly affected fruit osmotic potential (φπ) (Table 3). The effect of water deficit on fruiting was greater under both S3 and S5 soil salinity than under S0 soil salinity. There was a significant interaction between soil salinity and water deficit on fruit osmotic potential, with soil salinity enhancing the reduction in fruit osmosis by water deficit, with the interaction being synergistic. There was a significant interaction between the effects of water deficit and water deficit stage on fruit osmotic potential. The fruit osmotic potential of the S5W3 treatment at the fruit’s mature stage was significantly greater than that of the S5W3 treatment at the reproductive growth stage (Figure 6). Water deficit at the fruit’s mature stage had a greater effect on fruit infiltration than water deficit during reproductive growth.
There was significant linear correlation between fruit soluble sugar content and osmotic potential (Figure 7). Water deficit at reproductive growth and fruit ripening stages had similar effects on the linear relationship between fruit soluble sugar content and fruit osmotic potential under different soil salinities. The straight lines of regression of fruit soluble sugar content against osmotic potential under both S3 and S5 soil salinity were significantly different from the regression line of soluble sugar content against osmotic potential under S0 soil salinity.
Water deficit increased the Na+ content of tomato fruits, but there was no significant effect. Soil salinity significantly increased fruit Na+ content, and there was a significant interaction between soil salinity and water deficit (Table 3). The fruit Na+ content of W3 treatment under S3 and S5 soil salinity was significantly higher than that of W3 treatment under S0 soil salinity (Figure 8). Water deficit significantly increased the Na+ content of fruits under soil salinity. The water deficit stage did not significantly affect the role of water deficit in enhancing the accumulation of Na+ in fruit under soil salinity.

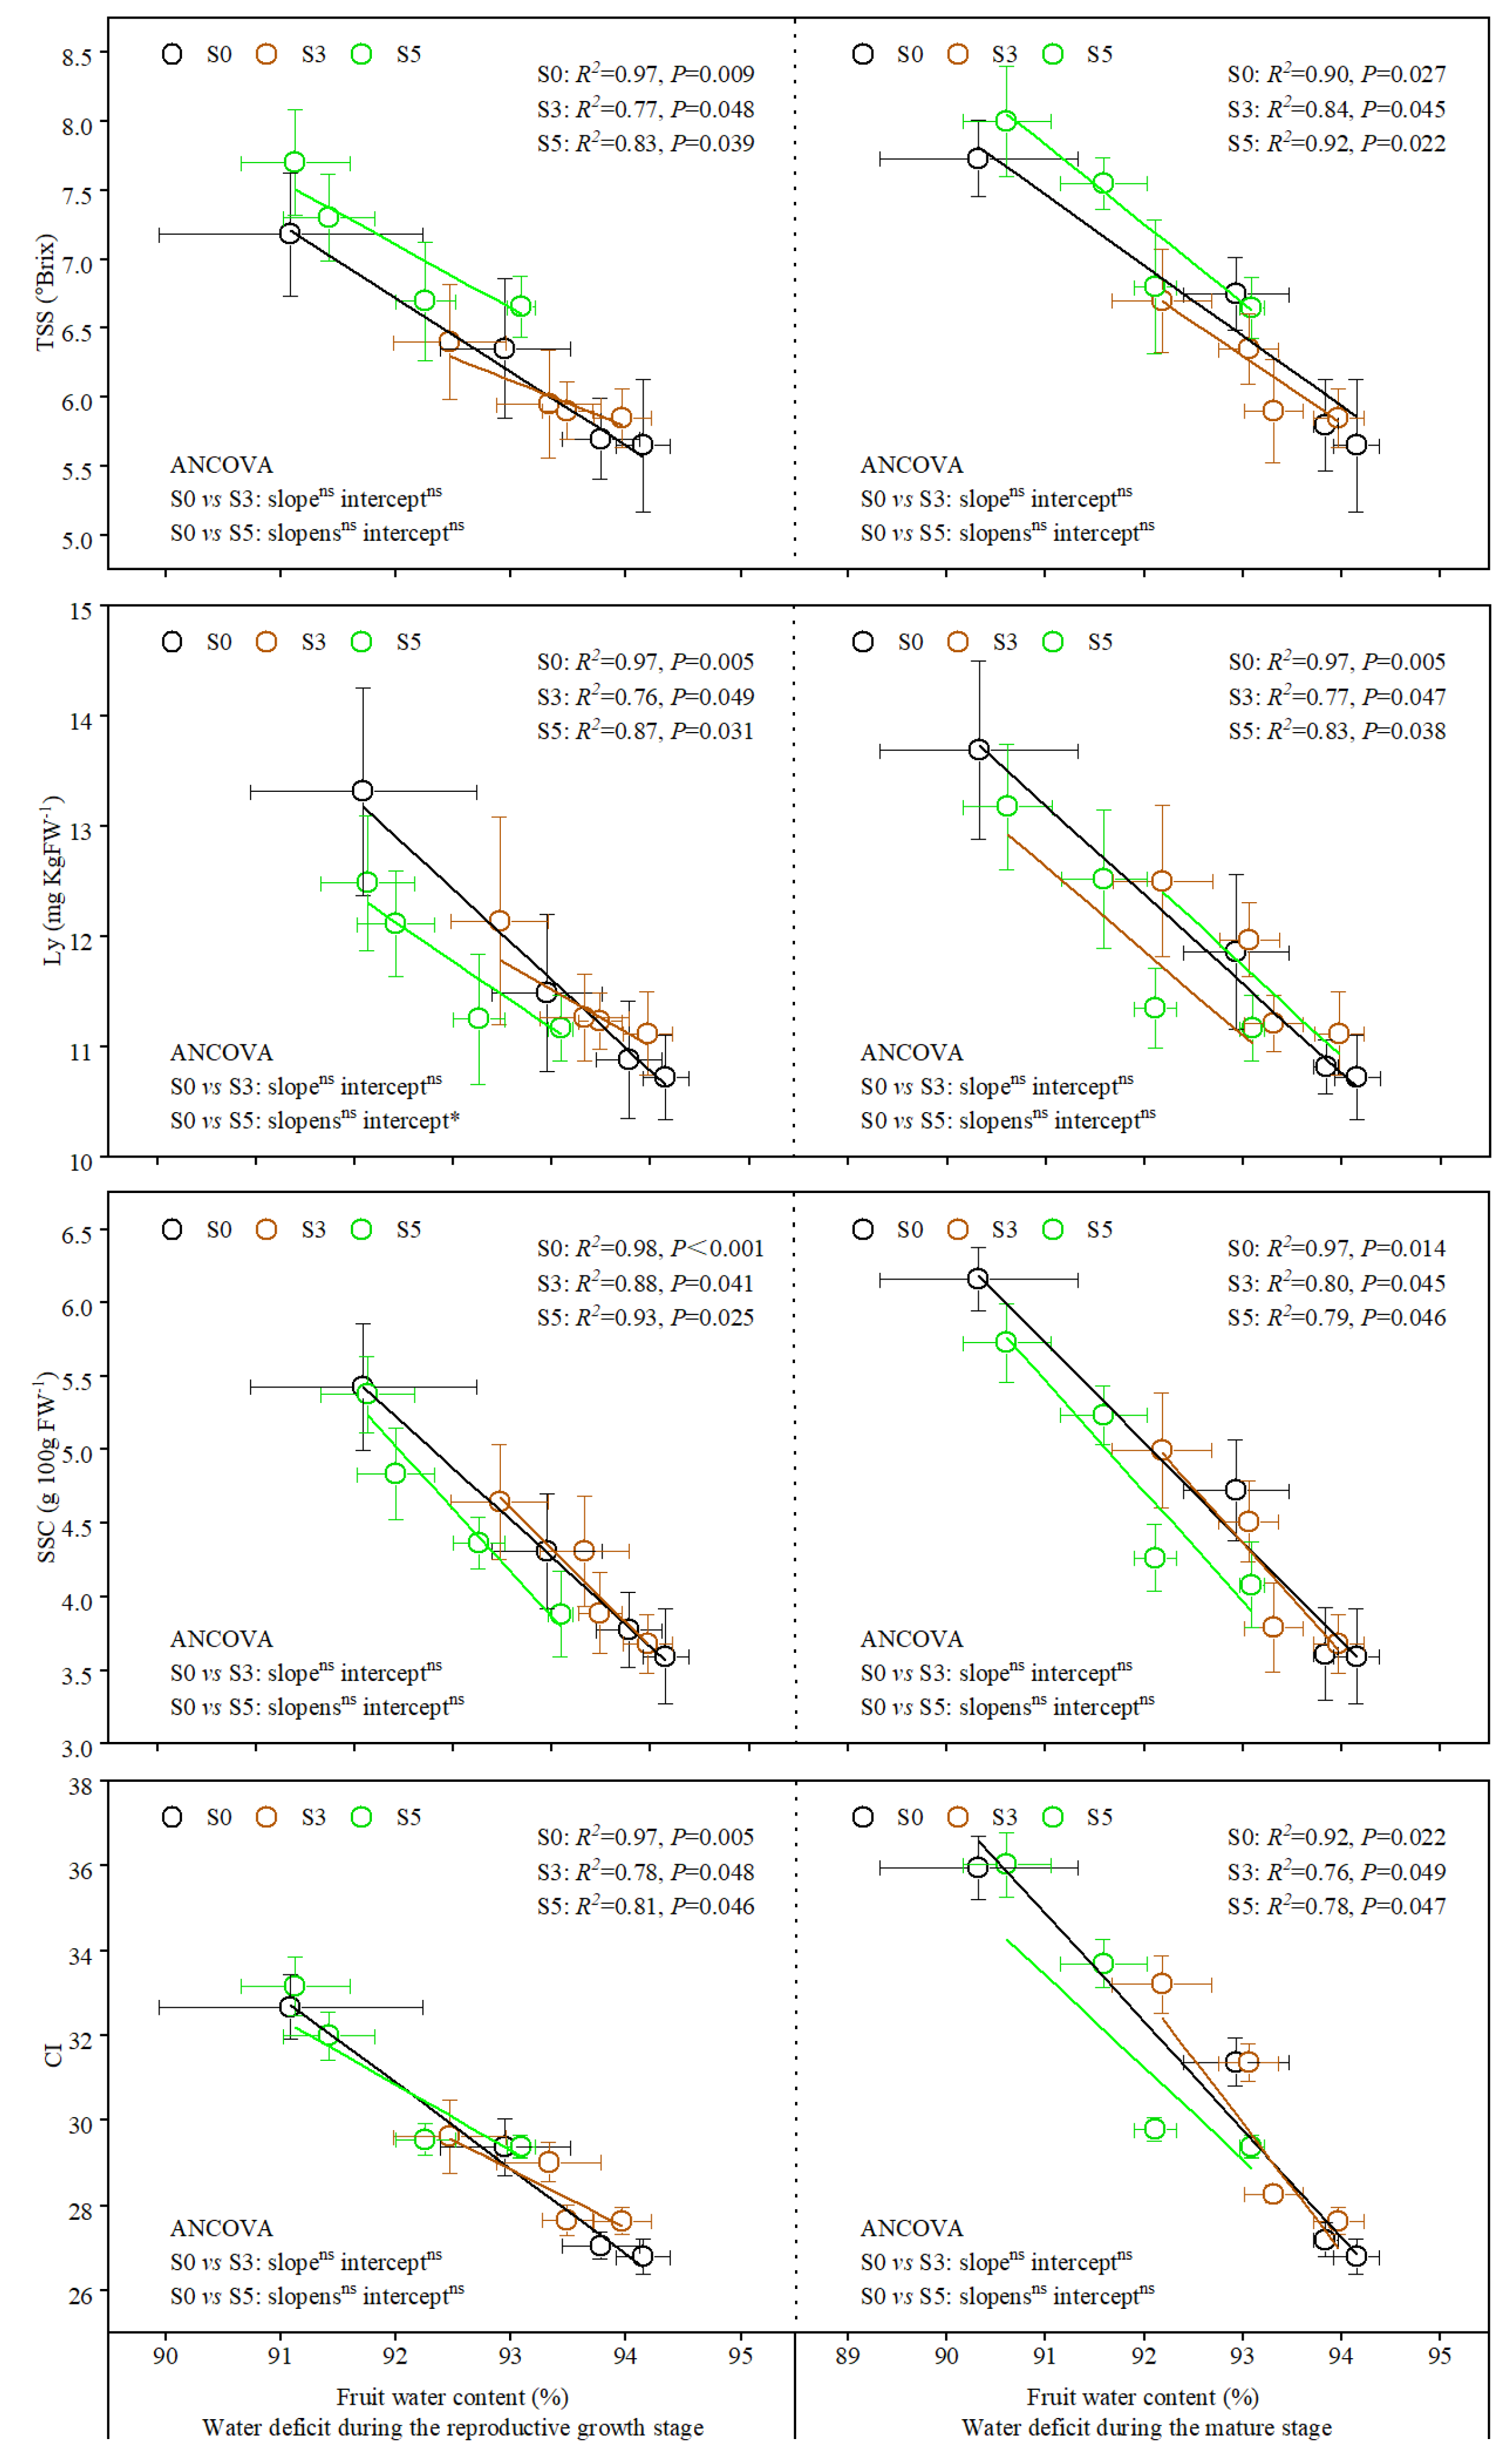
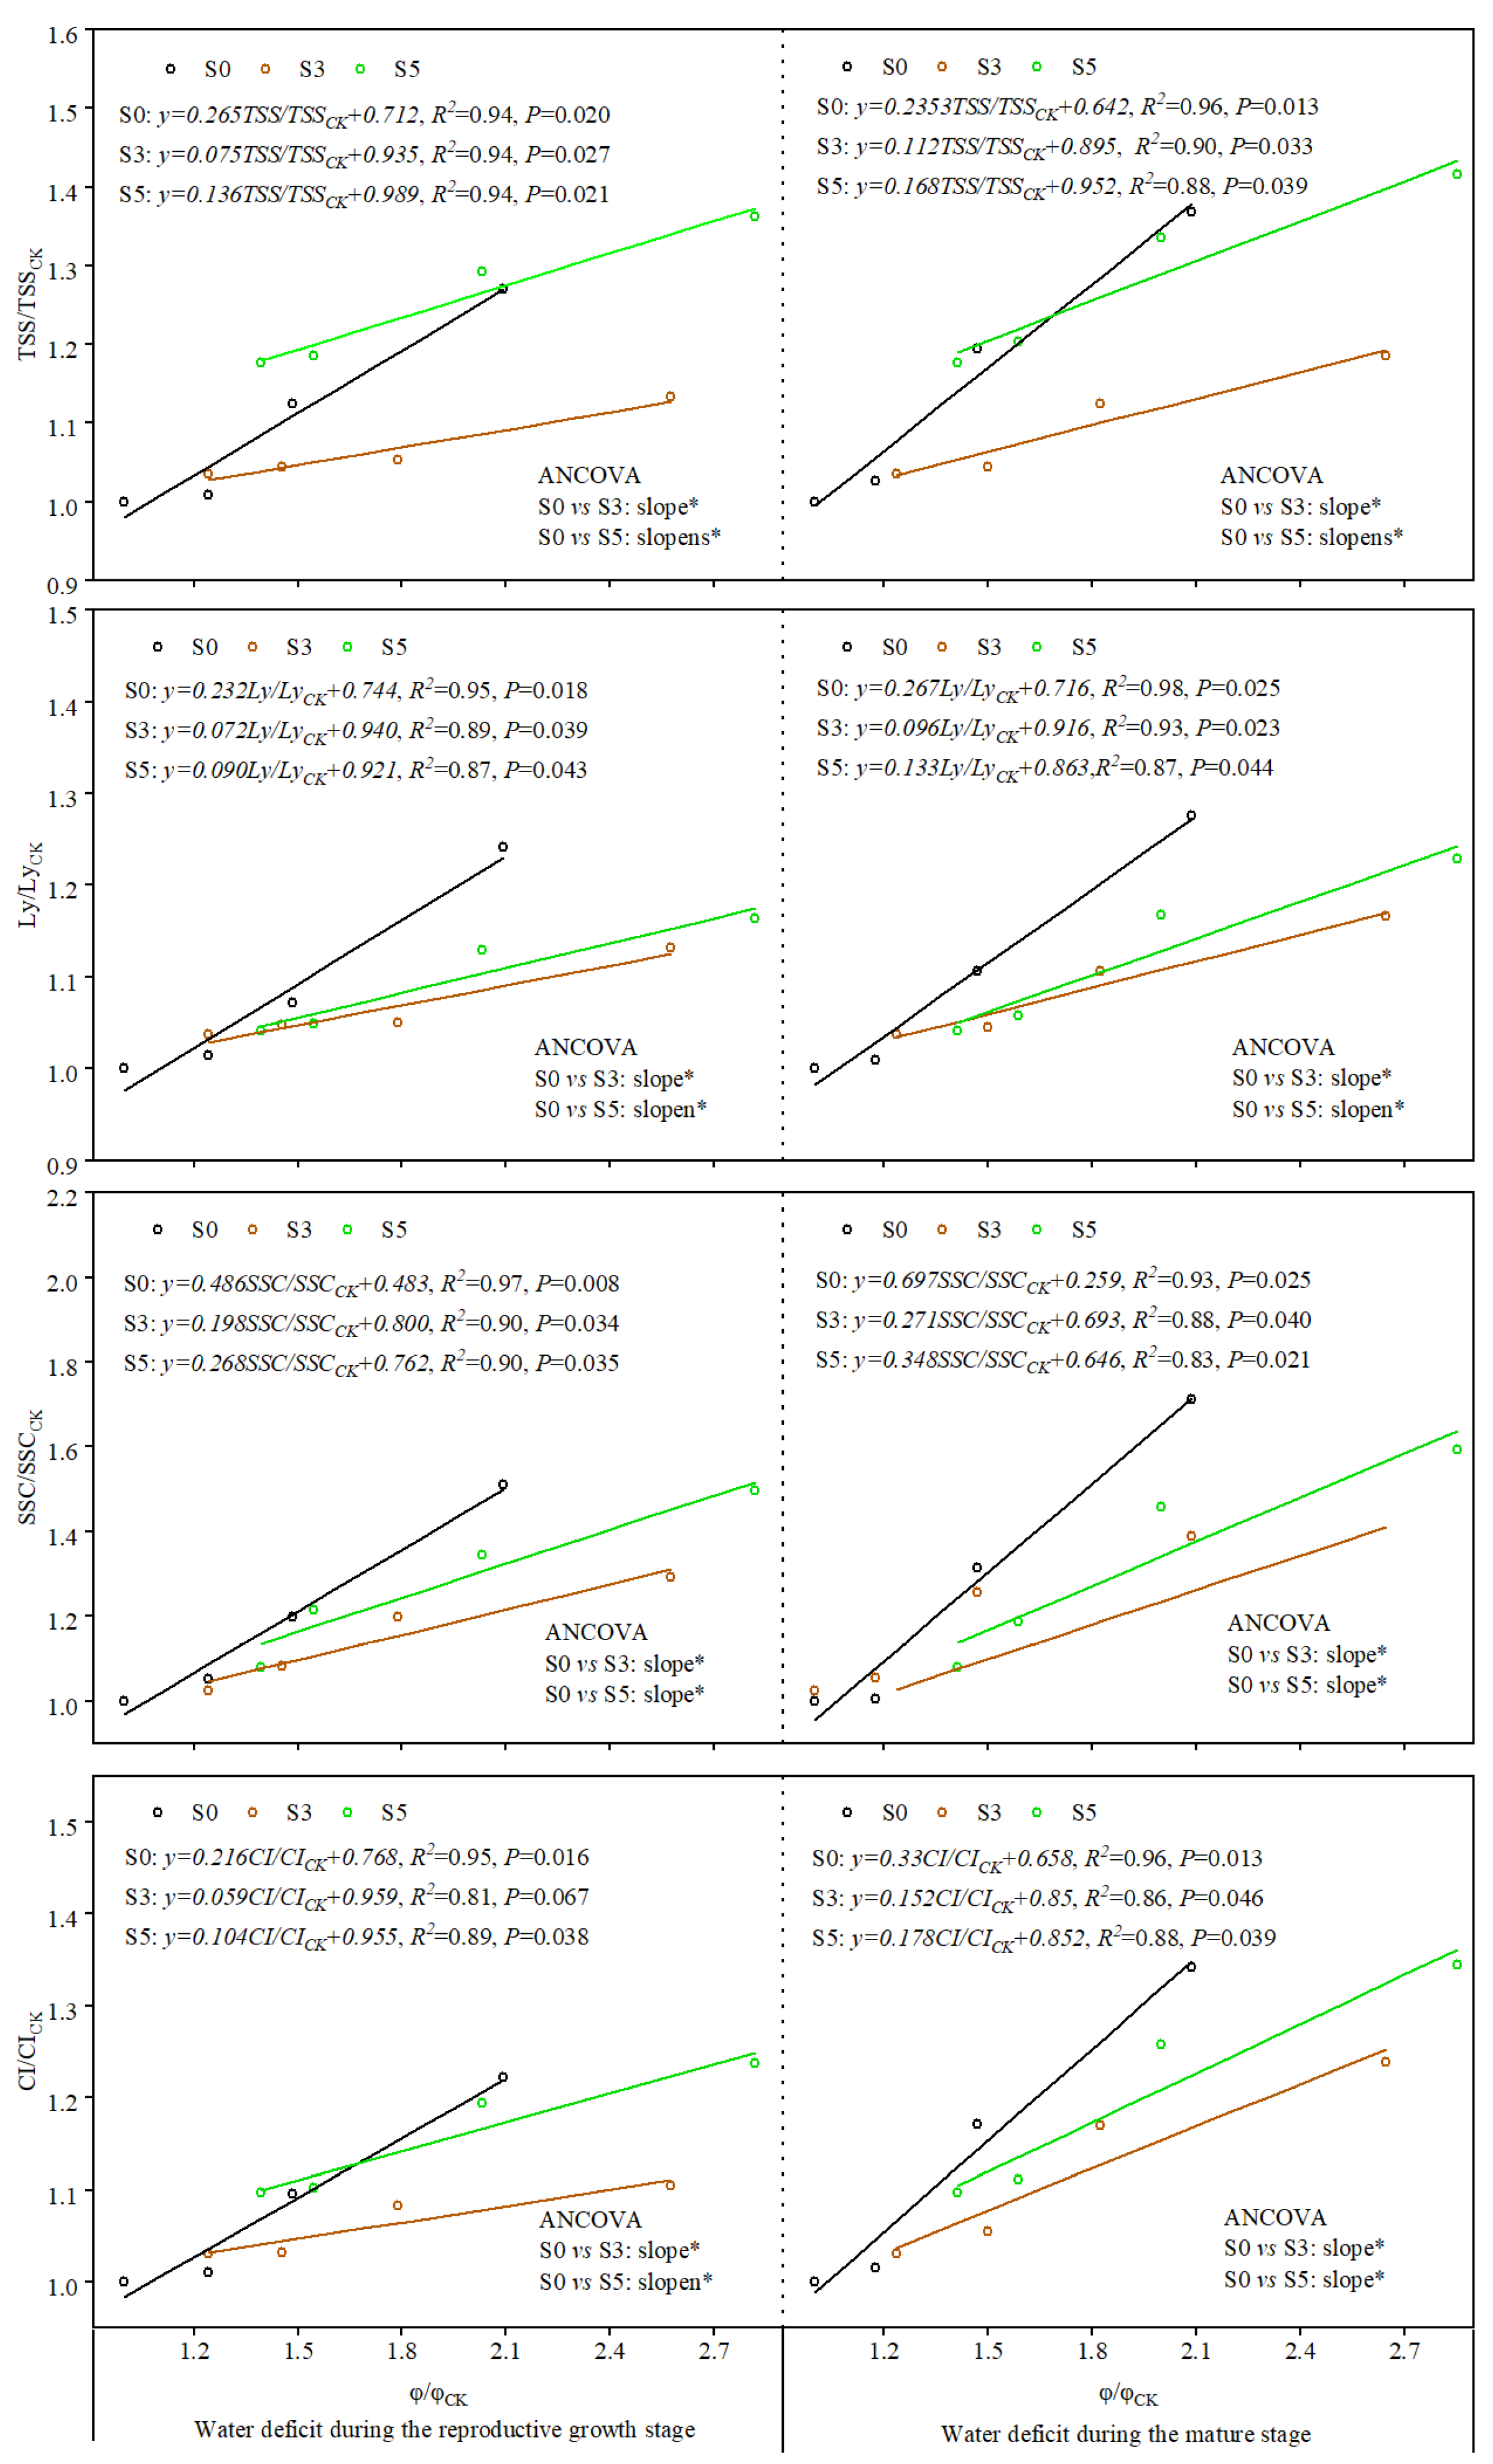
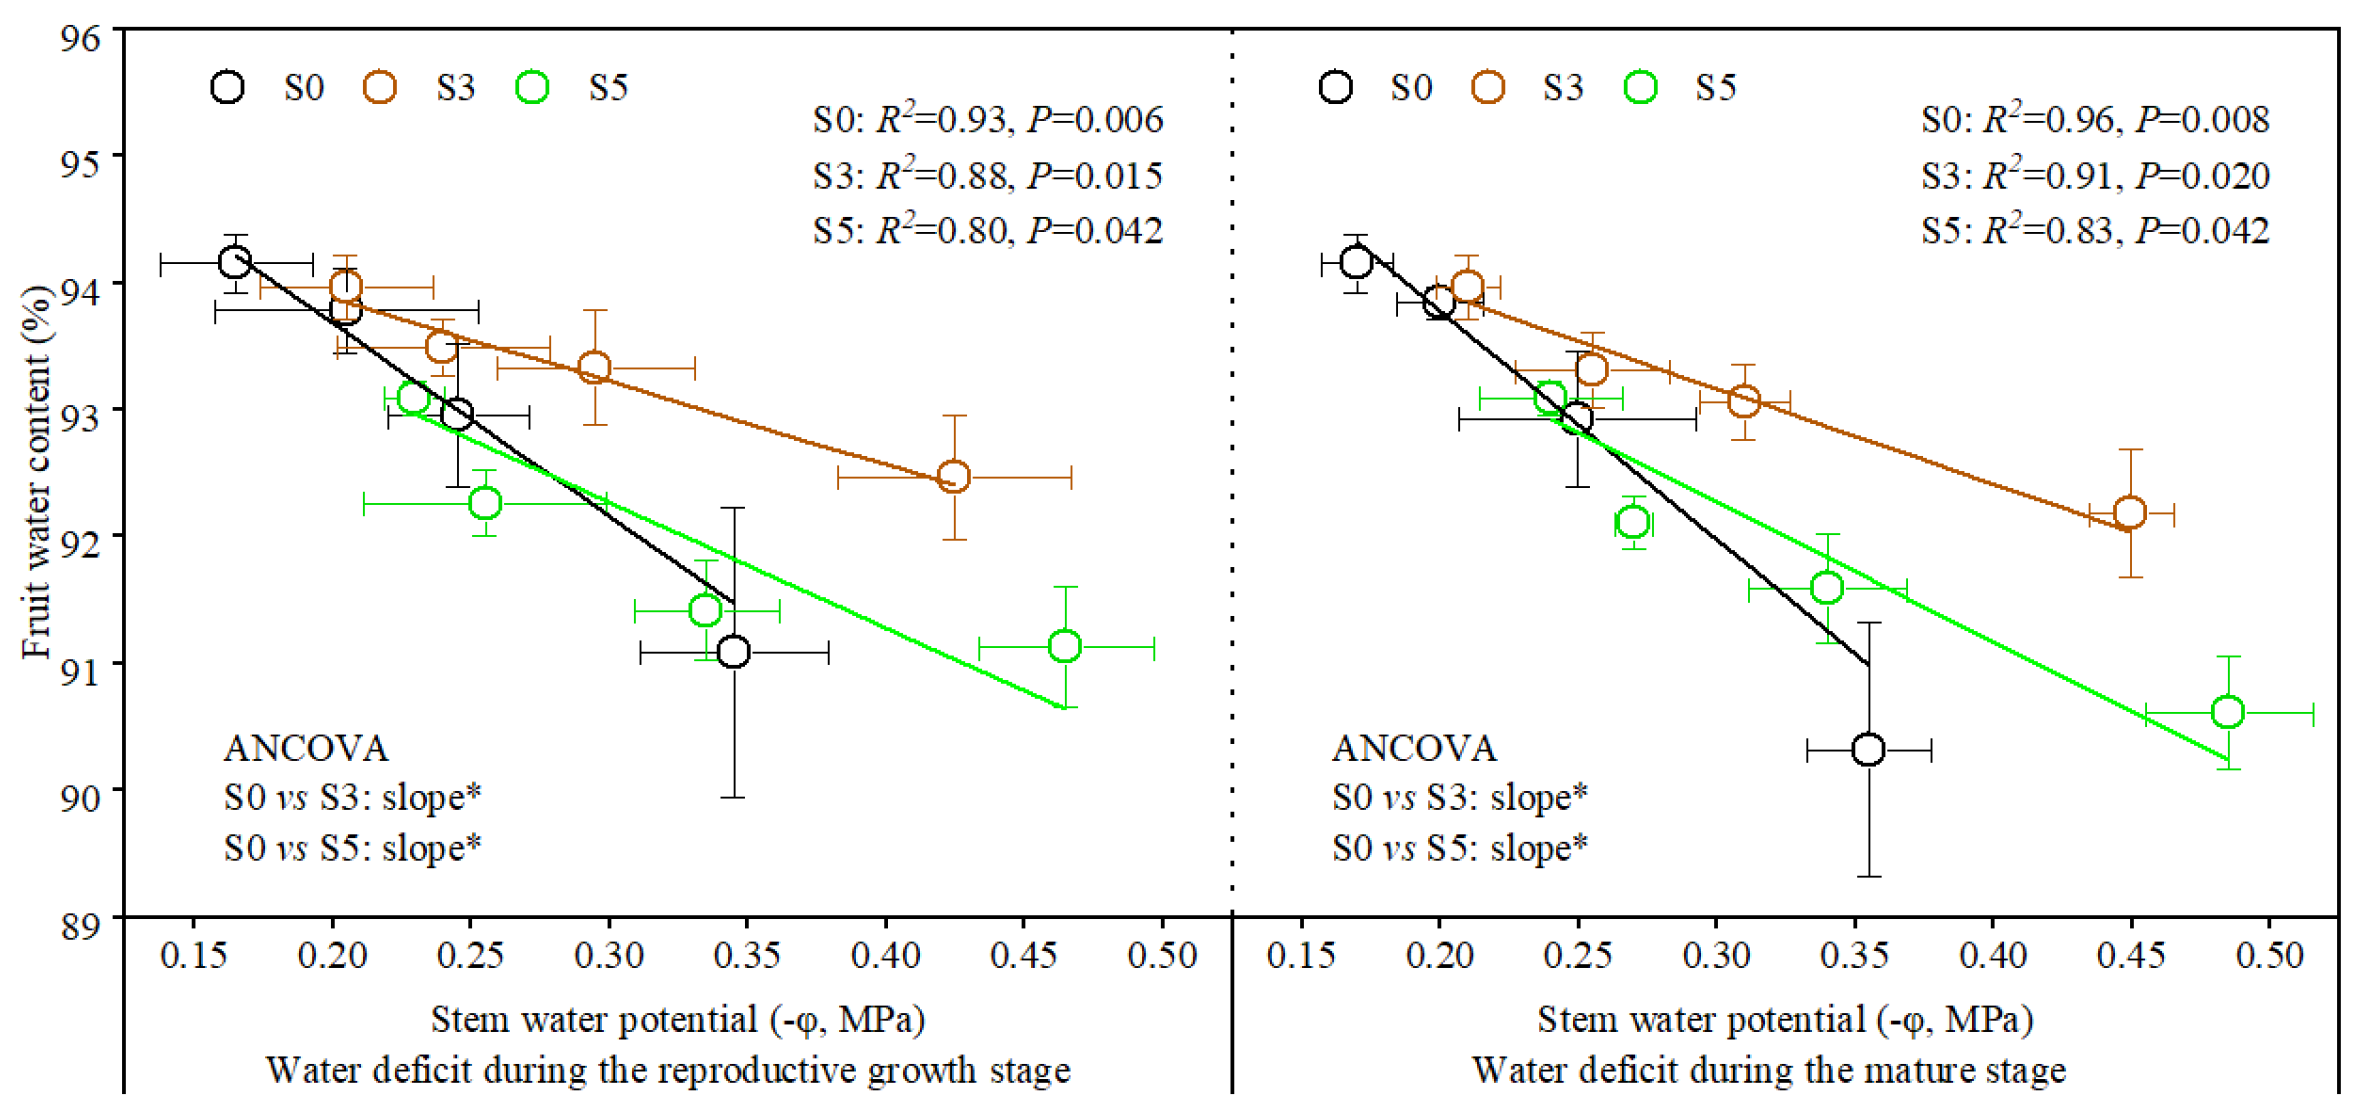
3.3. Relationship of Plant Stem Water Potential with Fruit Quality Parameters and Water Content

The relative stem water potential was significantly and linearly correlated with the relative fruit quality parameters, with coefficients of determination exceeding 0.8 at the reproductive growth stage and at the fruit’s mature stage (Figure 9). The straight lines of regression between relative stem water potential and relative fruit quality parameters under S3 and S5 soil salinity were significantly different from those between relative stem water potential and relative fruit quality parameters under S0 soil salinity. For the slope of the regression line, soil salinity significantly reduced the slope of the regression line between relative stem water potential and relative fruit quality parameters. The slope of the regression line between relative stem water potential and relative fruit quality parameters decreased and then increased with increasing soil salinity. The slopes of the regression lines of relative stem water potential and relative fruit quality parameters under S0, S3, and S5 soil salinity were S0, S5, and S3, respectively, from largest to smallest.
There was a significant linear correlation between stem water potential and fruit water content (Figure 10). The relationship between stem water potential and fruit water content under soil salinity was less affected by the stage of water deficit. The stem water potential was significantly and linearly correlated with the fruit water content, with a coefficient of determination exceeding 0.8 under S0, S3, and S5 soil salinity. The straight lines of regression between stem water potential and fruit water content under S3 and S5 soil salinity were significantly different from those between stem water potential and fruit water content under S0 soil salinity. The slope of the regression straight line also increases and then decreases with soil salinity.

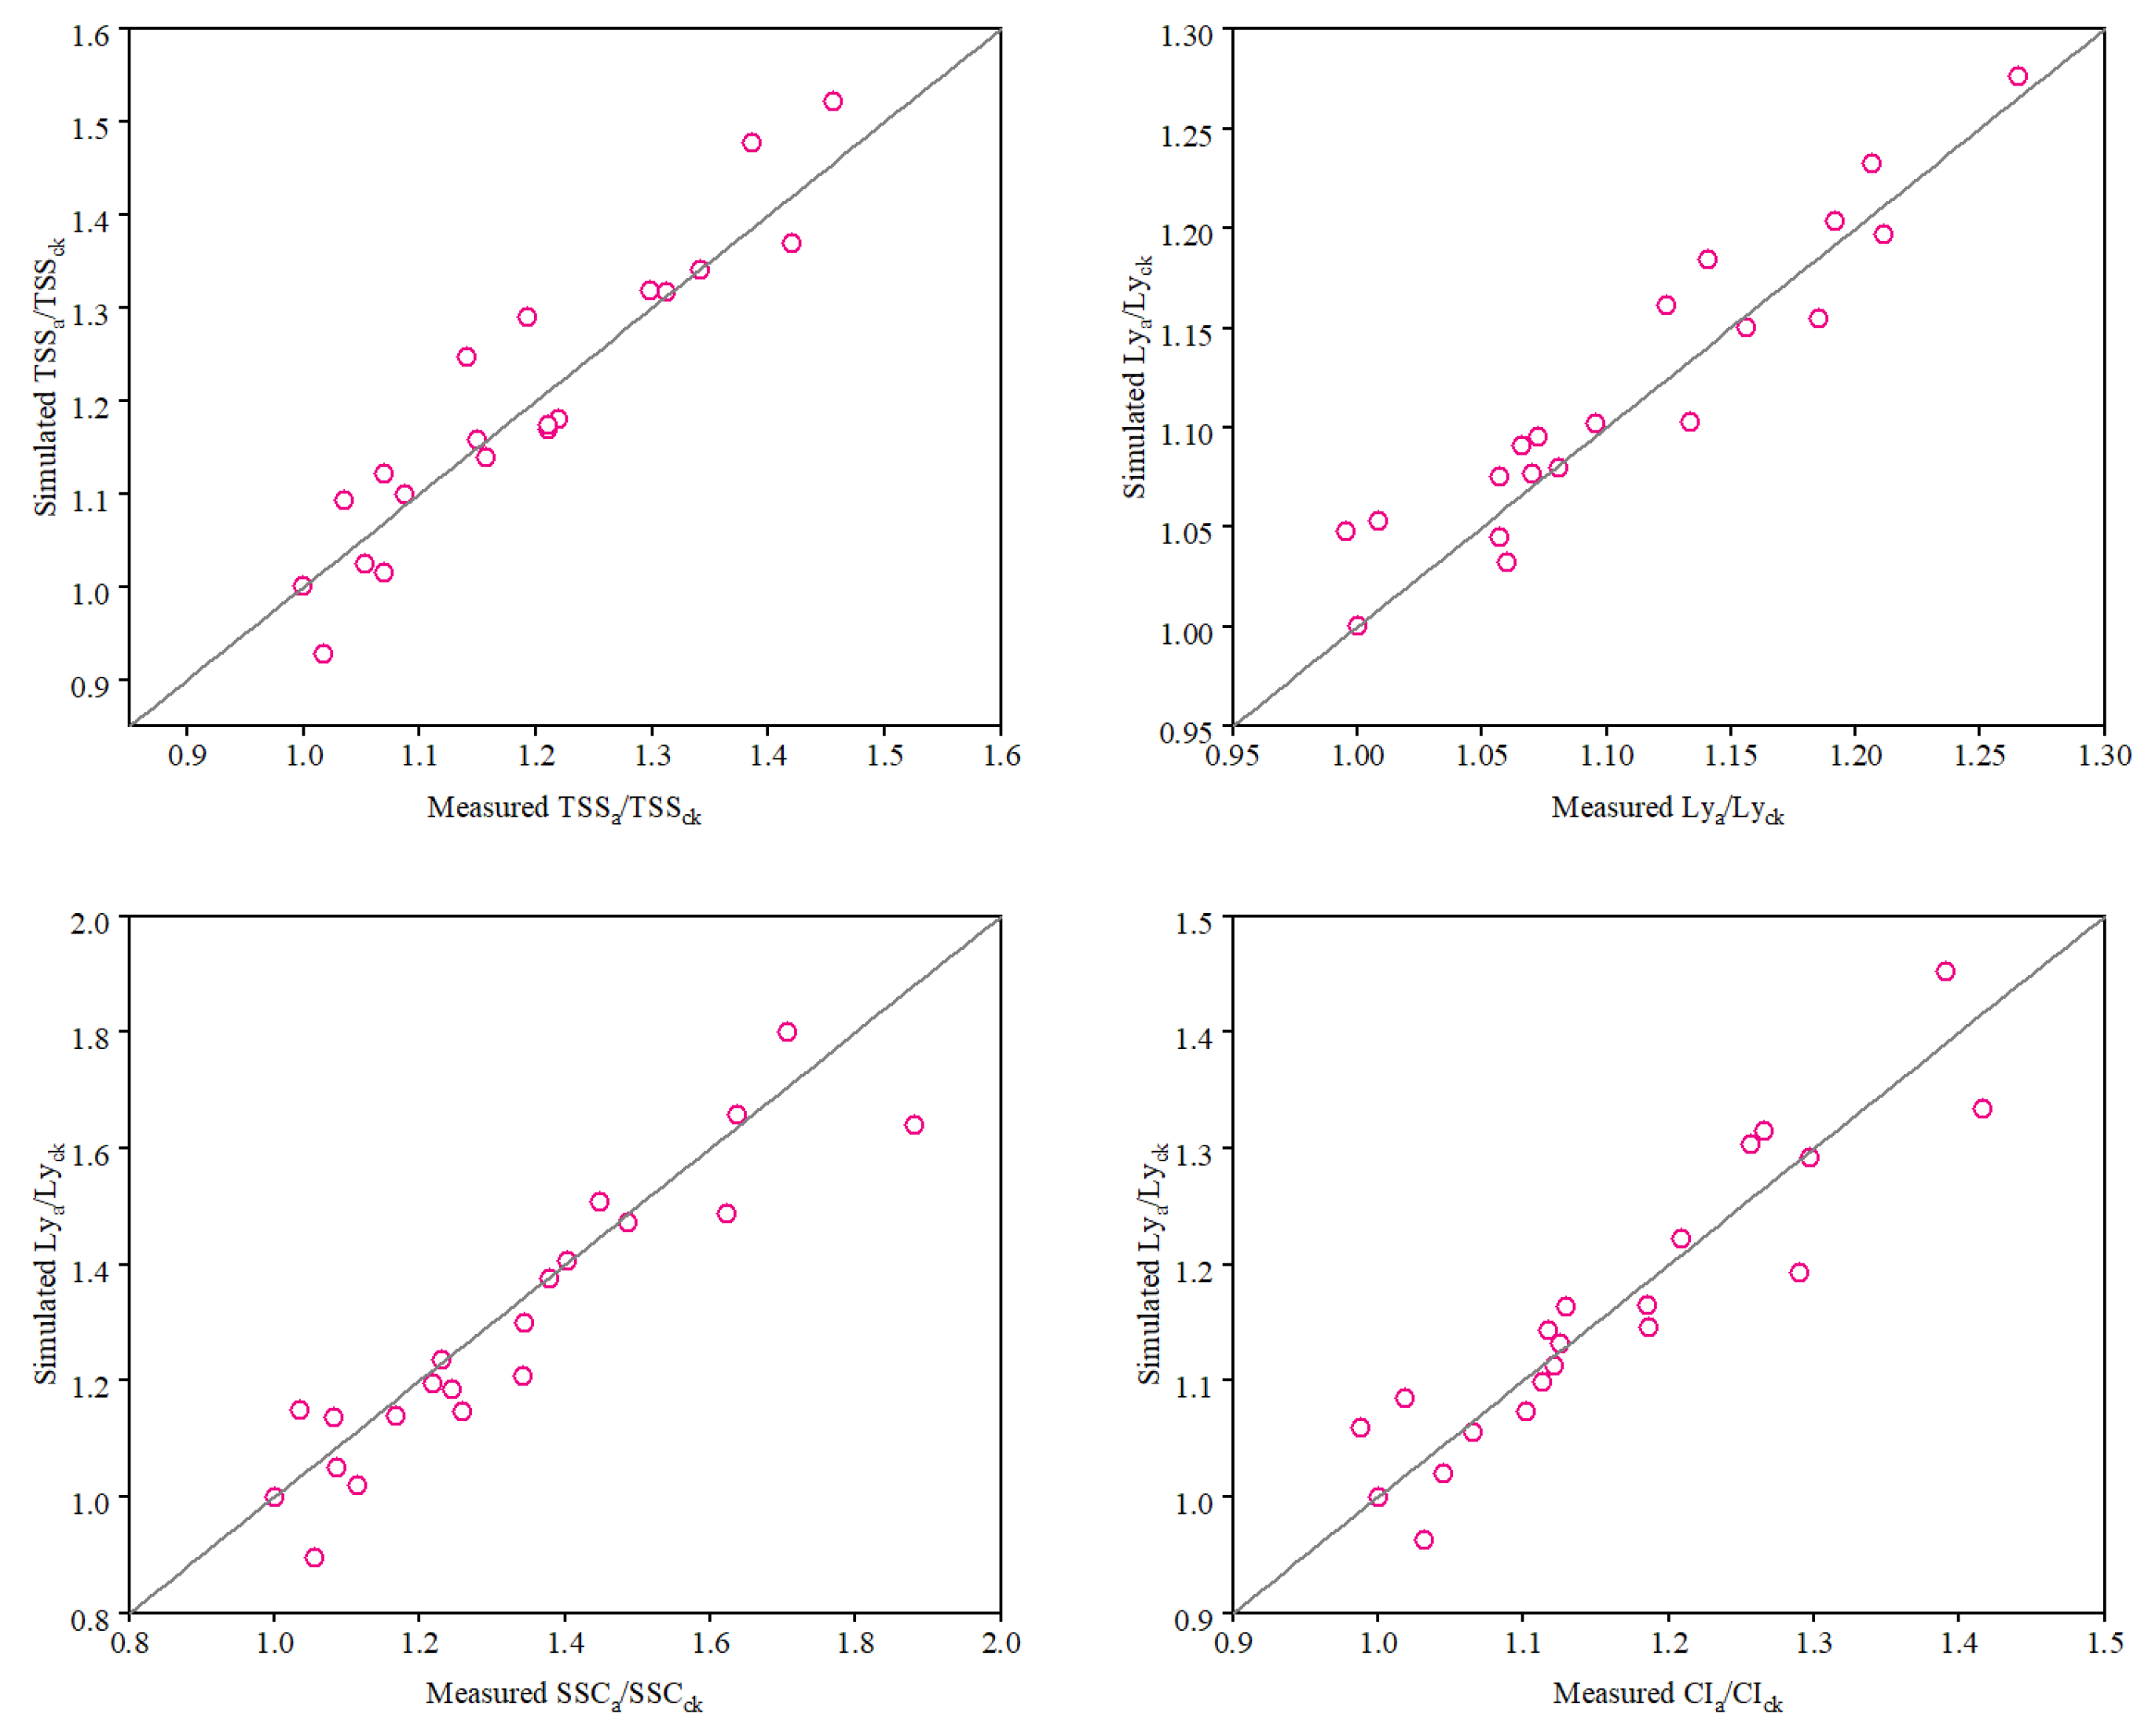
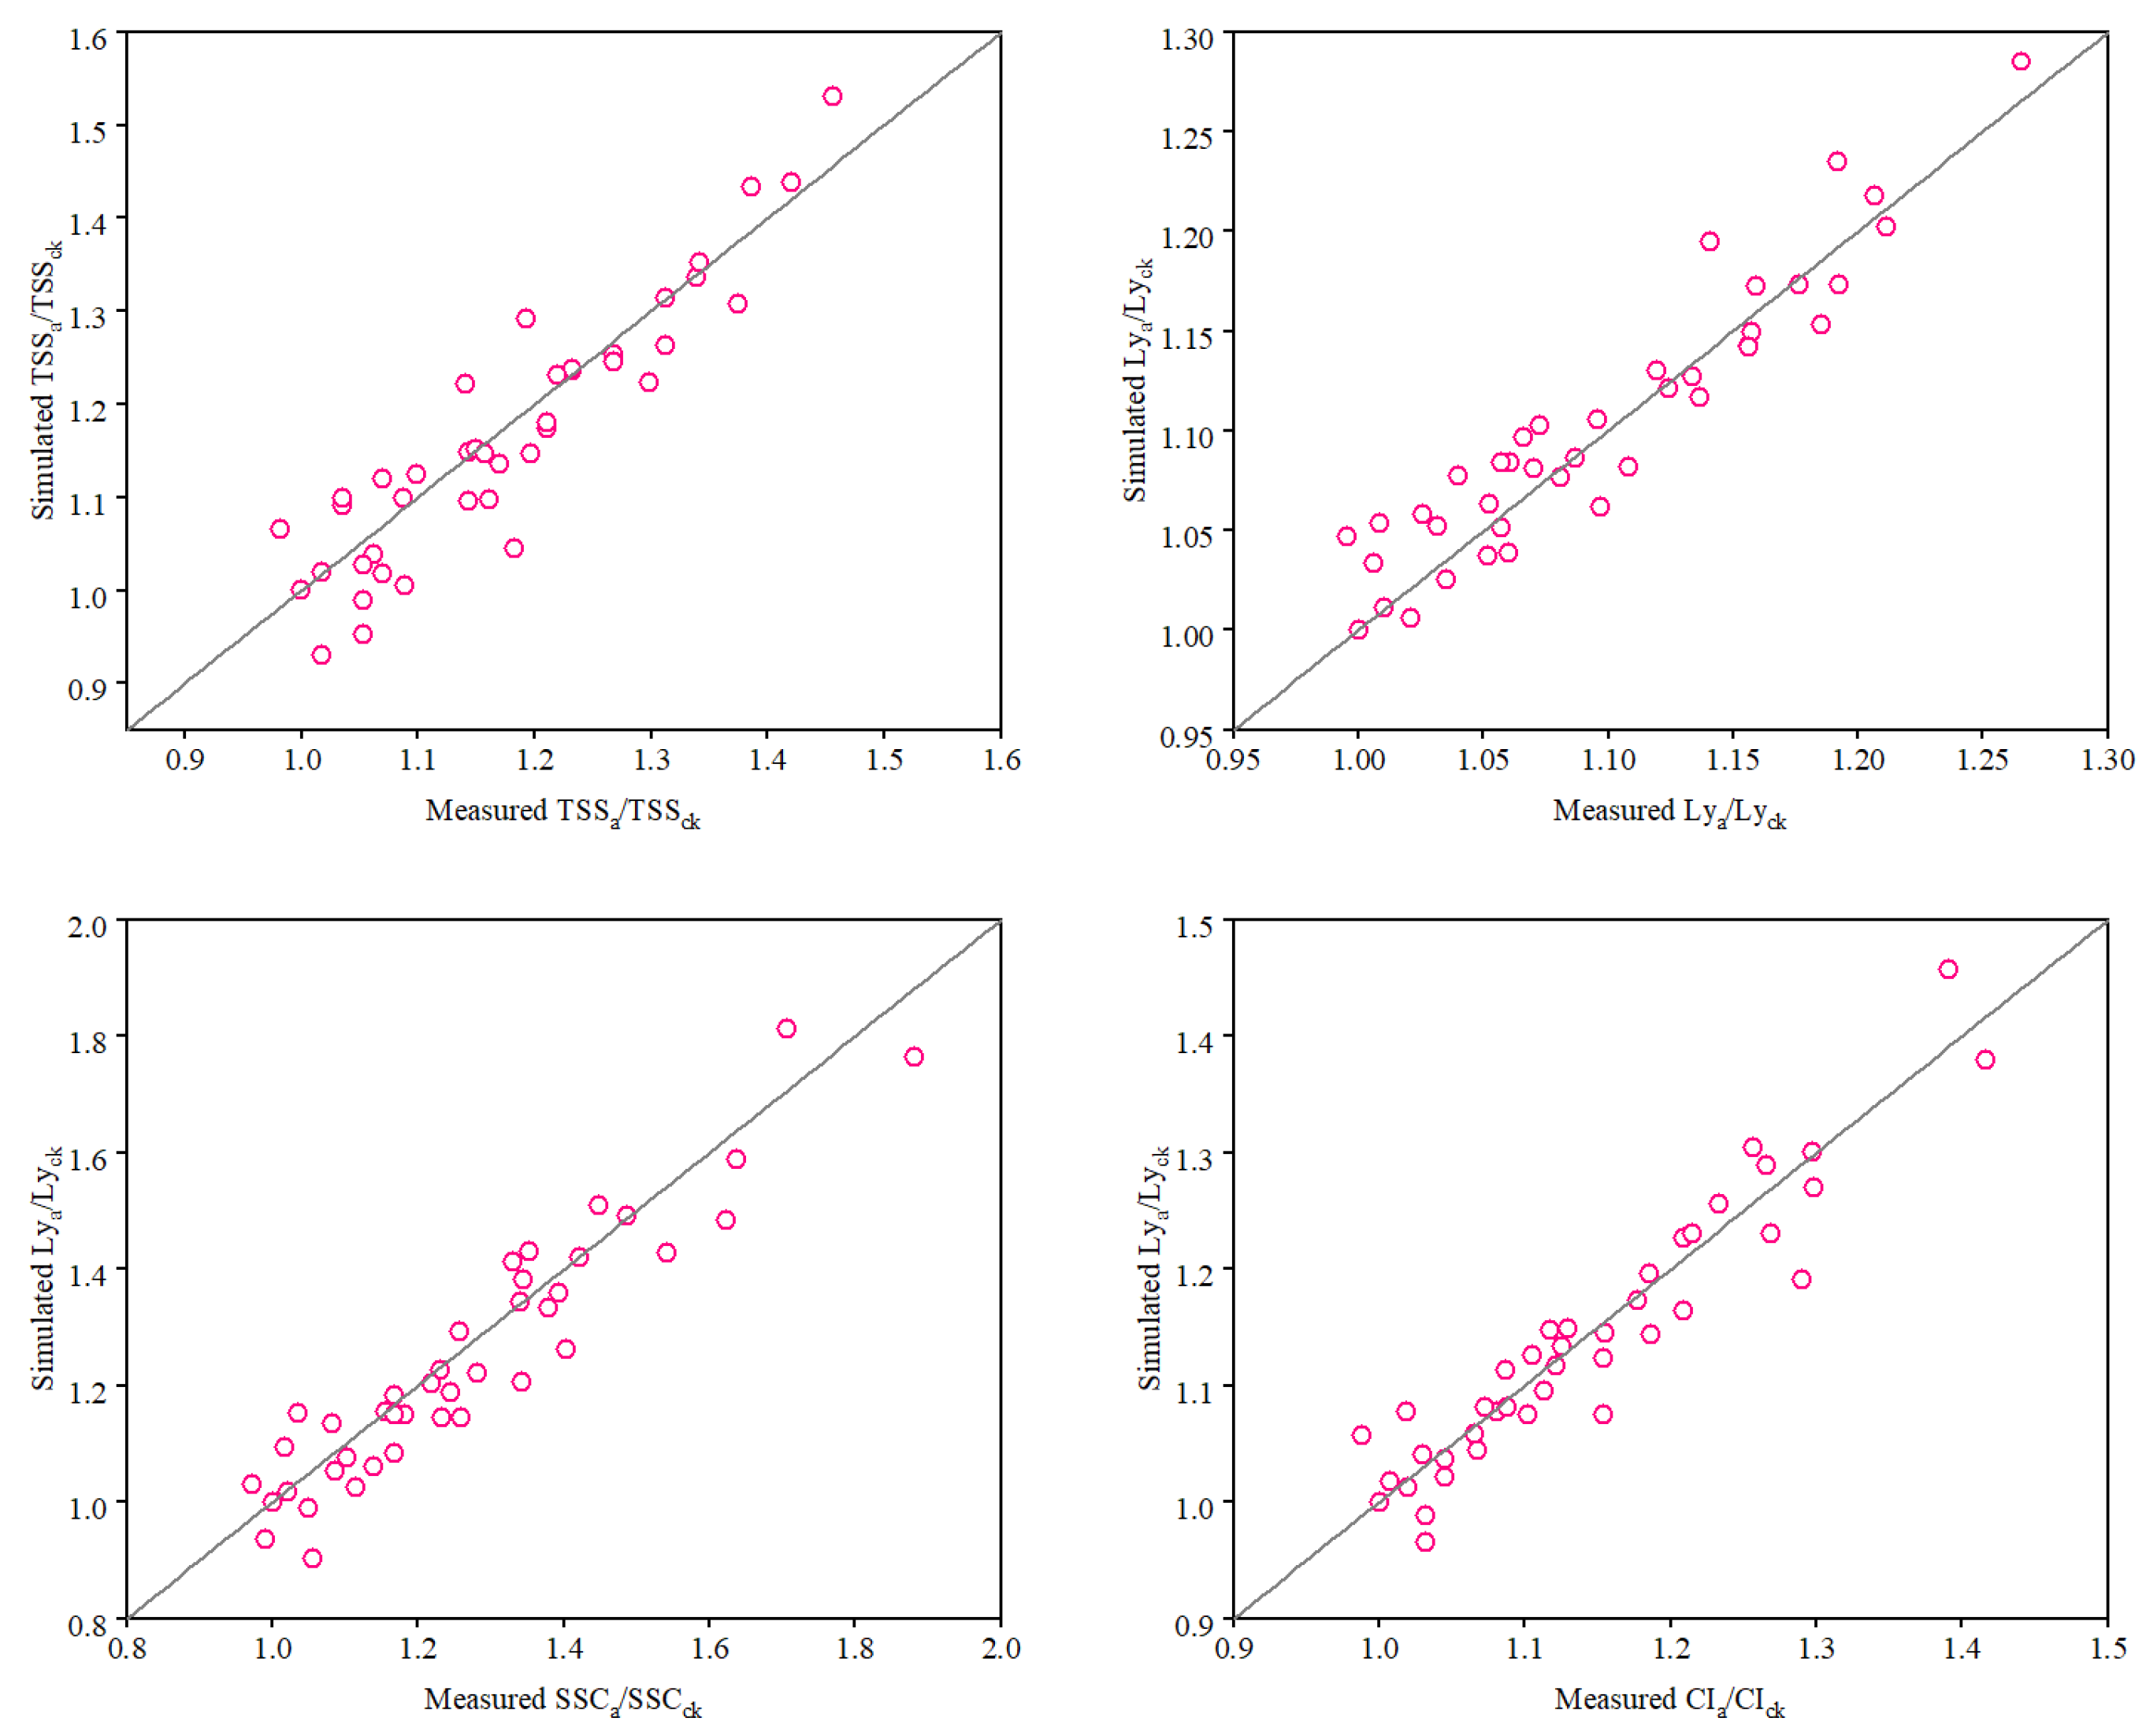
3.4. Calibration and Validation of the Tomato Fruit Quality Function Model

The parameters in Equation (1) were calibrated with 2019 data, and the results are shown in Table 4. For the calibration results of TSS, LY, SSC, and CI, the R2 was 0.91, 0.94, 0.86, and 0.92 (Table 5), respectively, indicating that the changes in tomato fruit quality due to water deficit under soil salinity could be better modeled by Equation (1) with plant stem water potential as input. The larger sensitivity index of a fruit quality parameter to changes in stem water potential indicated that the quality parameter was more affected by changes in stem water potential. The absolute value of the sensitivity index at the reproductive growth stage was greater than the sensitivity index at the fruit’s mature stage, indicating that changes in stem water potential at the fruit’s mature stage had a greater effect on fruit quality than changes in stem water potential at the reproductive growth stage.
Equation (1) was validated with 2020 data, and the simulated and measured values were able to correspond well (Figure 11). The slope b and coefficient of determination R2 of the linear regression equation between measured and simulated values over the origin, the root mean square error (RMSE), average absolute error (AAE), modeling efficiency (EF), and the Willmott parameter of agreement (dIA). When fruit quality was modeled with Equation (1), b ranged from 0.971 to 1.013, R2 were all greater than 0.85, RMSE and AAE were all less than 0.1, EF were all greater than 0.90, and dIA were all greater than 0.95 (Table 5). The validation results further show that Equation (1) could be better used for the response of tomato fruit quality to water deficit under soil salinity.
The Q-Multiplicative was validated with 2019 and 2020 data, and the simulated and measured values were able to correspond well (Figure 12). When fruit quality was modeled with Q-Multiplicative, b ranged from 0.979 to 1.005, R2 were all greater than 0.80, RMSE and AAE were all less than 0.1, EF were all greater than 0.90, and dIA were all greater than 0.95 (Table 6). Although the Q-Multiplicative was slightly less effective in simulating fruit quality parameters relative to Equation (1), the Q-Multiplicative’s use of soil water content and conductivity as inputs greatly improves the ease of model application. The overall simulations of tomato fruit quality responses to water deficit under soil salinity using soil water content and conductivity as inputs through Q-Multiplicative were able to achieve better results.

4. Discussion

Processing tomato fruit quality had a significant impact on the cost of making ketchup, as well as on the quality of the ketchup. It had been widely demonstrated in various studies that water deficit and soil salinity could improve tomato fruit quality to some extent. Tomato fruit quality was defined as the nutrient content, which was determined by both the amount of nutrients and the water content. The results of this study show that all the quality indexes of tomato fruits responded to water stress, salt stress, and combined stress in a similar pattern, and the fruit quality increased with the increase in stress level (Figure 2). Take the example of water deficit during the reproductive growth period. The TSS content of S5W0, S0W3, and S5W3 was increased by 17.70%, 36.82%, and 41.59% relative to S0W0, respectively. Relative to the increase in fruit TSS content, S5W0, S0W3, and S5W3 decreased their fresh weight per fruit by 6.08%, 40.31%, and 62.39%, respectively, relative to S0W0 (Figure 3). The improvement in tomato fruit quality under stress was not due to an increase in the mass of nutrients. Analysis of fruit water content showed that S5W0, S0W3, and S5W3 had 1.13%, 3.25%, and 3.21% lower fruit water content relative to S0W0 (Figure 3), respectively. The decrease in fruit water content may be the main reason for the increase in quality indicators [30,31]. Concentration effects had also been previously shown to be the main reason for the increase in fruit quality due to osmotic stress [32,33]. Differences in the response of fruit water content to water deficit at different stages of development led to differences in the effect of water deficit on final fruit water content [6], which in turn led to differences in fruit quality (Figure 2).
Although fresh weight per fruit and fruit water content differ in their sensitivity to water and salt stress, fruit nutrient yield was closely related to fruit water content [34]. The continuous influx of photosynthates into tomato fruits requires the certain concentration gradient, but the reduction in fruit water content decreases the concentration gradient between the leaves and the fruit, leading to an impediment in the influx of photosynthates into the fruit [35,36]. This may be an important reason for the fresh weight per fruit of tomato fruits under water stress, salt stress, and combined stress (Figure 3). In addition, the reduced input of photosynthates in the fruit and the reduced concentration of fruit matter affected the water potential gradient between the fruit and the plant, leading to a further reduction in fruit water content [37]. The mutual coordination of fruit water input and carbon input under water and salt stress together determined the final tomato fruit fresh weight, fruit water content, and fruit quality. Although there are many similarities between the effects of water and salt stress on crops, tomato fruit quality formation involves complex physiological and biochemical responses, leading to differences in the effects of water and salt stress on fruit quality. Therefore, when modeling tomato quality simulation under water and salt stress, there is a need to find an indicator that can characterize both water stress and salt stress. In addition, it is important to clarify the key factors that differentiate the effects of water stress and salt stress on fruit quality. Previous studies have shown that plant water status is a good indicator of the degree of plant exposure to water stress and salt stress [38]. In this study, the response of tomato fruit quality to stem water potential was used as an entry point for functional modeling.
Ion accumulation in the fruit under salt stress mitigated the effects of osmotic stress on the water potential gradient between the plant and the fruit relative to water stress, thereby reducing the effects of osmotic stress on fruit water input and photosynthate input [12]. The results of the present study also show that the fresh weight of fruits under S3 soil salinity was higher than S0 soil salinity when subjected to water deficit (Figure 3). Under the same osmotic stress (similar stem water potential), plants under salt stress exhibit stronger osmotic regulation due to ion absorption, allowing for them to better maintain water status under osmotic stress [25,39]. Soil salinity significantly increased Na+ content in fruits; in addition, water deficit enhanced Na+ content in tomato fruits under soil salinity (Figure 8). Previous studies had also shown that a moderate increase in ion content within the fruit could reduce the effect of osmotic stress on fruit osmotic pressure, better ensure the uptake of water and photosynthetic products, and maintain fruit growth [12]. It was also shown that ion accumulation also affects photosynthetic product inputs by influencing the difference in sucrose concentration between the fruit and the mother [40]. The impact of water and salt stress on tomato fruits begin with changes in plant water status, and plants resist/adapt to changes in plant water status through various physiological and biochemical adjustments [41,42]. The impact of water input was prioritized over photosynthate input, which may be why various quality indexes of tomato fruits were strongly correlated with fruit water content. There was a significant linear correlation between tomato fruit quality and fruit water content under water stress, salt stress, and combined stress (Figure 4). For fruits, changes in water input and photosynthetic product input were also the result of adaptation to changes in plant water status. The results of this study also show a good correlation between plant stem water potential and fruit water content. In addition, there were significant differences in the relationship between plant stem water potential and fruit water content under different soil salinities (Figure 10). It is possible that the special effects of salt stress relative to water stress resulted in significant differences in the changes in fruit water content with plant stem water potential under different soil salinities.
The relationship between plant stem relative water potential and fruit relative quality parameters also verified the feasibility of simulating tomato fruit quality through stem water potential and provided theoretical support for simulating fruit quality through plant stem water potential (Figure 9). Significant differences in the regression straight lines of relative fruit quality indexes and relative stem water potential under different soil salinities indicate that soil salinity should be taken into account when modeling fruit quality based on stem water potential.
Tomato fruit quality formation and fruit yield formation were inextricably linked. This study draws on the segmented water production function form to develop a tomato fruit quality model mediated by plant stem water potential. The results show that Equation 1 had a good simulation effect with R2 exceeding 0.8 in simulating TSS, LY, SAR, and CI of tomato fruits under combined water and salt stresses (Table 4). The sensitivity coefficient of fruit quality indicators to stem water was negative due to the fact that tomato fruit quality improved as stem water potential decreased. The absolute value of the sensitivity coefficient for the reproductive growth period was smaller than that for the fruit ripening period, suggesting that tomato fruit quality was more sensitive to water deficit during fruit ripening than during the reproductive growth period, echoing most previous studies [43,44]. The simulated values of tomato fruit quality obtained through Equation (1) have a good correspondence with the measured values.
Q-Multiplicative simulated tomato fruit TSS, LY, SAR, and CI using soil water content and salinity as inputs, and the R2 were all higher than 0.8, indicating that the model was able to explain the data variability better, and the RMSE were all lower than 0.1, indicating that the model had a high degree of accuracy. In addition, AAE were all lower than 0.1, EF were all higher than 0.95, and dIA were all higher than 0.9 (Table 4). All of these indicated that the Q-Multiplicative established in this study was able to achieve better results in simulating the response of fruit quality indicators to water deficit under soil salinity.

5. Conclusions

The model provides a theoretical approach to the fine management of water and salinity in root zone soils for processing tomato cultivation on saline soils in arid and semi-arid regions. The fruit is able to reduce osmotic potential, maintain fruit water uptake, and mitigate the effects of osmotic stress on fruit water content by accumulating sodium ions. Therefore, soil salinity reduces the effect of water deficit on tomato fruit quality. Stem water potential as an indicator capable of characterizing both salt and water stress is significantly correlated with fruit quality parameters. However, the straight lines of regression for relative stem water potential and relative fruit parameters were significantly different for different soil salinities. Modeling tomato quality with stem water potential as input requires consideration of the specific effects of soil salinity (fruit ion accumulation). The results show that a functional model, referring to the multiplicative form of the water production function form considering the effect of salinity as an input to the stem water potential, achieves better results in simulating the response of tomato fruit quality parameters to water deficit under soil salinity. The Q-Multiplicative model that efficiently predicts tomato fruit quality parameters from soil water content and electrical conductivity is obtained by combining the estimation function of plant stem water potential into a model that simulates fruit quality parameters by stem water potential. The Q-Multiplicative model provides a theoretical approach to the fine management of water and salinity in root zone soils for processing tomato cultivation on saline soils in arid and semi-arid regions.

Author Contributions

Conceptualization, X.Z.; methodology, X.Z.; software, X.Z.; validation, X.Z.; formal analysis, H.L. (Huanhuan Li); investigation, X.Q.; resources, J.W.; data curation, X.Z.; writing—original draft preparation, X.Z.; writing—review and editing, H.L. (Hao Liu) and X.Q.; visualization, X.Z.; supervision, J.W.; project administration, J.W.; funding acquisition, X.Q. All authors have read and agreed to the published version of the manuscript.

Funding

This research was supported by Henan Province Scientific and Technological Research Project (242102110210), Central Public-interest Scientific Institution Basal Research Fund (IFI2024-15), National Natural Science Foundation of China (51790534).

Data Availability Statement

Data are contained within the article. Additional data can be obtained by contacting the first corresponding author of the article.

Conflicts of Interest

The authors declare no conflicts of interest.

Abbreviations

The following abbreviations are used in this manuscript:
θffield capacity
φplant stem water potential
φπfruit osmotic potential
TSStotal soluble solids
Lylycopene
SSCsoluble sugars content
CIcolor index
ECsoil electrical conductivity of 1:5 soil-water extract
S0soil salinity treatment of no salt added
S3soil salinity treatment of 3 g mixed salt added to 1000 g air-dried soil
S5soil salinity treatment of 5 g mixed salt added to 1000 g air-dried soil
W0irrigation treatment of 95% of field capacity as the upper limit
W1irrigation treatment of 80% of field capacity as the upper limit
W2irrigation treatment of 70% of field capacity as the upper limit
W3irrigation treatment of 60% of field capacity as the upper limit
RWwater deficit was imposed at reproductive growth stage
MWwater deficit was imposed at maturity growth stage

References

  1. Yong, K.T.; Yong, P.H.; Ng, Z.X. Tomato and human health: A perspective from post-harvest processing, nutrient bio-accessibility, and pharmacological interaction. Food Front. 2023, 4, 1702–1719. [Google Scholar] [CrossRef]
  2. Lu, J.; Shao, G.; Wang, W.; Gao, Y.; Wang, Z.; Zhang, Y.; Wang, J.; Song, E. The role of hydraulic lift in tomato yield and fruit quality under different water and salt stresses. Agric. Water Manag. 2024, 299, 108899. [Google Scholar] [CrossRef]
  3. Wang, X.; Tian, W.; Zheng, W.; Shah, S.; Li, J.; Wang, X.; Zhang, X. Quantitative relationships between salty water irrigation and tomato yield, quality, and irrigation water use efficiency: A meta-analysis. Agric. Water Manag. 2023, 280, 108213. [Google Scholar] [CrossRef]
  4. Kuscu, H.; Turhan, A.; Ozmen, N.; Aydinol, P.; Demir, A.O. Optimizing levels of water and nitrogen applied through drip irrigation for yield, quality, and water productivity of processing tomato (Lycopersicon esculentum Mill.). Hortic. Environ. Biotechnol. 2014, 55, 103–114. [Google Scholar] [CrossRef]
  5. Nangare, D.D.; Singh, Y.; Kumar, P.S.; Minhas, P.S. Growth, fruit yield and quality of tomato (Lycopersicon esculentum Mill.) as affected by deficit irrigation regulated on phenological basis. Agric. Water Manag. 2016, 171, 73–79. [Google Scholar] [CrossRef]
  6. Chen, J.; Kang, S.; Du, T.; Guo, P.; Qiu, R.; Chen, R.; Gu, F. Modeling relations of tomato yield and fruit quality with water deficit at different growth stages under greenhouse condition. Agric. Water Manag. 2014, 146, 131–148. [Google Scholar] [CrossRef]
  7. Kuscu, H.; Turhan, A.; Demir, A.O. The response of processing tomato to deficit irrigation at various phenological stages in a sub-humid environment. Agric. Water Manag. 2014, 133, 92–103. [Google Scholar] [CrossRef]
  8. Hou, X.; Zhang, W.; Du, T.; Kang, S.; Davies, W.J. Responses of water accumulation and solute metabolism in tomato fruit to water scarcity and implications for main fruit quality variables. J. Exp. Bot. 2020, 71, 1249–1264. [Google Scholar] [CrossRef]
  9. Ripoll, J.; Urban, L.; Brunel, B.; Bertin, N. Water deficit effects on tomato quality depend on fruit developmental stage and genotype. J. Plant Physiol. 2016, 190, 26–35. [Google Scholar] [CrossRef]
  10. Ripoll, J.; Urban, L.; Staudt, M.; Lopez-Lauri, F.; Bidel, L.P.R.; Bertin, N. Water shortage and quality of fleshy fruits-making the most of the unavoidable. J. Exp. Bot. 2014, 65, 4097–4117. [Google Scholar] [CrossRef]
  11. Qi, H.; Li, L.; Zhang, J.; Wang, L.; Chen, Y. Effects of irrigation on sucrose metabolism, dry matter distribution and fruit quality of tomato under water deficit. Sci. Agric. Sin. 2004, 37, 1045–1049. [Google Scholar] [CrossRef]
  12. Zhang, X.; Yang, H.; Du, T. Coupled mechanisms of water deficit and soil salinity affecting tomato fruit growth. Agric. Water Manag. 2024, 295, 108747. [Google Scholar] [CrossRef]
  13. Du, Y.; Niu, W.; Gu, X.; Zhang, Q.; Cui, B. Water- and nitrogen-saving potentials in tomato production: A meta-analysis. Agric. Water Manag. 2018, 210, 296–303. [Google Scholar] [CrossRef]
  14. Blanco, V.; Kalcsits, L. Long-term validation of continuous measurements of trunk water potential and trunk diameter indicate different diurnal patterns for pear under water limitations. Agric. Water Manag. 2023, 281, 108257. [Google Scholar] [CrossRef]
  15. Christenson, C.G.; Gohardoust, M.R.; Calleja, S.; Thorp, K.R.; Tuller, M.; Pauli, D. Monitoring cotton water status with microtensiometers. Irrig. Sci. 2024, 42, 995–1011. [Google Scholar] [CrossRef]
  16. Katerji, N.; Tardieu, F.; Bethenod, O.; Quetin, P. Behavior of maize stem diameter during drying cycles: Comparison of two methods for detecting water stress. Crop Sci. 1994, 34, 165–169. [Google Scholar] [CrossRef]
  17. Li, J.; Chen, J.; He, P.; Chen, D.; Dai, X.; Jin, Q.; Su, X. The optimal irrigation water salinity and salt component for high-yield and good-quality of tomato in Ningxia. Agric. Water Manag. 2022, 274, 107940. [Google Scholar] [CrossRef]
  18. Wang, W.; Shi, F.; Gong, Y.; Ding, D.; Li, K.; Xiong, G. Effect of water and salt synergistic regulation at the different growth stages on quality and sucrose-metabolizing enzyme activities of tomato. J. Plant Nutr. 2023, 46, 1730–1744. [Google Scholar] [CrossRef]
  19. Munns, R.; Gilliham, M. Salinity tolerance of crops—What is the cost? New Phytol. 2015, 208, 668–673. [Google Scholar] [CrossRef]
  20. Munns, R.; Passioura, J.B.; Colmer, T.D.; Byrt, C.S. Osmotic adjustment and energy limitations to plant growth in saline soil. New Phytol. 2020, 225, 1091–1096. [Google Scholar] [CrossRef]
  21. Alhagdow, M.; Mounet, F.; Gilbert, L.; Nunes-Nesi, A.; Garcia, V.; Just, D.; Petit, J.; Beauvoit, B.; Fernie, A.R.; Rothan, C.; et al. Silencing of the mitochondrial ascorbate synthesizing enzyme L-galactono-1,4-lactone dehydrogenase affects plant and fruit development in tomato. Plant Physiol. 2007, 145, 1408–1422. [Google Scholar] [CrossRef]
  22. Balibrea, M.E.; Cruz, A.M.S.; Bolarin, M.C.; PerezAlfocea, F. Sucrolytic activities in relation to sink strength and carbohydrate composition in tomato fruit growing under salinity. Plant Sci. 1996, 118, 47–55. [Google Scholar] [CrossRef]
  23. Lu, S.; Li, T.; Jiang, J. Tomato Key Sucrose Metabolizing Enzyme Activities and Gene Expression Under NaCl and PEG Iso-Osmotic Stresses. Agric. Sci. China 2009, 8, 1046–1052. [Google Scholar] [CrossRef]
  24. Zushi, K.; Matsuzoe, N. Metabolic profile of organoleptic and health-promoting qualities in two tomato cultivars subjected to salt stress and their interactions using correlation network analysis. Sci. Hortic. 2015, 184, 8–17. [Google Scholar] [CrossRef]
  25. Zhang, X.; Yang, H.; Du, T. Osmotic adjustment of tomato under mild soil salinity can enhance drought resistance. Environ. Exp. Bot. 2022, 202, 105004. [Google Scholar] [CrossRef]
  26. Zhang, X.; Yang, H.; Shukla, M.K.; Du, T. Proposing a crop-water-salt production function based on plant response to stem water potential. Agric. Water Manag. 2023, 278, 108162. [Google Scholar] [CrossRef]
  27. Thomas, T.R.; Matthews, M.A.; Shackel, K.A. Direct in situ measurement of cell turgor in grape (Vitis vinifera L.) berries during development and in response to plant water deficits. Plant Cell Environ. 2006, 29, 993–1001. [Google Scholar] [CrossRef]
  28. Colle, I.J.P.; Lemmens, L.; Van Buggenhout, S.; Met, K.; Van Loey, A.M.; Hendrickx, M.E. Processing tomato pulp in the presence of lipids: The impact on lycopene bioaccessibility. Food Res. Int. 2013, 51, 32–38. [Google Scholar] [CrossRef]
  29. Moriasi, D.N.; Arnold, J.G.; Van Liew, M.W.; Bingner, R.L.; Harmel, R.D.; Veith, T.L. Model evaluation guidelines for systematic quantification of accuracy in watershed simulations. Trans. Asabe 2007, 50, 885–900. [Google Scholar] [CrossRef]
  30. De Pascale, S.; Martino, A.; Raimondi, G.; Maggio, A. Comparative analysis of water and salt stress-induced modifications of quality parameters in cherry tomatoes. J. Hortic. Sci. Biotechnol. 2007, 82, 283–289. [Google Scholar] [CrossRef]
  31. Guichard, S.; Bertin, N.; Leonardi, C.; Gary, C. Tomato fruit quality in relation to water and carbon fluxes. Agronomie 2001, 21, 385–392. [Google Scholar] [CrossRef]
  32. Mitchell, J.P.; Shennan, C.; Grattan, S.R. Developmental-changes in tomato fruit composition in response to water deficit and salinity. Physiol. Plant. 1991, 83, 177–185. [Google Scholar] [CrossRef]
  33. Renquist, A.R.; Reid, J.B. Processing tomato fruit quality: Influence of soil water deficits at flowering and ripening. Aust. J. Agric. Res. 2001, 52, 793–799. [Google Scholar] [CrossRef]
  34. Shameer, S.; Vallarino, J.G.; Fernie, A.R.; Ratcliffe, R.G.; Sweetlove, L.J. Flux balance analysis of metabolism during growth by osmotic cell expansion and its application to tomato fruits. Plant J. 2020, 103, 68–82. [Google Scholar] [CrossRef] [PubMed]
  35. Balibrea, M.E.; Parra, M.; Bolarin, M.C.; Perez-Alfocea, F. Cytoplasmic sucrolytic activity controls tomato fruit growth under salinity. Aust. J. Plant Physiol. 1999, 26, 561–568. [Google Scholar] [CrossRef]
  36. Yin, Y.; Kobayashi, Y.; Sanuki, A.; Kondo, S.; Fukuda, N.; Ezura, H.; Sugaya, S.; Matsukura, C. Salinity induces carbohydrate accumulation and sugar-regulated starch biosynthetic genes in tomato (Solanum lycopersicum L. cv. ‘Micro-Tom’) fruits in an ABA- and osmotic stress-independent manner. J. Exp. Bot. 2010, 61, 563–574. [Google Scholar] [CrossRef]
  37. Yang, X.; Borno, M.L.; Wei, Z.; Liu, F. Combined effect of partial root drying and elevated atmospheric CO2 on the physiology and fruit quality of two genotypes of tomato plants with contrasting endogenous ABA levels. Agric. Water Manag. 2021, 254, 106987. [Google Scholar] [CrossRef]
  38. Borawska-Jarmulowicz, B.; Mastalerczuk, G.; Gozdowski, D.; Maluszynska, E.; Szydlowska, A. The sensitivity of Lolium perenne and Poa pratensis to salinity and drought during the seed germination and under different photoperiod conditions. Zemdirbyste 2017, 104, 71–78. [Google Scholar] [CrossRef]
  39. Martinez, J.P.; Kinet, J.M.; Bajji, M.; Lutts, S. NaCl alleviates polyethylene glycol-induced water stress in the halophyte species Atriplex halimus L. J. Exp. Bot. 2005, 56, 2421–2431. [Google Scholar] [CrossRef]
  40. Albacete, A.A.; Martinez-Andujar, C.; Perez-Alfocea, F. Hormonal and metabolic regulation of source-sink relations under salinity and drought: From plant survival to crop yield stability. Biotechnol. Adv. 2014, 32, 12–30. [Google Scholar] [CrossRef]
  41. Chen, H.; Jiang, J. Osmotic adjustment and plant adaptation to environmental changes related to drought and salinity. Environ. Rev. 2010, 18, 309–319. [Google Scholar] [CrossRef]
  42. Hessini, K.; Martinez, J.P.; Gandour, M.; Albouchi, A.; Soltani, A.; Abdelly, C. Effect of water stress on growth, osmotic adjustment, cell wall elasticity and water-use efficiency in Spartina alterniflora. Environ. Exp. Bot. 2009, 67, 312–319. [Google Scholar] [CrossRef]
  43. Lu, J.; Shao, G.; Gao, Y.; Zhang, K.; Wei, Q.; Cheng, J. Effects of water deficit combined with soil texture, soil bulk density and tomato variety on tomato fruit quality: A meta-analysis. Agric. Water Manag. 2021, 243, 106427. [Google Scholar] [CrossRef]
  44. Veit-Kohler, U.; Krumbein, A.; Kosegarten, H. Effect of different water supply on plant growth and fruit quality of Lycopersicon esculentum. J. Plant Nutr. Soil Sci. 1999, 162, 583–588. [Google Scholar] [CrossRef]
Figure 1. Schematic diagram of the greenhouse experiment, including tank arrangement and 5TE sensor mounting locations.
Horticulturae 11 00114 g001
Figure 2. Response of tomato total soluble solids (TSS), lycopene (Ly), soluble sugar content (SSC), and color index (CI) to water deficit at reproductive growth and fruit ripening stages under soil salinity. Different letters indicate statistically significance (p < 0.05) among the treatments using Tukey’s test. Data are averaged for 2019 and 2020.
Horticulturae 11 00114 g002
Figure 3. Response of tomato fruit fresh weight and fruit water content to water deficit at reproductive growth and fruit ripening stages under soil salinity. Different letters indicate statistically significance (p < 0.05) among the treatments with Tukey’s test. Data are averaged for 2019 and 2020.
Horticulturae 11 00114 g003
Figure 4. The linear regression relationships between fruit water content and quality parameters for different water deficit treatments under S0, S3, and S5 soil salinity. Data are from 2019 and 2020. Significance levels are as follows: * p < 0.05, and ns—no significant difference.
Horticulturae 11 00114 g004
Figure 5. Response of stem water potential (φ) to water deficit at reproductive growth and fruit ripening stages under soil salinity. Different letters indicate statistically significance (p < 0.05) among the treatments with Tukey’s test. Data are averaged for 2019 and 2020.
Horticulturae 11 00114 g005
Figure 6. Response of fruit osmotic potential (φπ) to water deficit at reproductive growth and fruit ripening stages under soil salinity. Different letters indicate statistically significance (p < 0.05) among the treatments with Tukey’s test. Data are averaged for 2019 and 2020.
Horticulturae 11 00114 g006
Figure 7. Linear regression relationships between soluble sugar content (SSC) and osmotic potential (φπ) for different water deficit treatments under S0, S3, and S5 soil salinity. Data are from 2019 and 2020. Significance levels are as follows: * p < 0.05.
Horticulturae 11 00114 g007
Figure 8. Response of fruit Na+ content to water deficit at reproductive growth and fruit ripening stages under soil salinity. Different letters indicate statistically significance (p < 0.05) among the treatments with Tukey’s test. Data are averaged for 2019 and 2020.
Horticulturae 11 00114 g008
Figure 9. The linear regression relationships between relative stem water potential and relative quality parameters for different water deficit treatments under S0, S3, and S5 soil salinity. Data are from 2019 and 2020. TSSCK—TSS of W0 water treatment under S0 soil salinity; LyCK—Ly of W0 water treatment under S0 soil salinity; SSCCK—SSC of W0 water treatment under S0 soil salinity; CICK—CI of W0 water treatment under S0 soil salinity. Significance levels are as follows: * p < 0.05.
Horticulturae 11 00114 g009
Figure 10. Linear regression relationships between stem water potential and fruit water content for different water deficit treatments under S0, S3, and S5 soil salinity. Data are from 2019 and 2020. Significance levels are as follows: * p < 0.05.
Horticulturae 11 00114 g010
Figure 11. Relationship between the simulated relative quality parameters and measured relative quality parameters of 2020. Simulated relative quality parameters are relative quality parameters using Equation (1).
Horticulturae 11 00114 g011
Figure 12. Relationship between the simulated relative quality parameters and measured relative quality parameters of 2019 and 2020. Simulated relative quality parameters are relative quality parameters using Q-Multiplicative.
Horticulturae 11 00114 g012
Table 1. Timing of each fertility stage of tomato in 2019 and 2020, the amount of water irrigated for each experimental treatment, and the number of irrigations.
YearGrowth Stage Date (MM/DD)TreatmentsIrrigation Amount (mm) and Irrigation Times (No.)
Seedling StageReproductive Growth Mature StageWhole
2019Seedling06/01–06/27S0W033.6 (2)149.2 (8)87.3 (4)270.1 (14)
Reproductive06/28–08/08S3W033.6 (2)137.6 (8)75.7 (4)246.9 (14)
Mature08/09–09/08S5W033.6 (2)130.4 (8)83.2 (4)246.8 (14)
Whole06/01–09/08S0RW133.6 (2)118.5 (8)80.2 (4)232.3 (14)
S0RW233.6 (2)84.6 (7)72.5 (4)190.7 (13)
S0RW333.6 (2)72.8 (6)67.3 (4)173.6 (12)
S3RW133.6 (2)109.8 (8)79.4 (4)222.8 (14)
S3RW233.6 (2)89.3 (70)74.2 (4)197.1 (13)
S3RW333.6 (2)61.5 (6)68.3 (4)163.4 (12)
S5RW133.6 (2)93.1 (8)79.7 (4)206.3 (14)
S5RW233.6 (2)75.7 (7)77.1 (4)186.4 (13)
S5RW333.6 (2)60.8 (6)74.3 (4)168.8 (12)
S0MW133.6 (2)149.2 (8)83.3 (4)266.1 (14)
S0MW233.6 (2)149.2 (8)67.5 (3)250.3 (13)
S0MW333.6 (2)149.2 (8)52.5 (2)235.3 (12)
S3MW133.6 (2)137.6 (8)78.6 (4)249.8 (14)
S3MW233.6 (2)137.6 (8)71.2 (3)242.4 (13)
S3MW333.6 (2)137.6 (8)53.4 (2)224.6 (12)
S5MW133.6 (2)130.4 (8)64.7 (4)228.7 (14)
S5MW233.6 (2)130.4 (8)58.3 (3)222.3 (13)
S5MW333.6 (2)130.4 (8)42.6 (2)206.6 (12)
2020Seedling06/01–06/26S0W038.3 (2)155.2 (8)91.3 (5)284.8 (15)
Reproductive06/27–08/11S3W038.3 (2)141.2 (8)84.2 (5)263.7 (15)
Mature08/12–09/15S5W038.3 (8)132.2 (8)88.3 (5)258.8 (15)
Whole06/01–09/15S0RW138.3 (8)122.4 (8)90.2 (5)250.9 (15)
S0RW238.3 (8)88.5 (7)84.1 (5)211.1 (14)
S0RW338.3 (8)72.8 (6)86.3 (5)197.4 (13)
S3RW138.3 (8)110.4 (8)89.2 (5)237.9 (15)
S3RW238.3 (8)85.6 (7)81.4 (5)205.3 (14)
S3RW338.3 (8)66.2 (6)76.3 (5)180.8 (13)
S5RW138.3 (8)112.4 (8)90.7 (5)241.4 (15)
S5RW238.3 (8)81.5 (7)84.4 (5)204.2 (14)
S5RW338.3 (8)62.8 (6)79.3 (5)180.4 (13)
S0MW138.3 (8)155.2 (8)85.5 (5)240.7 (15)
S0MW238.3 (8)155.2 (8)79.3 (4)234.5 (14)
S0MW338.3 (8)155.2 (8)55.3 (3)210.5 (13)
S3MW138.3 (8)141.2 (8)80.2 (5)221.4 (15)
S3MW238.3 (8)141.2 (8)76.9 (4)218.1 (14)
S3MW338.3 (8)141.2 (8)57.5 (3)198.7 (13)
S5MW138.3 (8)132.2 (8)70.6 (5)202.8 (15)
S5MW238.3 (8)132.2 (8)65.5 (4)197.7 (14)
S5MW338.3 (8)132.2 (8)46.2 (3)178.4 (13)
Table 2. The parameters of Equation (2).
Parametersθ0θradCτ
Value0.4220.0290.019−2.5630.3961.96
Table 3. Results of a three-way ANOVA for stem water potential (φ), fresh weight per fruit (FW), fruit water content (WC), tomato total soluble solids (TSS), lycopene content (LY), soluble sugars content (SSC), color index (CI), fruit osmotic potential (φπ), and fruit Na+ content under soil salinity, degree of water deficit, and water deficit stage. Significance levels are as follows: * p < 0.05, ** p < 0.001, and ns—no significant difference.
TreatmentφFWWCTSSLySSCCIφπNa+ Content
S (soil salinity)*****************
WD (water deficit)****************ns
WDS (water deficit stage)nsnsns*ns*****ns
S × W*****************
S × WDSnsnsnsnsnsnsnsnsns
W × WDSnsnsnsnsns*****ns
S × W × WDSnsnsnsnsnsnsnsnsns
Table 4. Parameters of the Q-Multiplicativ, which is based on Multiplicativ form with stem water potential as an input and without considering the effect of soil salinity.
Quality
Parameters
Salinity
Correction Factor
Sensitivity Index (λqi)R2
Reproductive PeriodMature Period
TSS−0.115−0.267−0.3340.91
LY−0.058−0.171−0.2150.94
SSC−0.205−0.473−0.5750.84
CI−0.101−0.210−0.3350.92
Table 5. Equation (1) evaluation indexes for modeling the effect of tomato fruit quality. b and R2 are the slope and coefficient of determination of the linear regression equation between the measured and simulated values at the origin; RMSE is the root mean square error; AAE is average absolute error; dIA is the Willmott parameter of agreement; EF is the Nash and Sutcliffe modeling efficiency.
Quality ParametersbR2RMSEAAEEFdIA
TSS1.0130.8620.0560.0450.9570.959
LY1.0080.8820.0260.0210.990.967
SAR0.9710.870.0920.0690.9390.96
CI0.9980.8550.0460.0370.9740.962
Table 6. Q-Multiplicative evaluation indexes for modeling the effect of tomato fruit quality.
Quality ParametersbR2RMSEAAEEFdIA
TSS0.9910.8320.0530.0410.9330.957
LY1.0050.8770.0230.0180.9840.969
SAR0.9790.8890.0740.0590.9360.968
CI0.9960.8960.0350.0270.9720.973
Disclaimer/Publisher’s Note: The statements, opinions and data contained in all publications are solely those of the individual author(s) and contributor(s) and not of MDPI and/or the editor(s). MDPI and/or the editor(s) disclaim responsibility for any injury to people or property resulting from any ideas, methods, instructions or products referred to in the content.

