Article

Genetic and Haplotype Diversity of Hoplolaimus (Nematoda: Hoplolaimidae) Through Analysis of COI of mtDNA

Department of Biochemistry, Microbiology and Biotechnology, University of Limpopo, Private Bag X1106, Polokwane 0727, South Africa
*
Author to whom correspondence should be addressed.
Horticulturae 2025, 11(2), 113; https://doi.org/10.3390/horticulturae11020113
Submission received: 25 October 2024 / Revised: 20 January 2025 / Accepted: 20 January 2025 / Published: 22 January 2025
(This article belongs to the Special Issue Role of Nematodes in Horticultural Production)

Abstract

:
Lance nematodes (Hoplolaimus spp.) feed on the roots of various plants, including key horticultural products. An investigation of the genetic diversity and structure of six Hoplolaimus species, utilizing the cytochrome c oxidase I (COI) of the mtDNA gene, was based on 174 sequences available on the NCBI. Based on the COI of mtDNA, the haplotype analysis revealed 44 haplotypes. Nucleotide diversity was low among all species of Hoplolaimus, except for H. magnistylus (π = 0.04915) and H. stephanus (π = 0.06746). In contrast, haplotype diversity (Hd) was high, especially for H. stephanus (Hd = 0.89) and H. pararobustus (Hd = 0.90). Phylogenetic analysis grouped the various populations into eight clades, and the result showed that H. magnistylus was placed in three different clades, which showed high variability in haplotype supported by the haplotype network. Neutrality tests and mismatch distribution based on the mtDNA supported the hypothesis of a constant population with no expansion in Hoplolaimus, except for H. concaudajuvencus (Tajima (D) = −0.84971) and H. columbus (Tajima (D) = −0.87674). In conclusion, genetic analysis showed a neutral evolution amongst the Hoplolaimus species. The result of the present study provides a better insight into the Hoplolaimus species toward species delimitation and managing this plant-parasitic nematode in various crops.

1. Introduction

Hoplolaimus Daday, 1905, nematodes, known as lance nematodes, is a plant-parasitic nematode that affects many crops [1]. This genus is widely distributed worldwide, with 37 valid species [2,3]. The characteristics and measurements used to describe these Hoplolaimus species are primarily based on their physical appearance and structural features, as molecular data are limited. The morphological features, including lateral field incisures, pharyngeal gland nuclei, and stylet length, have been critical for species diagnosis [2]. In fact, only ten of these species have been extensively studied on a molecular level [3]. By using different molecular markers, such as the internal transcribed spacer (ITS1), the 28S ribosomal DNA, and the actin gene, researchers have been able to better understand the phylogenetic relationships within members of the genus Hoplolaimus. In particular, Bae et al. [4,5] and Shokoohi et al. [1] used ITS1 and 28S ribosomal DNA markers, respectively, to resolve the phylogenetic relationships among Hoplolaimus species. Meanwhile, Ma et al. [6] used the actin gene to study the molecular evolution of this genus. In a previous study, Holguin et al. [7] used mitochondrial markers for the molecular analysis of this genus. Together, these studies have provided valuable insights into the molecular evolution and phylogenetic relationships of Hoplolaimus species. Recently, Olajide et al. [3] have studied H. seinhorsti Luc, 1958, and H. pararobustus (Schuurmans Stekhoven and Teunissen, 1938) Sher, 1963, using COI, among other genes, indicating that COI is the most reliable marker to diagnose and for phylogenetic studies of Hoplolaimus species.
Genome-wide analysis, including haplotype, is a unique tool for studying variation among geographical populations or species. Therefore, the mitochondrial region is an effective indicator of genome changes because its size is four times smaller than that of the nuclear genome [8]. In Addition, the genetic structure of nematodes is shaped by various factors. These include the degree to which they are specialized to specific hosts, which can affect their adaptability and survival. The adequate population size plays a crucial role, as a larger population can maintain greater genetic diversity. Geographical distance between different nematode populations can lead to variations in their genetic makeup due to limited gene flow. Also, hosts’ ability to disperse affects how nematodes spread and interact with different environments.
Moreover, the evolutionary history of nematodes contributes to their genetic diversity, reflecting adaptations over time. The structure of host populations, whether stable or fluctuating, also impacts on nematode genetics. Finally, the complexity of nematode life cycles, which can include multiple stages and interactions with various hosts, further influences their genetic organization and evolutionary trajectories [9,10,11,12].
The integration of DNA analysis into the discovery process has unveiled that many globally widespread species are not homogeneous but consist of several genetically distinct subgroups. This revelation enhances our understanding of biodiversity and highlights the complexity of ecosystems, suggesting that the population regarded as a single species may represent a rich tapestry of varying genetic lineages [13,14].
Haplotype and genetic structure are important because the morphological analysis does not reveal variations among Hoplolaimus species [7]. However, examining haplotypes and genetic structures provides insight into the diversity within this genus. This genetic understanding contributes to clarifying the boundaries of species among lance nematodes and other plant-parasitic nematodes [15].
Furthermore, understanding the genetic structure aids in recognizing cryptic species of nematodes [15]. We also believe that Hoplolaimus is an excellent candidate for investigating the connection between ecology and biology, a link previously suggested for Mesocriconema [16].
This study aims to evaluate genetic diversity among Hoplolaimus species using cox1 sequence data. Therefore, the study’s objectives were (1) to analyze the genetic diversity and structure among Hoplolaimus species and (2) to study the neutrality and population size among Hoplolaimus species based on COI of mtDNA.

2. Materials and Methods

2.1. Genetic Diversity, Phylogenetic Analysis, and Genetic Structure

To assess the global genetic diversity of Hoplolaimus species, 174 COI sequences were used from the NCBI (GenBank; see Table S1), based on all available sequences for species, including H. concaudajuvencus Golden and Minton, 1970; H. magnistylus Robbins, 1982; H. galeatus (Cobb, 1913) Thorne, 1935; H. stephanus Sher, 1963; H. pararobustus (Schuurmans Stekhoven and Teunissen, 1938) Sher, 1963; and H. columbus Sher, 1963. Next, the quality of the COI sequences was analyzed using BioEdit 7.7.1 [17]. The sequences were aligned with the ClustalW [18] method in MEGA11 software [19]. To eliminate any missing data, all COI gene sequences were standardized to a length of 446 bp using the FaBox online toolbox 1.41 [20].
Genetic diversity was assessed by evaluating the number of haplotypes (H), segregating sites (S), haplotype diversity (h), and nucleotide diversity (π) across all populations and regions, using DnaSP version 6 [21]. To investigate the relationships among the haplotypes of the COI locus in the Hoplolaimus population, we exported the sequence data for the Median-Joining Haplotype Network from DnaSP v6.12.03 and performed haplotype network analysis using the PopART program [22]. Phylogenetic trees were constructed using the Bayesian inference method implemented in Mr. Bayes 3.1.2 [23]. The GTR+I+G model was selected using jModeltest 2.1.10 [24]. The chosen model was initiated with a random starting tree and run with Markov Chain Monte Carlo (MCMC) for 106 generations. Rotylenchus robustus (de Man, 1876) Filipjev, 1936, was selected as the outgroup to root the phylogenetic tree. The resulting trees were visualized using FigTree v1.4.4 [25].
AMOVA was conducted to assess genetic diversity within and among populations. Additionally, the fixation index (Fst) was calculated using 10,000 permutations in Arlequin version 3.5 [26] to evaluate genetic differentiation between populations. The degree of population differentiation was analyzed by examining pairwise Fst values in Arlequin 3.5 (with p < 0.05), treating all populations as a single group. The genetic relationships among populations were visualized using the pairwise Fst matrix.

2.2. Neutrality and Population Size Change Test

Tajima’s D [27] and Fu’s [28] tests were used to determine if sequences are evolving neutrally or due to other processes like balancing or directional selection. These tests help us determine if mutations are neutral. We used Arlequin version 3.5 [26] to run 1000 simulations based on a model of selective neutrality. We also used DnaSP v6.12.03 to analyze changes in population size.

3. Results

3.1. Haplotype Network

For the genetic study, 174 COI sequences were accessible in the NCBI database. Based on the COI sequences, The median-joining (MJ) network spanned 44 haplotypes, representing the distribution pattern of haplotypes from different species in Hoplolaimus (Figure 1). No common haplotype within the species of Hoplolaimus was found. However, the result indicated a haplotype of unidentified Hoplolaimus close to H. concaudajuvencus, whereas the other haplotype was close to H. pararobustus. The average value of haplotype diversity (Hd) was 0.89, and the average value of nucleotide diversity (π) was 0.013 (Table 1). However, nucleotide diversity was low among all species of Hoplolaimus, except for H. magnistylus (π = 0.04915) and H. stephanus (π = 0.06746). The result indicated the lowest segregating sites (S) were calculated for H. columbus (S = 1) and H. concaudajuvencus (S = 2) (Table 1).

3.2. Phylogenetic Analysis

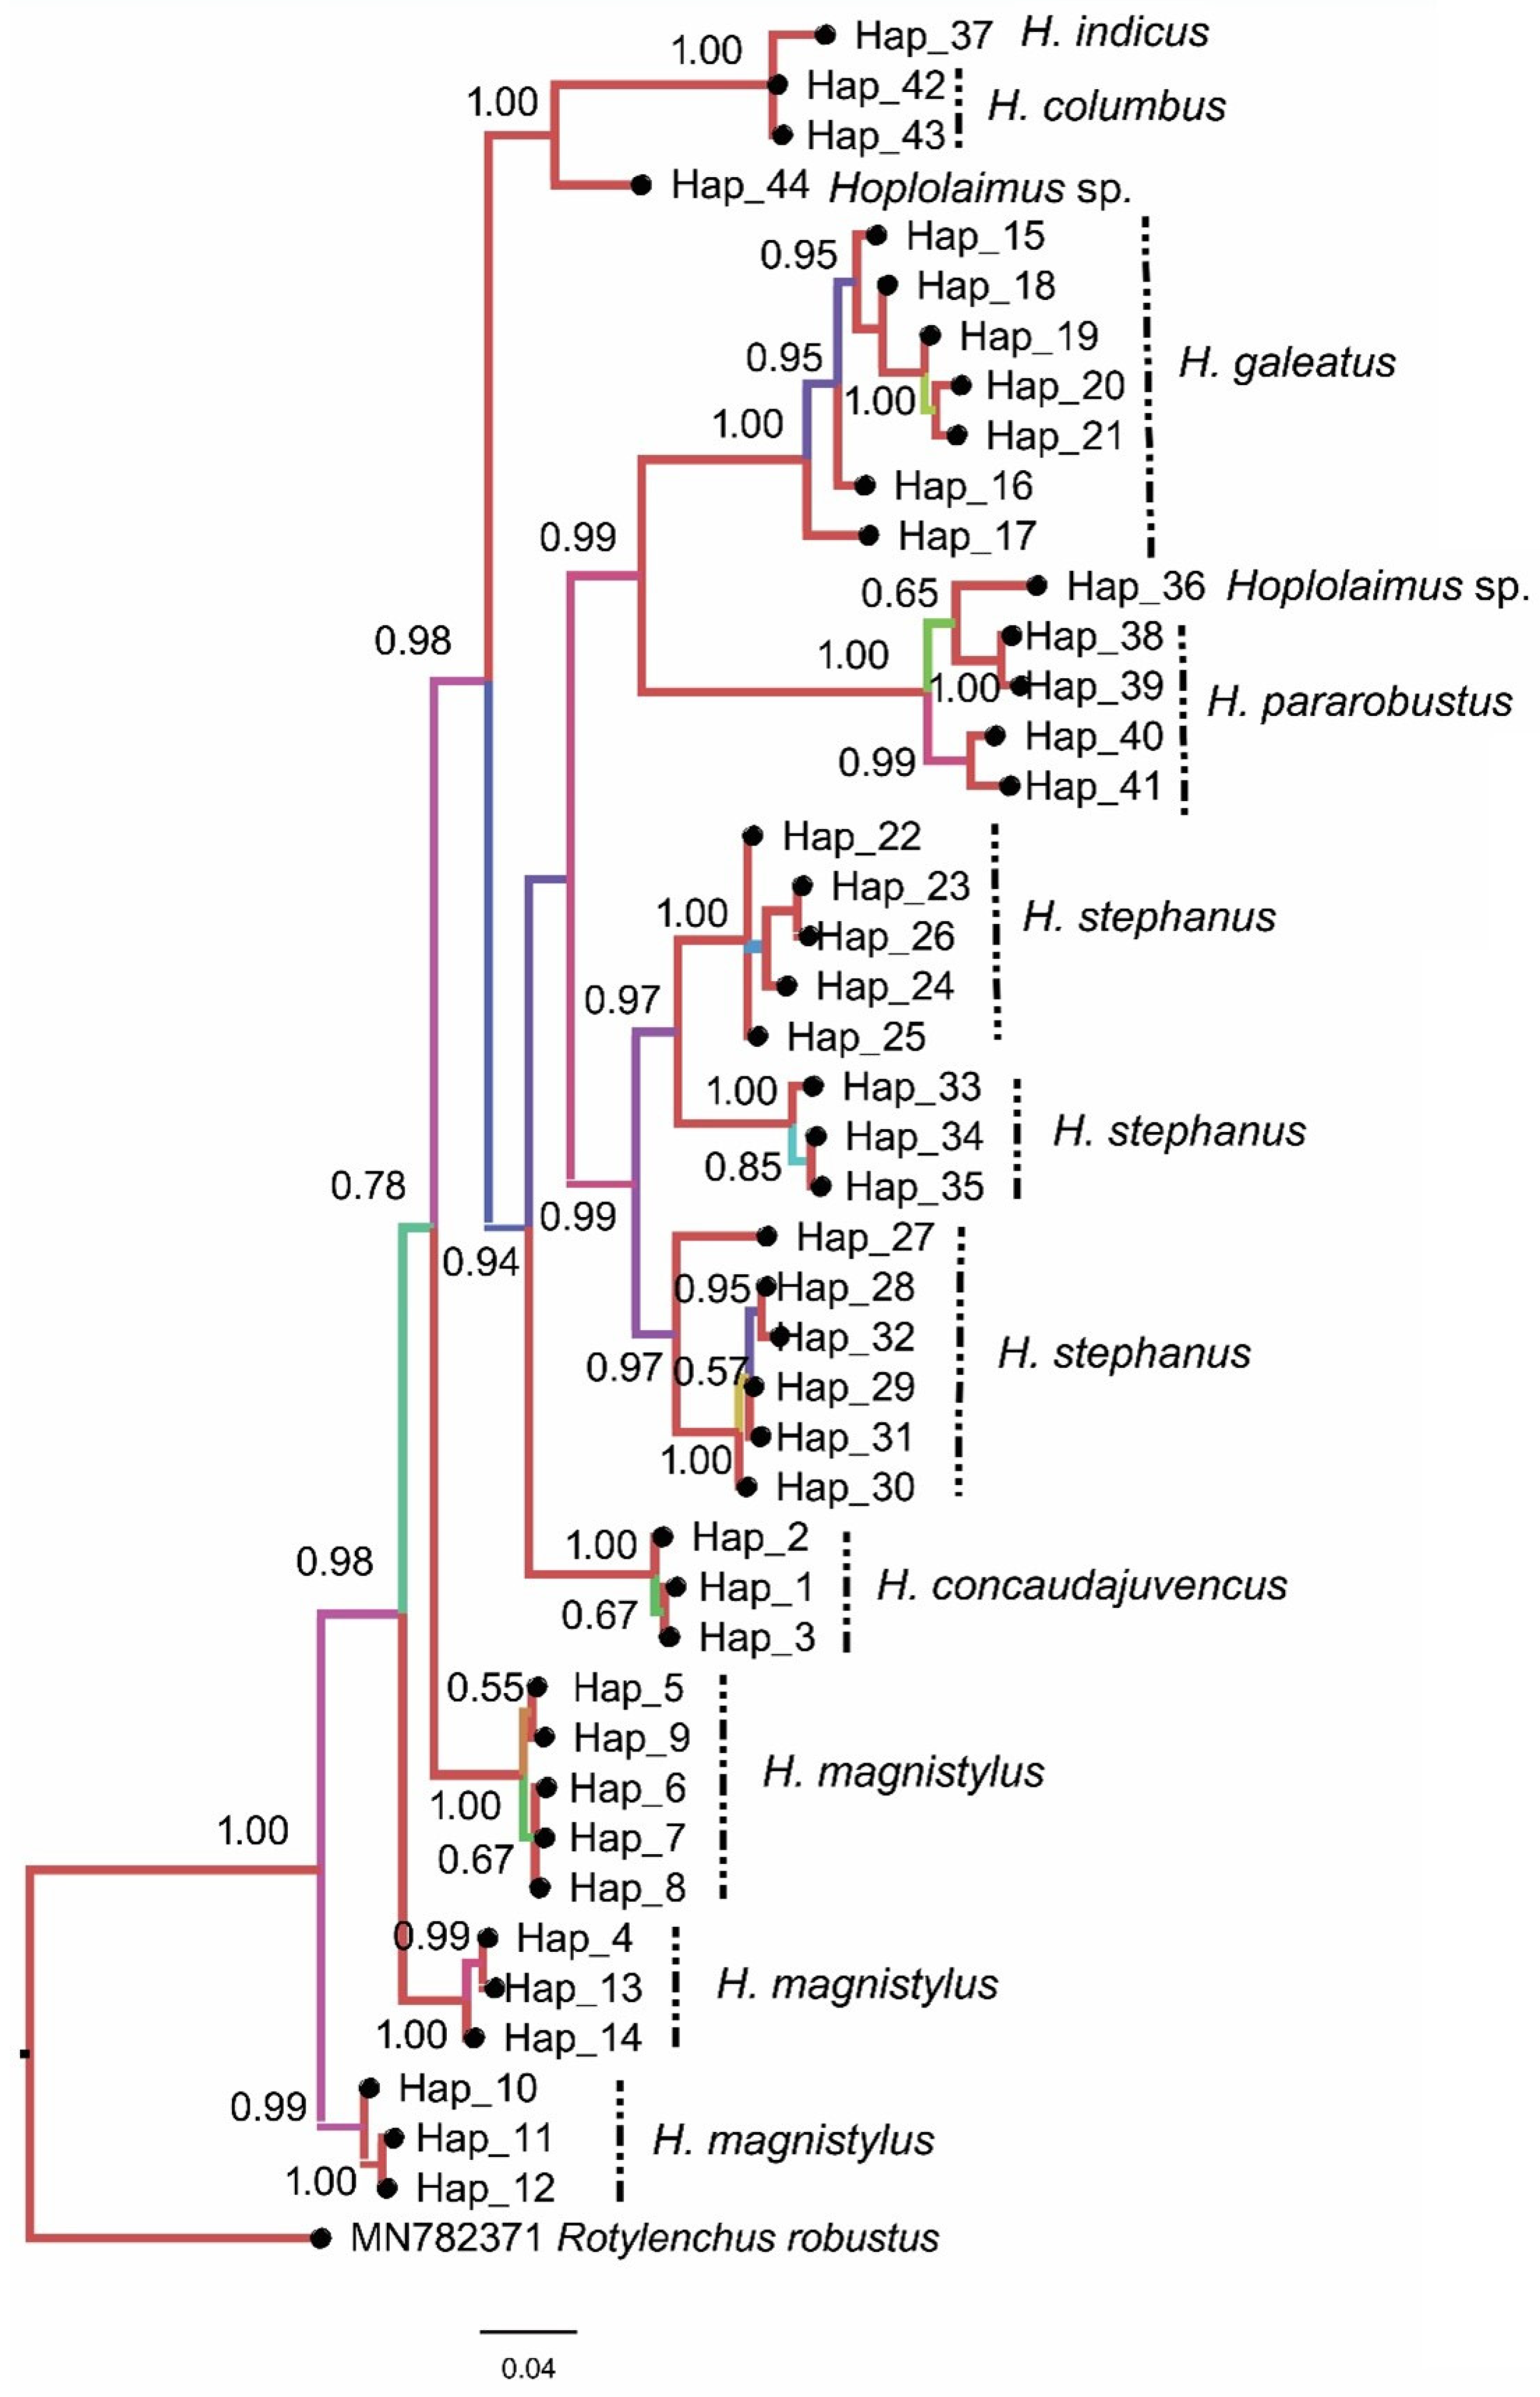
The result of phylogenetic analysis based on the haplotypes indicated that eight major clades (Figure 2), including Clade I, represented haplotypes belonging to H. columbus, H. indicus, and unidentified Hoplolaimus; Clade II represented haplotypes of H. galeatus; Clade III represented haplotypes of H. pararobustus, and unidentified Hoplolaimus; Clade IV represented haplotypes of H. stephanus; Clade V represented haplotypes of H. concaudajuvencus; and Clade VI, VII, and VIII represented haplotypes of H. magnistylus, respectively.

3.3. Genetic Diversity Estimation

Analysis of Molecular Variance (AMOVA) of Hoplolaimus species was calculated to determine the genetic structure and revealed 86.3% variation among species and 13.7% within species (Table 2).
Additionally, Table 3 displays the degree of population differentiation. The pairwise Fst values demonstrated noteworthy distinctions between all populations from different species. The genetic structure of H. concaudajuvencus displayed a highly significant difference (p > 0.001) from the other species of Hoplolaimus, especially with H. columbus (0.97) (Table 3). The lowest differentiation was calculated between H. stephanus and H. magnistylus, with a 0.48 value of Fst.

3.4. Demographic History and Neutrality

Tajima’s D result indicated that H. concaudajuvencus (D = −0.84971) and H. columbus (D = −0.87674) had a low expected haplotype. In contrast, H. stephanus (D = 1.71201) had the expected number of haplotypes (Table 1). However, Tajima’s D result was not significant for all tested species. The Fu result also was not significant for all tested species, except for H. stephanus (9.731; p < 0.01).
Tajima (D) values for H. magnistylus, H. galeatus, H. stephanus, and H. pararobustus were positive, whereas for H. concaudajuvencus and H. columbus, they were negative. However, Fu’s Fs in all species were positive except for H. concaudajuvencus and H. columbus.
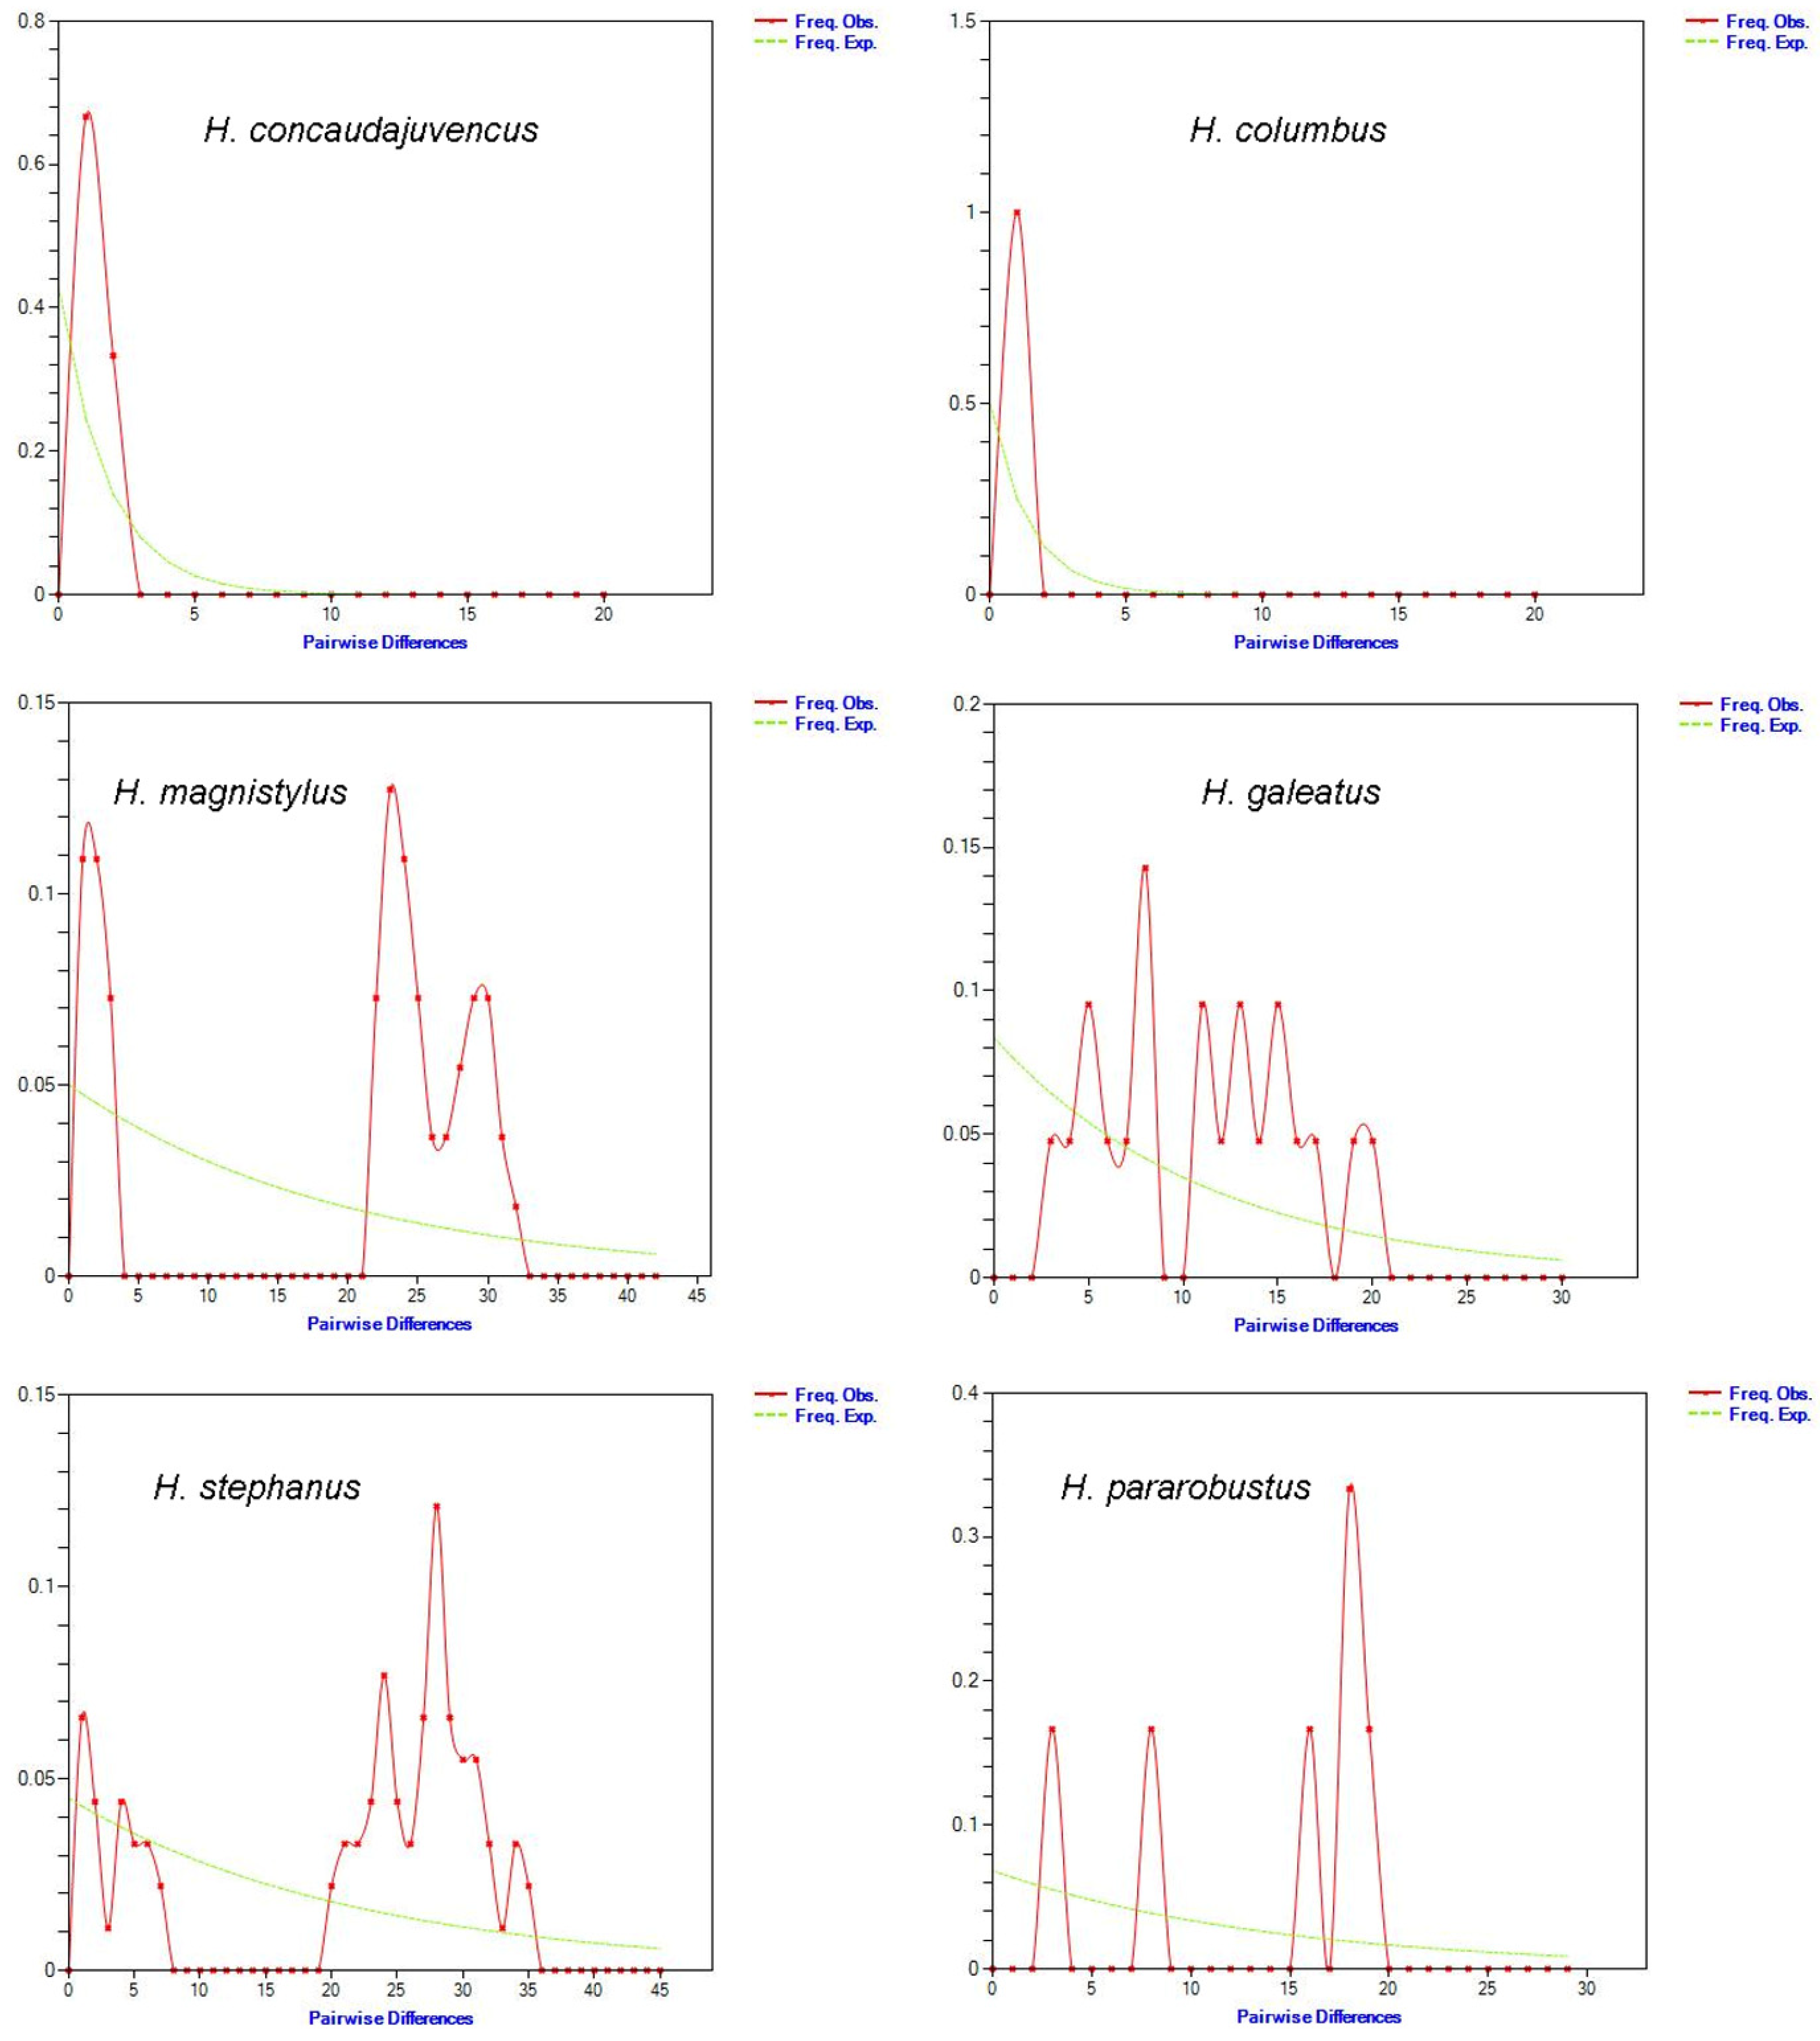
Pairwise and mismatch comparisons are shown in Figure 3 for all species. The result of the present study showed that the mismatch distribution plot had a multimodal and ragged shape, revealing demographic equilibrium or a stable population, except for H. concaudajuvencus and H. columbus. We also calculated the raggedness index under the demographic expansion model for each population and found that all species had a non-significant raggedness index (Table 4), which indicates that data have a relatively good fit to a model of population expansion.

4. Discussion

Hoplolaimus is of considerable economic importance due to its impact on the yields of various crops, particularly those that are agronomically significant [29,30]. Molecular studies have elucidated the phylogenetic relationships among Hoplolaimus species using various DNA markers [1,4,5,6,7]. However, the genetic structure of Hoplolaimus species, particularly as analyzed through mitochondrial DNA (mtDNA), has not been thoroughly explored compared to species identification using conventional and molecular approaches. The result of genetic differentiation based on the COI of mtDNA showed a high haplotype diversity for H. magnistylus, H. stephanus, and H. pararobustus. In contrast, low haplotype diversity was observed for H. concaudajuvencus and H. columbus. In addition, nucleotide diversity was low for all species of Hoplolaimus, except for H. magnistylus and H. stephanus. Haplotype diversity (also known as gene diversity) represents the probability that two randomly sampled alleles are different, while nucleotide diversity is defined as the average number of nucleotide differences per site in pairwise comparisons among DNA sequences [31].
The small size of some species of Hoplolaimus may account for the high variability of genetic diversity. Holguin et al. [7] indicated a deep intraspecific variation in H. stephanus, pointing to the potential cryptic speciation for the American populations. The same result was obtained in the present study. Geographical distribution is a barrier to genetic variation within nematodes [7]. In the realm of plant-parasitic nematodes, species such as Heterodera schachtii Schmidt, 1871; Globodera pallida (Stone, 1973) Behrens, 1975; and Bursaphelenchus mucronatus Mamiya and Enda, 1979, have been found to exhibit a remarkable ability to maintain a high gene flow over vast distances. Although most of the Hoplolaimus species are studied in the USA, more populations are needed to understand the effect of geographical distances on genetic diversity. Additionally, apart from the geographic barriers, these nematodes are capable of dispersing their genetic material with remarkable ease, allowing them to adapt to new environments and persist in a wide range of habitats.
Geneticists rely on two popular statistical tests, Tajima’s D and Fu’s Fs, to investigate the history of a species’ population. Tajima’s D is a measure of genetic variation at segregating sites [32], while Fu’s Fs considers the distribution of haplotypes within a population [33]. Negative values in both tests typically indicate that a population underwent a period of rapid expansion (Tajima’s D and Fu’s F). Our study of Hoplolaimus suggests that the population did not experience an expansion as we observed statistically insignificant values for both Tajima’s D and Fu’s Fs. Therefore, we can conclude that the population of Hoplolaimus has remained relatively stable with no expansion, except for H. concaudajuvencus and H. columbus. Holguin et al. [7] also reported a low variation within (5.8%) species of Hoplolaimus. In contrast, Tajima’s D for H. magnistylus, H. galeatus, H. stephanus, and H. pararobustus were positive with a higher-than-zero range, pointing to balancing selection and sudden population contraction. The ability of a species to adjust to changes in its surroundings is significantly influenced by the genetic diversity and genetic structure of its populations [34]. Furthermore, a Tajima’s D value that falls below −2 or above +2 is generally interpreted as strong evidence suggesting that a gene is not evolving in a neutral manner [35]. This particular range was not observed in the current study. The result suggests that Hoplolaimus species are evolving neutrally; therefore, there are no excess alleles, and any mutations that occur have no effect on Hoplolaimus populations [35].
The regular gene exchange between the populations may have heightened the adaptability of Hoplolaimus species in response to environmental variations. The high variation may be due to the geographical locations of H. stephanus and H. magnistylus, which have been collected from various states in the USA with different climates. On the other hand, H. columbus sequences were reported from South and North Carolina in the USA. Therefore, a limited geographical distribution of this species may appear to have low nucleotide diversity. Research has shown [36] that populations from areas experiencing outbreaks tend to exhibit a decreased level of genetic differentiation, likely due to heightened gene flow. In comparison to non-outbreaking populations, those experiencing an outbreak have significantly larger gene flow, potentially stemming from demographic or behavioral factors [36]. The study also revealed that Hoplolaimus species demonstrated a low gene flow, which may be attributed to both demographic and behavioral factors.
The result of phylogenetic analysis indicated eight major clades with a high posterior probabilities value. It is probable that the high support of the clades is due to the study of 44 haplotypes and/or low levels of divergence. Hoplolaimus stephanus and H. magnistylus have three subclades, pointing to high variation within the populations, as supported by the nucleotide and haplotype diversity results.
The mismatch distribution plot for all species of Hoplolaimus exhibited a multimodal and ragged shape, indicating demographic equilibrium or a stable population, as noted by Ray et al. [37]. Generally, the multimodal mismatch distribution for H. stephanus, H. magnistylus, H. galeatus, and H. pararobustus suggests a decline in population sizes or a structured size. In contrast, two species of Hoplolaimus, including H. concaudajuvencus and H. columbus, displayed a unimodal mismatch distribution. This pattern indicates low genetic diversity and suggests that these species may have experienced a sudden demographic expansion [38]. Such expansion might be attributed to recent colonization from a less widespread common ancestor, which did not allow sufficient time for geographic differentiation. This scenario may involve incomplete lineage sorting or significant gene flow [39], or it could indicate a rapid population expansion [40].
Additionally, a low diversity of haplotype and nucleotides in H. concaudajuvencus and H. columbus might be due to the nematicide used for nematode control, as indicated by Holguin et al. [7]. Nematicides can reduce the nematode population, thereby decreasing its genetic diversity. Root-knot nematodes (e.g., Meloidogyne incognita (Kofoid and White, 1919) Chitwood 1949)) have been shown to be affected by fluensulfone, which downregulated all neuropeptidergic genes [41]. Among Hoplolaimus species, H. stephanus had the highest haplotype and nucleotide variation. Therefore, high intraspecific variation might be a sign of cryptic species. The same result was obtained by Holguin et al. [7]. Some free-living nematodes have already been shown to have a potential for cryptic species [42,43] using the COI of mtDNA.

5. Conclusions

The current study provides valuable insights into the global haplotype diversity of six species within the Hoplolaimus genus. The results indicate a notably high level of haplotype diversity, particularly in H. stephanus and H. magnistylus. The significant genetic diversity observed in H. stephanus suggests a high mutation rate, which may enable it to overcome resistance and adapt to challenging environmental conditions where nematodes thrive.
This study found that mitochondrial DNA (mtDNA), specifically the cytochrome c oxidase subunit I (COI), is a useful marker for assessing genetic diversity in these populations. However, it is important to note that all sequences from COI were obtained during different periods and varied in quality, extraction methods, purification, and amplification, which presents limitations for this type of study.
Therefore, further research is needed to explore the relationship between Hoplolaimus species and various plant cultivars to determine their host status, including resistance and susceptibility. Additionally, more investigations into other species within the Hoplolaimus genus are necessary to reveal the genetic structure and clarify species delimitation.

Supplementary Materials

The following supporting information can be downloaded at https://www.mdpi.com/article/10.3390/horticulturae11020113/s1, Table S1: List of species of Hoplolaimus and their accession numbers used for the present study.

Author Contributions

Conceptualization, E.S.; methodology, E.S.; software, E.S.; investigation, E.S. and P.M.; resources, E.S. and P.M.; writing—original draft preparation, E.S.; writing—review and editing, E.S.; and P.M. All authors have read and agreed to the published version of the manuscript.

Funding

This research received no external funding.

Data Availability Statement

All data for the present work were downloaded from GenBank (https://www.ncbi.nlm.nih.gov) (accessed on 1 November 2023). The accession IDs for 174 species are listed in Table S1.

Acknowledgments

The authors thank the University of Limpopo, for providing facilities for data analysis.

Conflicts of Interest

The authors declare no conflicts of interest.

References

  1. Shokoohi, E.; Abolafia, J.; Mashela, P.W. Redescription of Hoplolaimus indicus Sher, 1963 (Rhabditida, Hoplolaimidae) from Iran, including the first SEM study of the species. Biologia 2022, 77, 2161–2172. [Google Scholar] [CrossRef]
  2. Handoo, Z.; Golden, A.M. A key and diagnostic compendium to the species of the genus Hoplolaimus Daday, 1905 (Nematoda: Hoplolaimidae). J. Nematol. 1992, 24, 45–53. [Google Scholar]
  3. Olajide, E.; Singh, P.R.; Kolombia, Y.A.; Rumbarar, M.K.; Couvreur, M.; Bert, W. Characterization of Hoplolaimus seinhorsti and Hoplolaimus pararobustus (Tylenchina: Hoplolaimidae) from banana, with phylogeny and species delineation in the genus Hoplolaimus. J. Nematol. 2023, 55, 1–24. [Google Scholar] [CrossRef] [PubMed]
  4. Bae, C.H.; Robbins, R.T.; Szalanski, A.L. Molecular identification of some Hoplolaimus species from the USA based on duplex PCR, multiplex PCR and PCR-RFLP analysis. Nematology 2009, 11, 471–480. [Google Scholar] [CrossRef]
  5. Bae, C.H.; Szalanski, A.L.; Robbins, R.T. Molecular analysis of the lance nematode, Hoplolaimus spp., using the first internal transcribed spacer and the D2-D3 expansion segments of 28S ribosomal DNA. J. Nematol. 2008, 40, 201–209. [Google Scholar]
  6. Ma, X.; Agudelo, P.; Mueller, J.D.; Knap, H.T. Molecular characterization and phylogenetic analysis of Hoplolaimus stephanus. J. Nematol. 2011, 43, 25–34. [Google Scholar] [PubMed]
  7. Holguin, C.M.; Baeza, J.A.; Mueller, J.D.; Agudelo, P. High genetic diversity and geographic subdivision of three lance nematode species (Hoplolaimus spp.) in the United States. Ecol. Evol. 2015, 5, 2929–2944. [Google Scholar] [CrossRef] [PubMed]
  8. Triantafyllidis, A.; Abatzopoulos, T.; Economidis, P. Genetic differentiation and phylogenetic relationships among Greek Silurus glanis and Silurus aristotelis (Pisces, Siluridae) populations, assessed by PCR–RFLP analysis of mitochondrial DNA segments. Heredity. 1999, 82, 503–509. [Google Scholar] [CrossRef] [PubMed]
  9. Myers, N.; Mittermeier, R.A.; Mittermeier, C.G.; Da Fonseca, G.A.; Kent, J. Biodiversity hotspots for conservation priorities. Nature 2000, 403, 853–858. [Google Scholar] [CrossRef]
  10. Blouin, M.S.; Yowell, C.A.; Courtney, C.H.; Dame, J.B. Host movement and the genetic structure of populations of parasitic nematodes. Genetics 1995, 141, 1007–1014. [Google Scholar] [CrossRef] [PubMed]
  11. Gorton, M.J.; Kasl, E.L.; Detwiler, J.T.; Criscione, C.D. Testing local-scale panmixia provides insights into the cryptic ecology, evolution, and epidemiology of metazoan animal parasites. Parasitology 2012, 139, 981–997. [Google Scholar] [CrossRef] [PubMed]
  12. Huyse, T.; Poulin, R.; Theron, A. Speciation in parasites: A population genetics approach. Trends. Parasitol. 2005, 21, 469–475. [Google Scholar] [CrossRef]
  13. Kiontke, K.C.; Félix, M.; Ailion, M.; Rockman, M.V.; Braendle, C.; Pénigault, J.B.; Fitch, D.H.A. A phylogeny and molecular barcodes for Caenorhabditis, with numerous new species from rotting fruits. BMC Evol. Biol. 2011, 11, 339. [Google Scholar] [CrossRef] [PubMed]
  14. Nadler, S.A.; De León, G.P. Integrating molecular and morphological approaches for characterizing parasite cryptic species: Implications for parasitology. Parasitology 2012, 138, 1688–1709. [Google Scholar] [CrossRef]
  15. Palomares-Rius, J.E.; Cantalapiedra-Navarrete, C.; Castillo, P. Cryptic species in plant-parasitic nematodes. Nematology 2014, 16, 1105–1118. [Google Scholar] [CrossRef]
  16. Matczyszyn, J.N.; Harris, T.; Powers, K.; Everhart, S.E.; Powers, T.O. Ecological and morphological differentiation among COI haplotype groups in the plant parasitic nematode species Mesocriconema Xenoplax. J. Nematol. 2022, 54, 20220009. [Google Scholar] [CrossRef]
  17. Hall, T.A. BioEdit: A user-friendly biological sequence alignment editor and analysis program for Windows 95/98/NT. In Nucleic Acids Symposium Series; Information Retrieval Ltd.: London, UK, 1999; Volume 41, pp. 95–98. [Google Scholar]
  18. Thompson, J.D.; Higgins, D.G.; Gibson, T.J. CLUSTAL W: Improving the sensitivity of progressive multiple sequence alignment through sequence weighting, position-specific gap penalties and weight matrix choice. Nucleic Acids Res. 1994, 22, 4673–4680. [Google Scholar] [CrossRef] [PubMed]
  19. Kumar, S.; Stecher, G.; Li, M.; Knyaz, C.; Tamura, K. MEGA X: Molecular evolutionary genetics analysis across computing platforms. Mol. Biol. Evol. 2018, 35, 1547–1549. [Google Scholar] [CrossRef]
  20. Villesen, P. FaBox: An online toolbox for fasta sequences. Mol. Ecol. Notes 2007, 7, 965–968. [Google Scholar] [CrossRef]
  21. Rozas, J.; Sánchez-Delbarrio, J.C.; Messeguer, X.; Rozas, R. Dnasp, DNA polymorphism analyses by the coalescent and other methods. Bioinformatics 2003, 19, 2496–2497. [Google Scholar] [CrossRef]
  22. Leigh, J.W.; Bryant, D. PopART: Full-feature software for haplotype network construction. Methods Ecol. Evol. 2015, 6, 1110–1116. [Google Scholar] [CrossRef]
  23. Ronquist, F.; Huelsenbeck, J. MrBayes 3: Bayesian phylogenetic inference under mixed models. Bioinformatics 2003, 19, 1572–1574. [Google Scholar] [CrossRef] [PubMed]
  24. Darriba, D.; Taboada, G.L.; Doallo, R.; Posada, D. jModelTest 2: More models, new heuristics and parallel computing. Nat. Methods 2012, 9, 772. [Google Scholar] [CrossRef]
  25. Rambaut, A. FigTree v1.3.1. Institute of Evolutionary Biology; University of Edinburgh: Edinburgh, Scotland, 2010; Available online: https://tree.bio.ed.ac.uk/software/figtree/ (accessed on 25 December 2018).
  26. Excoffier, L.; Lischer, H.E.L. Arlequin suite ver 3.5: A new series of programs to perform population genetics analyses under Linux and Windows. Mol. Biol. Evol. 2010, 10, 564–567. [Google Scholar] [CrossRef]
  27. Tajima, F. Statistical method for testing the neutral mutation hypothesis by DNA polymorphism. Genetics 1989, 123, 585–595. [Google Scholar] [CrossRef]
  28. Fu, Y.X. Statistical tests of Neutrality of mutations against population growth, hitchhiking and background selection. Genetics 1997, 147, 915–925. [Google Scholar] [CrossRef]
  29. Bragard, C.; Baptista, P.; Chatzivassiliou, E.; Di Serio, F.; Gonthier, P.; Jaques Miret, J.A.; Justesen, A.F.; MacLeod, A.; Magnusson, C.S.; Milonas, P.; et al. Pest categorisation of Hoplolaimus galeatus. EFSA J. 2023, 21, e08117. [Google Scholar] [CrossRef] [PubMed]
  30. Khan, M.R.; Haque, Z.; Ahamad, F.; Shah, M.H. Nematode problems in rice and their sustainable management. In Nematode Diseases of Crops and Their Sustainable Management; Academic Press: Cambridge, MA, USA, 2023; pp. 133–166. [Google Scholar]
  31. Nei, M. Molecular Evolutionary Genetics; Columbia University Press: New York, NY, USA, 1987. [Google Scholar]
  32. O’Leary, S.J.; Hollenbeck, C.M.; Vega, R.R.; Portnoy, D.S. Disentangling complex genomic signals to understand population structure of an exploited, estuarine-dependent flatfish. Ecol. Evol. 2021, 11, 13415–13429. [Google Scholar] [CrossRef]
  33. Vásquez-Aguilar, A.A.; Barbachano-Guerrero, A.; Angulo, D.F.; Jarquín-Díaz, V.H. Phylogeography and population differentiation in Hepatozoon canis (Apicomplexa: Hepatozoidae) reveal expansion and gene flow in world populations. Parasit. Vectors. 2021, 14, 467. [Google Scholar] [CrossRef] [PubMed]
  34. Zu, Y.G.; Sun, M.; Kang, L. The Theory, Method, and Application of Molecular Ecology; Higher Education Press: Beijing, China, 1999; pp. 30–37. [Google Scholar]
  35. Eckshtain-Levi, N.; Weisberg, A.J.; Vinatzer, B.A. The population genetic test Tajima’s D identifies genes encoding pathogen-associated molecular patterns and other virulence-related genes in Ralstonia solanacearum. Mol. Plant. Pathol. 2018, 19, 2187–2192. [Google Scholar] [CrossRef]
  36. Chapuis, M.P.; Loiseau, A.; Michalakis, Y.; Lecoq, M.; Franc, A.; Estoup, A. Outbreaks, gene flow and effective population size in the migratory locust, Locusta migratoria: A regional-scale comparative survey. Mol. Ecol. 2009, 18, 792–800. [Google Scholar] [CrossRef] [PubMed]
  37. Ray, N.; Currat, M.; Excoffier, L. Intra-deme molecular diversity in spatially expanding populations. Mol. Biol. Evol. 2003, 20, 76–86. [Google Scholar] [CrossRef] [PubMed]
  38. Rogers, A.R.; Harpending, H. Population growth makes waves in the distribution of pairwise genetic differences. Mol. Biol. Evol. 1992, 9, 552–569. [Google Scholar] [PubMed]
  39. Cortes-Rodríguez, N.; Hernández-Baños, B.E.; Navarro-Sigüenza, A.G.; Omland, K.E. Geographic variation and genetic structure in the Streak-backed Oriole: Low mitochondrial DNA differentiation reveals recent divergence. Condor 2008, 110, 729–739. [Google Scholar] [CrossRef]
  40. Apolônio Silva de Oliveira, D.; Decraemer, W.; Moens, T.; Dos Santos, G.A.P.; Derycke, S. Low genetic but high morphological variation over more than 1000 km coastline refutes omnipresence of cryptic diversity in marine nematodes. BMC Evol. Biol. 2017, 17, 71. [Google Scholar] [CrossRef] [PubMed]
  41. Hada, A.; Singh, D.; Venkata Satyanarayana, K.K.V.; Chatterjee, M.; Phani, V.; Rao, U. Effect of fluensulfone on different functional genes of root-knot nematode Meloidogyne incognita. J. Nematol. 2021, 53, e2021-73. [Google Scholar] [CrossRef]
  42. Derycke, S.; Remerie, T.; Vierstraete, A.; Backeljau, T.; Vanfleteren, J.; Vincx, M.; Moens, T. Mitochondrial DNA variation and cryptic speciation within the free-living marine nematode Pellioditis marina. Mar. Ecol.-Prog. Ser. 2005, 300, 91–103. [Google Scholar] [CrossRef]
  43. Ristau, K.; Steinfartz, S.; Traunspurger, W. First evidence of cryptic species diversity and significant population structure in a widespread freshwater nematode morphospecies (Tobrilus gracilis). Mol. Ecol. 2013, 22, 4562–4575. [Google Scholar] [CrossRef] [PubMed]
Figure 1. A median-joining network of Hoplolaimus species haplotypes. The size of the circle indicates the relative frequency of the corresponding haplotype, and the colors represent the corresponding species.
Horticulturae 11 00113 g001
Figure 2. The Bayesian tree inferred for Hoplolaimus species using haplotypes.
Horticulturae 11 00113 g002
Figure 3. Mismatch distribution graphs for Hoplolaimus species. The x-axis shows the number of pairwise differences; the y-axis shows the frequency of the pairwise comparisons. The red line represents the observed frequencies. The green line depicts the expected frequency under the population expansion model hypothesis.
Horticulturae 11 00113 g003
Table 1. Genetic diversity values for the 174 sequences of Hoplolaimus using mtDNA cytochrome c oxidase I [n = sample size, S = number of segregating sites, h = number of haplotypes, Hd = haplotype diversity, π = nucleotide diversity, and Fu = mutation rate].
SpeciesnShHdπTajima’s DFu
H. concaudajuvencus12230.320.0016−0.84971−0.725
H. magnistylus2240110.850.049150.773622.616
H. galeatus272670.670.034791.320916.902
H. stephanus5250140.890.067461.712019.731 **
H. pararobustus52240.900.040480.578411.890
H. columbus52120.660.00026−0.87674−0.917
** significant at p < 0.01.
Table 2. AMOVA analysis was carried out using the Arlequin program for 174 sequences of Hoplolaimus species, based on COI.
Source of VariancedfSum of SquaresVariance Component% Total of VarianceSignificance
Among populations7152,012.047868.08586.3p < 0.001
Within populations16622,889.976137.89113.7p < 0.001
Total173174,902.0231005.976100p < 0.001
Table 3. Heatmap of pairwise FST values estimated from mitochondrial DNA sequence data (Fst p value significance level = 0.0500).
SpeciesH. concaudajuvencusH. stephanusH. magnistylusH. galeatusH. pararobustusH. columbus
H. concaudajuvencus0
H. stephanus0.620
H. magnistylus0.740.480
H. galeatus0.840.650.750
H. pararobustus0.920.750.810.860
H. columbus0.970.890.940.950.950
Table 4. Raggedness index for the species studied of Hoplolaimus.
SpeciesRaggedness Indexp-Value
H. concaudajuvencus0.66670.2357
H. stephanus0.02000.2018
H. magnistylus0.03240.2327
H. galeatus0.06350.1700
H. pararobustus0.33330.2189
H. columbus2.00000.5000
Disclaimer/Publisher’s Note: The statements, opinions and data contained in all publications are solely those of the individual author(s) and contributor(s) and not of MDPI and/or the editor(s). MDPI and/or the editor(s) disclaim responsibility for any injury to people or property resulting from any ideas, methods, instructions or products referred to in the content.