Article

Effect of Volatile Compounds Emitted by an Endophytic Yeast Isolated from the Endemic Plant Echinopsis chiloensis against Botrytis cinerea

Facultad de Química y Biología, Universidad de Santiago de Chile, Avenida Bernardo O’Higgins 3363, Estación Central, Santiago 9170022, Chile
*
Authors to whom correspondence should be addressed.
Horticulturae 2024, 10(9), 1005; https://doi.org/10.3390/horticulturae10091005
Submission received: 23 August 2024 / Revised: 18 September 2024 / Accepted: 19 September 2024 / Published: 22 September 2024
(This article belongs to the Special Issue Alternative Control of Fruit Phytopathogens Pre- and Postharvest)

Abstract

:
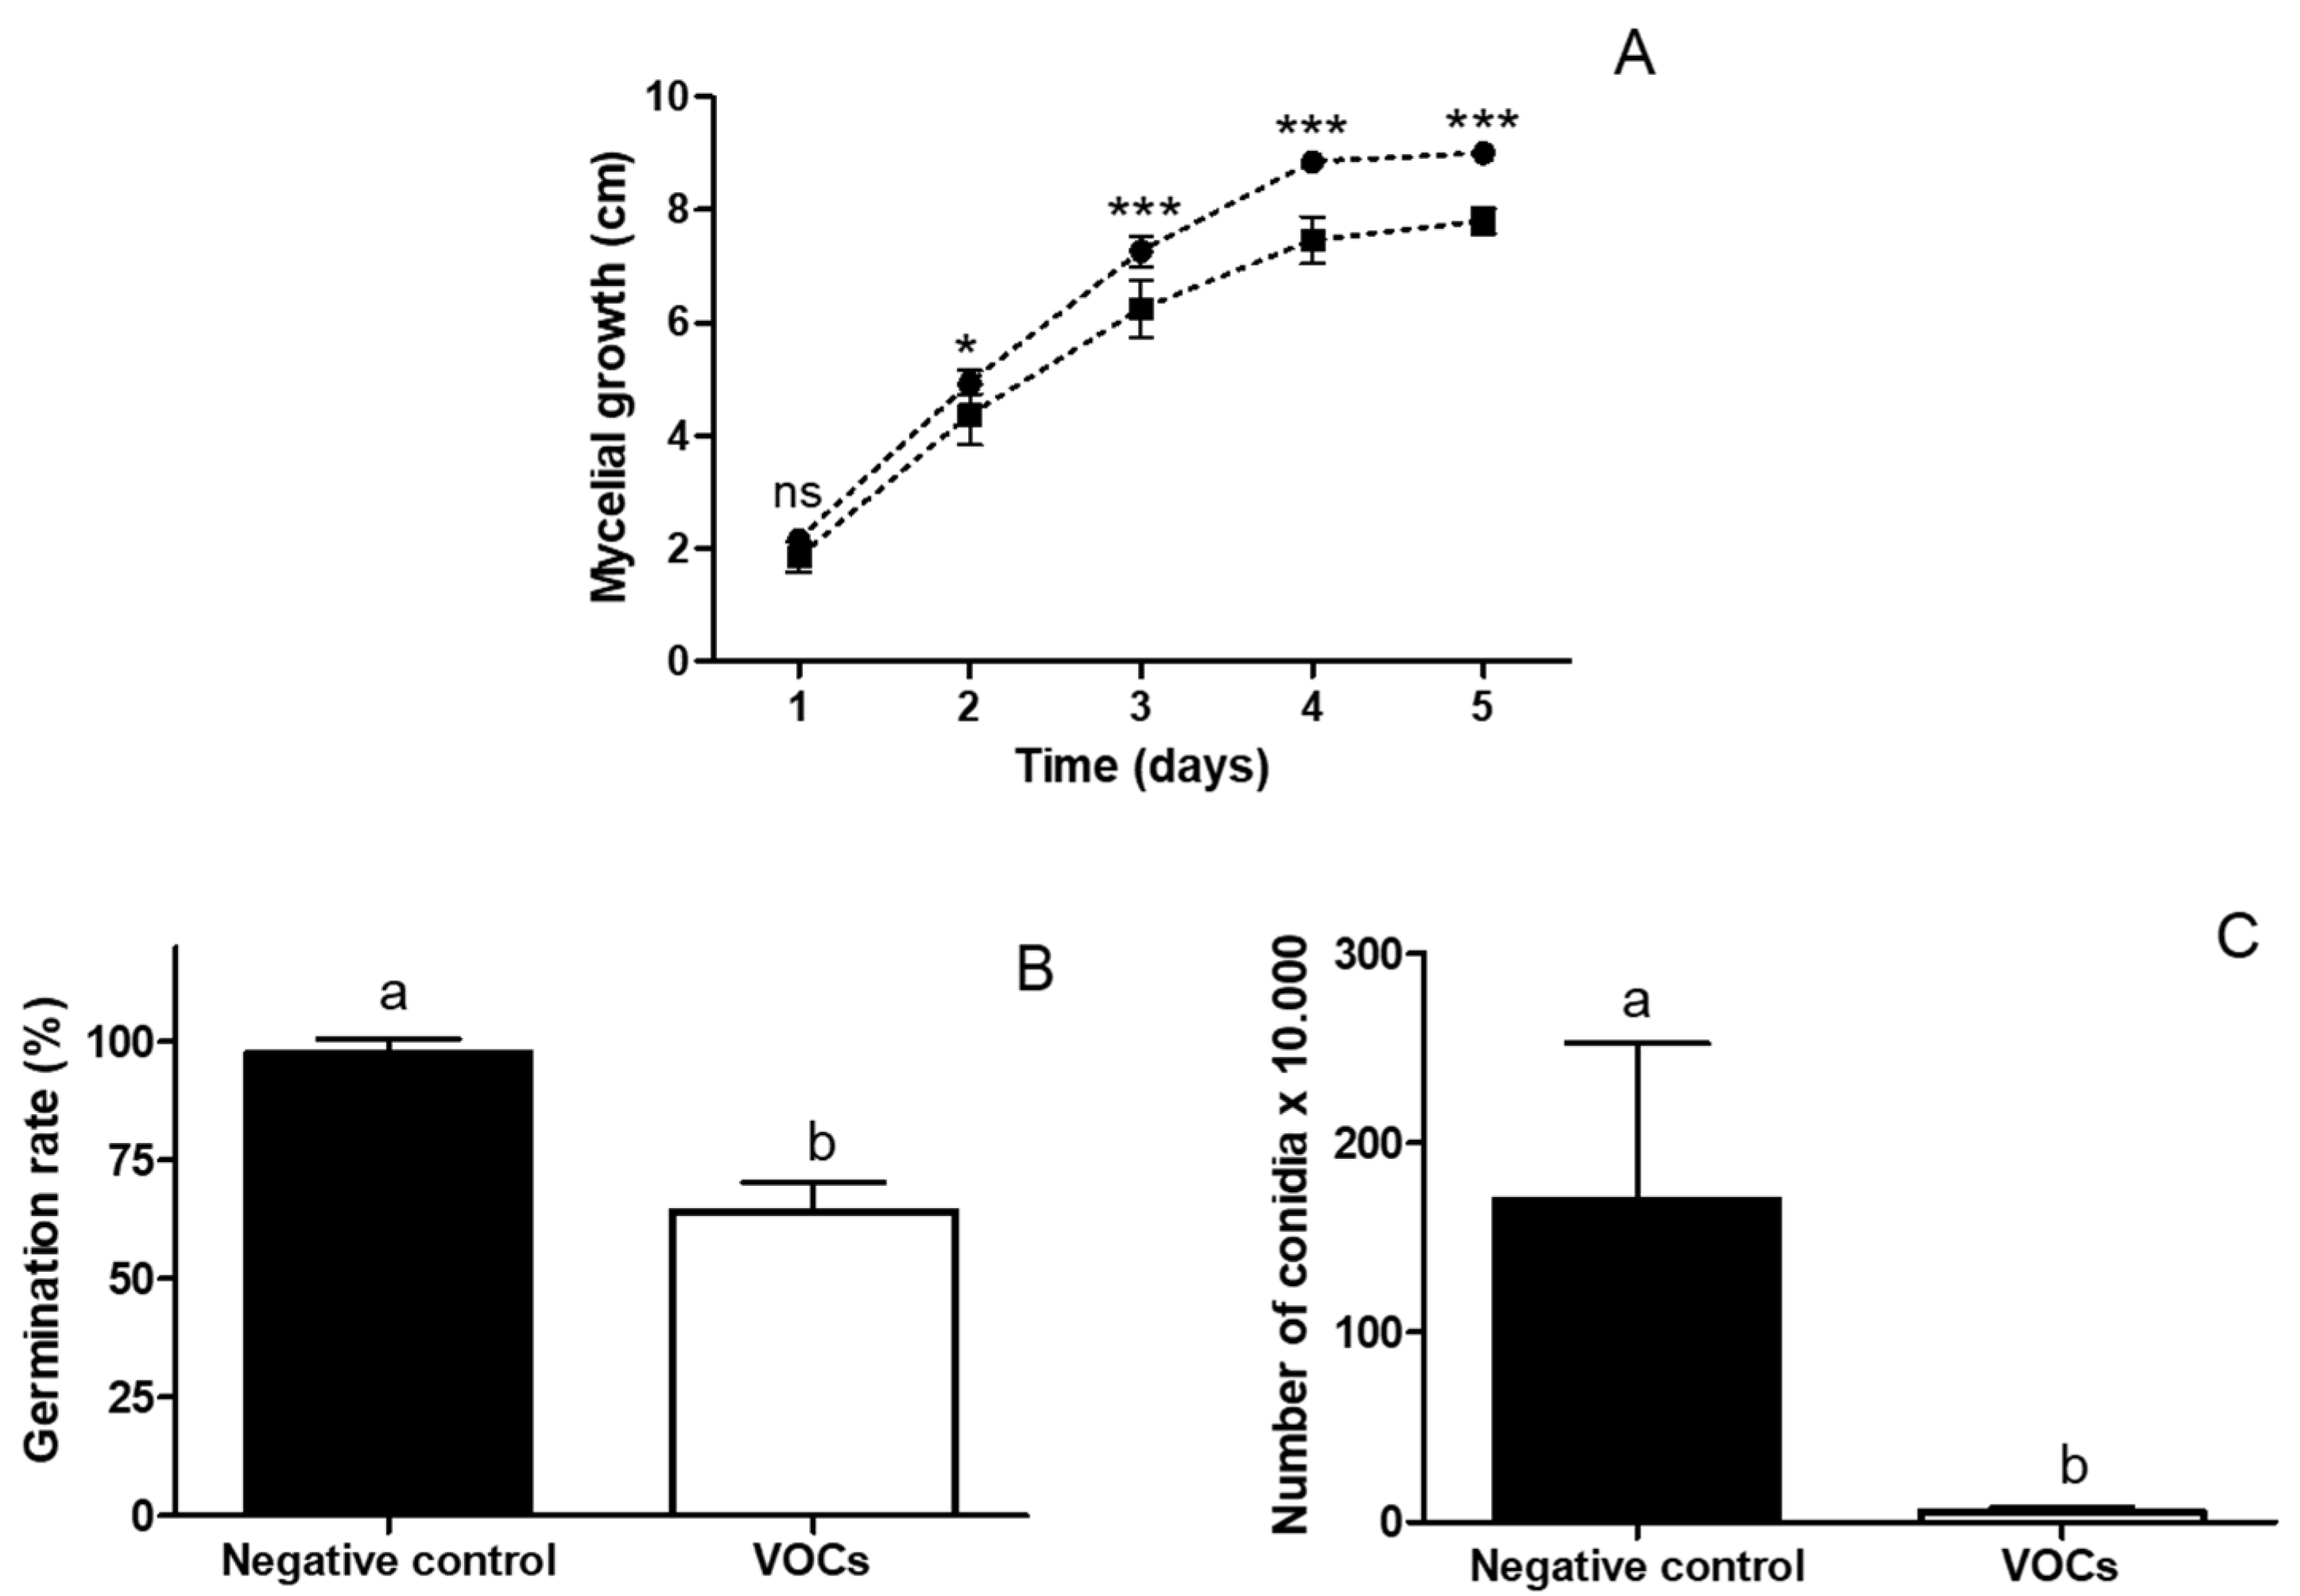
Our research group isolated an endophyte yeast from the endemic plant Echinopsis chiloensis. This yeast, identified as Naganishia sp, produces volatile organic compounds (VOC) with antifungal activity against Botrytis cinerea. Due to the need for alternative control methods for this pathogen, the effect of VOC on B. cinerea was analyzed. On the fourth day of cultivation, in the presence of VOCs, the mycelial growth of B. cinerea stopped. VOCs inhibited 32.8% of the conidia germination and reduced sporulation by 70.6%. These compounds promoted the formation of infection cushions. VOCs caused damage to the cell wall and plasma membrane in B. cinerea. On the other hand, the volatile compounds induced oxidative stress, and led to membrane lipid peroxidation after 16 and 24 h of incubation in the presence of VOCs, because an increased level of malondialdehyde content was observed. These compounds exerted a fungistatic effect on B. cinerea. The volatile compounds emitted by Naganishia sp were identified by gas chromatography coupled with mass spectrometry as 3-methylbutyl acetate, ethylbenzene, 1-ethyl-3-methylbenzene, 2-phenylethanol, 2-heptanone and (5E)-6,10-dimethylundeca-5,9-dien-2-one. The most abundant volatile compound, 2-phenylethanol, inhibited the mycelial growth of B. cinerea with an IC50 value of 0.21 µL mL−1. The effect of this pure compound was also fungistatic. Finally, it was shown that volatile compounds decreased the severity of B. cinerea infection in tomatoes and grapes by 64.7 and 43,1%, respectively. This is the first report identifying volatile compounds emitted by a Naganishia sp. and describing their mode of action against B. cinerea.

1. Introduction

The phytopathogenic fungus Botrytis cinerea infects approximately 616 genera of plants worldwide, causing grey mould in agricultural crops [1]. It is considered the second most important phytopathogenic fungus in agriculture [2], producing economic losses of up to 100 billion dollars [3]. Infection by B. cinerea initiates through conidia, which serve as the primary mechanism of pathogen dissemination [4]. Subsequently, the fungus penetrates plant tissues using appressoria or multicellular appressoria known as infection cushions (IC). The presence of IC has been associated with increased levels of reactive oxygen species [5]. Once established, B. cinerea colonizes the plants and develops conidiophores containing numerous conidia [4].
The use of synthetic fungicides is the main method for controlling B. cinerea [6]. However, managing this disease is difficult due to the B. cinerea isolates resistant to fungicides [7,8]. Furthermore, fungicides are toxic and leave residues that can be harmful to human and animal health, as well as the environment [4]. Consequently, alternative control methods have been studied [6]. Microbial and natural product-based biofungicides offer potential solutions to reduce the reliance on synthetic fungicides [9].
Endophytic fungi are considered novel sources of biofungicides [10]. In Chile, endophytic fungi that inhibit the growth of B. cinerea have been isolated from native, endemic, and introduced plants [11,12,13,14]. It has been suggested that plants inhabiting high-elevation areas provide unique biotic environments that allow the isolation of endophytic fungi capable of synthesizing bioactive compounds that help plants resist adverse environmental conditions [15,16,17]. Recent studies reported that endophytic fungi, isolated from Echinopsis chiloensis, inhibited the growth of B. cinerea by antibiosis [12,14]. This plant was located at 1200 m above sea level, in a region with a Mediterranean climate, characterized by rainy winters and long dry summers [18]. E. chiloensis is an endemic cactus inhabiting semi-arid environments in central-northern Chile [19].
Previously, our research group isolated an endophytic yeast from E. chiloensis. The isolate, named Ec2, emitted volatile organic compounds (VOCs) with antifungal activity against B. cinerea. Therefore, the objectives of this work were (i) to identify to the genera level the endophytic yeast Ec2, (ii) to identify the VOCs emitted by the yeast and (iii) to characterize the antifungal activity against B. cinerea of VOCs produced by the endophytic yeast.

2. Materials and Methods

2.1. Strains and Growth Conditions

The strains used in this study were maintained on Potato Dextrose Agar (PDA) medium (Sigma-Aldrich, St Louis, MO, USA) at 4 °C in darkness until use. In this study, the isolate G29 of B. cinerea was used. G29 isolate was obtained from naturally infected grape (Vitis vinifera) sampled from an orchard in the Central Valley of Chile. The isolate was then purified by monospore isolation [20]. The endophytic yeast (Ec2) was isolated from healthy tissue of the endemic plant E. chiloensis, as mentioned by [14]. This plant was located in the Andean Precordillera of Chile (Latitude: −33°46′8.76″; Longitude: −70°16′35.03″) and at an altitude of 1200 m above sea level. The isolate was deposited in the Chilean Collection of Microbial Genetic Resources (CChRGM) with the number RGM 3436.

2.2. Identification of Endophytic Yeast

The endophytic yeast (Ec2) genus was identified using molecular techniques, with the internal transcript spacer regions (ITS1 and ITS4) as markers. For this purpose, the yeast was inoculated on cellophane paper, which was on the PDA medium in the Petri dishes. The culture was incubated for 3 days at 22 °C. The yeast was then recovered from the cellophane paper, and the genomic DNA was extracted using the CTAB method with the modifications described by Vidal et al. [14]. The ITS sequences were amplified using the ITS-1 and ITS-4 primers described by White et al. [21]. Forward primer: ITS-1 5′-TCCGTAGGTGAACCTGCGG-3′and reverse primer: ITS-4 5′-TCCTCCGCTTATTGATATGC-3′. The PCR reaction was performed as in Vidal et al. [14]. PCR products were sequenced by the Unidad de Secuenciación y Tecnologías Ómicas (Pontificia Universidad Católica de Chile, Santiago, Chile). Fungal ITS region sequences from Ec2 were manually edited using Geneious Prime® 2020.0.4 software. The consensus nucleotide sequence was submitted to the GenBank NCBI database with the accession number OP880438.1. This sequence was then aligned with the sequences present in the database using the Basic Local Alignment Search Tool (BLASTn) to search sequences that presented high similarity with them. Considering the sequences with the highest score, new sequences of strain types were selected for different species of the genus Naganishia, and a sequence from Filobasidium oriense was used as the outgroup. Geneious Prime® 2020.0.4 software was used to prepare a dendrogram after an alignment of the sequence using the clustal W algorithm and Tamura–Nei genetic distance model with the neighbor-joining method. The resampling for dendrogram was 1,000 bootstrap, and the support threshold was 50% [22].

2.3. GC-MS/MS Analysis of VOCs Emitted by Endophyte Yeast Ec2

VOC composition was qualitatively evaluated by headspace coupled with gas chromatography-mass spectrometry. The VOCs emitted by Ec2 were collected using head space-solid phase microextraction (HS-SPME) methodology and analyzed by tandem gas chromatography/mass spectrometry (GC/MS-MS). For this purpose, Ec2 was inoculated in Petri dishes containing PDA. A circular hole of 0.8 mm was made in the side of the Petri dishes, which were coated with Parafilm® (Sigma-Aldrich, St Louis, MO, USA). Cultures were incubated 3, 7, and 12 days at 22 °C. After these incubation times, a divinylbenzene/carboxen/polydimethylsiloxane (DVB/CAR/PDMS) coated fiber (1 cm long, 65 µm film thickness(Supelco, Bellefonte, PA, USA.) was introduced into the Petri dish through the hole. Then, the system was incubated at room temperature for 1 h. Desorption of the compounds and chromatography were carried out using a Trace 1300 gas chromatograph coupled to a TSQ 8000 Triple Quadrupole mass spectrometer (Thermo Fisher Scientific Inc., Waltham, MA, USA) in a full-scan mode. Desorption of the fiber was carried out at 240 °C for 10 min and cleaned at 270 °C for 15 min. Targeted volatiles loaded in the fiber were analyzed by GC/MS and separated using a Rtx®-5MS non-polar stationary phase column (60 m length, 250 μm inner diameter, and 0.25 μm thickness; RestekTM, Bellefonte, PA, USA). Helium was used as carrier gas at a constant flow rate of 1.2 mL/min. Mass spectrometry detection was performed as reported by Urbina et al. (2020) [23]. VOCs were analyzed using Xcalibur™ 2.4.0 software (Thermo Fisher Scientific Inc., Waltham, MA, USA) by matching mass spectra with the National Institute of Standards and Technology (NIST) MS Spectral Library 2017. The same procedure was made in control experiments, in which Petri dishes containing PDA were not inoculated with the endophytic yeast.
Chromatographic peaks were identified and were considered when their similarity index (SI) and reverse similarity index (RSI) were above 850 [24], and the signals appeared three times in separate measurements. Selected chromatographic peaks were confirmed with their respective chemical alkane standards and Kovats retention indices. All cultures and measurements were performed in triplicate.

2.4. In Vitro Antifungal Assay of VOCs

The antifungal effect of VOCs emitted by the endophytic yeast was tested against B. cinerea using a double Petri dish assay. For this, Petri dishes containing PDA were inoculated by spreading 50 µL of a suspension (106 cell mL−1) of yeast Ec2. The culture was incubated at 7 days at 22 °C. The lid of the Petri dish was replaced by the base of a Petri dish containing PDA inoculated with a 5 mm disk of 3-day-old B. cinerea mycelium. The two base plates were sealed together with Parafilm and were incubated in the dark at 22 °C. In control, double Petri dish assay was carried out in the same conditions, but without the presence of Ec2.

2.5. Effect of Volatile Compounds Emitted by Ec2 on B. cinerea

The effect of VOCs on mycelial growth, sporulation, germination of conidia, and formation of conidiophores of B. cinerea was evaluated using the double Petri dish assay.
B. cinerea growth was evaluated by comparing the radial growth of the mycelium with the control. The percentage of inhibition of mycelial growth was calculated with the Formula (1):
I n h i b i t i o n   % = R 0 R x R 0 × 100
where R0 is the radial growth of the B. cinerea in the control, and Rx is the radial growth of B. cinerea in the presence of the endophyte yeast.
To analyze the effect of VOCs on the sporulation of B. cinerea, conidia were obtained from the cultures of B. cinerea in the presence or absence of the endophyte yeast, after 7 days of incubation by adding 3 mL of 0.9% w/v NaCl at 22 °C. Conidia were counted using a Neubauer chamber.
The effect of VOCs on spore germination was determined by using a modification of the double Petri dish assay. For this, B. cinerea conidia, at a final concentration of 104 conidia mL−1, were inoculated in 4.5 cm Petri dishes. These Petri dishes contained 3 mL of liquid minimum medium [14] and a glass microscope slide. The lid of the Petri dish was replaced by the base of a Petri dish with a 7-day culture of endophyte growing on PDA. Plates were sealed and incubated for 6 h at 22 °C in darkness. Control was prepared the same as described above but without endophyte. The microscope slide containing B. cinerea germinated conidia was observed in a light microscope and the determination of the conidia germination was carried out as in Yalage et al. [25].
In the analysis of the effect of VOCs emitted by Ec2 on mycelial growth, conidia germination and sporulation of B. cinerea, three independent experiments were performed, each one in triplicate.
The effect of VOCs on the formation of B. cinerea conidiophores was examined using the slide culture technique as described by Rizal et al. [26]. For this, B. cinerea was inoculated onto a 2 cm2 block of PDA. A sterile coverslip was placed on top of the inoculated block, and the slide was placed in a Petri dish containing filter paper and 30% v/v glycerol to maintain humidity. The lid of the Petri dish was replaced by the base of a Petri dish with a 7-day culture of endophyte growing on PDA. Plates were sealed and incubated at 22 °C until the formation of aerial structures. The effect of the VOCs on conidiophore formation was determined using an optical microscope and compared to a negative control without the endophyte. Visualization of the aerial structures was performed as described [14].

2.6. Mode of Action of VOCs on B. cinerea

To determine the mode of action of VOCs on B. cinerea, the integrity of the membrane and wall cell and the generation of oxidative stress were analyzed.
The integrity of the plasmatic membrane and the cell wall of B. cinerea was determined using the SYTOX Green (Molecular Probes, Eugene, OR, USA) or Calcofluor White (Sigma-Aldrich, St Louis, MO, USA), respectively. The formation of reactive oxygen species (ROS) was evaluated using the dichloro-dihydro-fluorescein diacetate (DCFH-DA) (Santa Cruz, Biotechnology Inc, Dallas, TX, USA). For these assays, the same procedure as for spore germination was used.
For the SYTOX Green stain, cultures were incubated at 22 °C for 6 h to allow the germination of the conidia. After this period, germinated conidia of B. cinerea were exposed to VOCs as described above. The cultures were incubated at 22 °C for 6, 16, and 24 h under continuous agitation at 140 rpm. As a positive control, germinated conidia were incubated for 10 min with 70% v/v ethanol. For the negative control, the same test was carried out, but using a PDA plate without inoculating with the endophytic yeast. After the incubation time, B. cinerea hyphae adhered to glass were stained with SYTOX Green as described [27]
For the Calcofluor White stain, the cultures were incubated at 22 °C for 16 and 24 h with agitation at 140 rpm. As a positive control, B. cinerea was treated with hydrolytic enzymes from Trichoderma harzianum (Sigma-Aldrich, St Louis, MO, USA) at 5 mg L−1 (in 0.7 M KCl, buffer PBS pH 5.8) for 1 h at 20 °C. Additionally, for the negative control, the same test was carried out, but using a PDA plate without inoculating with the endophytic yeast. After the incubation time, B. cinerea hyphae adhered to glass coverslips were stained with Calcofluor White as described in [27].
To study the effect on the formation of reactive oxygen species, cultures were incubated at 22 °C with agitation at 140 rpm for 16 and 24 h. As a positive control, B. cinerea was treated with 300 mM H2O2 for 1 h at 20 °C. Additionally, a negative control was conducted, excluding the presence of the endophytic fungus. The samples were treated with 10 µM of DCFH-DA for 20 min. Subsequently, a washing procedure, similar to those described for the SYTOX Green assay was carried out. The fluorescence of B. cinerea hyphae stained with DCFH-DA was visualized under an epifluorescence microscope at an excitation wavelength of 488 nm and an emission wavelength of 540 nm.
Oxidative stress in the plasmatic membrane produced by Ec2 VOCs was determined by malondialdehyde (MDA) formation as a marker of lipid peroxidation. For this purpose, the thiobarbituric acid reactive substances (TBARS) assay was carried out as in Pagès et al. [28] with some modifications. In total, 50 mg of fresh B. cinerea mycelium treated with VOCs emitted by the endophyte Ec2 as mentioned, above were recovered and sonicated with 0.1% w/v trichloroacetic acid (TCA). The samples were then centrifuged at 10,000× g for 15 min at 4 °C. In total, 150 µL of supernatant was added to 450 µL of 0.5% w/v thiobarbituric acid (TBA) in a 20% w/v TCA solution. The solution was incubated at 95 °C for 20 min, then was cooled to room temperature, and centrifuged at 16,000× g for 5 min. The absorbance of the supernatant was measured at 532 nm. MDA equivalents were determined using a molar extinction coefficient of 155 mM−1 cm−1, as described in Hodges et al. [29]. Results were expressed as MDA equivalents (nM g−1 fresh weight). A negative control was conducted without incubation with the endophytic yeast.
To determine the mode of action of VOCs on B. cinerea, three independent experiments were carried out, each one in triplicate.

2.7. Analysis of the Fungicidal or Fungistatic Effect of VOCs

The fungicidal or fungistatic effect of VOCs was analyzed using the 3-[4,5-dimethylthiazol-2-yl]-2,5-diphenyltetrazolium bromide (MTT) assay (Thermo Fisher Scientific Inc., Waltham, MA, USA). For this, a double Petri dish assay was carried out as mentioned above. The assay was carried out in B. cinerea mycelium exposed to VOCs emitted by the endophyte Ec2. B. cinerea mycelium without VOC exposure served as a negative control, while mycelium treated with 70% v/v ethanol was used as a positive control. In total, 50 mg of mycelium of B. cinerea were incubated with nine µL of 5 mg mL−1 of MTT reagent stock in 300 µL of 100 mM buffer sodium phosphate pH 7.0 at 30 °C in the dark for 3 h at 140 rpm. Mycelium was then centrifuged for 10 min at 4000× g. The produced formazan in the mycelium was extracted with 500 µL of acidified isopropanol. The solution was incubated for 30 min at room temperature, and centrifuged for 10 min at 4000× g. Finally, the absorbance of the supernatants was measured at 570 nm.
To determine whether the VOCs emitted by the endophyte had a fungicidal or fungistatic effect, B. cinerea mycelium exposed to VOCs using the double Petri dish assay was re-inoculated onto a fresh PDA medium. Radial mycelial growth of these treated samples was compared to a control consisting of mycelium not previously exposed to VOCs.
The fungistatic effect of 2-phenylethanol, the most abundant volatile compound emitted by the endophyte Ec2, was analyzed on B. cinerea mycelium. For this, pieces of B. cinerea mycelium were inoculated in the center of Petri dishes containing PDA and incubated for 48 h at 22 °C. After this initial incubation, the lids of the plates were replaced with base plates containing filter papers with different amounts of 2-phenylethanol (Merck, Santiago, Chile). The concentrations of 2-phenylethanol used in each treatment are shown in Table 1. The plates were sealed with Parafilm and incubated at 22 °C for an additional 48 h. A control treatment used filter paper without 2-phenylethanol. After this second incubation period, the mycelial growth inhibition was determined using Formula (1), but Rx represents the radial mycelial growth of B. cinerea in the presence of 2-phenylethanol. A log-probit analysis with linear regression was used to determine the concentration of 2-phenylethanol that caused 50% inhibition of mycelial growth (IC50). Additionally, plugs of B. cinerea mycelium treated and not treated with 2-phenylethanol were re-inoculated in a fresh PDA medium. After 36 h of incubation at 22 °C, the mycelial growth was evaluated.
In these experiments, three independent experiments were performed, each one in triplicate.

2.8. Effect of VOCs on B. cinerea Growth In Vivo

The effect of VOCs on B. cinerea growth in vivo was evaluated using an antifungal assay on tomato fruit and grapes inoculated with B. cinerea. Disinfected fruits (tomato or grape), with 1% v/v sodium hypochlorite solution and 70% v/v ethanol, were wounded and inoculated with a 5 mm disk of 3-day-old B. cinerea mycelium. Tomatoes (Long life variety) were placed in a 15.5 cm × 21 cm × 10.5 cm plastic box with three Petri dishes containing a 7-day PDA culture of the Ec2 endophyte yeast or three Petri dishes containing PDA without inoculating with the endophyte. The Petri dishes were left open, and the box was sealed with two turns of Parafilm® to prevent the escape of VOCs. Negative control, tomatoes were wounded and inoculated with a 5 mm disk of PDA without B. cinerea mycelium. The same experiment was carried out using previously disinfected grapes (Red Globe variety). The grapes were wounded and were inoculated with B. cinerea. The grapes were placed inside 15.5 cm × 21 cm × 7 cm boxes with two Petri dishes inoculated with the endophyte fungus Ec2. These experiments were performed three times with three replicates.
The severity of the infection was calculated using Formula (2), and the infection area was measured using the Image J software version 1.54k.
S e v e r i t y   % = i n f e c t i o n   a r e a   o f   t r e a t m e n t   w i t h   t h e   e n d o p h y t e i n f e c t i o n   a r e a   o f   t r e a t m e n t   w i t h o u t   t h e   e n d o p h y t e × 100

2.9. Statistical Analysis

In all experiments, three biological replicates in triplicate were carried out. Statistical analyses were conducted using GraphPad Prism 5.0. To determine the effects of the different treatments, comparisons were made against the untreated control. Student’s t-test or Analysis of variance (ANOVA) with Tukey’s test was carried out for parametric data. For non-parametric data, Mann–Whitney or Kruskal–Wallis test with Dunn’s post-test was used. Results with a p-value below 0.05 were considered statistically significant.

3. Results

3.1. Molecular Identification of Ec2 Endophyte

The yeast was identified at the genera level by comparing the ITS region. The amplified sequence of a partial region of the rDNA was edited to create a consensus sequence, which was submitted to the NCBI database and was assigned the accession number OP880438.1. Similar sequences to OP880438.1 were searched by comparing them with the sequences present in the NCBI database using the BLASTn algorithm. Considering the results with the highest score, a second alignment was carried out using ITS sequences from type strains of various species of Naganishia. Figure 1 shows that in the neighboring tree, the sequence of the endophytic yeast Ec2 was grouped in an internal cluster with Naganishia species, and shares the final clade with Naganishia uzbekistanensis [30].

3.2. Identification of VOCs Emitted by Naganishia sp.

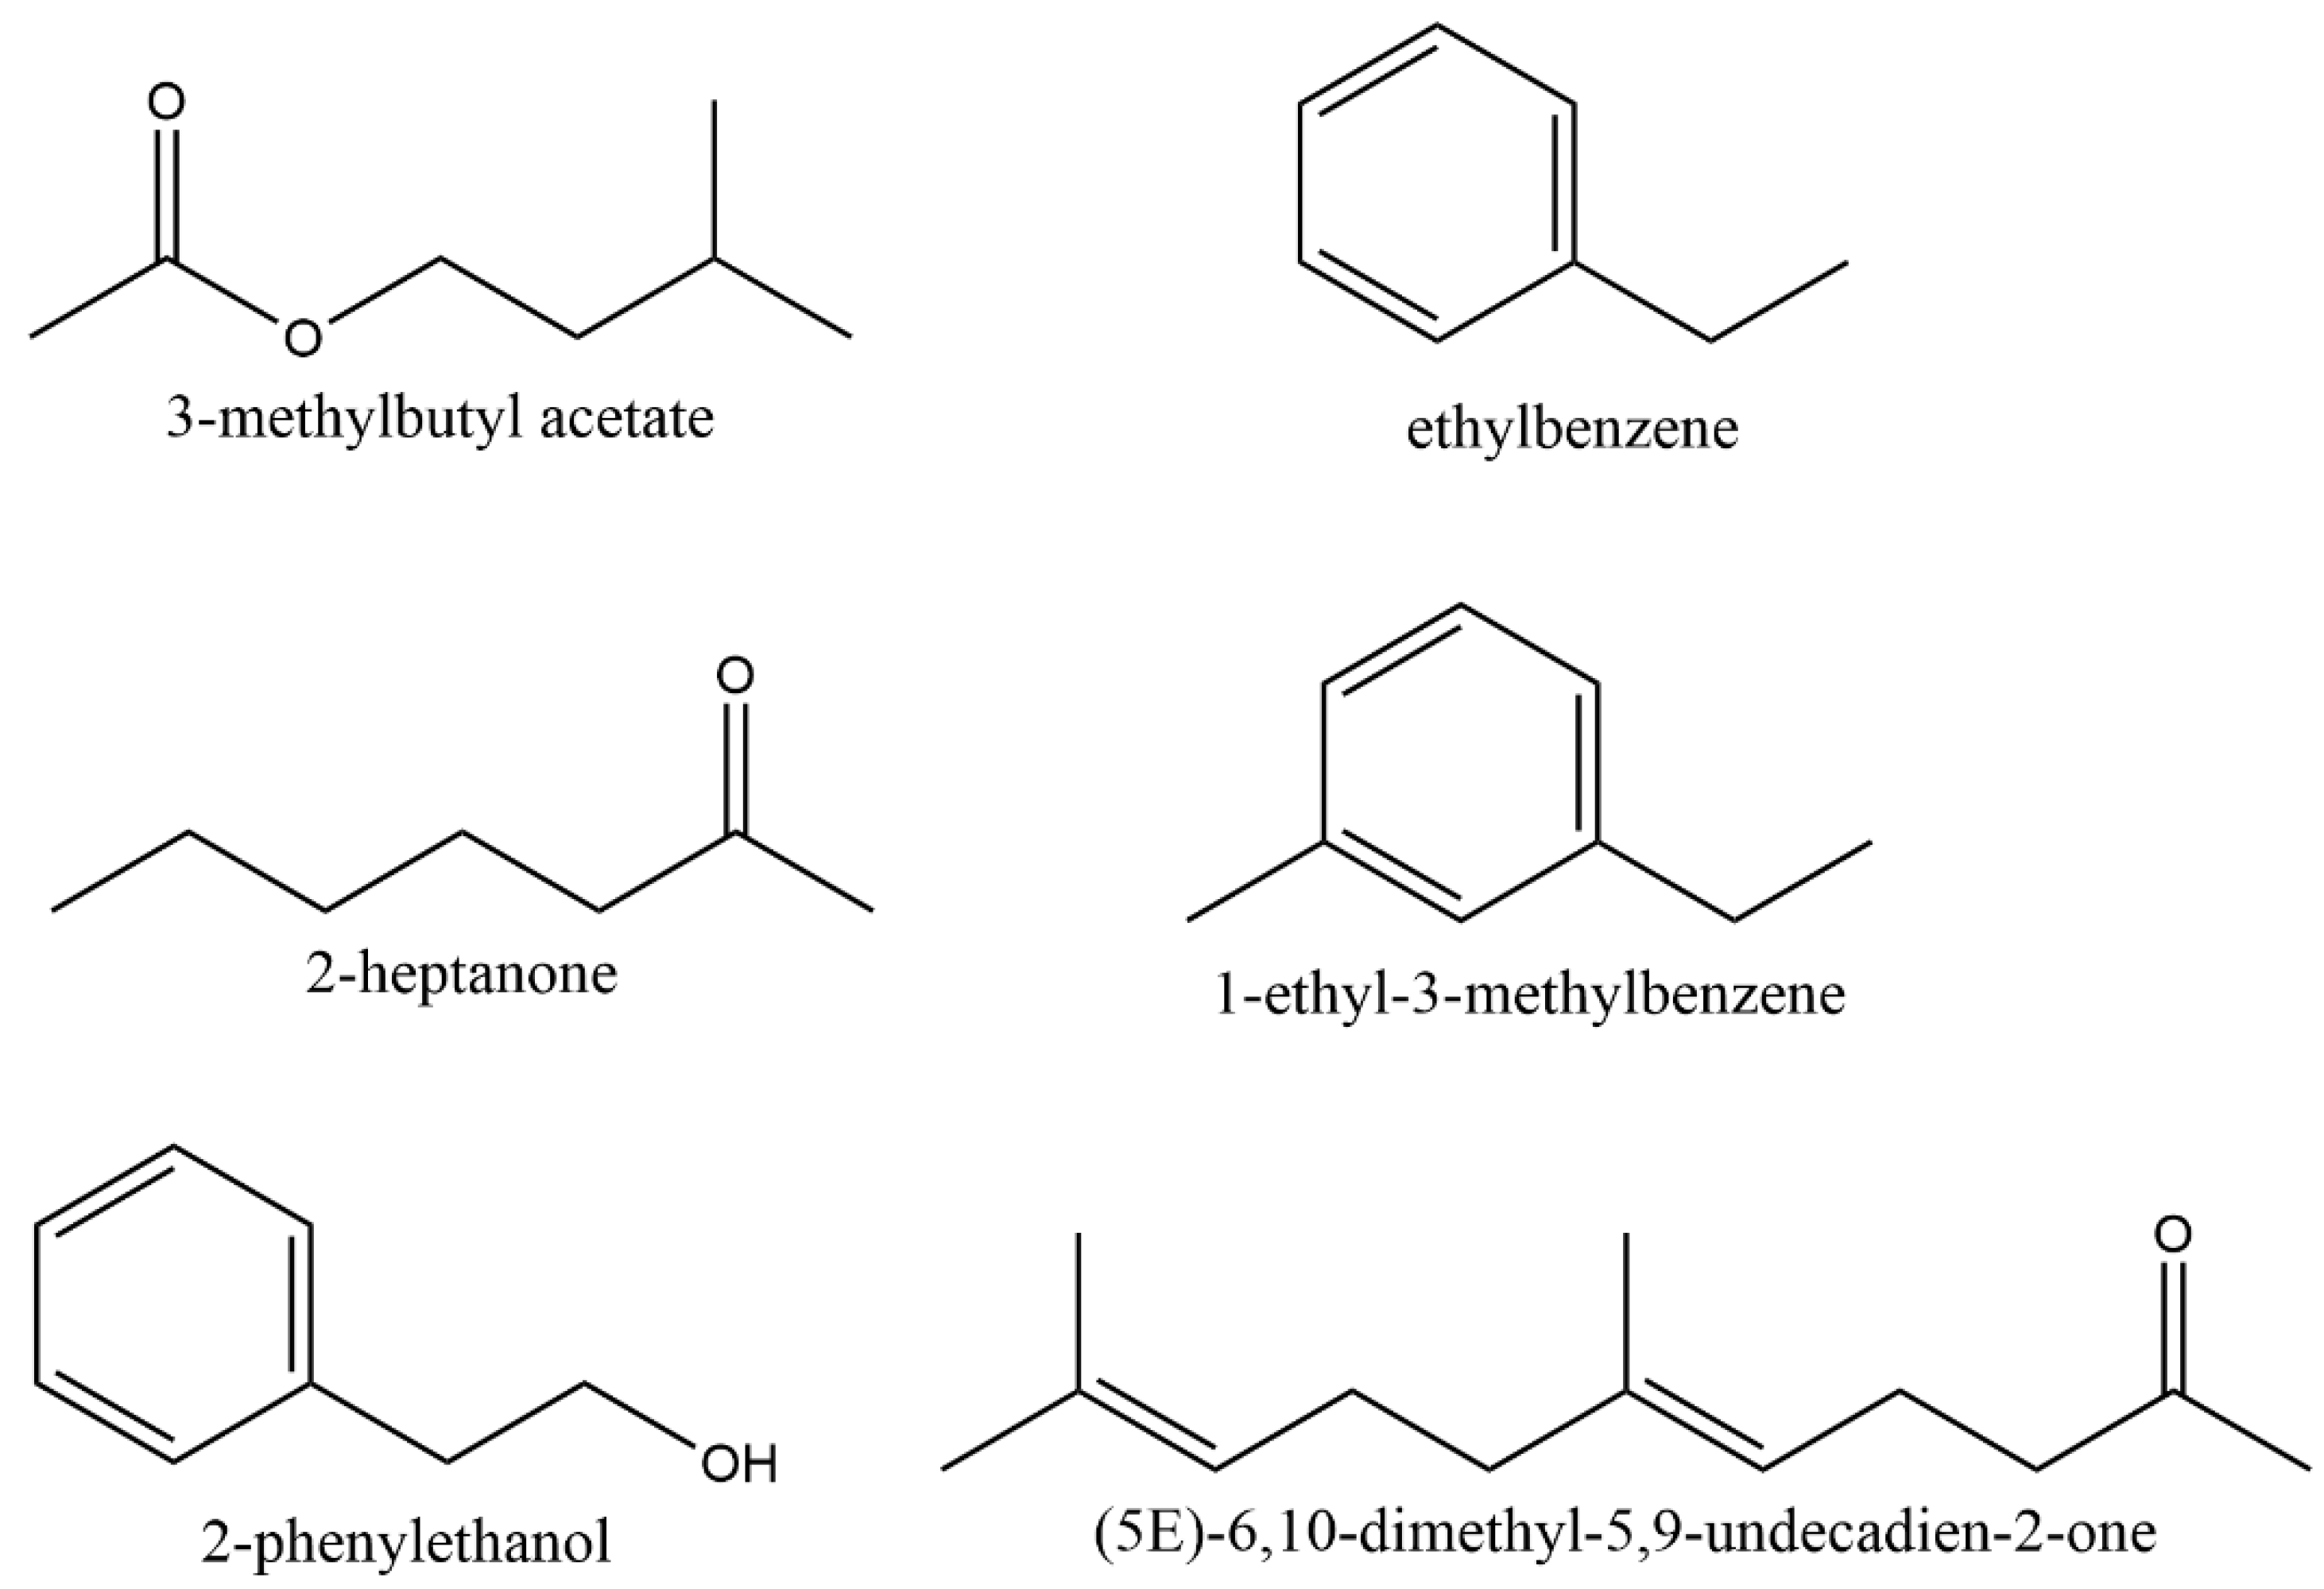
The six identified VOCs emitted by Naganishia sp. corresponded to 3-methylbutyl acetate, ethylbenzene, 1-ethyl-3-methylbenzene, 2-phenylethanol, 2-heptanone and (5E)-6,10-dimethylundeca-5,9-dien-2-one (Figure 2). Retention times, reverse similarity indexes (RSI), m/z values, and CAS Registry Number are listed in Table 2. The emission kinetics of these VOCs showed that 2-phenylethanol was the most abundant compound, and its emission increased over time (Table 3).

3.3. Effect of VOCs Emitted by Naganishia sp. on B. cinerea

To evaluate the effect of VOCs emitted by Naganishia sp. on B. cinerea, assays were conducted to analyze mycelial growth, germination, and sporulation (Figure 3). After two days of cultivation, mycelial growth of B. cinerea was slower, in the presence of VOCs produced by Naganishia sp., than the control. On the fourth day of cultivation, in the presence of VOCs, the growth of B. cinerea stopped (Figure 3A). VOCs emitted by Naganishia sp. inhibited 32.8% the conidia germination of B. cinerea (Figure 3B) and reduced sporulation by 70.6% (Figure 3C).

3.4. Conidiophore Morphology of B. cinerea Treated with VOCs Emitted by Naganishia sp.

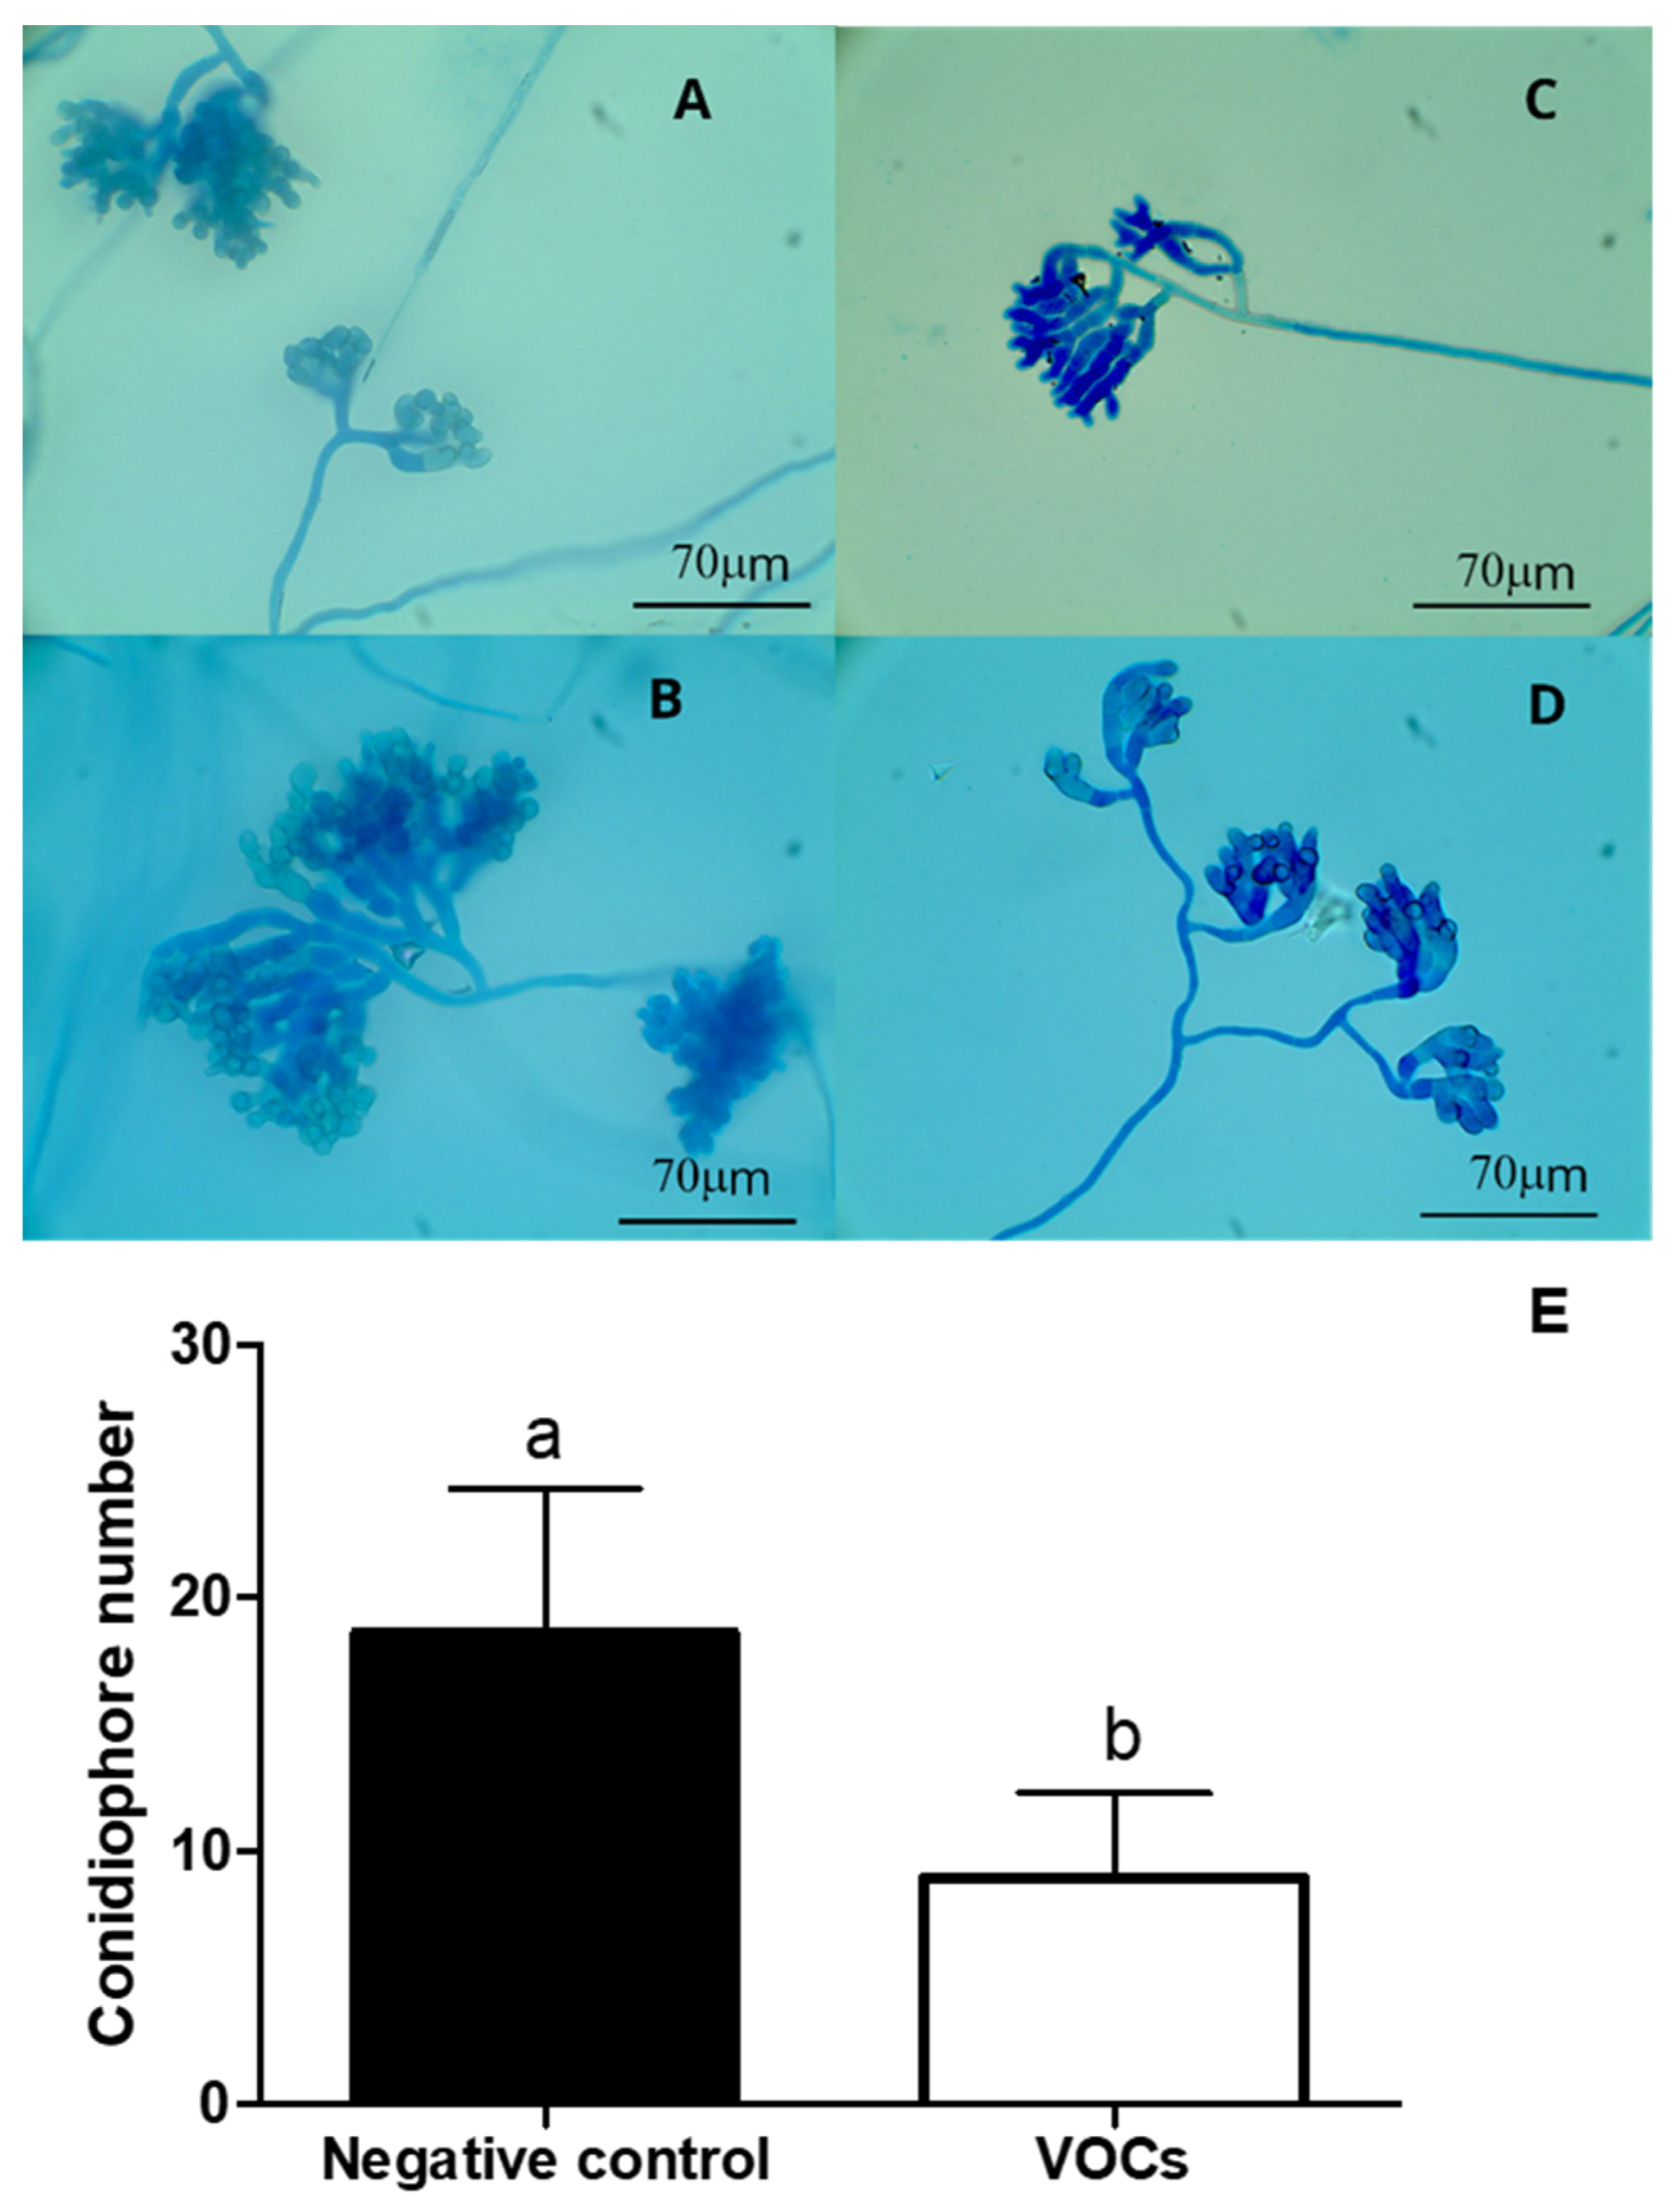
The conidiophores were visualized and quantified using optical microscopy. Morphological differences were observed in B. cinerea conidiophores exposed to VOCs, with an absence of conidia in the aerial structures, after 4 and 5 days of exposure to VOCs (Figure 4). VOCs produced a decrease of 52.2% in the number of conidiophores (Figure 4). In control, the presence of conidiophores and conidia is observed at fourth and fifth days of incubation. Therefore, VOCs emitted by Naganishia sp. affected the mycelial growth, conidiophore formation, and conidia production in B. cinerea. Additionally, VOCs increased the formation of infection cushions (IC) in B. cinerea (Figure 5).

3.5. Effect of VOCs on Cell Wall and Plasma Membrane of B. cinerea

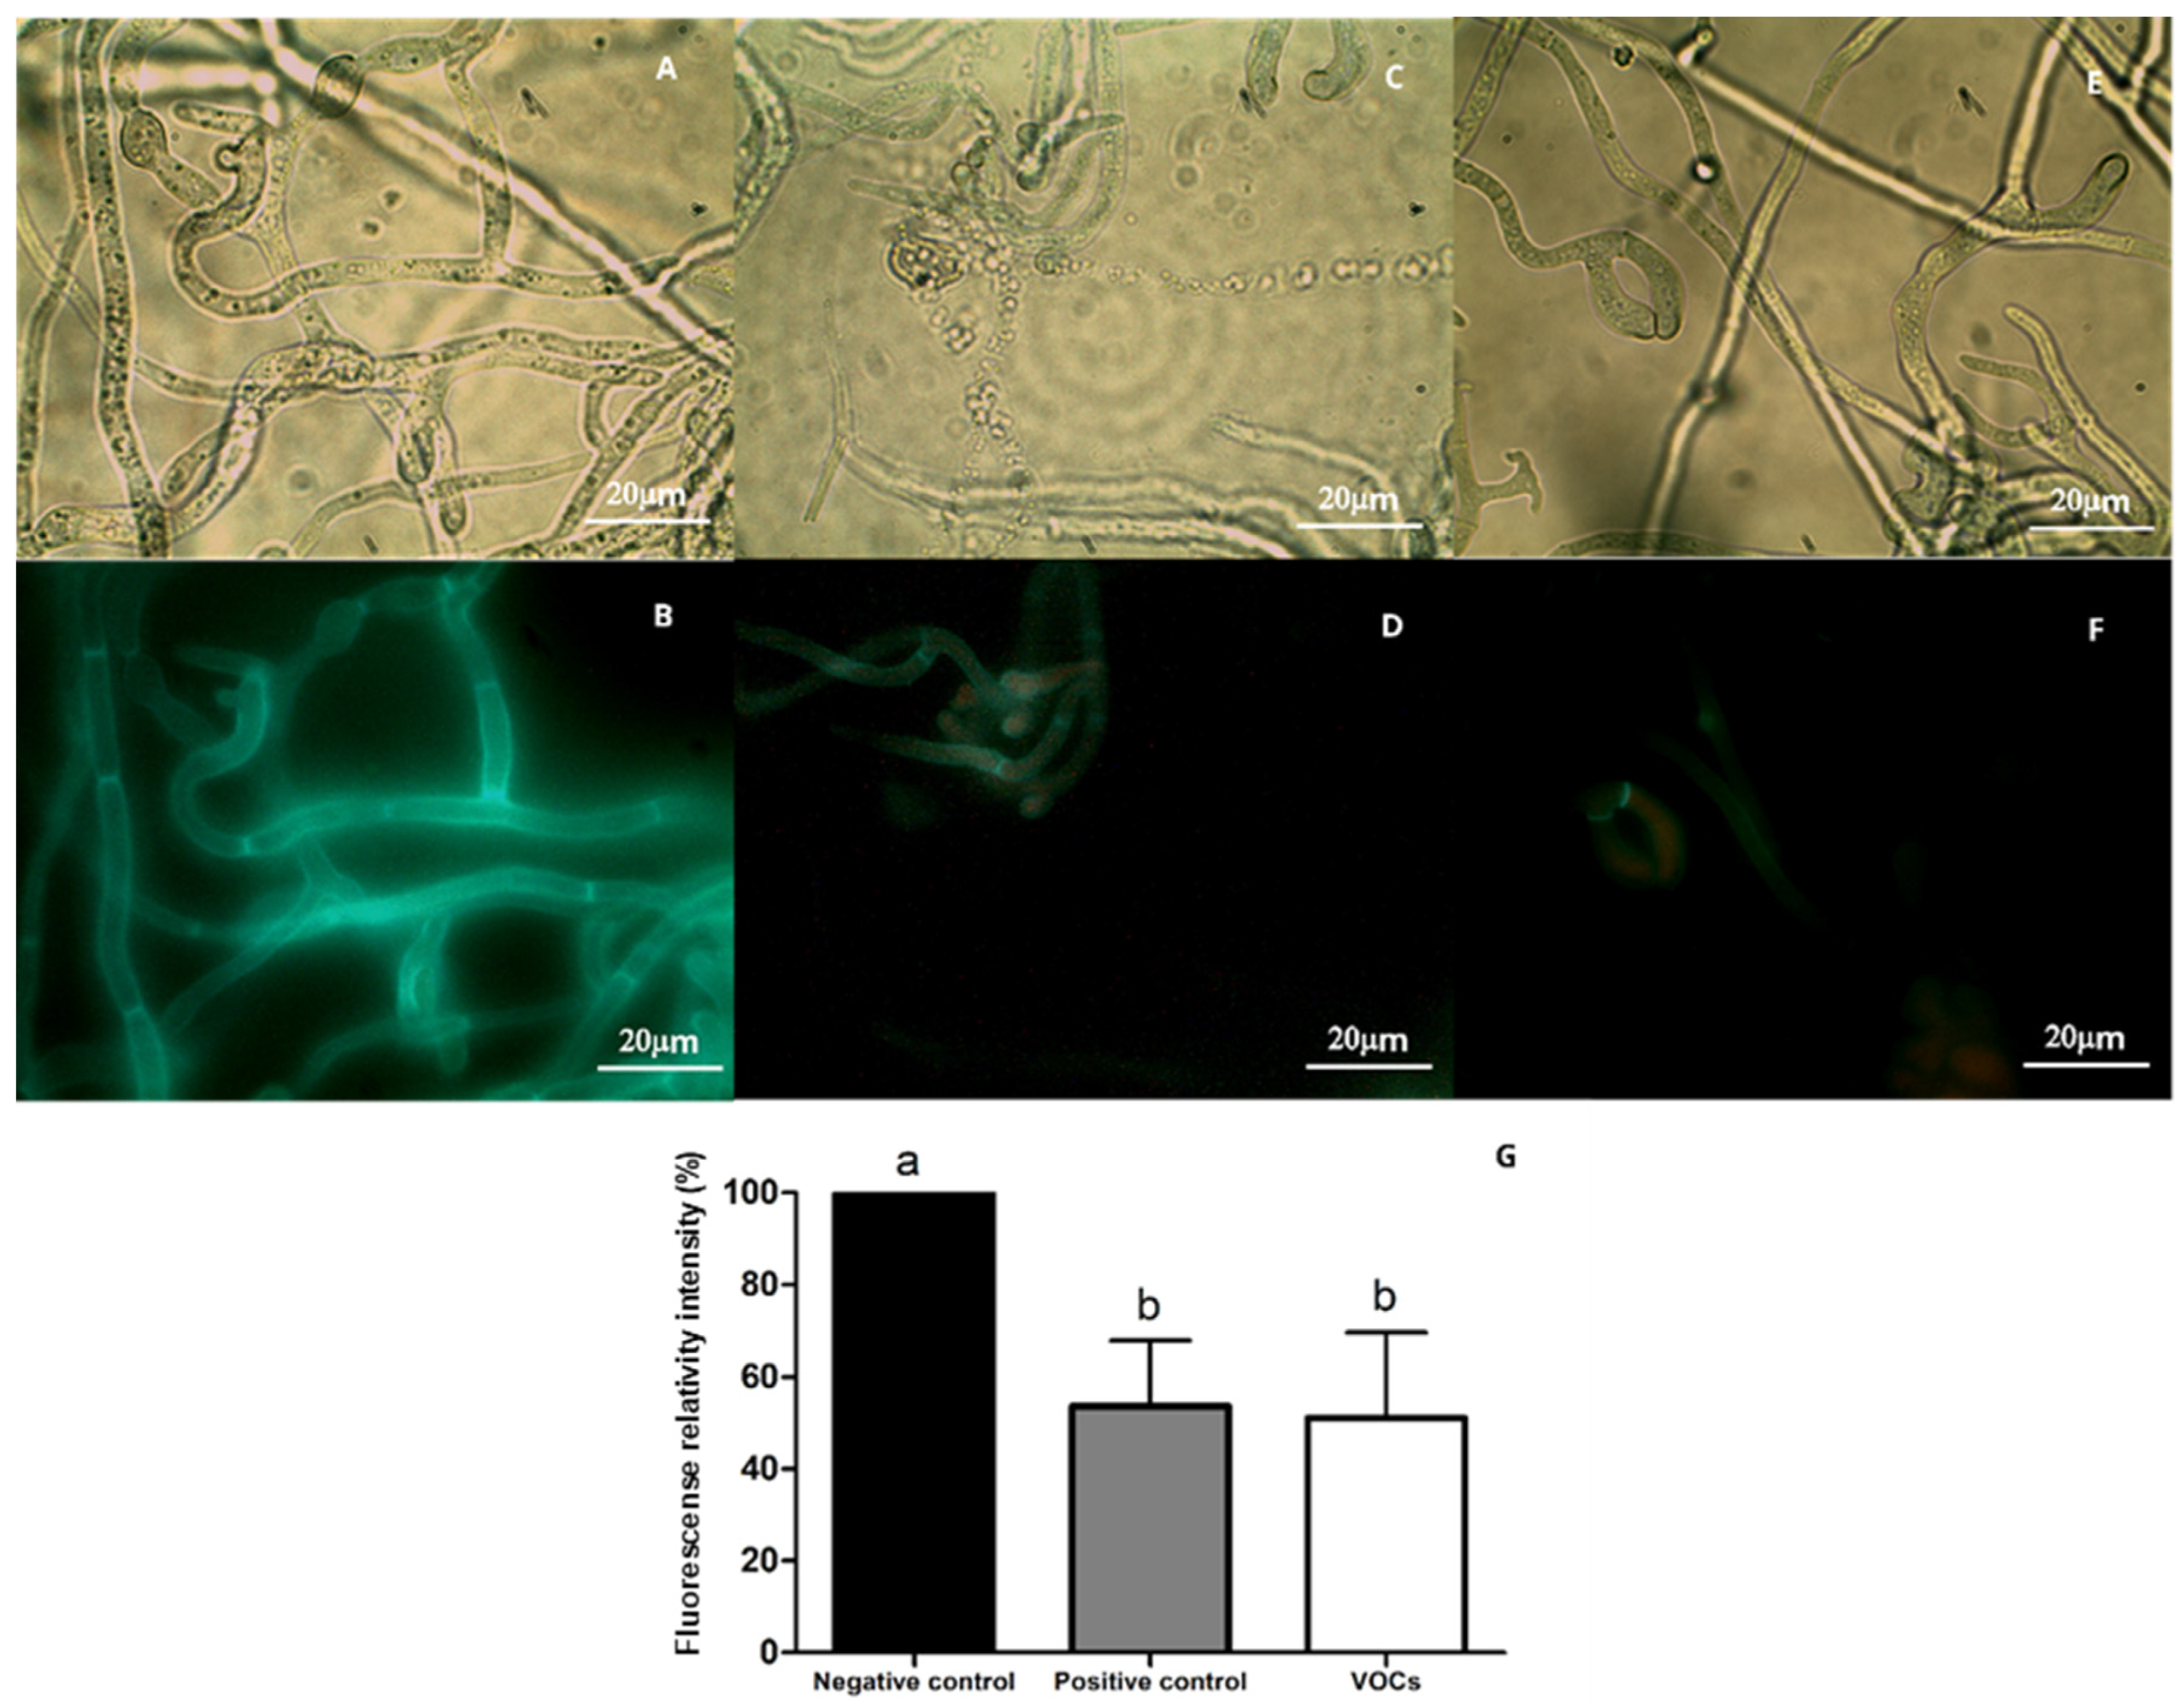
To evaluate the effect of VOCs emitted by Naganishia sp. on the cell wall of B. cinerea, a Calcofluor White stain was used. This stain binds to polysaccharides such as chitin, which is present in the cell wall, allowing the visualization of fluorescent hyphae [31]. Results showed a decrease in fluorescence intensity in VOC-treated hyphae compared to the untreated control, similar to the positive control treated with lytic cell wall enzymes (Figure 6). A 50% decrease in fluorescence intensity was observed when hyphae were treated with VOCs compared to the negative control (Figure 6), indicating that VOCs emitted by Naganishia sp. cause damage to the B. cinerea cell wall.
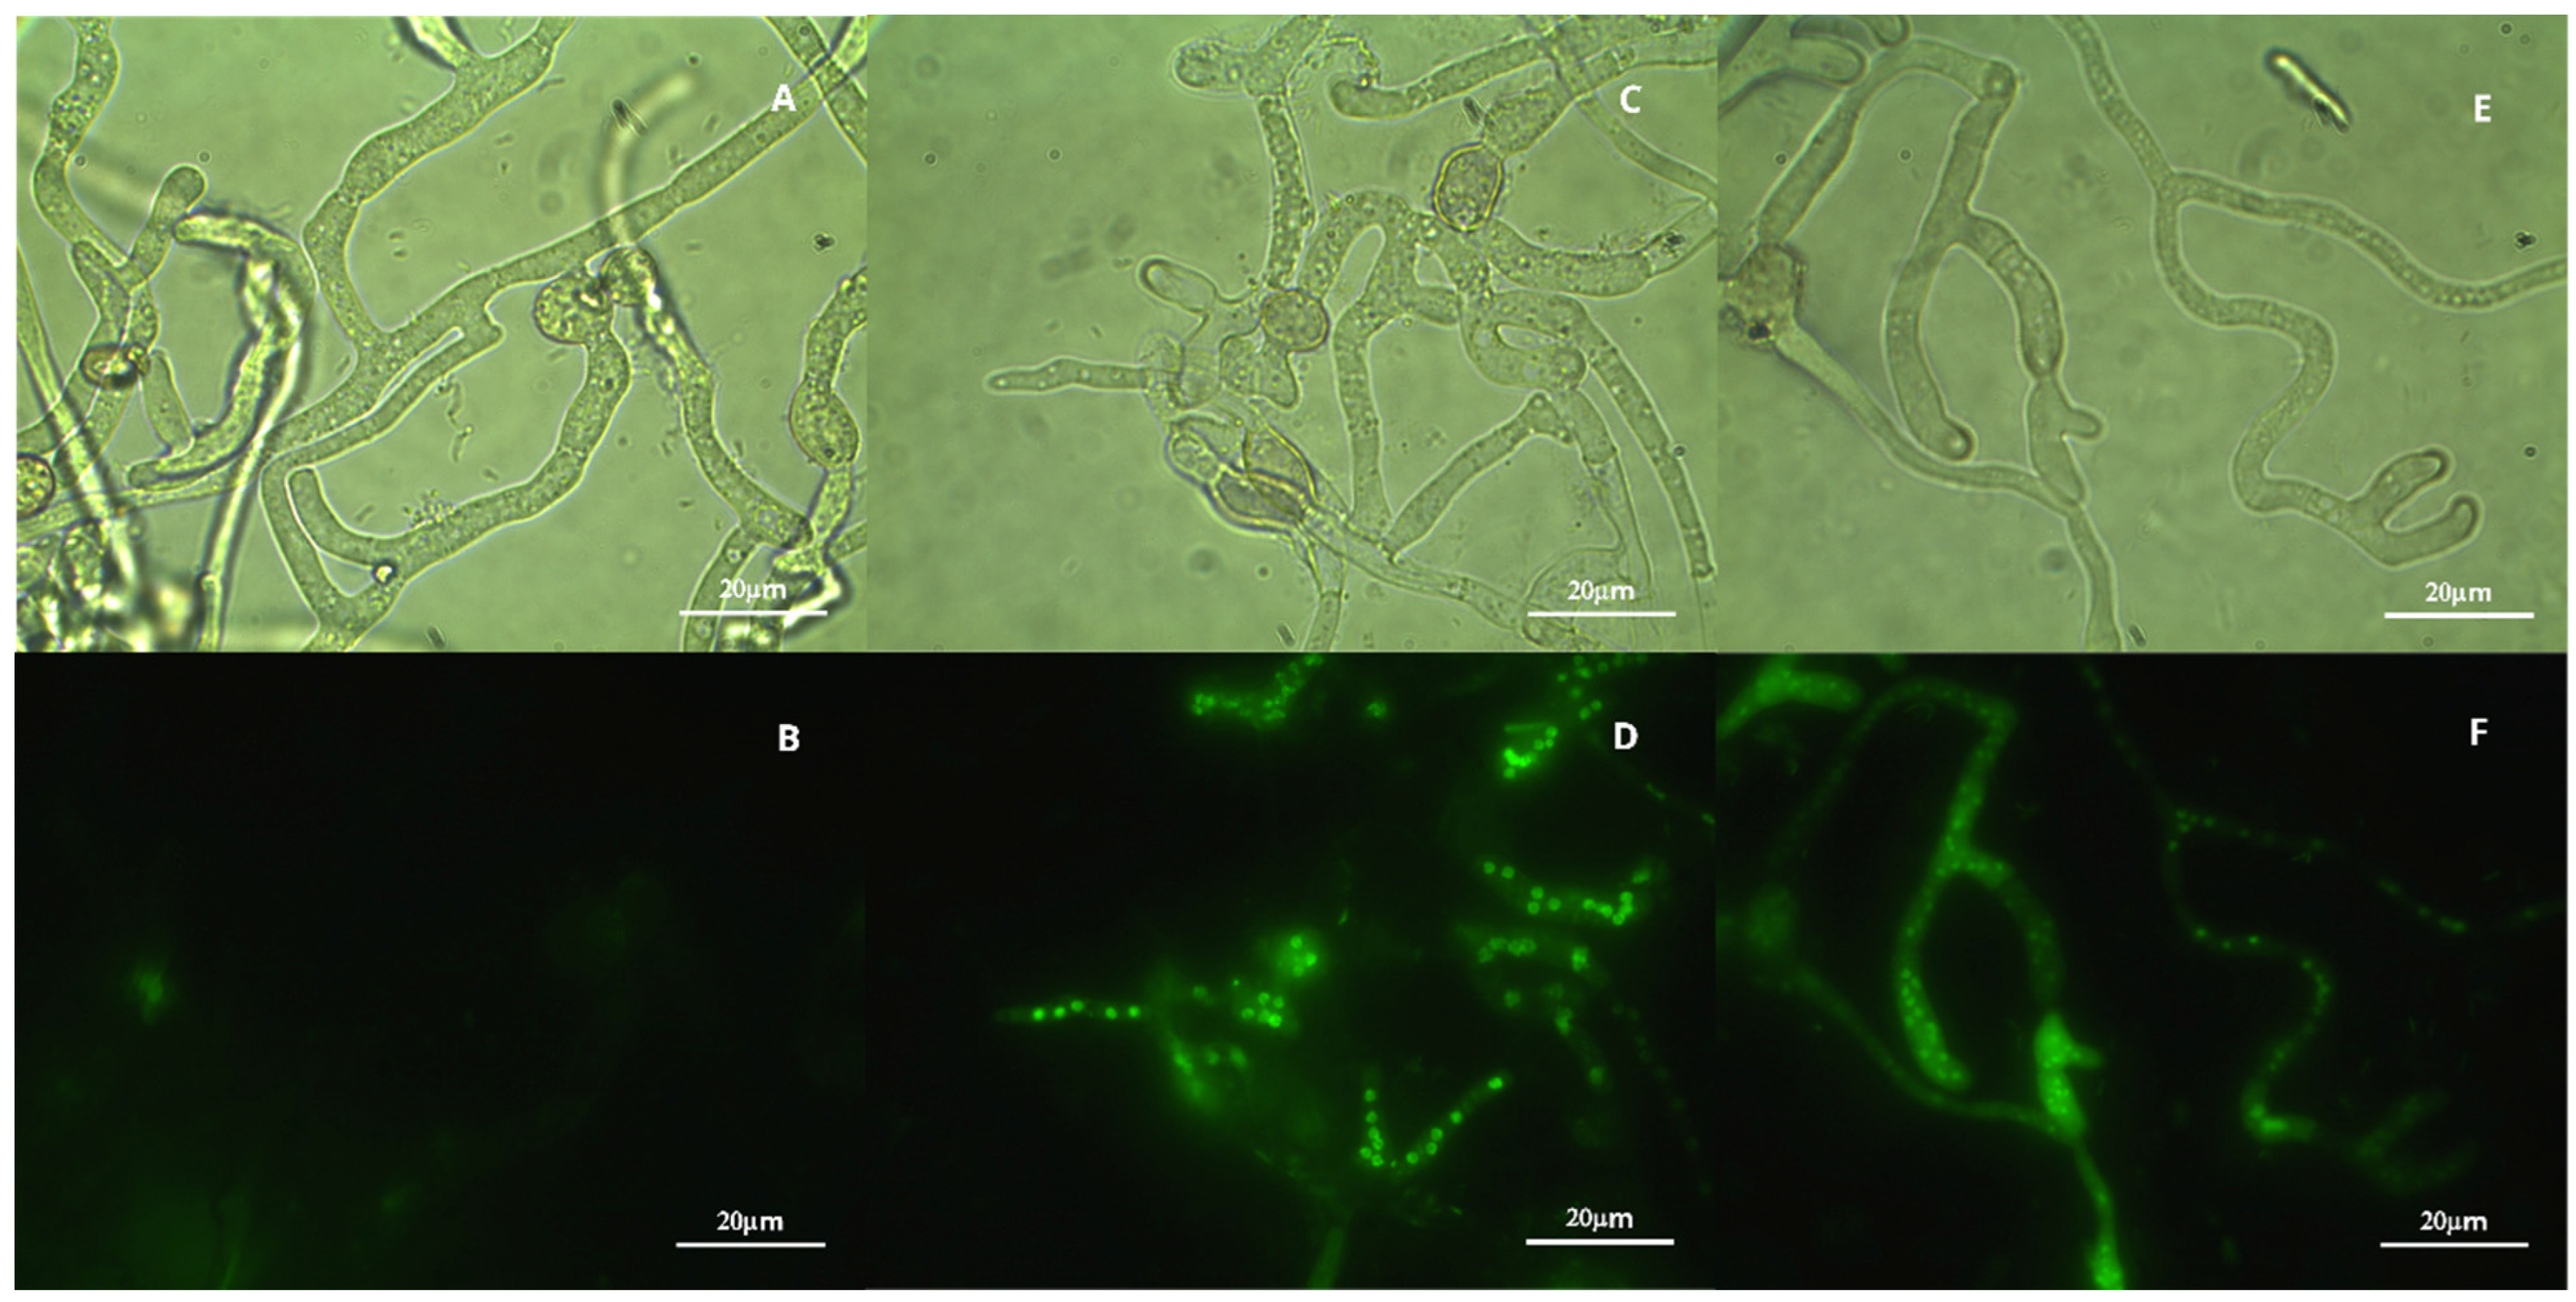
Additionally, the integrity of the plasma membrane was assessed using SYTOX Green (Figure 7). In the presence of VOCs, green fluorescent nuclei in B. cinerea hypha can be observed, similar to the positive control, while no fluorescence was observed in the negative control. This suggests that VOCs emitted by Naganishia sp. also damage the cell membrane of B. cinerea.

3.6. Oxidative Stress in B. cinerea Treated with VOCs

To evaluate whether VOCs emitted by Naganishia sp. induce oxidative stress in B. cinerea, intracellular oxidation assays were performed using the probe DCFH-DA. VOCs emitted by Naganishia sp. induced oxidative stress in B. cinerea, similar to the positive control. No fluorescence was observed in the negative control (Figure 8).
Lipid peroxidation in B. cinerea treated with VOCs emitted by Naganishia sp. was estimated by MDA levels (Figure 9). Results show increased MDA levels in treated B. cinerea, compared to the untreated control, after 16 and 24 h of incubation. However, after 48 h, no significant differences were observed, indicating that VOCs generate lipid peroxidation in B. cinerea during short incubation periods.

3.7. Fungistatic Effect of VOCs Emitted by Naganishia sp. on B. cinerea

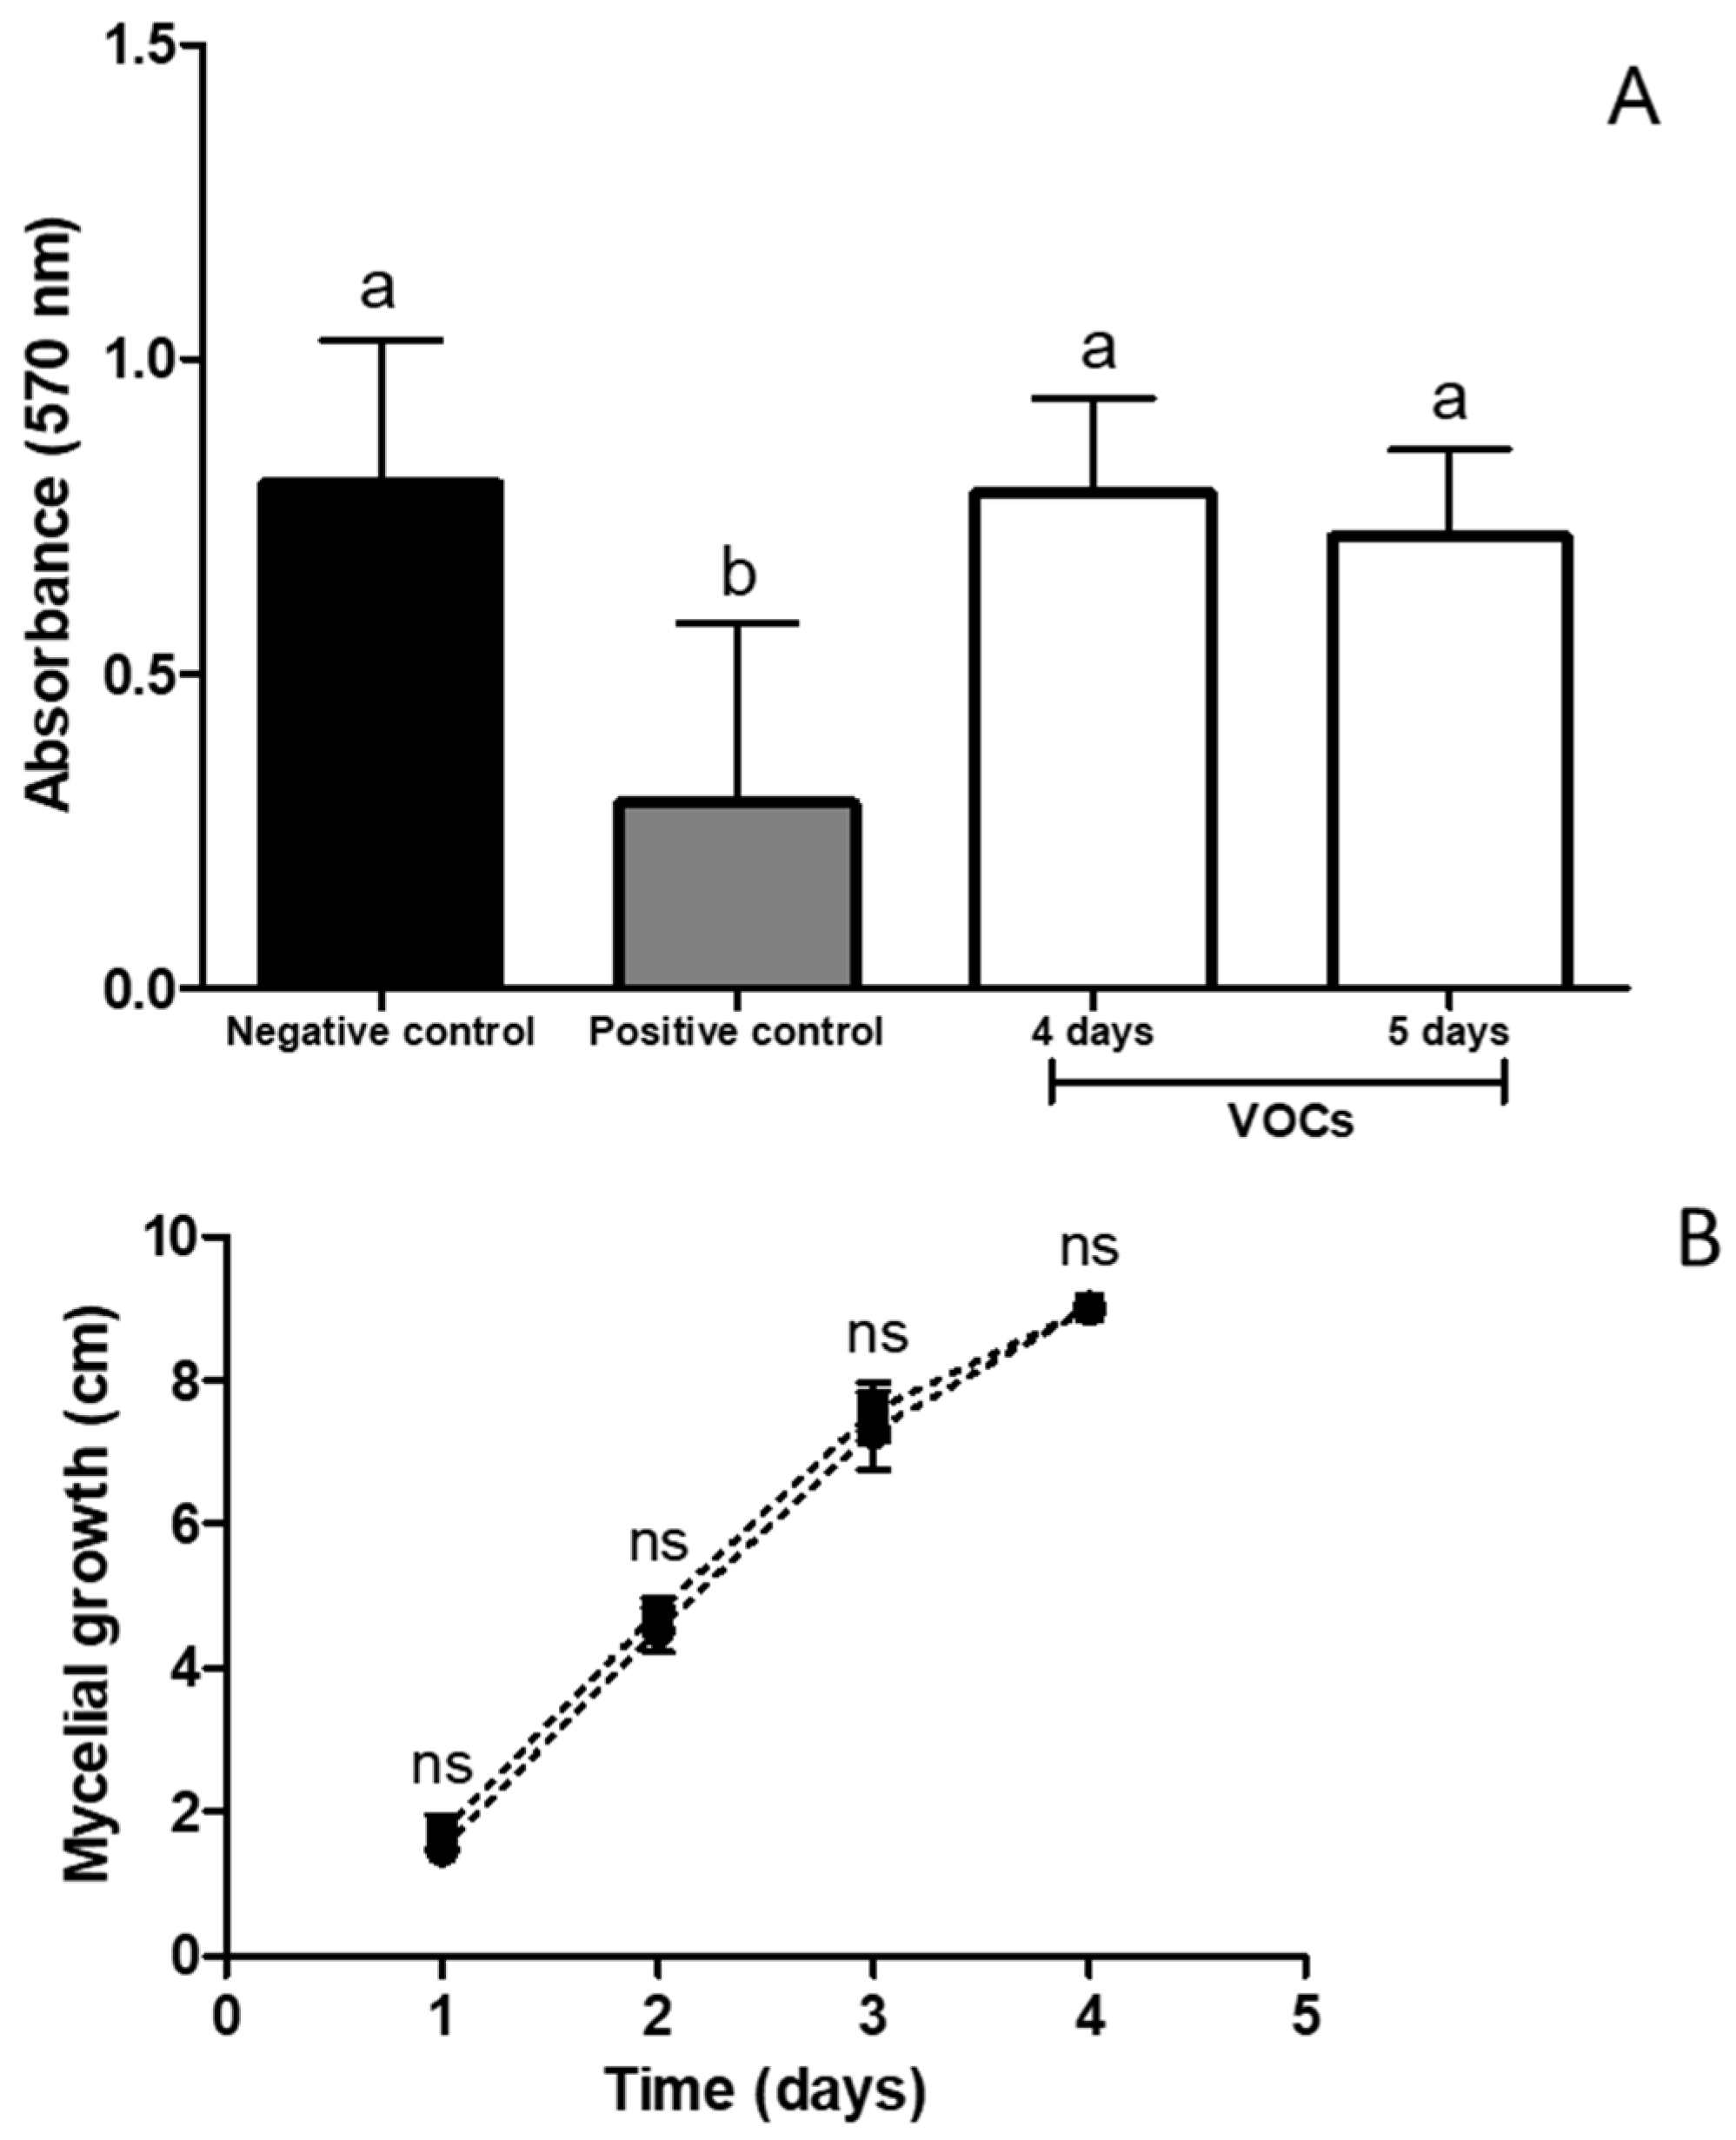
The effect of VOCs emitted by Naganishia sp. on the viability of B. cinerea hyphae was analyzed using the MTT assay, which measures mitochondrial activity by reducing MTT into formazan [32]. Results showed no significant differences between VOC-treated B. cinerea and the negative control (Figure 10), suggesting that VOCs emitted by Naganishia sp. do not cause cell death in B. cinerea; however, VOCs might have a fungistatic effect. To confirm this, B. cinerea was grown in the presence of VOCs for three days and then re-inoculated in fresh PDA without VOCs (Figure 10). The growth of the previously VOC-treated mycelium was similar to untreated mycelium.
On the other hand, the effect of the most abundant volatile compound emitted by the endophytic yeast, 2-phenylethanol, was tested, pure 2-phenylethanol inhibited the mycelial growth of B. cinerea and, the antifungal effect was dose-dependent (Figure 11) with an IC50 value of 0.21 µL mL−1. It was observed that this compound, at all analyzed concentrations, had a fungistatic effect, since the growth of the B. cinerea mycelia can be recovered when the mycelia treated with this compound were re-inoculated in fresh medium

3.8. In Vivo Effect of VOCs Emitted by Naganishia sp. on B. cinerea

To evaluate the effect of VOCs emitted by Naganishia sp. on B. cinerea growth in vivo, disinfected tomatoes and grapes were inoculated with B. cinerea and were incubated in the presence or absence of VOCs. After 7 days, lesion areas were measured (Figure 12). In tomatoes treated with VOCs, infection severity decreased by 64.7% compared to the untreated control. In grapes, infection severity decreased by 43.1%. This indicates that the VOCs emitted by Naganishia sp. inhibit B. cinerea growth in vivo and reduce infection severity.

4. Discussion

In this work, an endophytic yeast with antifungal effect against B. cinerea isolated from E. chiloensis was identified as Naganishia sp. This is the first report of this fungal species as an endophyte from E. chiloensis. In previous studies, endophytic fungi (Aureobasidium sp., Epicoccum sp., and one species of the order Pleosporales) with antifungal activity against B. cinerea were isolated from this plant species [12,14].
Naganishia sp. has been previously reported as endophytic fungus [16,33,34]. Naganishia liquefaciens was found as endophyte in Arnebia euchroma, a medicinal plant found in the Himalayas [16]. Naganishia albida and Naganishia globosa were reported as endophytes in agricultural crops in 36 countries [33]. Naganishia sp. was also isolated as endophyte from endemic xerophytic plants growing in an extremely arid desert in northwest China [34].
This study demonstrated that the endophytic yeast, Naganishia sp., inhibited B. cinerea growth by emitting VOCs. It has been previously described that VOCs emitted by microorganisms such as Diaporthe apiculatum, Aureobasidium subglaciale, Aureobasidium pullulans, Streptomyces globisporus, Candida sp., and Sacharomyces sp. inhibit sporulation, spore germination, and mycelial growth of B. cinerea, modulating its pathogenicity [35,36].
The mode of action of VOCs on B. cinerea is not yet well understood. This study showed that VOCs emitted by the isolate Naganishia sp. induced the production of a low number of conidiophores without conidia, affecting the sporulation of B. cinerea.
Additionally, in this study was also shown that VOCs caused damage to the cell wall and plasma membrane of B. cinerea. It has been described that VOCs can penetrate cell membranes due to their hydrophobicity, generating changes in membrane potential and permeability, altering hypha integrity [36,37]. Similar to these results, Yalage et al. [25] demonstrated that VOCs, emitted by A. pullulans, caused deformation in spores and germ tubes of B. cinerea and Alternaria alternata, leading to the release of cell contents and suggesting an alteration of the plasma membrane. Moreover, VOCs emitted by Naganishia sp. promoted the accumulation of reactive oxygen species in B. cinerea, generating oxidative stress and lipoperoxidation. Oxidative stress could damage the plasma membrane and induce IC formation. Interestingly, conidiation in B. cinerea is regulated by signaling pathways involved in cell differentiation, which can be inhibited by ROS, showing phenotypes with sporulation defects [38,39]. In B. cinerea, the Nox complex (BcNoxA/B, BcNoxC) participates in mycelial growth, conidial development, and IC formation [40,41]. VOCs, such as methyl thujate, induce the expression of Nox genes in B. cinerea, increasing ROS production and decreasing fungal pathogenicity [42]. Furthermore, in A. alternata, inactivation of the NoxA, NoxB, or NoxR genes reduces conidiation by 95% [43]. Similar results were observed in Coniothyrium minitans, where the Nox1 protein was essential for fungal conidiation [44]. Therefore, based on this, it can be hypothesized that the increase in ROS produced by the VOCs emitted by endophytic yeast, Naganishia sp., could produce a decrease in the formation of conidia in B. cinerea.
On the other hand, some microbial VOCs cause cell death in fungi [45]; VOCs produced by the endophytic fungus Sarocladium brachiariae caused cell death in Fusarium oxysporum [46]. Other volatile compounds showed fungistatic activity, stopping fungal growth without causing cell death [47]. Gotor-Vila et al. [48] showed that VOCs emitted by the bacterium Bacillus amyloliquefaciens had a fungistatic effect on Monilinia laxa, Monilinia fructicola and B. cinerea. VOCs emitted by A. pullulans also exhibited fungistatic activity against B. cinerea [49]. This study showed that VOCs emitted by Naganishia sp. and 2-phenylethanol, the most abundant volatile compound emitted by this fungus, had a fungistatic effect against B. cinerea.
This is the first report on the effect of VOCs produced by Naganishia sp. against B. cinerea in vivo. However, the biocontrol activity of Naganishia species has been reported [50,51,52,53] and has been used as a biological control in postharvest peaches, cherries, tomatoes, citrus, and pome fruits [52,53]. Furthermore, Naganishia albida, the main component of Yieldplus®, a biological product that was sold until 2011 for the control of Botrytis during cold storage of postharvest strawberries [50].
Volatile compounds emitted by Naganishia species have not previously been described. The six identified VOCs in this work have been reported as VOCs emitted by yeasts and other microorganisms [54,55]. 2-phenylethanol has been widely reported with antifungal activity against B. cinerea, as a volatile compound produced by yeasts, such as A. pullulans, S. cerevisiae, Candida intermedia, Candida sake and filamentous fungi such as Trichoderma spiralee, among others [36]. Additionally, 2-phenylethanol showed high antifungal activity against B. cinerea in vitro and in vivo, without adverse effects on fruit quality [56]. On the other hand, 3-methylbutyl inhibited growth of the yeast and bacteria [57]. Also, this volatile compound inhibited the growth of B. cinerea [58]. 2-heptanone showed antifungal activity against Fusarium oxysporum f. sp. niveum [59].
Many works have proposed the use of antagonistic yeasts for biological control of B. cinerea [6,60,61]. Therefore, VOCs from Naganishia sp. could be an alternative for postharvest control of B. cinerea. Interestingly, the most abundant compound emitted by Naganishia sp., 2-phenylethanol, is classified as generally recognized as safe (GRAS) [62]. Additionally, it has been described that Naganishia species are psychrophilic microorganisms, able to grow between −3 °C and 27 °C [63]. These characteristics suggest that Naganishia sp. could be used to develop a safe biopesticide for cold environments based on VOCs emitted by the fungus.

5. Conclusions

This study demonstrated that VOCs emitted by Naganishia sp. inhibit mycelial growth, spore germination and sporulation and promote the formation of infection cushions in B. cinerea. The VOCs caused damage to the cell wall and cell membrane, as well as oxidative stress and lipid peroxidation. Six volatile compounds emitted by Naganishia sp. produced at different incubation times were identified as 3-methylbutyl acetate, ethylbenzene, 1-ethyl-3-methylbenzene, 2-phenylethanol, 2-heptanone and (E)-6,10-dimethylundeca-5,9-dien-2-one. This mixture caused a fungistatic effect on B. cinerea mycelial growth and provided in vivo control of phytopathogenic fungus. Additionally, the most abundant volatile compound emitted by the endophytic fungus also produced a fungistatic effect on B. cinerea growth.

Author Contributions

Conceptualization, A.V., L.M. and M.C.; methodology, A.V., F.N., R.P., L.M. and M.C.; validation, A.V. and F.N.; investigation, A.V.; resources, L.M. and M.C.; writing—original draft preparation, A.V., F.N. and P.C.; writing—review and editing, F.N., P.C., L.M. and M.C.; supervision, L.M. and M.C.; project administration, L.M. and M.C.; funding acquisition, L.M. and M.C. All authors have read and agreed to the published version of the manuscript.

Funding

This research was funded by DICYT, Universidad de Santiago de Chile, grant number 021843CT and FONDECYT, grant number 1230464.

Data Availability Statement

Data are contained within the article.

Conflicts of Interest

The authors declare no conflicts of interest.

References

  1. Singh, R.; Caseys, C.; Kliebenstein, D.J. Genetic and molecular landscapes of the generalist phytopathogen Botrytis cinerea. Mol. Plant Pathol. 2024, 25, e13404. [Google Scholar] [CrossRef]
  2. Dean, R.; Kan, J.; Pretorius, Z.; Hammond-Kosack, K.; Pietro, A.; Spanu, P.; Foster, G. The Top 10 fungal pathogens in molecular plant pathology. Mol. Plant Pathol. 2012, 13, 414–430. [Google Scholar] [CrossRef] [PubMed]
  3. Boddy, L. Pathogens of autotrophs. In The Fungi, 3rd ed.; Watkinson, S.C., Boddy, L., Money, N.P., Eds.; Academic Press: London, UK, 2016; pp. 245–292. [Google Scholar]
  4. Latorre, B.; Elfar, K.; Ferrada, E. Gray mold caused by Botrytis cinerea limits grape production in Chile. Cienc. Investig. Agrar. 2015, 42, 305–330. [Google Scholar] [CrossRef]
  5. Choquer, M.; Rascle, C.; Gonçalves, I.R.; Vallée, A.; Ribot, C.; Loisel, E.; Poussereau, N. The infection cushion of Botrytis cinerea: A fungal “weapon” of plant-biomass destruction. Environ. Microbiol. 2021, 23, 2293–2314. [Google Scholar] [CrossRef]
  6. Abbey, J.A.; Percival, D.; Abbey, L.; Asiedu, S.K.; Prithiviraj, B.; Schilder, A. Biofungicides as alternative to synthetic fungicide control of grey mould (Botrytis cinerea)-prospects and challenges. Biocontrol Sci. Technol. 2018, 29, 207–228. [Google Scholar] [CrossRef]
  7. Esterio, M.; Osorio-Navarro, C.; Azócar, M.; Copier, C.; Rubilar, M.; Pizarro, L.; Auger, J. Reduced fitness cost and increased aggressiveness in fenhexamid-resistant Botrytis cinerea field isolates from Chile. Phytopathol. Mediterr. 2021, 60, 69–77. [Google Scholar] [CrossRef]
  8. Hahn, M. The rising threat of fungicide resistance in plant pathogenic fungi: Botrytis as a case study. J. Biol. Chem. 2014, 7, 133–141. [Google Scholar] [CrossRef] [PubMed]
  9. Emoghene, A.O.; Futughe, A.E. Fungi as an alternative to agrochemicals to control plant diseases. In Fungal Applications in Sustainable Environmental Biotechnology; Purchase, D., Ed.; Springer: Cham, Switzerland, 2016; pp. 43–62. [Google Scholar]
  10. Jia, M.; Chen, L.; Xin, H.; Zheng, C.; Rahman, K.; Han, T.; Qin, L. A friendly relationship between endophytic fungi and medicinal plants: A Systematic Review. Front. Microbiol. 2016, 7, 906. [Google Scholar] [CrossRef]
  11. Barra-Bucarei, L.; France Iglesias, A.; Gerding González, M.; Silva Aguayo, G.; Carrasco-Fernández, J.; Castro, J.F.; Ortiz Campos, J. Antifungal activity of Beauveria bassiana endophyte against Botrytis cinerea in two Solanaceae crops. Microorganisms 2019, 8, 65. [Google Scholar] [CrossRef]
  12. Castro, P.; Parada, R.; Corrial, C.; Mendoza, L.; Cotoras, M. Endophytic fungi Isolated from Baccharis linearis and Echinopsis chiloensis with antifungal activity against Botrytis cinerea. J. Fungi 2022, 8, 197. [Google Scholar] [CrossRef]
  13. Hormazabal, E.; Piontelli, E. Endophytic fungi from Chilean native gymnosperms: Antimicrobial activity against human and phytopathogenic fungi. World J. Microbiol. Biotechnol. 2009, 25, 813–819. [Google Scholar] [CrossRef]
  14. Vidal, A.; Parada, R.; Mendoza, L.; Cotoras, M. Endophytic Fungi isolated from plants growing in Central Andean Precordillera of Chile with antifungal activity against Botrytis cinerea. J. Fungi 2020, 6, 149. [Google Scholar] [CrossRef] [PubMed]
  15. Cobian, G.M.; Egan, C.P.; Amend, A.S. Plant-microbe specificity varies as a function of elevation. ISME J. 2019, 13, 2778–2788. [Google Scholar] [CrossRef]
  16. Jain, R.; Bhardwaj, P.; Pandey, S.S.; Kumar, S. Arnebia euchroma, a plant species of cold desert in the Himalayas, harbors beneficial cultivable endophytes in roots and leaves. Front. Microbiol. 2021, 12, 696667. [Google Scholar] [CrossRef]
  17. Oses, R.; Hernández, V.; Campos, L.; Becerra, J.; Irribarren-Riquelme, D.; Lavín, P.; Rodríguez, J. Advances in research on biodiversity and bioprospecting of endophytic fungi in Chile. In Neotropical Endophytic Fungi; Rosa, L., Ed.; Springer: Cham, Switzerland, 2021; pp. 53–91. [Google Scholar]
  18. Armesto, J.; Kalin, M.; Hinojosa, F. The Mediterranean Environment of Central Chile. In The Physical Geography of South America; Veblen, T.T., Young, K.R., Orme, A.R., Eds.; Oxford Academic Press: New York, NY, USA, 2007; pp. 184–199. [Google Scholar]
  19. Cares, R.; Medel, R.; Botto-Mahan, C. Frugivory in Echinopsis chiloensis (Caryophyllales: Cactaceae). Rev. Chil. Hist. Nat. 2013, 86, 489–491. [Google Scholar] [CrossRef]
  20. Muñoz, G.; Hinrichsen, P.; Brygoo, Y.; Giraud, T. Genetic characterisation of Botrytis cinerea populations in Chile. Mycol. Res. 2002, 106, 594–601. [Google Scholar] [CrossRef]
  21. White, T.; Bruns, T.; Lee, S.; Taylor, J. Amplification and direct sequencing of fungal ribosomal RNA genes for phylogenetics. In PCR Protocols: A Guide to Methods and Applications; New York Academic Press Inc.: New York, NY, USA, 1990; pp. 315–322. [Google Scholar]
  22. Saitou, N.; Nei, M. The neighbor-joining method: A new method for reconstructing phylogenetic trees. Mol. Biol. Evol. 1987, 4, 406–425. [Google Scholar]
  23. Urbina, K.; Villarreal, P.; Nespolo, R.F.; Salazar, R.; Santander, R.; Cubillos, F.A. Volatile compound screening using HS-SPME-GC/MS on Saccharomyces eubayanus strains under low-temperature pilsner wort fermentation. Microorganisms 2020, 8, 755. [Google Scholar] [CrossRef]
  24. Gujar, A.; Anderson, T.; Cavagnino, D.; Patel, A. Comparative analysis of mass spectral matching for confident compound identification using the advanced electron ionization source for GC-MS. Thermoscientific 2018, 10598, 1–7. [Google Scholar]
  25. Yalage Don, S.M.; Schmidtke, L.M.; Gambetta, J.M.; Steel, C.C. Aureobasidium pullulans volatilome identified by a novel, quantitative approach employing SPME-GC-MS, suppressed Botrytis cinerea and Alternaria alternata in vitro. Sci. Rep. 2020, 10, 4498. [Google Scholar] [CrossRef]
  26. Rizal, L.M.; Hereward, J.P.; Brookes, D.R.; Furlong, M.J.; Walter, G.H. Hidden diversity within Beauveria and Metarhizium–comparing morphology, barcoding, multilocus phylogenies and whole-genome sequences. Fungal Ecol. 2024, 67, 101304. [Google Scholar] [CrossRef]
  27. Morales, J.; Mendoza, L.; Cotoras, M. Alteration of oxidative phosphorylation as a possible mechanism of the antifungal action of p-coumaric acid against Botrytis cinerea. J. Appl. Microbiol. 2017, 123, 969–976. [Google Scholar] [CrossRef] [PubMed]
  28. Pagès, M.; Kleiber, D.; Violleau, F. Ozonation of three different fungal conidia associated with apple disease: Importance of spore surface and membrane phospholipid oxidation. Food Sci. Nutr. 2020, 8, 5292–5297. [Google Scholar] [CrossRef]
  29. Hodges, D.; DeLong, J.; Forney, C.; Prange, R. Improving the thiobarbituric acid reactive substances assay for estimating lipid peroxidation in plant tissues containing anthocyanin and other interfering compounds. Planta 1999, 207, 604–611. [Google Scholar] [CrossRef]
  30. Bijlani, S.; Parker, C.; Singh, N.K.; Sierra, M.A.; Foox, J.; Wang, C.C.C.; Mason, C.E.; Venkateswaran, K. Genomic characterization of the titan-like Cell producing Naganishia tulchinskyi, the first novel eukaryote isolated from the international space station. J. Fungi 2022, 8, 165. [Google Scholar] [CrossRef]
  31. Herth, W.; Schnepf, E. The fluorochrome, calcofluor white, binds oriented to structural polysaccharide fibrils. Protoplasma 1980, 105, 129–133. [Google Scholar] [CrossRef]
  32. Ghasemi, M.; Turnbull, T.; Sebastian, S.; Kempson, I. The MTT Assay: Utility, limitations, pitfalls, and interpretation in bulk and single-cell analysis. Int. J. Mol. Sci. 2021, 22, 12827. [Google Scholar] [CrossRef]
  33. Kachalkin, A.; Glushakova, A.; Venzhik, A. Presence of clinically significant endophytic yeasts in agricultural crops: Monitoring and ecological safety assessment. IOP Conf. Ser. Environ. Earth Sci. 2021, 723, 042005. [Google Scholar] [CrossRef]
  34. Zuo, Y.; Li, X.; Yang, J.; Liu, J.; Zhao, L.; He, X. Fungal endophytic community and diversity associated with desert shrubs driven by plant identity and organ differentiation in extremely arid desert ecosystem. J. Fungi 2021, 7, 578. [Google Scholar] [CrossRef]
  35. Gao, Z.; Zhang, B.; Liu, H.; Han, J.; Zhang, Y. Identification of endophytic Bacillus velezensis ZSY-1 strain and antifungal activity of its volatile compounds against Alternaria solani and Botrytis cinerea. Biol. Control 2017, 105, 27–39. [Google Scholar] [CrossRef]
  36. Zhao, X.; Zhou, J.; Tian, R.; Liu, Y. Microbial volatile organic compounds: Antifungal mechanisms, applications, and challenges. Front. Microbiol. 2022, 13, 922450. [Google Scholar] [CrossRef] [PubMed]
  37. Giorgio, A.; De Stradis, A.; Lo Cantore, P.; Iacobellis, N.S. Biocide effects of volatile organic compounds produced by potential biocontrol rhizobacteria on Sclerotinia sclerotiorum. Front. Microbiol. 2015, 6, 1056. [Google Scholar] [CrossRef]
  38. Cheung, N.; Tian, L.; Liu, X.; Li, X. The destructive fungal pathogen Botrytis cinerea-Insights from genes studied with mutant analysis. Pathogens 2020, 9, 923. [Google Scholar] [CrossRef]
  39. Siegmund, U.; Heller, J.; van Kan, J.A.; Tudzynski, P. The NADPH oxidase complexes in Botrytis cinerea: Evidence for a close association with the ER and the tetraspanin Pls1. PLoS ONE 2013, 8, e55879. [Google Scholar]
  40. Singh, Y.; Nair, A.M.; Verma, P.K. Surviving the odds: From perception to survival of fungal phytopathogens under host-generated oxidative burst. Plant Commun. 2021, 2, 100142. [Google Scholar] [CrossRef] [PubMed]
  41. Zhang, Z.; Chen, Y.; Li, B.; Chen, T.; Tian, S. Reactive oxygen species: A generalist in regulating development and pathogenicity of phytopathogenic fungi. Comput. Struct. Biotechnol. J. 2020, 18, 3344–3349. [Google Scholar] [CrossRef] [PubMed]
  42. Ji, D.; Chen, T.; Ma, D.; Liu, J.; Xu, Y.; Tian, S. Inhibitory effects of methyl thujate on mycelial growth of Botrytis cinerea and possible mechanisms. Postharvest Biol. Technol. 2018, 142, 46–54. [Google Scholar] [CrossRef]
  43. Chung, K.R. Reactive oxygen species in the citrus fungal pathogen Alternaria alternata: The roles of NADPH-dependent oxidase. Physiol. Mol. Plant Pathol. 2014, 88, 10–17. [Google Scholar] [CrossRef]
  44. Wei, W.; Zhu, W.; Cheng, J.; Xie, J.; Jiang, D.; Li, G.; Chen, W.; Fu, Y. Nox Complex signal and MAPK cascade pathway are cross-linked and essential for pathogenicity and conidiation of mycoparasite Coniothyrium minitans. Sci. Rep. 2016, 6, 24325. [Google Scholar] [CrossRef]
  45. Bolívar-Anillo, H.J.; Garrido, C.; Collado, I.G. Endophytic microorganisms for biocontrol of the phytopathogenic fungus Botrytis cinerea. Phytochem. Rev. 2019, 19, 721–740. [Google Scholar] [CrossRef]
  46. Yang, Y.; Chen, Y.; Cai, J.; Liu, X.; Huang, G. Antifungal activity of volatile compounds generated by endophytic fungi Sarocladium brachiariae HND5 against Fusarium oxysporum f. sp. cubense. PLoS ONE 2021, 16, e0260747. [Google Scholar] [CrossRef] [PubMed]
  47. Miyazawa, M.; Kimura, M.; Yabe, Y.; Tsukamoto, D.; Sakamoto, M.; Horibe, I.; Okuno, Y. Use of solid phase microextraction (SPME) for profiling the volatile metabolites produced by Glomerella cingulata. J. Oleo Sci. 2008, 57, 585–590. [Google Scholar] [CrossRef] [PubMed]
  48. Gotor-Vila, A.; Teixidó, N.; Di Francesco, A.; Usall, J.; Ugolini, L.; Torres, R.; Mari, M. Antifungal effect of volatile organic compounds produced by Bacillus amyloliquefaciens CPA-8 against fruit pathogen decays of cherry. Food Microbiol. 2017, 64, 219–225. [Google Scholar] [CrossRef] [PubMed]
  49. Di Francesco, A.; Ugolini, L.; Lazzeri, L.; Mari, M. Production of volatile organic compounds by Aureobasidium pullulans as a potential mechanism action against postharvest fruit pathogens. Biol. Control 2015, 81, 8–14. [Google Scholar] [CrossRef]
  50. Kowalska, J.; Drożdżyński, D.; Remlein-Starosta, D.; Sas-Paszt, L.; Malusá, E. Use of Cryptococcus albidus for controlling grey mould in the production and storage of organically grown strawberries. J. Plant Dis. Prot 2012, 119, 174–178. [Google Scholar] [CrossRef]
  51. Liu, X.; Wang, Q.; Göker, M.; Groenewald, M.; Kachalkin, A.V.; Lumbsch, H.T.; Millanes, A.M.; Wedin, M.; Yurkov, A.M.; Boekhout, T.; et al. Towards an integrated phylogenetic classification of the Tremellomycetes. Stud. Mycol. 2015, 81, 85–147. [Google Scholar] [CrossRef]
  52. Tian, S.P.; Qin, G.Z.; Xu, Y.; Wang, Y.S. Survival of antagonistic yeasts under field conditions and their biocontrol ability against postharvest diseases of sweet cherry. Postharvest Biol. Technol. 2004, 33, 327–331. [Google Scholar] [CrossRef]
  53. Zhang, H.; Zheng, X.; Yu, T. Biological control of postharvest diseases of peach with Cryptococcus laurentii. Food Control 2007, 18, 287–291. [Google Scholar] [CrossRef]
  54. Alves, Z.; Melo, A.; Figueiredo, A.R.; Coimbra, M.A.; Gomes, A.C.; Rocha, S.M. Exploring the Saccharomyces cerevisiae Volatile metabolome: Indigenous versus commercial strains. PLoS ONE 2015, 10, e0143641. [Google Scholar] [CrossRef]
  55. Whitener, M.E.B.; Carlin, S.; Jacobson, D.; Weighill, D.; Divol, B.; Conterno, L.; Vrhovsek, U. Early fermentation volatile metabolite profile of non- Saccharomyces yeasts in red and white grape must: A targeted approach. Food Sci. Technol. 2015, 64, 412–422. [Google Scholar] [CrossRef]
  56. Zou, X.; Wei, Y.; Jiang, S.; Xu, F.; Wang, H.; Zhan, P.; Shao, X. ROS stress and cell membrane disruption are the main antifungal mechanisms of 2-phenylethanol against Botrytis cinerea. J. Agric. Food Chem. 2022, 70, 14468–14479. [Google Scholar] [CrossRef] [PubMed]
  57. Ruiz-Moyano, S.; Hernández, A.; Galvan, A.; Córdoba, M.; Casquete, R.; Serradilla, M.; Martín, A. Selection and application of antifungal VOCs-producing yeasts as biocontrol agents of grey mould in fruits. Food Microbiol. 2020, 92, 103556. [Google Scholar] [CrossRef] [PubMed]
  58. Li, Z.; Liu, Q.; Wu, C.; Yuan, Y.; Ni, X.; Wu, T.; Yuan, Y.; Ni, X.; Wu, T.; Chang, R.; et al. Volatile organic compounds produced by Metschnikowia pulcherrima yeast T-2 inhibited the growth of Botrytis cinerea in postharvest blueberry fruits. Horticult. Plant J. 2024. [Google Scholar] [CrossRef]
  59. Wu, Y.; Zhou, J.; Li, C.; Ma, Y. Antifungal and plant growth promotion activity of volatile organic compounds produced by Bacillus amyloliquefaciens. Microbiologyopen 2019, 8, e00813. [Google Scholar] [CrossRef]
  60. Kalogiannis, S.; Tjamos, S.; Stergiou, A.; Antoniou, P.; Ziogas, B.; Tjamos, E. Selection and evaluation of phyllosphere yeasts as biocontrol agents against grey mould of tomato. Eur. J. Plant Pathol. 2006, 116, 69–76. [Google Scholar] [CrossRef]
  61. Santos, A.; Sánchez, A.; Marquina, D. Yeasts as biological agents to control Botrytis cinerea. Microbiol. Res. 2004, 159, 331–338. [Google Scholar] [CrossRef] [PubMed]
  62. Scognamiglio, J.; Jones, L.; Letizia, C.S.; Api, A.M. Fragrance material review on phenylethyl alcohol. Food Chem. Toxicol. 2012, 50, S224–S239. [Google Scholar] [CrossRef]
  63. Nizovoy, P.; Bellora, N.; Haridas, S.; Sun, H.; Daum, C.; Barry, K.; Grigoriev, I.V.; Libkind, D.; Connell, L.B.; Moliné, M. Unique genomic traits for cold adaptation in Naganishia vishniacii, a polyextremophile yeast isolated from Antarctica. FEMS Yeast Res. 2021, 21, foaa056. [Google Scholar] [CrossRef]
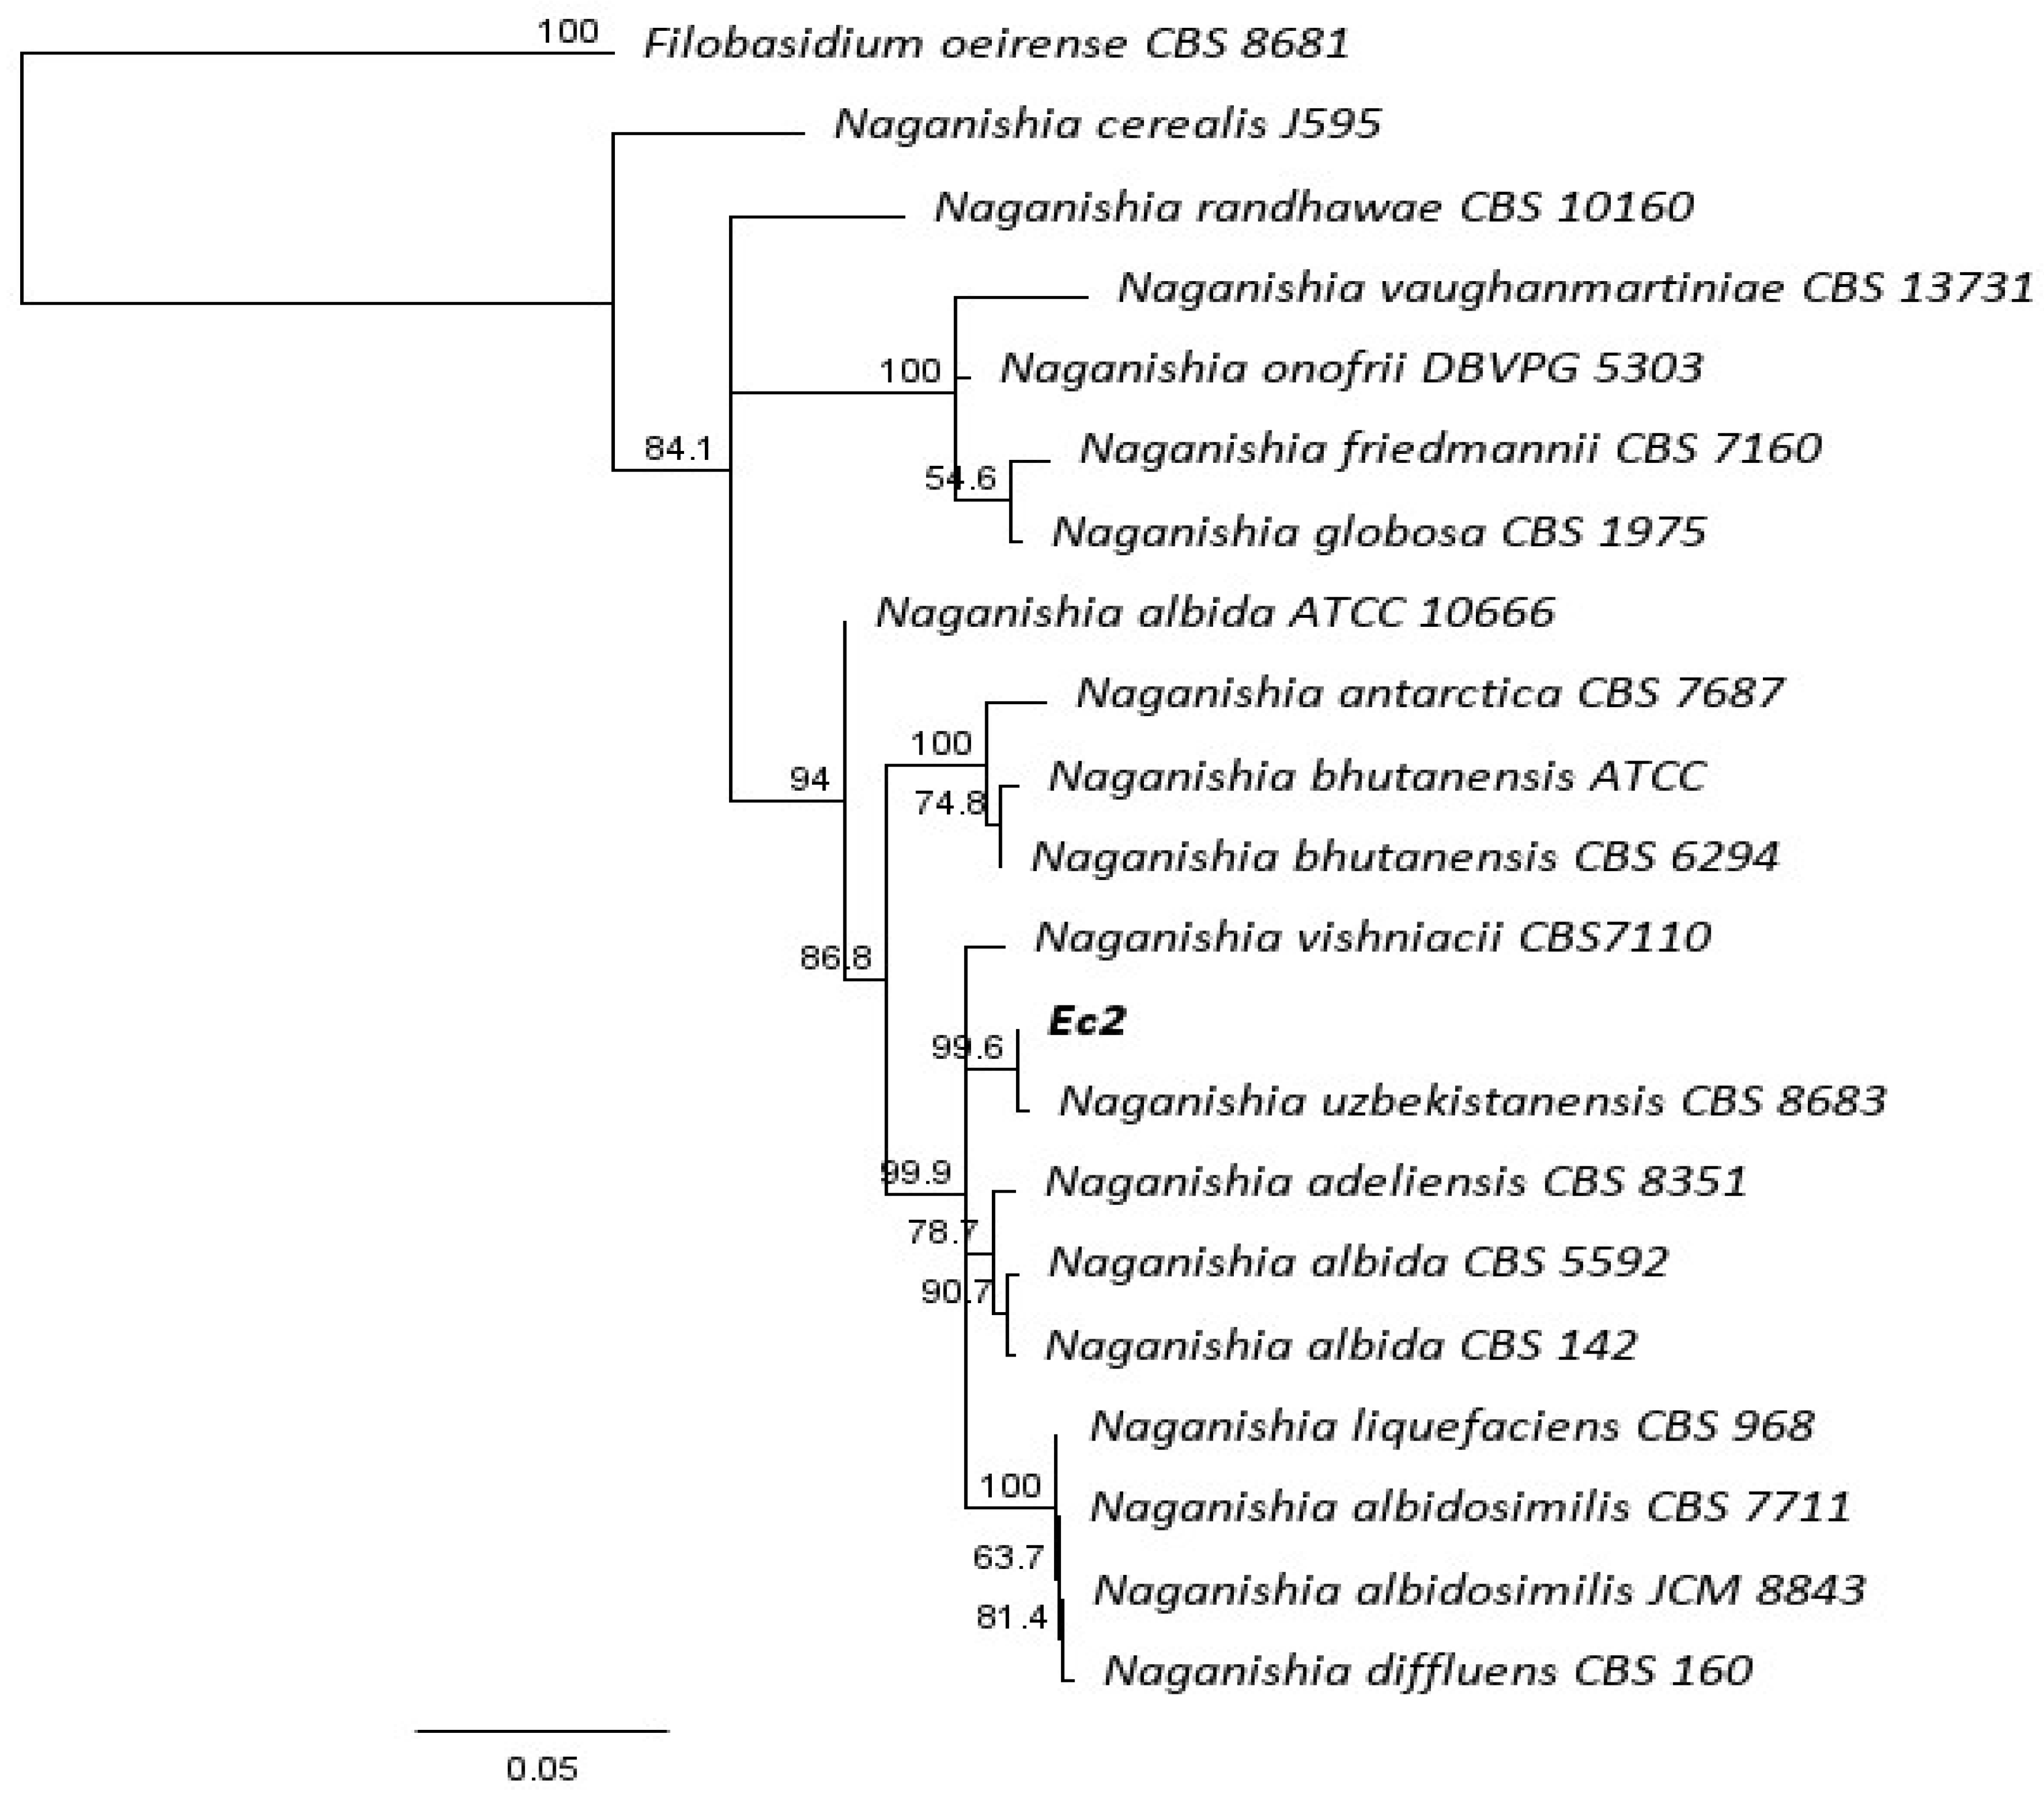
Figure 1. Neighbor-joining tree based on fungal internal transcribed spacer (ITS) sequences of Naganishia species, Naganishia sp. Ec2 (GenBank accession number OP880438.1) and Filobasidium oriense as the outgroup. Numbers labeled at each node indicate the bootstrap value (%) from 1000 replicated.
Horticulturae 10 01005 g001
Figure 2. Structure of the volatile organic compounds emitted by Naganishia sp. Compounds were captured by HS-SPME and identified by GC-MS/MS.
Horticulturae 10 01005 g002
Figure 3. Antifungal activity of VOCs emitted by Naganishia sp. against B. cinerea. (A) Effect on mycelial growth of B. cinerea. Circles represent the negative control, and squares represent the treatment with VOCs. (B) Germination percentage of B. cinerea conidia after 6 h incubation with VOCs. (C) Effect on sporulation of B. cinerea after 7 days of incubation at 22 °C with VOCs. Black bars represent B. cinerea control, and white bars represent the treatment of B cinerea with VOCs emitted by Naganishia sp. Values represent the mean of three biological replicates ± SD. (A): ANOVA test was carried out. Asterisks indicate statistically significant differences. ns: there are no significant differences. * = p < 0.05, *** = p < 0.001. (B,C): Mann–Whitney test was carried out. Columns with different letters are significantly different (p < 0.05).
Horticulturae 10 01005 g003
Figure 4. Conidiophore morphology of B. cinerea treated with VOCs emitted by Naganishia sp. (A,B) Negative control. (C,D) Treatment with VOCs for 4 days (A,C) and 5 days (B,D). Samples were stained with lactophenol blue. (E) Quantification of the number of conidiophores per visual field (ten visual fields). Values represent the mean of three biological replicates ± SD. For statistical analysis, Student’s t-test was performed. Columns with different letters are significantly different (p < 0.05).
Horticulturae 10 01005 g004
Figure 5. Infection cushion structures (IC) in B. cinerea visualized after treatment with VOCs emitted by Naganishia sp. (A) Infection cushion structure stained with lactophenol blue. (B) Quantification of structures observed at 10× magnification (ten visual fields). Values represent the mean of three biological replicates ± SD. For statistical analysis, Student’s t-test was carried out. Columns with different letters are significantly different (p < 0.05).
Horticulturae 10 01005 g005
Figure 6. Effect of VOCs emitted by Naganishia sp. on the cell wall integrity of B. cinerea. The cell wall was stained with Calcofluor white. (A,B) Negative control. (C,D) Positive control (lysing enzymes). (E,F) Treatment with VOCs emitted by Naganishia sp. after 16 h of incubation. (A,C,E) visualized by light microscopy. (B,D,F) visualized through fluorescence microscopy. (G) Quantification of the fluorescence intensity. The effect was measured as relative fluorescence intensity compared to maximum fluorescence (negative control). Values represent the mean of three biological replicates ± SD. For statistical analysis, a Kruskal–Wallis test, and Dunn’s post-test was carried out. Different letters represent significant differences with p < 0.05.
Horticulturae 10 01005 g006
Figure 7. Effect of VOCs emitted by Naganishia sp. on B. cinerea cell membrane using SYTOX green assay. (A,B) negative control. (C,D) positive control (ethanol 70%). (E,F) Treatment with VOCs emitted by Naganishia sp. after 16 h of incubation. (A,C,E): visualized by light microscopy. (B,D,F): visualized through fluorescence microscopy. The test was carried out in three biological replicates.
Horticulturae 10 01005 g007
Figure 8. Oxidative stress responses of B. cinerea induced by VOCs from Naganishia sp. Detection of ROS was performed using DCFH-DA staining after 24 h of treatment with VOCs. (A,B) Negative control. (C,D) Positive control (100 mM H2O2). (E,F) Treatment with VOCs emitted by Naganishia sp. Images (A,C,E) were visualized through fluorescence microscopy. (B,D,F) Visualized by light microscopy. The test was carried out in three biological replicates.
Horticulturae 10 01005 g008
Figure 9. Lipid peroxidation in B. cinerea treated with VOCs emitted by Naganishia sp. after 16, 24, and 48 h of treatment, represented by malondialdehyde (MDA) content. The bars represent the mean of three biological replicates ± SD. For statistical analysis, Mann–Whitney test was carried out. Asterisks indicate statistically significant differences. ns: no significant differences. ** = p < 0.01), *** = p < 0.001.
Horticulturae 10 01005 g009
Figure 10. Viability and growth of B. cinerea with and without VOCs emitted by Naganishia sp. (A) Viability of B. cinerea determined by MTT assay after treatment with VOCs. Mycelium treated with 70% v/v ethanol was used as a positive control. (B) Re-inoculation of B. cinerea treated with VOCs in a fresh, VOC-free medium. Circles represent untreated control, and squares represent VOCs pre-treated mycelium. Values represent the mean ± SD. ns: there are no significant differences. The bars represent the mean of three biological replicates ± SD. For statistical analysis: ANOVA was performed using Tukey’s test post-test. Columns with different letters are significantly different (p < 0.05).
Horticulturae 10 01005 g010
Figure 11. Effect of 2-phenylethanol in the mycelial growth of B. cinerea. Different concentrations of 2-phenylethanol were added to the sandwiched Petri plates assay, and the mycelial growth of B. cinerea was determined after 48 h of exposition. Values represent the mean of three biological replicates ± SD.
Horticulturae 10 01005 g011
Figure 12. Effect of VOCs emitted by Naganishia sp. on B. cinerea growth in vivo. (A) Infection area on tomato after 4 days post inoculation with B. cinerea. (B) Infection area on grape after 2 days post inoculation with B. cinerea. Bars represent the mean of three biological replicates ± SD. For statistical analysis, Student’s t-test was performed. Columns with different letters are significantly different (p < 0.05).
Horticulturae 10 01005 g012
Table 1. Concentration conversion of 2-phenylethanol.
Amount
(µL)
Double Petri Dish Volume (mL)Concentration
(µL mL−1)
01600.00
50.03
150.09
300.19
500.31
Table 2. Main volatile compounds emitted by Naganishia sp.
RTRSIIdentified Compoundm/zMolecular FormulaCAS Registration Number
14.31935ethylbenzene106.1C8H10100-41-4
14.829063-methylbutyl acetate130.2C7H14O2123-92-2
15.408622-heptanone114.2C7H14O110-43-0
18.419051-ethyl-3-methylbenzene120.2C9H12620-14-4
24.079462-phenylethanol122.2C8H10O60-12-8
34.36930(5E)-6,10-dimethyl-5,9-undecadien-2-one194.3C13H22O3796-70-1
RT: retention time (min), RSI: reverse similarity index, m/z: Molecular peak mass/mass ratio, CAS Registry Number: NIST Database Identification Number. n = 3.
Table 3. Abundance (percentage of the area) of the detected VOCs emitted by Naganishia sp.
Abundance
Relative Peak Area (%)
Day3-Methylbutyl AcetateEthylbenzene2-Heptanone1-Ethyl-3-Methylbenzene2-Phenylethanol (5E)-6,10-Dimethyl-5,9-Undecadien-2-One
33.0 ± 0.9NDNDND5.5 ± 2.5ND
73.9 ± 2.7ND0.1 ± 0.00.9 ± 0.29.0 ± 3.1ND
123.3 ± 0.72.0 ± 0.50.2 ± 0.0ND12.3 ± 2.74.9 ± 1.2
ND: Not detected. Media emission of the compounds ± the standard deviation is shown with respect to all compounds analyzed by gas chromatography.
Disclaimer/Publisher’s Note: The statements, opinions and data contained in all publications are solely those of the individual author(s) and contributor(s) and not of MDPI and/or the editor(s). MDPI and/or the editor(s) disclaim responsibility for any injury to people or property resulting from any ideas, methods, instructions or products referred to in the content.