Article

Exogenous Abscisic Acid Regulates Anthocyanin Biosynthesis and Gene Expression in Blueberry Leaves

College of Plant Science, Jilin University, Changchun 130062, China
*
Author to whom correspondence should be addressed.
Horticulturae 2024, 10(2), 192; https://doi.org/10.3390/horticulturae10020192
Submission received: 19 January 2024 / Revised: 16 February 2024 / Accepted: 17 February 2024 / Published: 19 February 2024
(This article belongs to the Special Issue Advances in Developmental Biology in Tree Fruit and Nut Crops)

Abstract

:
Blueberry (Vaccinium corymbosum) leaves have a positive influence on health because of their phenolic contents, including anthocyanins. Phytohormone abscisic acid (ABA) promotes anthocyanin accumulation, but the underlying mechanisms are unclear in blueberry leaves. In this study, we found that exogenous ABA promotes anthocyanin accumulation in blueberry leaves and we explored the global molecular events involved in these physiological changes by treating in vitro-grown blueberry seedlings with ABA and performing transcriptome deep sequencing (RNA-seq). We identified 6390 differentially expressed genes (DEGs), with 2893 DEGs at 6 h and 4789 at 12 h of ABA treatment compared to the control. Kyoto Encyclopedia of Genes and Genomes (KEGG) pathways related to plant hormone signal transduction and phenylpropanoid and flavonoid biosynthesis were significantly enriched at both stages of the ABA treatment. Analysis of DEGs in plant hormone signal transduction pathways revealed that exogenous ABA affected the expression of genes from other plant hormone signaling pathways, especially brassinosteroid, auxin, and gibberellin signaling. To elucidate the mechanism driving anthocyanin biosynthesis in blueberry in response to ABA treatment, we screened anthocyanin biosynthesis structural genes (ASG) from the phenylpropanoid and flavonoid biosynthetic pathways, MYB transcription factor genes from R2R3-MYB subgroups 5, 6, and 7 and ABRE-binding factor (ABF) genes from the ABA signal transduction pathway. Pearson’s correlation coefficient (r) analysis indicated that the ABFs, MYBs, and structural genes form a network to regulate ABA-induced anthocyanin biosynthesis and MYBA1 is likely to play an important role in this regulatory network. These findings lay the foundation for improving anthocyanin biosynthesis in blueberry leaves.

1. Introduction

Plant hormones (phytohormones) play crucial roles in plant growth and development [1,2,3]. The roles of the major plant hormones abscisic acid (ABA), gibberellins (GAs), ethylene, auxin, salicylic acid (SA), brassinosteroids (BRs), jasmonates (JAs), and cytokinins (CKs) have been well characterized and their signal transduction pathways elucidated [4,5]. ABA, a stress response phytohormone, plays a role in plant defense against stress conditions and stimulates fruit coloration by accelerating the accumulation of anthocyanins [6,7,8]. The ABA signal transduction pathway includes pyrabactin resistance 1 (PYR)/PYR1-like (PYL)/regulatory component of ABA receptor (RCAR), type 2C protein phosphatase (PP2C), and sucrose non-fermenting 1-related protein kinase 2 (SnRK2) family members. These proteins function via a double negative regulatory system in which ABA-bound PYR/PYL/RCAR inhibits PP2C activity, releasing SnRK2 from repression [9,10]. In the absence of ABA, PP2C inactivates SnRK2. In the presence of ABA, SnRK2 phosphorylates basic leucine zipper (bZIP)-type ABA-responsive element (ABRE)-binding factors (ABFs) to regulate the expression of downstream target genes [11,12,13]. Most ABA-induced genes contain conserved cis-acting ABA response elements (ABREs) in their promoter regions. ABF transcription factors regulate downstream genes by binding to these elements [14,15]. ABA regulates multiple aspects of plant physiology via its signal transduction pathway, but how ABA regulates anthocyanin biosynthesis via the signal transduction pathway in blueberry leaves is unclear.
Anthocyanins are visible flavonoid pigments that produce the red and blue colors of many ripe fruits to attract seed dispersers [16,17]. Anthocyanins are biosynthesized via the general phenylpropanoid pathway, with key steps catalyzed by phenylalanine ammonia-lyase (PAL), cinnamate 4-hydroxylase (C4H), and 4-coumarate CoA ligase (4CL), followed by the flavonoid pathway catalyzed by chalcone synthase (CHS), chalcone isomerase (CHI), and flavanone 3-hydroxylase (F3H). Finally, dihydroflavonol 4-reductase (DFR), leucoanthocyanidin dioxygenase (LDOX), UDP glucose-flavonoid 3-O-glucosyltransferase (UFGT), and UDP-glycosyltransferase 75 (UGT75) successively catalyze anthocyanin biosynthesis. However, for blueberry leaves, the link between ABF transcription factors and anthocyanin biosynthesis genes remains unknown in the ABA-induced anthocyanin synthesis pathway.
The transcription of anthocyanin biosynthesis structural genes (ASGs) is directly controlled by the MBW complex, consisting of R2R3-MYB transcription factors, basic helix–loop–helix (bHLH) transcription factors and WD40 proteins [18,19,20]. Within this complex, R2R3-MYBs are generally the key factors in determining the spatial and temporal occurrence of anthocyanins [21,22]. R2R3-MYB transcription factors are divided into 22 subgroups and subgroups 5, 6, and 7 play regulatory roles in flavonoid biosynthesis, including anthocyanins, proanthocyanins, and flavonols [21,23,24]. For instance, blueberry VcMYBA (subgroup 6) and Arabidopsis AtMYB113 and AtMYB114 (subgroup 6) control anthocyanin biosynthesis, AtMYB12 (subgroup 7) control flavonol biosynthesis, and AtMYB123/TT2 (subgroup 5) control proanthocyanidin biosynthesis [19,21,25,26]. Therefore, we hypothesized that ABF transcription factor, MYB transcription factor and anthocyanin biosynthesis structural genes may form a regulatory network to regulate ABA-induced anthocyanin synthesis.
Blueberry (Vaccinium corymbosum) is a popular fruit worldwide, in part due to the health benefits associated with its rich flavonoid compounds, particularly anthocyanins [27,28]. The fruits of the Vaccinium species are the main commercial products, whereas the leaves have been used mainly for medicinal purposes [29,30,31,32]. In the wild lowbush blueberry (V. angustifolium) and lingonberry (V. vitis-idaea), the total antioxidant capacities in terms of radical scavenging activity and reducing power were much higher in the leaves of both plants as compared to their fruits, which were in correlation with phenolic contents including total flavonoids, anthocyanins, and tannins [33]. The total flavonoids from blueberry leaves had both hypolipidemic and antioxidant effects, which could help the cure and prevention of hyperlipidemia diseases [34]. Thus, it is very important to study the mechanism of ABA induced anthocyanin biosynthesis in blueberry leaves.
In this study, to obtain differential expression genes (DEGs) from blueberry leaves in response to ABA treatment, we performed transcriptome deep sequencing (RNA-seq) analysis by treating in vitro-grown blueberry seedlings with ABA and annotated DEGs from KEGG pathways related to plant hormone signal transduction. To elucidate the mechanism driving anthocyanin biosynthesis in blueberry in response to ABA treatment, we assembled a regulatory network of ABFs–MYB–ASGs by gene co-expression analysis. Our findings increase understanding of ABA-induced anthocyanin biosynthesis and provide a basis for improving the value of blueberry leaves via ABA treatment.

2. Materials and Methods

2.1. Plant Materials and ABA Treatments

In vitro-grown seedlings were obtained from the blueberry (Vaccinium corymbosum) cultivar ‘Northland’. The materials were cultured on modified woody plant medium (WPM) containing Murashige and Skoog vitamins under a 16-h-light/8-h-dark photoperiod of 2000 Lux from cool white fluorescent tubes at 25 °C. The seedlings were cultured on WPM containing 1.0 mg/L trans-Zeatin for 5 weeks, and then, seedlings with six to ten blades were transferred to the medium containing 100 µM ABA for 0, 6 or 12 h for RNA-seq and RT-qPCR analysis and measurement of the anthocyanin contents [35,36].

2.2. Transcriptome Sequencing

Total RNA was extracted from seedlings after 0, 6, or 12 h of ABA treatment using an RNAprep Pure Plant Kit (Tiangen, Beijing, China), and RNA concentration and purity were measured using a NanoDrop 2000 (Thermo Fisher Scientific, Wilmington, DE, USA). Sequencing libraries were generated using a Hieff NGS Ultima Dual-mode mRNA Library Prep Kit for Illumina (Yeasen Biotechnology (Shanghai) Co., Ltd., Shanghai, China). The libraries were sequenced on an Illumina NovaSeq platform to generate 150-bp paired-end reads. The raw reads were processed with a bioinformatic pipeline tool, BMKCloud (www.biocloud.net (accessed on 1 July 2023)). Clean data (clean reads) were obtained by removing reads containing adapters, reads containing ploy-N, and low-quality reads from raw data. The Q30, GC content, and sequence duplication level of the clean data were calculated. All downstream analyses were based on clean, high-quality data. The clean reads were mapped to the reference Vaccinium corymbosum cv. Draper V1.0 genome sequence (https://www.vaccinium.org/genomes (accessed on 1 August 2023)) using Hisat2 tools software version 2.0.4.

2.3. Differential Expression Analysis and Functional Annotation

Gene expression levels were estimated based on fragments per kilobase of transcript per million fragments mapped (FPKM). DEGs between two samples were identified using a false discovery rate (FDR) < 0.01 and absolute log2 (fold-change) ≥ 1 by DESeq2 (version 1.30.1). Gene function was annotated based on Clusters of Orthologous Groups (COG) (http://www.ncbi.nlm.nih.gov/COG (accessed on 20 August 2023)), Gene Ontology (GO) (https://geneontology.org/ (accessed on 20 August 2023)), Kyoto Encyclopedia of Genes and Genomes (KEGG) (https://www.genome.jp/kegg/ (accessed on 20 August 2023)), Eukaryotic Orthologous Groups (KOG) (ftp://ftp.ncbi.nih.gov/pub/COG/KOG (accessed on 25 August 2023)), Protein family (Pfam) (https://pfam.sanger.ac.uk/ (accessed on 25 August 2023)), a manually annotated and reviewed protein sequence database (Swiss-Prot) (https://www.uniprot.org/ (accessed on 25 August 2023)), the evolutionary genealogy of genes using the Non-supervised Orthologous Groups (eggNOG) (http://eggnog-mapper.embl.de (accessed on 30 August 2023)), and NCBI non-redundant protein sequence (NR) databases.
KEGG pathway enrichment analysis of the DEGs was performed using the KOBAS database and clusterProfiler software (version 4.4.4) [37]. Heatmaps of the expression of DEGs in the plant hormone signal transduction pathways and the anthocyanin biosynthetic pathway under ABA treatment were assembled using log2(FPKM) values with Tbtools (v1.098761) software [38]. The regulatory network of the anthocyanin biosynthetic pathway was constructed based on Pearson’s correlation coefficients (r) between R2R3-MYB transcription factor genes and anthocyanin biosynthesis/ABF genes using IBM SPSS software (version 19.0).

2.4. Analysis of Abscisic Acid Responsiveness Element in the Promoter

The upstream sequences of screened MYB and anthocyanin biosynthesis genes were downloaded from the GDV. About 2000-bp upstream sequences were submitted to the online program PlantCARE (https://bioinformatics.psb.ugent.be/webtools/plantcare/html/ (accessed on 1 November 2023)) to predict abscisic acid responsiveness element (ABRE) or MYB binding sites.

2.5. Reverse-Transcription Quantitative PCR

Total RNA was extracted from each sample using an RNA Extraction Kit (Sangon Biotech, Shanghai, China), and first-strand cDNAs were synthesized using PrimeScriptTM RT Master Mix (TaKaRa, Kusatsu, Japan). RT-qPCR analysis was performed using an ABI 7900HT real-time PCR system. Nine ABA signal transduction pathway genes (ABF2d, ABF4b, PP2C-24a, PP2C-37a, PP2C-7a, PP2C-51b, PYL1, SnRK2A, and PYL4a) were selected to validate the RNA-seq data. Glyceraldehyde-3-phosphate dehydrogenase housekeeping (GAPDH; GenBank accession no. AY123769) was used as the reference gene, and the relative expression levels of each gene were calculated using the 2−∆∆Ct method. Primer sequences for RT-qPCR are shown in Table S1.

2.6. Measurement of Anthocyanin Contents

Total anthocyanin contents were measured as described by Yang et al. [39]. Each sample was ground to a powder, and 1 g was extracted in 6 mL of 1% (v/v) HCl in methanol and incubated at 4 °C for 16 h. After the mixtures were centrifuged (8000× g, 10 min, 4 °C), 4 mL of the supernatant was diluted with 4 mL ddH2O, and the absorbance was measured at 530 and 650 nm. Total anthocyanin content was calculated using the equation A530 − 0.25 × A650 [40].

2.7. Cluster Analysis and Sequence Alignment of MYB Transcription Factors

A phylogenetic tree was constructed through amino sequencing of 23 differentially expressed R2R3-MYB genes from blueberry and 124 R2R3-MYB proteins from Arabidopsis using the neighbor-joining method with MEGA X software (https://www.megasoftware.net (accessed on 30 October 2023)). The phylogenetic tree was divided into different subgroups based on MYB transcription factors from Arabidopsis [24,41]. The MYBs from blueberry were named based on cluster and functional annotations from SwissProt databases. Sequence alignment and phylogenetic analysis between MYBA1, MYBA2 and VcMYBA (GenBank accession no. MH105054) were performed using DNAMAN software, Version 8.192.

2.8. Statistical Analysis

The gene expression levels or anthocyanin contents were carried out using three independent biological replicates, and three technical replicates were performed for each biological replicate. One-way analysis of variance (ANOVA) was used to assess the differences in gene expression levels or anthocyanin contents during ABA treatment, and Tukey’s test was used to identify significant differences at p-value ≤ 0.05 using SPSS 19.0 software.

3. Results

3.1. ABA Treatment Promotes Anthocyanin Accumulation

To characterize the effect of exogenous ABA on anthocyanin accumulation in blueberry leaves, we treated in vitro-grown blueberry seedlings with exogenous ABA and without ABA for 0, 6, or 12 h (Figure 1a). The tip of the leaves turned red after 6 h of ABA treatment. We measured the anthocyanin contents of in vitro-grown blueberry seedlings under ABA treatment (Figure 1b). The anthocyanin contents significantly increased after 6 h and 12 h of ABA treatment compared to the 0 h control. At the same time, without ABA treatment, the content of anthocyanin did not change at 0 h, 6 h or 12 h. Thus, exogenous ABA promotes anthocyanin accumulation in vitro-grown blueberry seedlings.

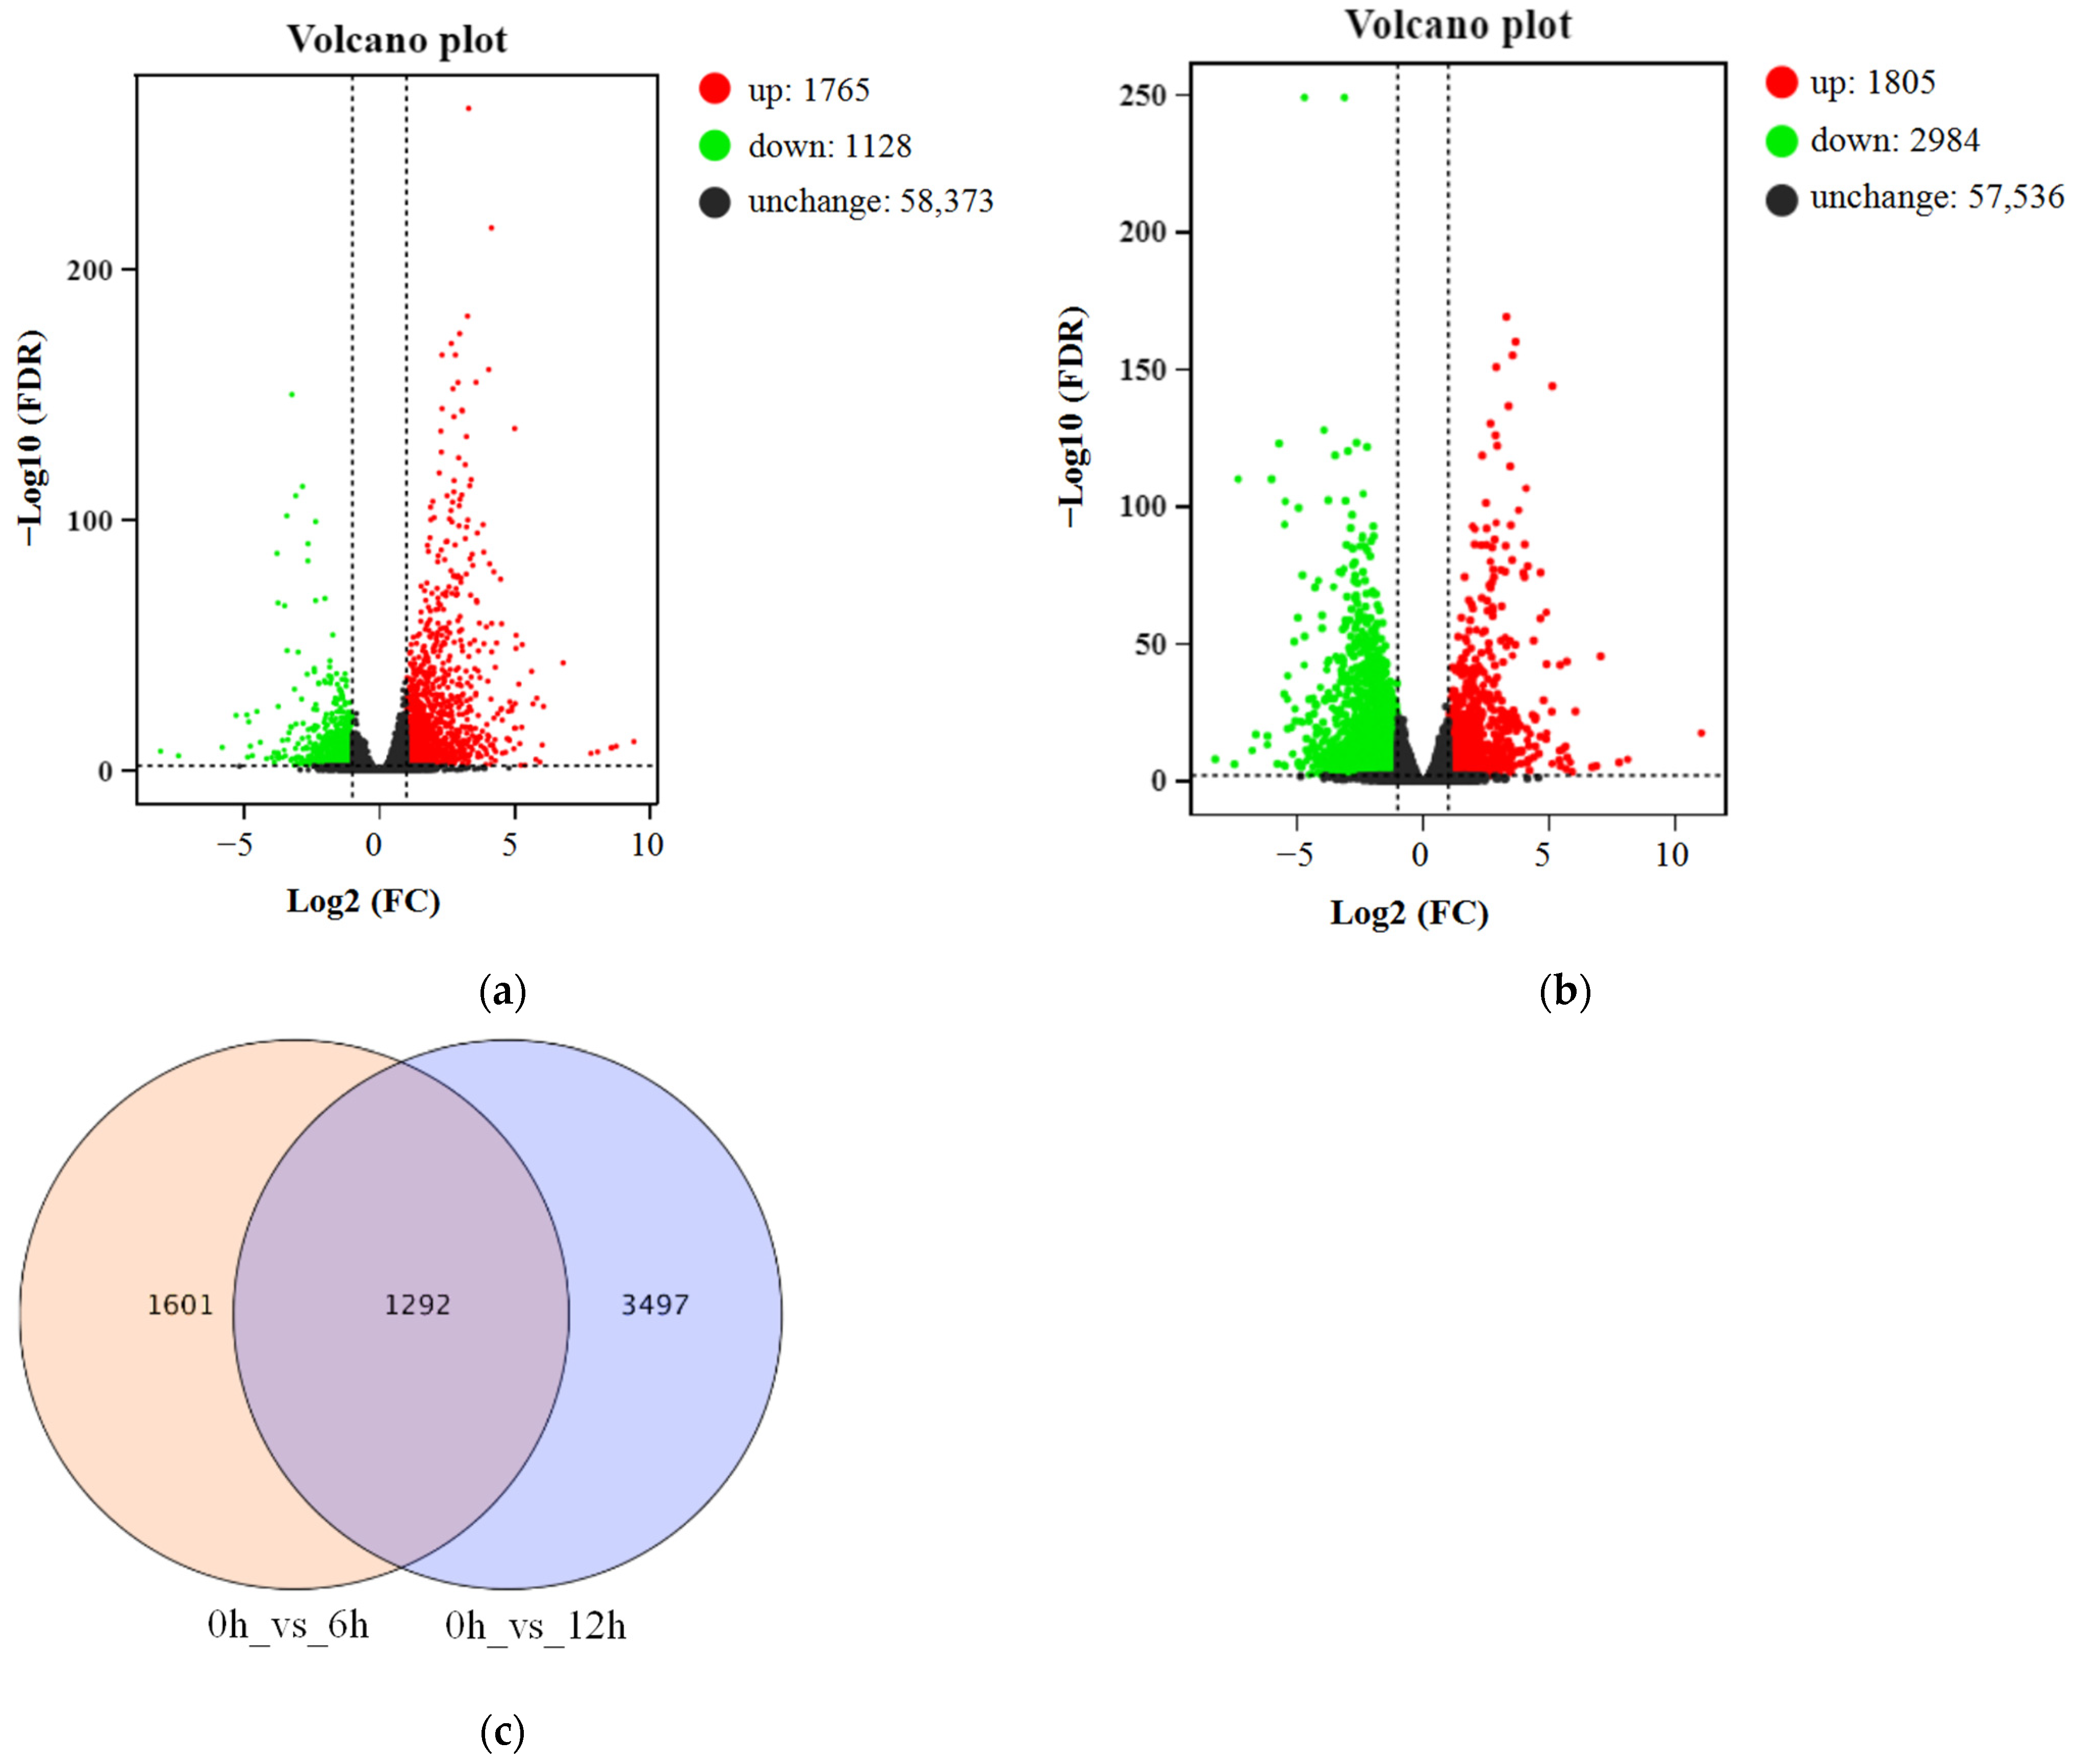
3.2. Transcriptome Sequencing and Analysis of DEGs

To elucidate the molecular changes underlying the response of blueberry to exogenous ABA, we performed RNA-seq analysis using in vitro-grown blueberry seedlings under ABA treatment for 6 or 12 h, using untreated seedlings as the 0 h control. Table 1 summarizes the nine samples used for RNA-seq. More than 19.3 million clean reads were obtained, generating more than 5.78 Gb of clean bases for each sample. We mapped the clean reads to the blueberry reference genome at a rate of approximately 89.9% to 91.2% per sample. The percentage of Q30 bases was 90.45% or above, and the GC content ranged from 45.7% to 46.55%.
Genes with FDR < 0.01 and absolute log2 (fold-change) ≥ 1 between control samples (0 h) and samples under ABA treatment (6 and 12 h) were considered to be DEGs. We identified 2893 DEGs in the 0 h vs. 6 h comparison, consisting of 1765 upregulated and 1128 downregulated DEGs (Figure 2a). For the 0 h vs. 12 h comparison, the number of DEGs increased to 4789, with more downregulated DEGs (2984) than upregulated DEGs (1805) (Figure 2b). As shown in the Venn diagram in Figure 2c, across the two comparisons, we detected 6390 DEGs, with 1292 DEGs shared between 0 h vs. 6 h and 0 h vs. 12 h.

3.3. Functional Annotation and KEGG Pathway Analysis of DEGs under ABA Treatment

We annotated the functions of the DEGs under ABA treatment using the COG, GO, KEGG, KOG, NR, Pfam, Swiss-Prot, and eggNOG databases (Table S2). The total number of annotated DEGs increased from 2730 (94.37%) for the 0 h vs. 6 h comparison to 4623 (96.53%) for the 0 h vs. 12 h comparison; we annotated 1952 and 3453 of these DEGs using the KEGG database for each comparison, respectively.
To identify the biological functions of the DEGs in blueberry, we subjected all DEGs to KEGG pathway enrichment analysis and KEGG functional classification (Figure 3). Analysis of the top 20 enriched KEGG pathways showed that the plant hormone signal transduction pathway (ko04075), phenylpropanoid biosynthetic pathway (ko00940), and flavonoid biosynthetic pathway (ko00941) are significantly enriched at all stages (Figure 3a–c). At 6 and 12 h into ABA treatment, 291, 197, and 85 DEGs were enriched in the plant hormone signal transduction pathway, phenylpropanoid biosynthetic pathway, and flavonoid biosynthetic pathway, respectively (Figure 3c). KEGG functional classification showed that the DEGs are involved in cellular processes, environmental information processing, genetic information processing, metabolism, and organismal systems (Figure 3d–f).
The KEGG pathway with the greatest number of DEGs was the plant hormone signal transduction pathway for all stages, with more upregulated DEGs than downregulated DEGs at 6 h and more downregulated than upregulated DEGs at 12 h. Among metabolic pathways, those with the greatest number of DEGs were the phenylpropanoid biosynthetic pathway (197, 7.9%), the starch and sucrose metabolism pathway (158, 6.3%), and the flavonoid biosynthetic pathway (85, 3.4%) (Figure 3f). Thus, DEGs from the plant hormone signal transduction pathway, the phenylpropanoid biosynthetic pathway, and the flavonoid biosynthetic pathway play important roles in the response of blueberry to exogenous ABA.

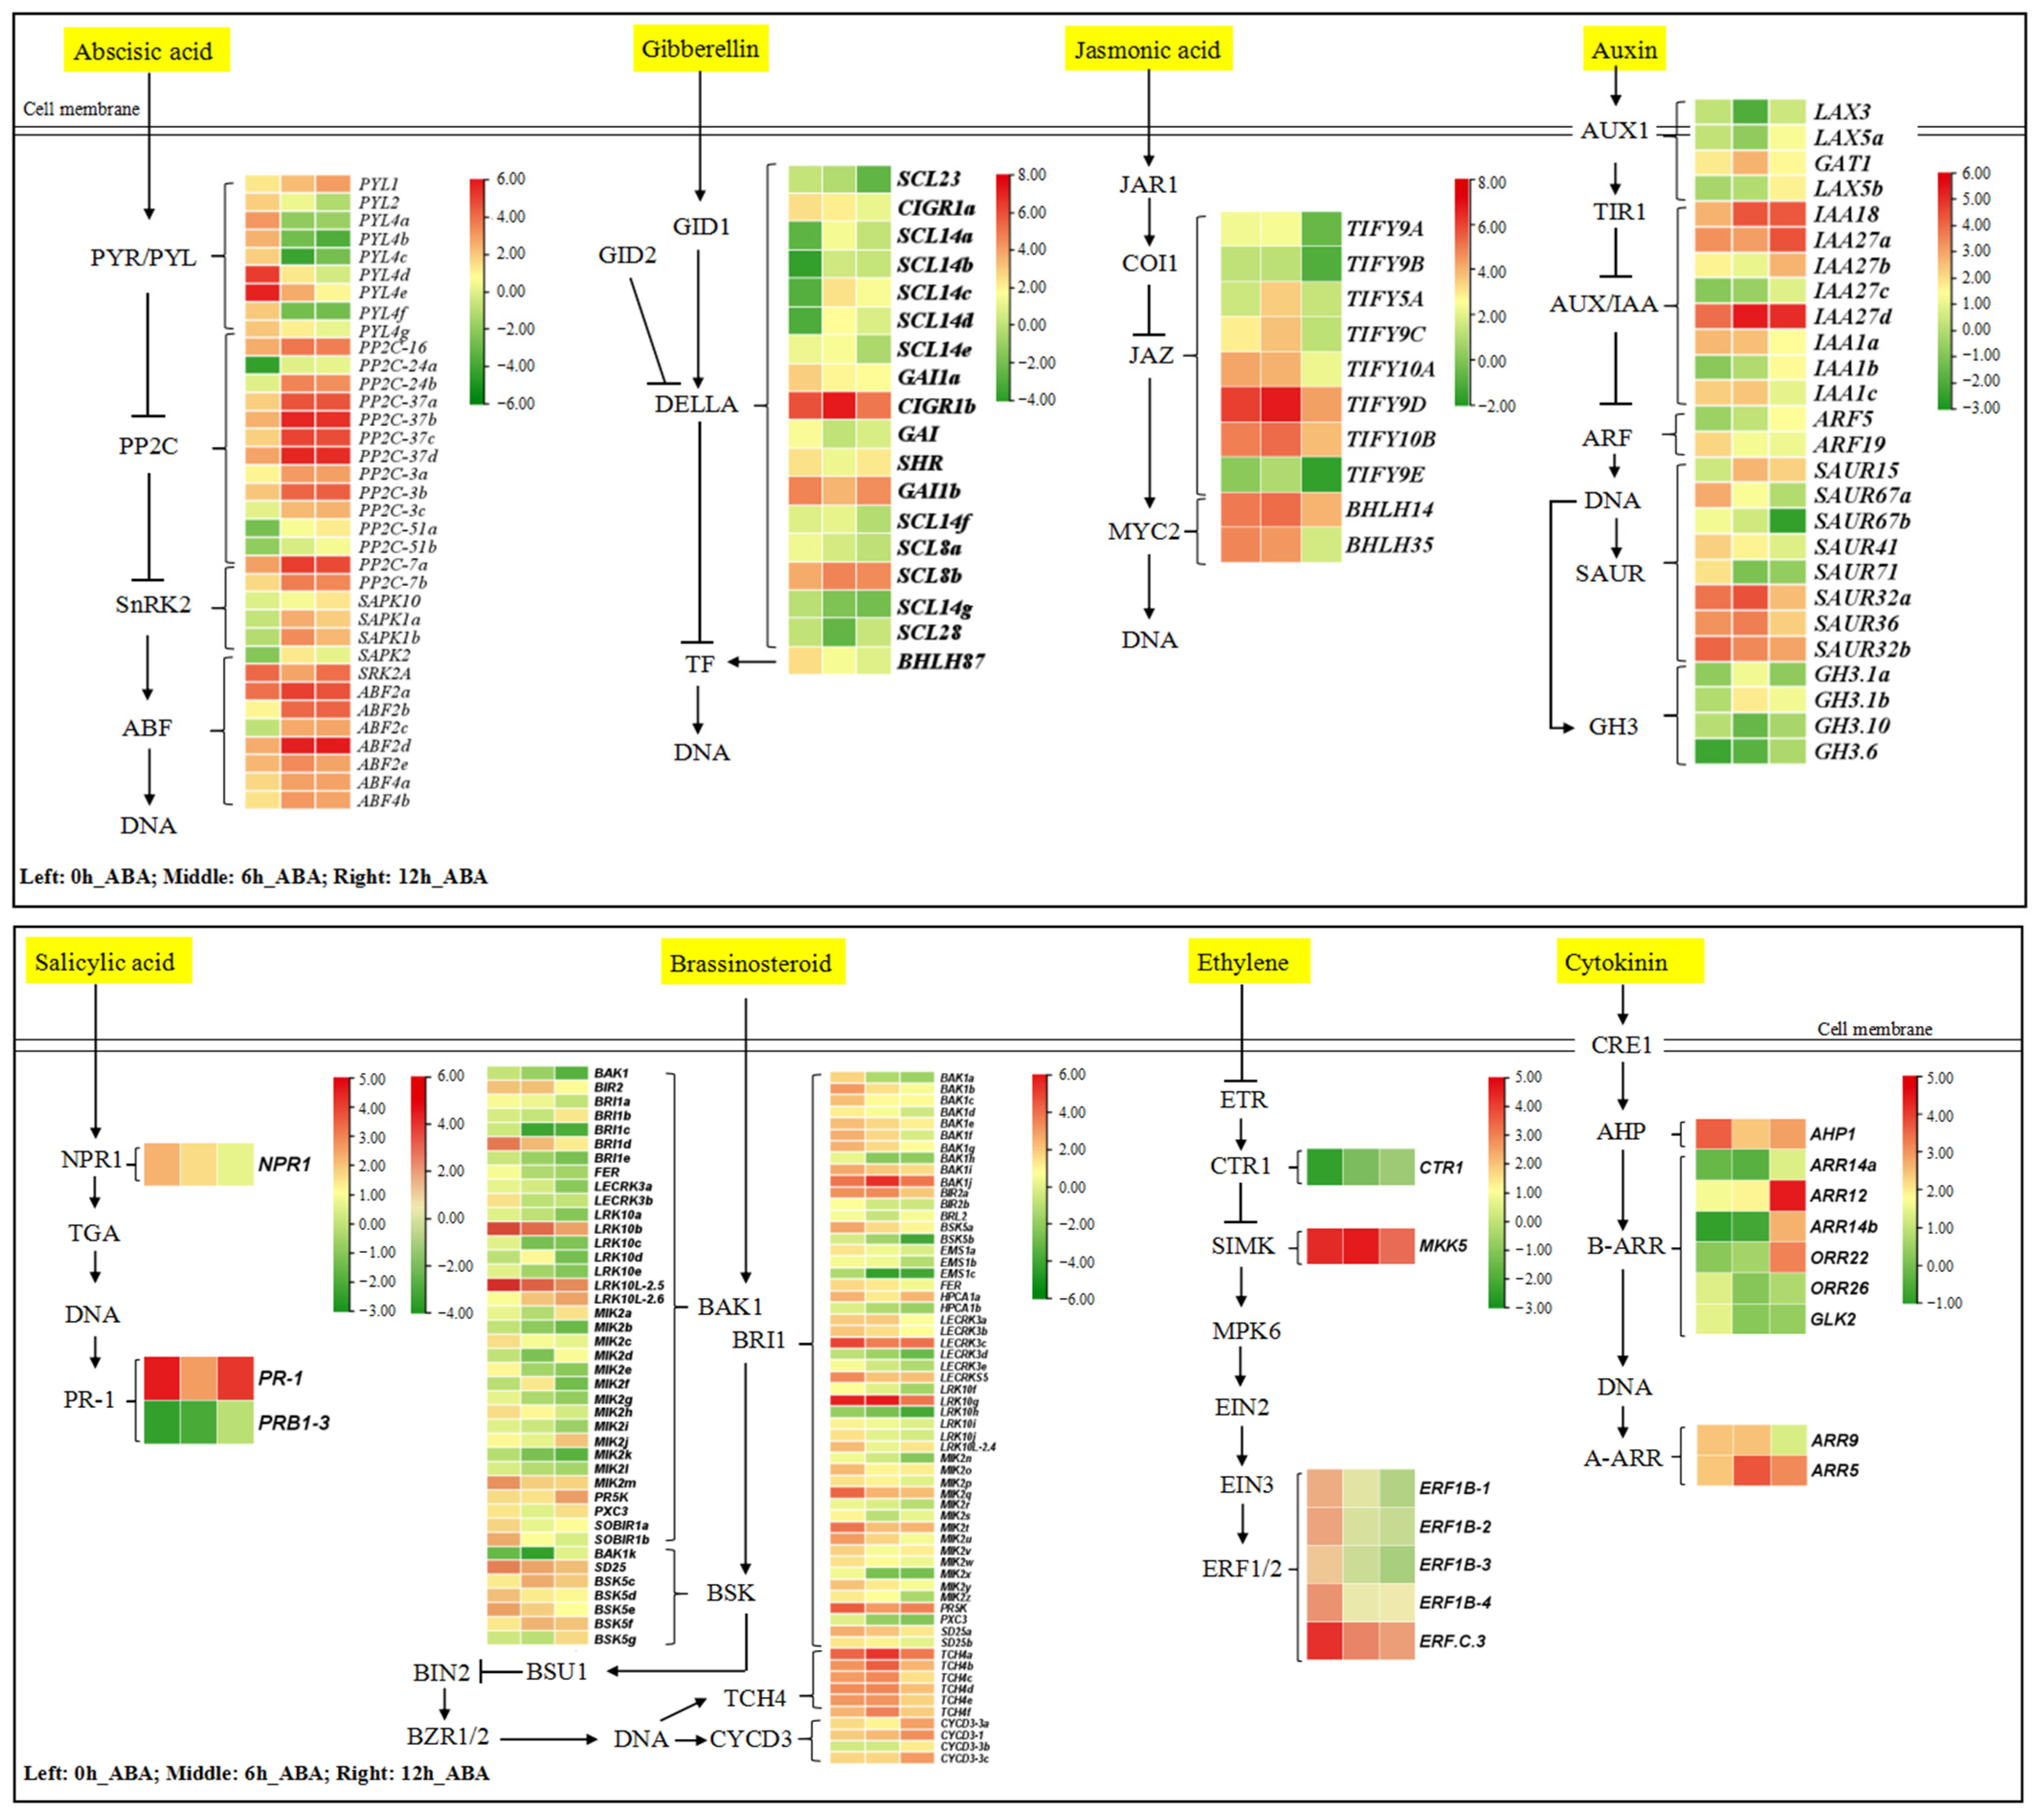
3.4. Exogenous ABA Induces the Expression of Plant Hormone Signal Transduction Pathway Genes

To elucidate the functions of DEGs from the plant hormone signal transduction pathway, we identified 209 DEGs (Table S3). These DEGs were mapped to the ABA, GA, JA, auxin, SA, BR, ethylene, and CK biosynthetic pathways (Figure 4). Of these DEGs, 101, 35, 26, and 18 were mapped to the BR, ABA, auxin, and GA biosynthetic pathways, respectively. In the ABA signaling pathway, eight PYR/PYL family members were downregulated and one was upregulated. All PP2C gene family members were upregulated at 6 and 12 h of ABA treatment relative to the 0 h control. Of the five SnRK2 family members, one was downregulated and the remaining four were upregulated. All the ABFs were upregulated under ABA treatment. In the BR signal transduction pathway, 50 brassinosteroid insensitive 1 (BRI1) genes and 34 BRI1 associated protein kinase 1 (BAK1) genes were differentially expressed, including 9 that were upregulated and 75 that were downregulated. In the auxin signal transduction pathway, six AUX/IAA genes were upregulated and two were downregulated. In the GA signal transduction pathway, 17 genes encoding DELLA family members were identified, with 6 being upregulated and 11 being downregulated. These results indicate that ABA treatment not only induced the expression of ABA signal transduction pathway genes, but it also affected the expression of other plant hormone signal transduction pathway genes, especially the BR, auxin, and GA signal transduction pathways.
We selected nine genes from the ABA signal transduction pathway to validate the accuracy and reliability of the RNA-seq data by RT-qPCR (Figure S1a). Pearson’s correlation coefficient (r) analysis showed that log2 (2−ΔΔCt) values from RT-qPCR and log2 (FC) from RNA-seq are significantly correlated for the 0 h vs. 6 h (0.943) and 0 h vs. 12 h (0.872) comparisons (Figure S1b). These results indicate that the RNA-seq data generated in this study are accurate and reliable.

3.5. Exogenous ABA Treatment Regulates the Expression of R2R3-MYB Transcription Factor Genes

To elucidate the functions of transcription factors in response to ABA treatment, we analyzed the differentially expressed R2R3-MYB transcription factor genes under ABA treatment according to Pfam, Swiss-Prot, and NR functional annotations. After removing the repeat MYB transcription factor genes based on sequence analysis, we identified 23 R2R3-MYB subfamily genes, of which 18 were upregulated and 5 were downregulated under ABA treatment (Table S4). To predict the potential functions of the proteins encoded by these R2R3-MYB genes, we reconstructed a phylogenetic tree based on their deduced protein sequences and 124 R2R3-MYB proteins from Arabidopsis (Figure 5). The blueberry R2R3-MYB transcription factors belong to 12 subgroups, which were previously defined for Arabidopsis R2R3-MYB proteins. MYBA1 and MYBA2 were clustered in subgroup 6; their encoding genes were upregulated under exogenous ABA treatment. Sequence alignment and phylogenetic analysis showed that MYBA1 shared 97.64% amino sequence identity with VcMYBA (GenBank accession no. MH105054) (Figure S2). Thus, MYBA1 is probably homologous to VcMYBA, which belongs to subgroup 6 and induces anthocyanin accumulation by heterologous expression in Nicotiana benthaminana [21]. MYB5, MYB11, and MYB12 belong to subgroup 7, and their encoding genes were upregulated under ABA treatment. MYB23 and MYB123 clustered in subgroup 5, and their encoding genes were repressed in response to exogenous ABA treatment. In general, R2R3-MYB transcription factors of subgroups 5, 6, and 7 regulated flavonoid biosynthesis [41]. Thus, these MYB transcription factors may be regulated ABA-induced anthocyanin accumulation.

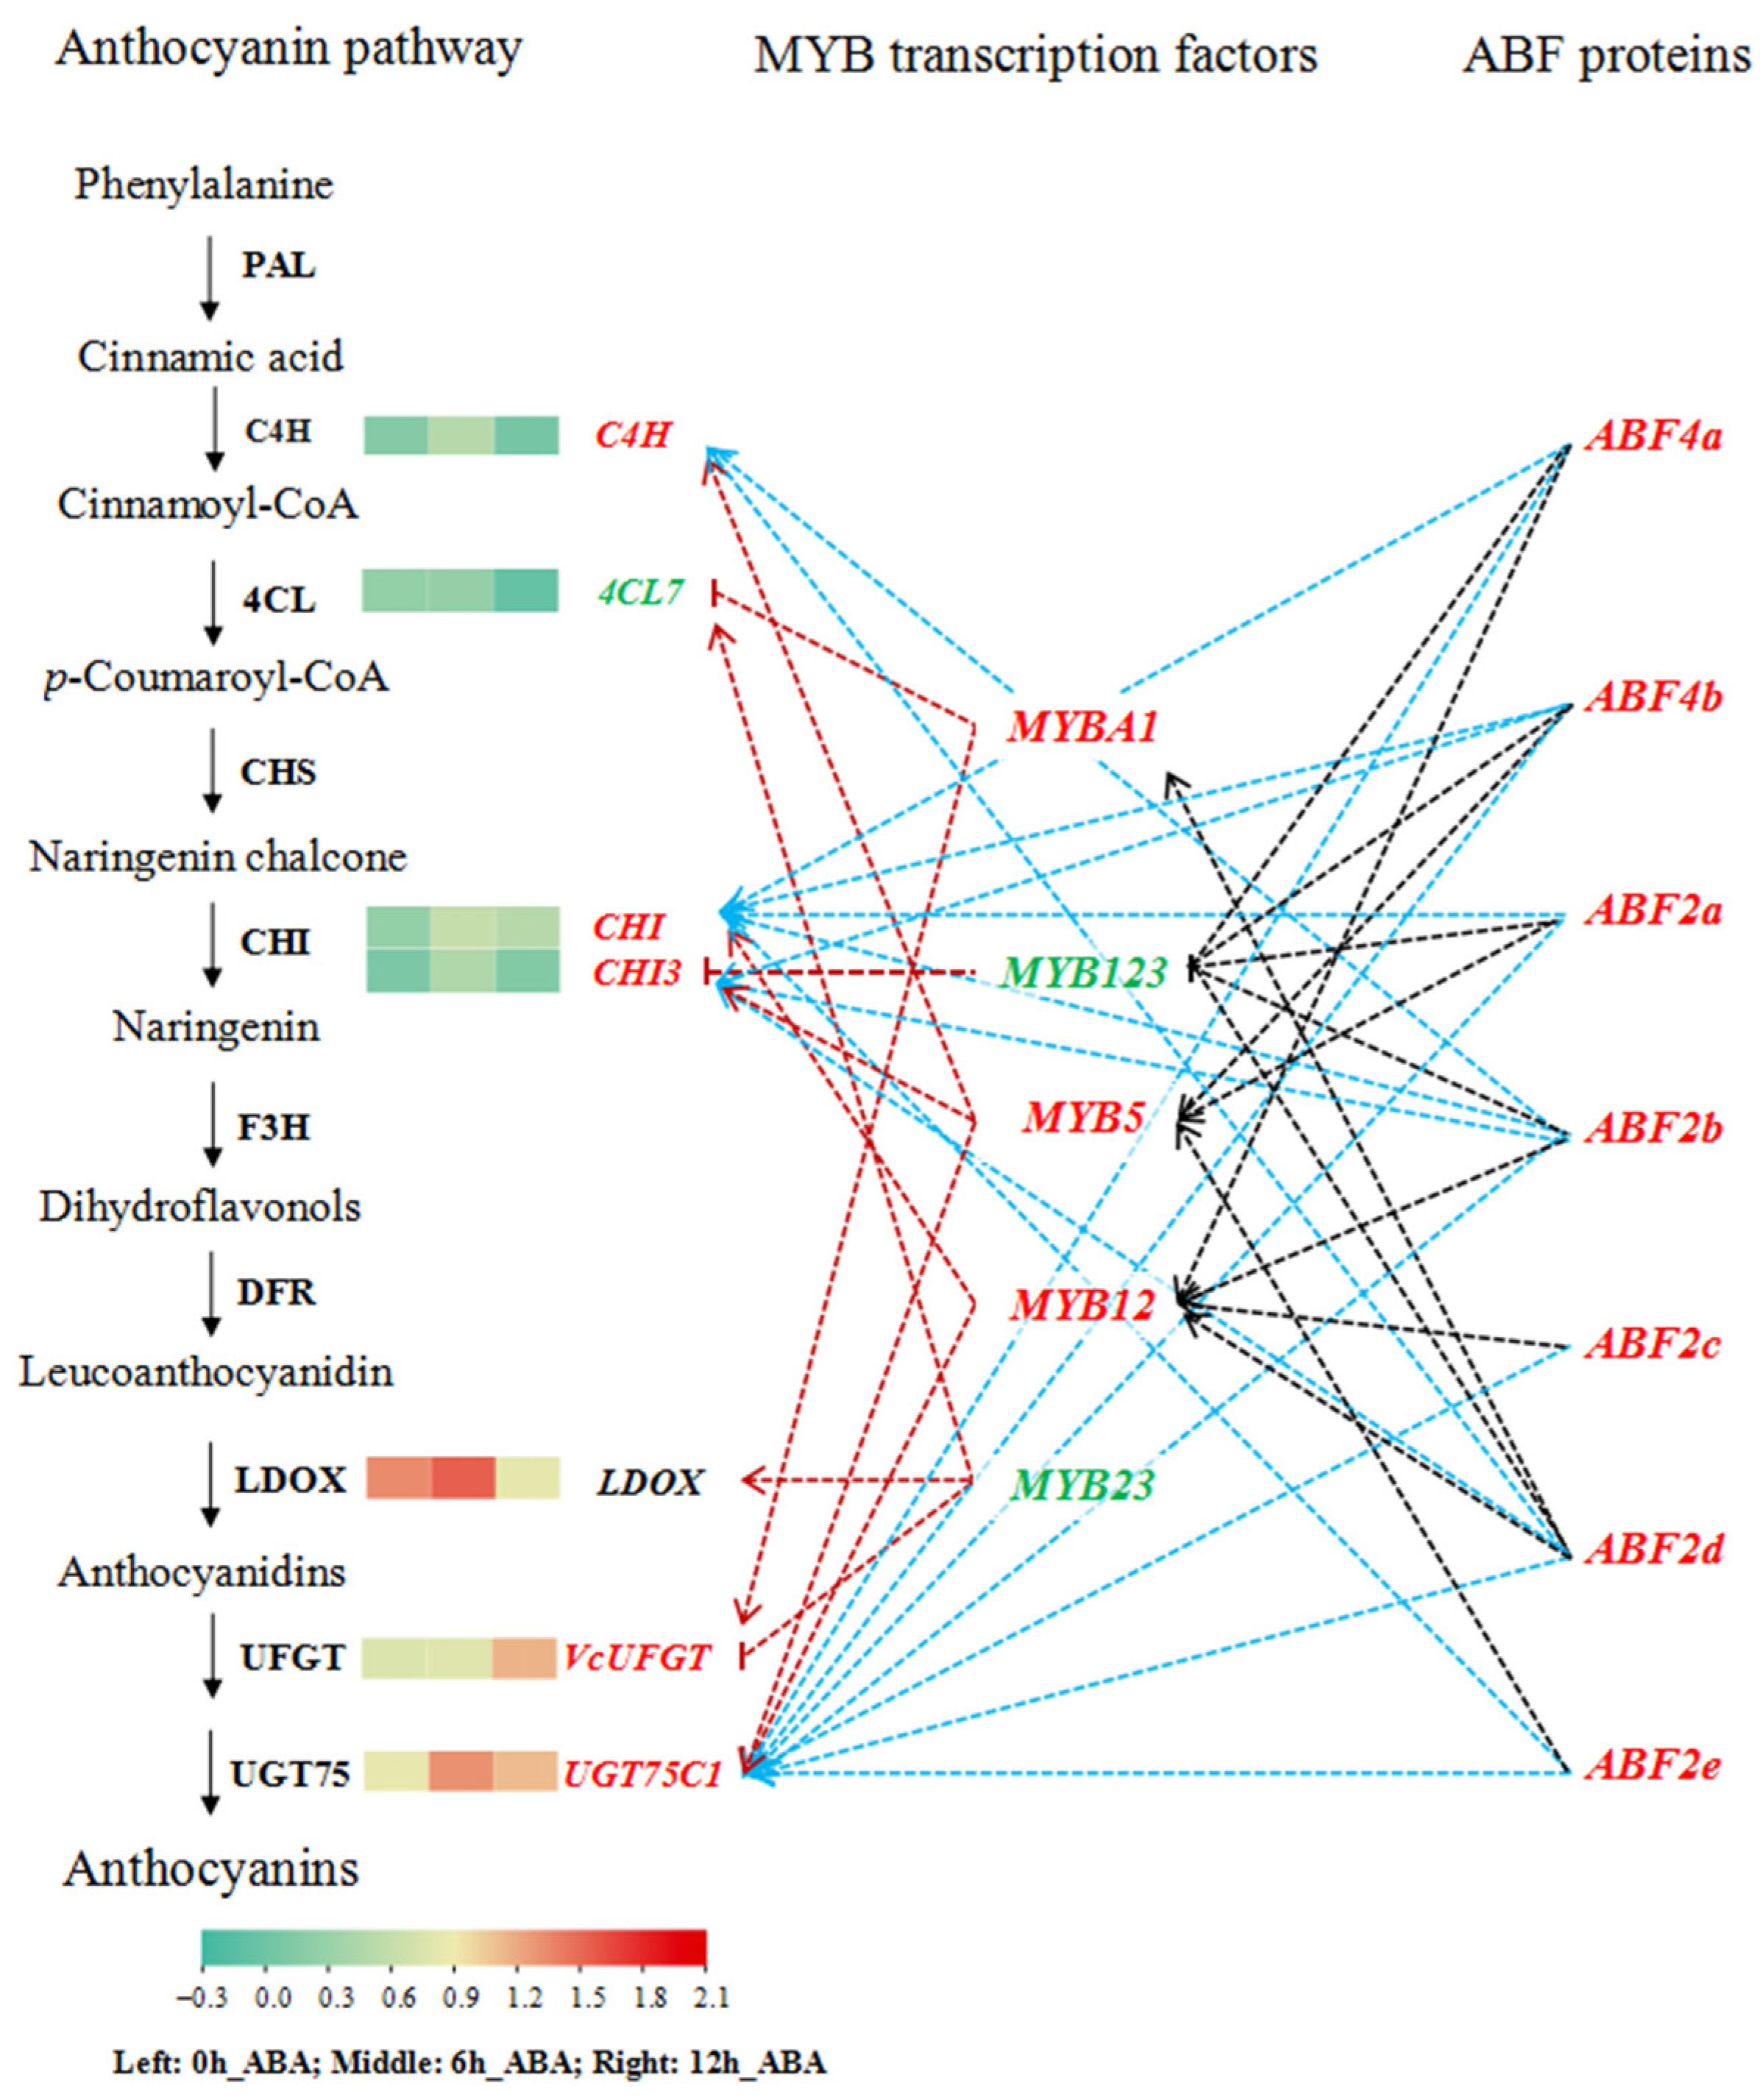
3.6. Exogenous ABA Induces the Expression of Anthocyanin Pathway Genes via MYB or ABF Transcription Factors

To clarify the regulatory network of ABA-induced anthocyanin biosynthesis, we screened the DEGs involved in anthocyanin biosynthesis from the phenylpropanoid and flavonoid biosynthetic pathway based on KEGG annotation. After removing repeat sequences, we retained seven DEGs (Table S5). Of these, C4H, CHI, CHI3, VcUFGT, and UGT75C1 were upregulated and 4CL7 and LDOX were downregulated in response to ABA treatment (Figure 6 and Table S5). We collected the 2000 bp upstream sequences from the ATG start codons of the differentially expressed MYB and anthocyanin biosynthesis genes and looked for ABREs or MYB binding sites using the PlantCARE online tool (Figure S3). The promoter sequences of all the MYBs contain ABREs, including MYB23, which contains six ABREs. Among the anthocyanin biosynthesis genes, the C4H, 4CL7, CHI, and LDOX promoters contained one to four ABREs. However, the promoter sequences of anthocyanin biosynthesis genes contain three to nine MYB binding sites. In general, bZIP-type AREB/ABF transcription factors target ABREs and MYB transcription factors target MYB binding sites in the promoter regions of genes to regulate their expression.
To investigate the functions of MYB transcription factors from subgroups 5, 6, and 7 and ABF transcription factors in the anthocyanin biosynthetic pathway, we calculated Pearson’s correlation coefficients (r) between ABFs and MYBs, between ABFs and anthocyanin biosynthetic genes, and between MYBs and anthocyanin biosynthetic genes according to FPKM values under ABA treatment (Table S6). The expression of MYB12, MYB23, MYB5, and MYBA1 was positively correlated with that of most anthocyanin metabolism genes. However, the expression of some MYBs was negatively correlated with that of anthocyanin pathway genes, such as MYB123 and CHI3, MYB23 and VcUFGT, and MYBA1 and 4CL7. The expression of ABFs was positively correlated with that of most anthocyanin metabolism genes. Correlation analysis between ABFs and MYBs showed that the expression of most ABFs is positively correlated with that of MYBs, and the expression of most ABFs and MYBs was positively correlated with that of anthocyanin metabolism genes. Based on the results of correlation analysis, we constructed a proposed regulatory network of ABA-induced anthocyanin biosynthetic pathway genes by MYB and ABF transcription factors (Figure 6).

4. Discussion

4.1. Exogenous ABA Promoter Anthocyanin Accumulation of Blueberry Leaves

Blueberries are the richest sources of polyphenolic antioxidants, especially anthocyanins, among all fruits and vegetables [42]. Blueberry leaves, which have been used mainly for medicinal purposes, are considered essentially as waste or by-products. Various health benefits were reported for leaf extracts from the Vaccinium species [29,30,31,32]. A large number of studies have shown that exogenous ABA stimulates anthocyanin accumulation of blueberry fruits [7,43,44]. In this study, we also found that exogenous ABA also promotes anthocyanin biosynthesis in high blueberry leaves. Therefore, exogenous ABA treatment can improve the utilization value of blueberry leaves.

4.2. Exogenous ABA Regulated the Expression of ABA Signal Transduction Pathway Genes

The plant hormone ABA mediates various physiological responses in plants via the PYR/PYL/RCAR, PP2C, and SnRK2 family members; these three families constitute the core components of the ABA signal transduction pathway [5,9,10]. ABA treatment regulates the expression of the genes encoding these family members. For example, in the primary roots of maize (Zea mays) seedlings, ABA treatment upregulated ZmPYL1–3 genes (encoding homologs of dimeric-type Arabidopsis ABA receptors) but downregulated ZmPYL4–10 (encoding homologs of monomeric-type Arabidopsis ABA receptors). However, the opposite trend was observed in the leaves of maize plants growing in medium containing ABA. At the same time, three PP2C and three SnRK2 family genes were upregulated in primary roots in response to ABA treatment [45]. In this study, among the PYR/PYL/RCAR, PP2C, and SnRK2 family members, PYL1 was upregulated and PYL4a–g was downregulated in in vitro-grown blueberry seedlings in response to ABA treatment (PYL1 and PYL4 were named based on their homologs in Arabidopsis). In addition, the genes encoding all PP2C and most SnRK2 family members were upregulated in in vitro-grown blueberry seedlings under ABA treatment (Table S3 and Figure 4). These results indicate that the primary roots of maize seedlings and in vitro-grown blueberry seedlings employ similar mechanisms in response to exogenous ABA treatment.

4.3. Exogenous ABA Regulated the Expression of Other Plant Hormone Signal Transduction Pathway Genes

Exogenous ABA treatment not only induces the expression of ABA signal transduction pathway genes but also affects the expression of genes in other plant hormone signal transduction pathways, highlighting the complex crosstalk between ABA and other plant hormones in regulating plant defense responses and anthocyanin biosynthesis [1,46,47]. Transcriptome analysis in mangrove (Kandelia obovata) showed that plant hormone signal transduction pathways were significantly enriched in DEGs related to response to ABA treatment during vivipary [48]. Our data indicate that signal transduction pathways of other plant hormones are also significantly enriched during exogenous ABA treatment in in vitro-grown blueberry seedlings, particularly BR, followed by auxin and GA signaling (Table S3 and Figure 4).
BRs are steroidal plant hormones that are essential for plant growth and development [49,50]. BRs have significant effects on plant secondary metabolism, particularly anthocyanin biosynthesis [51,52]. However, several reports indicate that BR treatment inhibited red-flesh coloration and repressed high light-induced anthocyanin accumulation in red-fleshed apple (Malus domestica) seedlings [53,54]. In this study, ABA treatment downregulated most BRI1 and BAK1 family genes. These family members form surface receptor kinase complexes that are responsible for perceiving BRs [55]. Thus, exogenous ABA may inhibit endogenous BR biosynthesis to repress plant growth and promote flavonoid biosynthesis in blueberry.
Auxin, the first plant hormone discovered, promotes plant growth and regulates secondary metabolism [56,57]. Auxin affects the levels of other phytohormones; in turn, other plant hormones affect the level of auxin. In sweet cherry (Prunus avium), 1-naphthaleneacetic acid (NAA) treatment altered ethylene production, which induced fruit ripening and enhanced anthocyanin production [58]. However, in apple calli, NAA and 2,4-dichlorophenoxyacetic acid (2,4-D) treatment inhibited anthocyanin accumulation [59,60]. Aux/IAAs repress auxin responses and play central roles in the auxin signal transduction pathway [61,62]. Our transcriptome analysis showed that most Aux/IAA genes were upregulated under exogenous ABA treatment in in vitro-grown blueberry seedlings. Thus, exogenous ABA also increased endogenous auxin contents in blueberry.
GA promotes plant growth and cell division and regulates anthocyanin biosynthesis [2,63]. DELLA proteins are repressors of GA signaling that modulate all aspects of GA-induced growth and development [4,64]. ABA attenuates GA biosynthesis and increases DELLA gene expression, leading to a reduction in bioactive GA levels [2]. DELLAs play a major role in mediating the crosstalk among plant hormonal signals [65]. Our transcriptome analysis showed that 17 DELLA genes were regulated by ABA treatment in in vitro-grown blueberry seedlings, indicating that DELLAs modulate the crosstalk between the ABA and GA signaling pathways.

4.4. The regulatory Network of ABA-Induced Blueberry Anthocyanin Accumulation

ABA plays important roles in promoting anthocyanin production and fruit ripening [37,66]. In general, ABA induces gene expression by binding to conserved cis-acting ABREs in the promoters of their target genes. ABF transcription factors regulate the ABRE-mediated transcription of downstream target genes [12,14,67]. R2R3-MYB transcription factors from subgroups 5, 6, and 7 regulate flavonoid biosynthesis via the transcriptional regulation of flavonoid structural genes [21,23,68]. In Arabidopsis, MYB49 interacts with ABSCISIC ACID-INSENSITIVE5 (ABI5) to regulate ABA-repressed cadmium accumulation [69]. Here, we showed that exogenous ABA promoted anthocyanin accumulation in in vitro-grown blueberry seedlings (Figure 1). The promoter sequences of all R2R3-MYB genes from subgroups 5, 6, and 7 and the ASGs (C4H, 4CL7, CHI, and LDOX) contain one or more ABREs, and all the ASGs contain more than three MYB binding sites (Figure S3). The expression of ABF genes was upregulated under ABA treatment and also positively or negatively correlated with that of MYBs and ASGs. At the same time, MYBs also positively or negatively correlated with ASGs in expression levels under ABA treatment. These findings indicate that ABFs, MYBs, and ASGs form a regulatory network to co-regulate ABA-induced anthocyanin biosynthesis.
Most studies showed that R2R3-MYB genes from subgroup 6 control anthocyanin biosynthesis [19,21]. In this study, the expression of MYBA1 and MYBA2 genes (subgroup 6) were upregulated under exogenous ABA treatment (Figure 5). In which, the MYBA2 gene expression was upregulated, was positively correlated with the expression of ASGs under UV-B radiation and played an important role in the UV-B-induced anthocyanin biosynthetic pathway [70]. MYBA1 has been reported as VcMYB437and the expression of VcMYB437 was higher in the skin of ripe blueberry fruit than in the pulp, implying the potential roles in anthocyanin biosynthesis [71]. VcMYBA (probably homologous to MYBA1) promoted anthocyanin accumulation by heterologous expression in Nicotiana benthaminana [21]. Our study found that MYBA1 expression was significantly correlated with that of 4CL7 and VcUFGT, At the same time, 4CL7 and VcUFGT contain multiple MYB binding sites in their promoter sequences (Figure 6 and Figure S3). However, the expression of VcMYBA2 was not significantly correlated with that of ASGs. Thus, MYBA1 is likely to play a core role in the network of ABA-induced anthocyanin biosynthesis; however, its authentic roles still need to be documented in future studies.

5. Conclusions

Exogenous ABA promotes anthocyanin accumulation in blueberry leaves and mainly affects gene expression from plant hormone signal transduction and phenylpropanoid and flavonoid biosynthetic pathways. Pearson’s correlation coefficient (r) analysis indicated that ASGs from the phenylpropanoid and flavonoid biosynthetic pathways, MYB transcription factor genes from R2R3-MYB subgroups 5, 6, and 7 and ABF genes from the ABA signal transduction pathway form an ABFs–MYB–ASGs regulatory network to co-regulate ABA-induced anthocyanin biosynthesis. The MYBA1 transcription factor is likely to play an important role in the ABA-induced anthocyanin biosynthesis pathway.

Supplementary Materials

The following supporting information can be downloaded at: https://www.mdpi.com/2311-7524/10/2/192/s1, Figure S1: Validation of transcript changes by RT-qPCR. (a) Expression of ABA signal transduction pathway genes under ABA treatment. (b) The figure is based on log2(2−ΔΔCt) data from RT-qPCR and log2(fold-change) data from RNA-seq. Pearson’s correlation coefficients (r) between log2(2−ΔΔCt) and log2(fold-change) are shown; Figure S2: Sequence alignment (a) and phylogenetic analysis (b) of MYBA1 (VaccDscaff1486-snap-gene-0.3), MYBA2 (VaccDscaff13-augustus-gene-105.26) and VcMYBA (MH105054) from blueberry (Vaccinium corymbosum); Figure S3: Schematic diagram of the predicted regulatory cis-elements involved in the abscisic acid responsiveness in the upstream sequences of screened MYB transcription and structure genes involved in anthocyanin biosynthesis in blueberry. The black line indicates the promoter length of genes. The blue and red boxes represent cis-acting elements involved in the abscisic acid responsiveness and MYB binding sites, respectively. ‘+’ Sense strand; ‘−’ Antisense strand; Table S1: Primers used in this study; Table S2: Statistics of functional annotation of differential expressed genes (DEGs); Table S3: The differential expressed genes (DEGs) from plant hormone signal transduction pathway under ABA stress; Table S4: Differentially expression R2R3-MYB transcription factors during ABA treatment; Table S5: The differential expressed genes (DEGs) from flavonoid biosynthetic pathway under ABA stress; Table S6: Pearson’s correlation coefficients (r) in the expression levels between MYB transcription factors and anthocyanin biosynthetic pathway gene or genes from ABA responsive element binding factor.

Author Contributions

Conceptualization, C.Z. and B.M.; methodology, Y.S.; software, B.M. and Y.S.; validation, Y.S., B.M. and X.F.; formal analysis, B.M. and X.F.; investigation, Q.G.; resources, X.Z.; data curation, L.Z.; writing—original draft preparation, B.M.; writing—review and editing, C.Z.; visualization, L.Z.; supervision, L.Z.; project administration, C.Z. and Q.G.; funding acquisition, C.Z. All authors have read and agreed to the published version of the manuscript.

Funding

This research was funded by the Natural Science Foundation of Jilin Province, China (Grant no. 20210101006JC).

Data Availability Statement

Data are contained within the article and Supplementary Materials. We have uploaded the RNA-Seq data generated in this study to BioProject in the NCBI repository with the accession number of PRJNA997066.

Conflicts of Interest

The authors declare no conflicts of interest.

Correction Statement

This article has been republished with a minor correction to the readability of Figure 1 caption. This change does not affect the scientific content of the article.

References

  1. Verma, V.; Ravindran, P.; Kumar, P.P. Plant hormone-mediated regulation of stress responses. BMC Plant Biol. 2016, 16, 86. [Google Scholar] [CrossRef]
  2. Loreti, E.; Povero, G.; Novi, G.; Solfanelli, C.; Alpi, A.; Perata, P. Gibberellins, jasmonate and abscisic acid modulate the sucrose-induced expression of anthocyanin biosynthetic genes in Arabidopsis. New Phytol. 2008, 179, 1004–1016. [Google Scholar] [CrossRef]
  3. Chen, K.; Li, G.; Bressan, R.A.; Song, C.; Zhu, J.; Zhao, Y. Abscisic acid dynamics, signaling, and functions in plants. J. Integr. Plant Biol. 2020, 62, 25–54. [Google Scholar] [CrossRef]
  4. Davière, J.; Achard, P. Gibberellin signaling in plants. Development 2013, 140, 1147–1151. [Google Scholar] [CrossRef] [PubMed]
  5. Umezawa, T.; Nakashima, K.; Miyakawa, T.; Kuromori, T.; Tanokura, M.; Shinozaki, K.; Yamaguchi-Shinozaki, K. Molecular basis of the core regulatory network in ABA responses: Sensing, signaling and transport. Plant Cell Physiol. 2010, 51, 1821–1839. [Google Scholar] [CrossRef] [PubMed]
  6. Kretzschmar, A.A.; Lerin, S.; Fagherazzi, A.; Mario, A.E.; Bastos, F.E.A.; Allebrandt, R.; Rufato, L. Application of abscisic acid increases the colour of “Rubi” grape berries in Southern Brazil. Acta Hortic. 2016, 1115, 231–236. [Google Scholar] [CrossRef]
  7. Oh, H.D.; Yu, D.J.; Chung, S.W.; Chea, S.; Lee, H.J. Abscisic acid stimulates anthocyanin accumulation in ‘Jersey’ highbush blueberry fruits during ripening. Food Chem. 2018, 244, 403–407. [Google Scholar] [CrossRef] [PubMed]
  8. Kumar, L.; Guy, H.; Hadas, S.; Reut, P.; Moshe, A.F. Anthocyanin accumulation is initiated by abscisic acid to enhance fruit color during fig (Ficus carica L.) ripening. J. Plant Physiol. 2020, 251, 153192. [Google Scholar] [CrossRef]
  9. Gonzalez-Guzman, M.; Pizzio, G.A.; Antoni, R.; Vera-Sirera, F.; Merilo, E.; Bassel, G.W.; Fernández, M.A.; Holdsworth, M.J.; Perez-Amador, M.A. Arabidopsis PYR/PYL/RCAR receptors play a major role in quantitative regulation of stomatal aperture and transcriptional response to abscisic Acid. Plant Cell. 2012, 24, 2483–2496. [Google Scholar] [CrossRef] [PubMed]
  10. Boursiac, Y.; Léran, S.; Corratgé-Faillie, C.; Gojon, A.; Krouk, G.; Lacombe, B. ABA transport and transporters. Trends Plant Sci. 2013, 18, 325–333. [Google Scholar] [CrossRef] [PubMed]
  11. Cutler, S.R.; Rodriguez, P.L.; Finkelstein, R.R.; Abrams, S.R. Abscisic acid: Emergence of a core signaling network. Annu. Rev. Plant Biol. 2010, 61, 651–679. [Google Scholar] [CrossRef] [PubMed]
  12. Fujita, Y.; Yoshida, T.; Yamaguchi-Shinozaki, K. Pivotal role of the AREB/ABF-SnRK2 pathway in ABRE-mediated transcription in response to osmotic stress in plants. Physiol. Plant. 2012, 147, 15–27. [Google Scholar] [CrossRef] [PubMed]
  13. Weiner, J.J.; Peterson, F.C.; Volkman, B.F.; Cutler, S.R. Structural and functional insights into core ABA signaling. Curr. Opin. Plant Biol. 2010, 13, 495–502. [Google Scholar] [CrossRef] [PubMed]
  14. Narusaka, Y.; Nakashima, K.; Shinwari, Z.K.; Sakuma, Y.; Furihata, T.; Abe, H.; Narusaka, M.; Shinozaki, K.; Yanmaguchi-Shinozaki, K. Interaction between two cis-acting elements, ABRE and DRE, in ABA-dependent expression of Arabidopsis rd29A gene in response to dehydration and high-salinity stresses. Plant J. 2003, 34, 137–148. [Google Scholar] [CrossRef] [PubMed]
  15. Fujita, Y.; Fujita, M.; Satoh, R.; Maruyama, K.; Parvez, M.M.; Seki, M.; Hiratsu, K.; Ohme-Takagi, M.; Shinozaki, K.; Yamaguchi-Shinozaki, K. AREB1 is a transcription activator of novel ABRE-dependent ABA signaling that enhances drought stress tolerance in Arabidopsis. Plant Cell. 2005, 17, 3470–3488. [Google Scholar] [CrossRef] [PubMed]
  16. Guo, X.; Shakeel, M.; Wang, D.; Qu, C.; Yang, S.; Ahmad, S.; Song, Z. Metabolome and transcriptome profiling unveil the mechanisms of light-induced anthocyanin synthesis in rabbiteye blueberry (Vaccinium ashei: Reade). BMC Plant Biol. 2022, 22, 223. [Google Scholar] [CrossRef] [PubMed]
  17. Kuhn, N.; Ponce, C.; Arellano, M.; Time, A.; Multari, S.; Martens, S.; Carrera, E.; Sagredo, B.; Donoso, J.M.; Meisel, L.A. ABA influences color initiation timing in P. avium L. fruits by sequentially modulating the transcript levels of ABA and anthocyanin-related genes. Tree Genet. Genomes 2021, 17, 20. [Google Scholar] [CrossRef]
  18. Gonzalez, A. Pigment loss in response to the environment: A new role for the WD/bHLH/MYB anthocyanin regulatory complex. New Phytol. 2009, 182, 1–3. [Google Scholar] [CrossRef]
  19. Gonzalez, A.; Zhao, M.; Leavitt, J.M.; Lloyd, A.M. Regulation of the anthocyanin biosynthetic pathway by the TTG1/bHLH/Myb transcriptional complex in Arabidopsis seedlings. Plant J. 2008, 53, 814–827. [Google Scholar] [CrossRef]
  20. An, X.H.; Tian, Y.; Chen, K.Q.; Wang, X.F.; Hao, Y.J. The apple WD40 protein MdTTG1 interacts with bHLH but not MYB protein to regulate anthocyanin accumulation. J. Plant Physiol. 2012, 7, 710–717. [Google Scholar] [CrossRef]
  21. Plunkett, B.J.; Espley, R.V.; Dare, A.P.; Warren, B.A.W.; Grierson, E.R.P.; Cordiner, S.; Turner, J.L.; Allan, A.C.; Albert, N.W.; Davies, K.M.; et al. MYBA from blueberry (Vaccinium Section Cyanococcus) is a subgroup 6 type R2R3MYB transcription factor that activates anthocyanin production. Front. Plant Sci. 2018, 9, 1300. [Google Scholar] [CrossRef] [PubMed]
  22. Cao, Y.; Li, K.; Li, Y.; Zhao, X.; Wang, L. MYB transcription factors as regulators of secondary metabolism in plants. Biology 2020, 9, 61. [Google Scholar] [CrossRef]
  23. Zhang, Y.; Wang, K.; Albert, N.W.; Elborough, C.; Espley, R.V.; Andre, C.M.; Fang, Z. Identification of a strong anthocyanin activator, VbMYBA, from berries of Vaccinium bracteatum Thunb. Front. Plant Sci. 2021, 12, 697212. [Google Scholar] [CrossRef] [PubMed]
  24. Kranz, H.D.; Denekamp, M.; Greco, R.; Jin, H.; Leyva, A.; Meissner, R.C.; Petroni, K.; Urzainqui, A.; Bevan, M.; Martin, C.; et al. Towards functional characterisation of the members of the R2R3-MYB gene family from Arabidopsis thaliana. Plant J. 1998, 16, 263–276. [Google Scholar] [CrossRef]
  25. Stracke, R.; Ishihara, H.; Huep, G.; Barsch, A.; Mehrtens, F.; Niehaus, K.; Weisshaar, B. Differential regulation of closely related R2R3-MYB transcription factors controls flavonol accumulation in different parts of the Arabidopsis thaliana seedling. Plant J. 2007, 50, 660–677. [Google Scholar] [CrossRef] [PubMed]
  26. Baudry, A.; Heim, M.A.; Dubreucq, B.; Caboche, M.; Weissharr, B.; Lepiniec, L. TT2, TT8, and TTG1 synergistically specify the expression of BANYULS and proanthocyanidin biosynthesis in Arabidopsis thaliana. Plant J. 2004, 39, 366–380. [Google Scholar] [CrossRef]
  27. Norberto, S.; Silva, S.; Meireles, M.; Faria, A.; Pintado, M.; Calhau, C. Blueberry anthocyanins in health promotion: A metabolic overview. J. Funct. Foods 2013, 5, 1518–1528. [Google Scholar] [CrossRef]
  28. Ribera, A.E.; Reyes-Díaz, M.; Alberdi, M.; Zuniga, G.E.; Mora, M.L. Antioxidant compounds in skin and pulp of fruits change among genotypes and maturity stages in highbush blueberry (Vaccinium corymbosum L.) grown in southern Chile. J. Soil Sci. Plant Nutr. 2010, 10, 509–536. [Google Scholar] [CrossRef]
  29. Tanaka, W.; Yokoyama, D.; Matsuura, Y.; Nozaki, M.; Hirozawa, N.; Kunitake, H.; Sakono, M.; Sakakibara, H. Subchronic toxicity evaluation of leaves from rabbiteye blueberry (Vaccinium virgatum Aiton) in rats. Toxicol. Rep. 2019, 6, 272–278. [Google Scholar] [CrossRef]
  30. Inoue, N.; Nagao, K.; Nomura, S.; Shirouchi, B.; Inafuku, M.; Hirabaru, H.; Nakahara, N.; Nishizono, S.; Tanaka, T.; Yanagita, T. Effect of Vaccinium ashei reade leaf extracts on lipid metabolism in obese OLETF rats. Biosci. Biotechnol. Biochem. 2011, 75, 2304–2308. [Google Scholar] [CrossRef]
  31. Yuji, K.; Sakaida, H.; Kai, T.; Fukuda, N.; Yukizaki, C.; Sakai, M.; Tsubouchi, H.; Kataoka, H. Effect of dietary blueberry (Vaccinium ashei Reade) leaves on serum and hepatic lipid levels in rats. J. Oleo Sci. 2013, 62, 89–96. [Google Scholar] [CrossRef] [PubMed]
  32. Cezarotto, V.S.; Franceschi, E.P.; Stein, A.C.; Emanuelli, T.; Maurer, L.H.; Sari, M.H.M.; Ferreira, L.M.; Cruz, L. Nanoencapsulation of Vaccinium ashei leaf extract in Eudragit® RS100-based nanoparticles increases its in vitro antioxidant and in vivo antidepressant-like actions. Pharmaceuticals 2023, 16, 84. [Google Scholar] [CrossRef] [PubMed]
  33. Venskutonis, P.R.; Barnackas, Š.; Kazernavičiūtė, R.; Maždžierienė, R.; Pukalskas, A.; Šipailienė, A.; Labokas, J.; Ložienė, K.; Abrutienė, G. Variations in antioxidant capacity and phenolics in leaf extracts isolated by different polarity solvents from seven blueberry (Vaccinium L.) genotypes at three phenological stages. Acta Physiol. Plant. 2016, 38, 33. [Google Scholar] [CrossRef]
  34. Li, Y.C.; Li, B.X.; Geng, L.J. Hypolipidemic and antioxidant effects of total flavonoids from blueberry leaves. Eur. Food Res. Technol. 2011, 233, 897–903. [Google Scholar] [CrossRef]
  35. Choi, H.; Hong, J.; Ha, J.; Kang, J.; Kim, S.Y. ABFs, a family of ABA-responseive element binding factors. J. Biol. Chem. 2000, 275, 1723–1730. [Google Scholar] [CrossRef] [PubMed]
  36. Ji, L.; Wang, J.; Ye, M.; Li, Y.; Guo, B.; Chen, Z.; Li, H.; An, X. Identification and characterization of the Populus AREB/ABF subfamily. J. Integr. Plant Biol. 2013, 55, 177–186. [Google Scholar] [CrossRef]
  37. Mao, X.; Cai, T.; Olyarchuk, J.G.; Wei, L. Automated genome annotation and pathway identification using the KEGG Orthology (KO) as a controlled vocabulary. Bioinformatics 2005, 21, 3787–3793. [Google Scholar] [CrossRef]
  38. Chen, C.; Chen, H.; Zhang, Y.; Thomas, H.R.; Frank, M.H.; He, Y.; Xia, R. TBtools: An integrative toolkit developed for interactive analyses of big biological data. Mol. Plant 2020, 13, 1194–1202. [Google Scholar] [CrossRef]
  39. Yang, B.; Song, Y.; Li, Y.; Wang, X.; Guo, Q.; Zhou, L.; Zhang, Y.; Zhang, C. Key genes for phenylpropanoid metabolite biosynthesis during half-highbush blueberry (Vaccinium angustifolium × Vaccinium corymbosum) fruit development. J. Berry Res. 2022, 12, 297–311. [Google Scholar] [CrossRef]
  40. Rabino, I.; Mancinelli, A.L. Light, temperature, and anthocyanin production. Plant Physiol. 1986, 81, 922–924. [Google Scholar] [CrossRef]
  41. Dubos, C.; Stracke, R.; Grotewold, E.; Weisshaar, B.; Martin, C.; Lepiniec, L. MYB transcription factors in Arabidopsis. Trends Plant Sci. 2010, 15, 573–581. [Google Scholar] [CrossRef]
  42. Häkkinen, S.H.; Törrönen, A.R. Content of flavonols and selected phenolic acids in strawberries and Vaccinium species: Influence of cultivar, cultivation site and technique. Food Res. Int. 2000, 33, 517–524. [Google Scholar] [CrossRef]
  43. Karppinen, K.; Tegelberg, P.; Haggman, H.; Jaakola, L. Abscisic acid regulates anthocyanin biosynthesis and gene expression associated with cell wall modification in ripening bilberry (Vaccinium myrtillus L.) fruits. Front. Plant Sci. 2018, 9, 1259. [Google Scholar] [CrossRef]
  44. Chung, S.W.; Yu, D.J.; Oh, H.D.; Ahn, J.H.; Huh, J.H.; Lee, H.J. Transcriptional regulation of abscisic acid biosynthesis and signal transduction, and anthocyanin biosynthesis in ‘Bluecrop’ highbush blueberry fruit during ripening. PLoS ONE 2019, 14, e0220015. [Google Scholar] [CrossRef]
  45. Fan, W.; Zhao, M.; Li, S.; Bai, X.; Li, J.; Meng, H.; Mu, Z. Contrasting transcriptional responses of PYR1/RCAR ABA receptors to ABA or dehydration stress between maize seedling leaves and roots. BMC Plant Biol. 2016, 16, 99. [Google Scholar] [CrossRef]
  46. Chen, J.; Mao, L.; Lu, W.; Ying, T.; Luo, Z. Transcriptome profiling of postharvest strawberry fruit in response to exogenous auxin and abscisic acid. Planta 2016, 243, 183–197. [Google Scholar] [CrossRef]
  47. Liao, X.; Li, M.; Liu, B.; Yan, M.; Yu, X.; Zi, H.; Liu, R.; Yamamuro, C. Interlinked regulatory loops of ABA catabolism and biosynthesis coordinate fruit growth and ripening in woodland strawberry. Proc. Natl. Acad. Sci. USA 2018, 115, E11542–E11550. [Google Scholar] [CrossRef]
  48. Hong, L.; Su, W.; Zhang, Y.; Ye, C.; Shen, Y.; Li, Q.Q. Transcriptome profiling during mangrove viviparity in response to abscisic acid. Sci. Rep. 2018, 8, 770. [Google Scholar] [CrossRef]
  49. Nolan, T.M.; Vukašinović, N.; Liu, D.; Russinova, E.; Yin, Y.H. Brassinosteroids: Multidimensional regulators of plant growth, development, and stress responses. Plant Cell. 2020, 32, 295–318. [Google Scholar] [CrossRef]
  50. Planas-Riverola, A.; Gupta, A.; Betegón-Putze, I.; Bosch, N.; Ibañes, M.; Caño-Delgado, A.I. Brassinosteroid signaling in plant development and adaptation to stress. Development 2019, 146, dev151894. [Google Scholar] [CrossRef]
  51. Vergara, A.; Torrealba, M.; Alcalde, J.A.; Pérez-Donoso, A.G. Commercial brassinosteroid increases the concentration of anthocyanin in red tablegrape cultivars (Vitis vinifera L.). Aust. J. Grape Wine R. 2020, 26, 427–433. [Google Scholar] [CrossRef]
  52. Yuan, L.B.; Peng, Z.H.; Zhi, T.T.; Zho, Z.; Liu, Y.; Zhu, Q.; Xiong, X.Y.; Ren, C.M. Brassinosteroid enhances cytokinin-induced anthocyanin biosynthesis in Arabidopsis seedlings. Biol. Plant. 2015, 59, 99–105. [Google Scholar] [CrossRef]
  53. Wang, Y.; Mao, Z.; Jiang, H.; Zhang, Z.; Wang, N.; Chen, X. Brassinolide inhibits flavonoid biosynthesis and red-flesh coloration via the MdBEH2.2-MdMYB60 complex in apple. J. Exp. Bot. 2021, 72, 6382–6399. [Google Scholar] [CrossRef]
  54. Wang, Y.; Zhu, Y.; Jiang, H.; Mao, Z.; Zhang, J.; Fang, H.; Liu, W.; Zhang, Z.; Chen, X.; Wang, N. The regulatory module MdBZR1-MdCOL6 mediates brassinosteroid- and light-regulated anthocyanin synthesis in apple. New Phytol. 2023, 238, 1516–1533. [Google Scholar] [CrossRef] [PubMed]
  55. Nam, K.H.; Li, J. BRI1/BAK1, a receptor kinase pair mediating brassinosteroid signaling. Cell 2002, 110, 203–212. [Google Scholar] [CrossRef] [PubMed]
  56. Rahman, A.; Amakawa, T.; Goto, N.; Tsurumi, S. Auxin is a positive regulator for ethylene-mediated response in the growth of Arabidopsis roots. Plant Cell Physiol. 2001, 42, 301–307. [Google Scholar] [CrossRef]
  57. Cecchetti, V.; Altamura, M.M.; Falasca, G.; Costantino, P.; Cardarelli, M. Auxin regulates Arabidopsis anther dehiscence, pollen maturation, and filament elongation. Plant Cell. 2008, 20, 1760–1774. [Google Scholar] [CrossRef]
  58. Clayton-Cuch, D.; Yu, L.; Shirley, N.; Bradley, D.; Bulone, V.; Bőttcher, C. Auxin treatment enhances anthocyanin production in the non-climacteric sweet cherry (Prunus avium L.). Int. J. Mol. Sci. 2021, 22, 10760. [Google Scholar] [CrossRef] [PubMed]
  59. Ji, X.; Zhang, R.; Wang, N.; Yang, L.; Chen, X. Transcriptome profiling reveals auxin suppressed anthocyanin biosynthesis in red-fleshed apple callus (Malus sieversii f. niedzwetzkyana). Plant Cell Tiss. Organ Cult. 2015, 123, 389–404. [Google Scholar] [CrossRef]
  60. Ji, X.; Wang, Y.; Zhang, R.; Wu, S.; An, M.; Li, M.; Wang, C.; Chen, X.; Zhang, Y.; Chen, X. Effect of auxin, cytokinin and nitrogen on anthocyanin biosynthesis in callus cultures of red-flfleshed apple (Malus sieversii f. niedzwetzkyana). Plant Cell Tiss. Organ Cult. 2015, 120, 325–337. [Google Scholar] [CrossRef]
  61. Wang, Y.; Wang, N.; Xu, H.; Jiang, S.; Fang, H.; Su, M.; Zhang, Z.; Chen, X. Auxin regulates anthocyanin biosynthesis through the Aux/IAA-ARF signaling pathway in apple. Hortic. Res. 2018, 5, 59. [Google Scholar] [CrossRef] [PubMed]
  62. Reed, J.W. Roles and activities of Aux/IAA proteins in Arabidopsis. Trends Plant Sci. 2001, 6, 420–425. [Google Scholar] [CrossRef] [PubMed]
  63. Aya, K.; Ueguchi-Tanaka, M.; Kondo, M.; Hamada, K.; Yano, K.; Nishimura, M.; Matsuoka, M. Gibberellin modulates anther development in Rice via the transcriptional regulation of GAMYB. Plant Cell 2009, 21, 1453–1472. [Google Scholar] [CrossRef] [PubMed]
  64. Zhang, Y.; Liu, Z.; Liu, J.; Lin, S.; Wang, J.; Lin, W.; Xu, W. GA-DELLA pathway is involved in regulation of nitrogen deficiency-induced anthocyanin accumulation. Plant Cell Rep. 2017, 36, 557–569. [Google Scholar] [CrossRef]
  65. Weiss, D.; Ori, N. Mechanisms of cross talk between gibberellin and other hormones. Plant Physiol. 2007, 144, 1240–1246. [Google Scholar] [CrossRef]
  66. Wang, L.; Yang, S.; Ni, J.; Teng, Y.; Bai, S. Advances of anthocyanin synthesis regulated by plant growth regulators in fruit trees. Sci. Hortic. 2023, 307, 111476. [Google Scholar] [CrossRef]
  67. Yoshida, T.; Fujita, Y.; Sayama, H.; Kidokoro, S.; Maruyama, K.; Mizoi, J.; Shinozaki, K.; Yamaguchi-Shinozaki, K. AREB1, AREB2, and ABF3 are master transcription factors that cooperatively regulate ABRE-dependent ABA signaling involved in drought stress tolerance and require ABA for full activation. Plant J. 2010, 61, 672–685. [Google Scholar] [CrossRef]
  68. Karppinen, K.; Lafferty, D.J.; Albert, N.W.; Mikkola, N.; McGhie, T.; Allan, A.C.; Afzal, B.M.; Häggman, H.; Espley, R.V.; Jaakola, L. MYBA and MYBPA transcription factors co-regulate anthocyanin biosynthesis in blue-coloured berries. New Phytol. 2021, 232, 1350–1367. [Google Scholar] [CrossRef]
  69. Zhang, P.; Wang, R.; Ju, Q.; Li, W.; Tran, L.P.; Xu, J. The R2R3-MYB transcription factor MYB49 regulates cadmium accumulation. Plant Physiol. 2019, 180, 529–542. [Google Scholar] [CrossRef]
  70. Song, Y.; Ma, B.; Guo, Q.; Zhou, L.; Zhou, X.; Ming, Z.; You, H.; Zhang, C. MYB pathways that regulate UV-B-induced anthocyanin biosynthesis in blueberry (Vaccinium corymbosum). Front. Plant Sci. 2023, 14, 1125382. [Google Scholar] [CrossRef]
  71. Wang, H.; Zhai, L.; Wang, S.; Zheng, B.; Hu, H.; Li, X.; Bian, S. Identification of R2R3-MYB family in blueberry and its potential involvement of anthocyanin biosynthesis in fruits. BMC Genom. 2023, 24, 505. [Google Scholar] [CrossRef] [PubMed]
Figure 1. ABA induces anthocyanin accumulation in in vitro-grown blueberry seedlings. Representative phenotypes (a) and anthocyanin contents (b) of in vitro-grown blueberry seedlings under 100 µM ABA treatment and without ABA treatment for 0 h, 6 h and 12 h. The top and bottom plants showed 100 µM ABA treatment and without ABA treatment, respectively. Values are means ± standard error (SE) of three independent biological replicates; different letters represent significant differences at p < 0.05 among samples by one-way ANOVA and Tukey’s test. Bar, 1 cm.
Horticulturae 10 00192 g001
Figure 2. Differentially expressed genes in response to ABA treatment in blueberry, as revealed by transcriptome deep sequencing (RNA-seq). Volcano plots showing all the genes at 6 h (a) or 12 h (b) compared to 0 h under ABA treatment. Each point represents a single gene. The red and green dots indicate upregulated and downregulated differentially expressed genes (DEGs), respectively, and the black dots indicate genes with unchanged expression. (c) Venn diagram showing the number of DEGs across pairwise comparisons. Pink, DEGs for 0 h vs. 6 h; light blue, DEGs for 0 h vs. 12 h; purple, DEGs for 0 h vs. 6 h and 0 h vs. 12h.
Horticulturae 10 00192 g002
Figure 3. KEGG pathway enrichment analysis and functional classification of differentially expressed genes in blueberry under ABA treatment. Analysis of the top 20 significantly enriched DEGs after 6 h (a), 12 h (b), or 6 and 12 h (c) of ABA treatment compared to 0 h. The number of DEGs is indicated by the size of the circle. The solid upright and inverted triangles represent upregulated and downregulated DEGs, respectively. KEGG functional classification of DEGs after 6 h (d), 12 h (e), or 6 and 12 h (f) of ABA treatment compared to 0 h.
Horticulturae 10 00192 g003aHorticulturae 10 00192 g003b
Figure 4. Differentially expressed genes of plant hormone signal transduction KEGG pathways in blueberry under ABA treatment. Green indicates low expression, and red indicates high expression, based on log2 (FPKM) values.
Horticulturae 10 00192 g004
Figure 5. Phylogenetic analysis of R2R3-MYB proteins from blueberry and Arabidopsis using MEGA X with the neighbor-joining method. Purple and green dots represent upregulated and downregulated differentially expressed R2R3-MYB transcription factor genes from blueberry under ABA treatment, respectively. Black circles represent R2R3-MYB transcription factors from Arabidopsis. S1, S2, S3, S5, S6, S7, S9, S11, S12, S14, S20, and S22 represent subgroups of blueberry R2R3-MYB transcription factors referring to the subgroups of Arabidopsis R2R3-MYB proteins [24].
Horticulturae 10 00192 g005
Figure 6. Proposed model of the ABF-regulated anthocyanin biosynthetic pathway under ABA treatment. Green squares indicate low expression and red squares indicate high expression, based on log2 (FPKM). Solid lines indicate the known biosynthetic pathway; dotted lines indicate the putative signaling pathway based on co-expression analysis. Arrows indicate positive correlation; short lines indicate negative correlation. Red and green text indicates upregulated and downregulated DEGs, respectively.
Horticulturae 10 00192 g006
Table 1. Summary of sequencing data.
SampleClean ReadsClean BasesGC Content≥Q30Mapped Reads
0 h rep. 11.93 × 1075.78 × 10945.9%92.6%91.2%
0 h rep. 22.14 × 1076.42 × 10945.7%92.3%91.05%
0 h rep. 32.22 × 1076.65 × 10945.7%92.1%90.6%
6 h rep. 12.15 × 1076.42 × 10945.75%92.8%91.1%
6 h rep. 21.97 × 1075.84 × 10945.7%91.0%90.3%
6 h rep. 32.18 × 1076.53 × 10945.7%91.4%90.3%
12 h rep. 12.09 × 1076.27 × 10946.55%92.1%90.9%
12 h rep. 21.94 × 1075.80 × 10946.2%90.45%89.9%
12 h rep. 32.13 × 1076.37 × 10945.8%91.4%90.9%
Disclaimer/Publisher’s Note: The statements, opinions and data contained in all publications are solely those of the individual author(s) and contributor(s) and not of MDPI and/or the editor(s). MDPI and/or the editor(s) disclaim responsibility for any injury to people or property resulting from any ideas, methods, instructions or products referred to in the content.

