Article

Smartphone-Based Leaf Colorimetric Analysis of Grapevine (Vitis vinifera L.) Genotypes

by
Péter Bodor-Pesti
1,
Dóra Taranyi
1,
Gábor Vértes
1,
István Fazekas
1,
Diána Ágnes Nyitrainé Sárdy
2,
Tamás Deák
1,
Zsuzsanna Varga
1,* and
László Baranyai
3
1
Department of Viticulture, Institute for Viticulture and Oenology, Buda Campus, Hungarian University of Agriculture and Life Sciences, Villányi St. 29-43., H-1118 Budapest, Hungary
2
Department of Oenology, Institute for Viticulture and Oenology, Buda Campus, Hungarian University of Agriculture and Life Sciences, Ménesi St. 45., H-1118 Budapest, Hungary
3
Institute of Food Science and Technology, Hungarian University of Agriculture and Life Sciences, Somlói Street 14–16., Villányi St., H-1118 Budapest, Hungary
*
Author to whom correspondence should be addressed.
Horticulturae 2024, 10(11), 1179; https://doi.org/10.3390/horticulturae10111179
Submission received: 26 September 2024 / Revised: 25 October 2024 / Accepted: 28 October 2024 / Published: 7 November 2024
(This article belongs to the Section Viticulture)

Abstract

:
Leaf chlorophyll content is a key indicator of plant physiological status in viticulture; therefore, regular evaluation to obtain data for nutrient supply and canopy management is of vital importance. The measurement of pigmentation is most frequently carried out with hand-held instruments, destructive off-site spectrophotometry, or remote sensing. Moreover, smartphone-based applications also ensure a promising way to collect colorimetric information that could correlate with pigmentation. In this study, four grapevine genotypes were investigated using smartphone-based RGB (Red, Green, Blue) and CIE-L*a*b* colorimetry and a portable chlorophyll meter. The objective of this study was to evaluate the correlation between leaf chlorophyll concentration and RGB- or CIE-L*a*b*-based color indices. A further aim was to find an appropriate model for discriminating between the genotypes by leaf coloration. For these purposes, fully developed leaves of ‘Chardonnay’, ‘Sauvignon blanc’, and ‘Pinot noir’ clones 666 and 777 were investigated with the Color Grab smartphone application to obtain RGB and CIE-L*a*b* values. Using these color values, chroma, hue, and a further 31 color indices were calculated. Chlorophyll concentrations were determined using an Apogee MC100 device, and the values were correlated with color values and color indices. The results showed that the chlorophyll concentration and color indices significantly differed between the genotypes. According to the results, certain color indices show a different direction in their relationship with leaf pigmentation for different grapevine genotypes. The same index showed a positive correlation for the leaf chlorophyll concentration for one variety and a negative correlation for another, which raises the possibility that the relationship is genotype-specific and not uniform within species. In light of this result, further study of the species specificity of the commonly used vegetation indices is warranted. Support Vector Machine (SVM) analysis of the samples based on color properties showed a 71.63% classification accuracy, proving that coloration is an important ampelographic feature for the identification and assessment of true-to-typeness.

Graphical Abstract

1. Introduction

The optical properties of grapevine (Vitis vinifera L.) organs have great importance in both the visual inspection and remote sensing of vineyards, where coloration is a particular focus [1,2]. The type and concentration of pigments vary between organs, influenced by genotype and rootstock, as well as by phenological stage, environmental conditions, vineyard cultivation practices, and the phytosanitary status of the plants [3,4,5,6]. One of the main pigments is chlorophyll, playing an important role in photosynthesis in both leaves and berries, although the latter contain chlorophyll only up to veraison, while other dyes, for example, flavonoids and anthocyanins, are predominant afterwards [7]. During annual cultivation practices, the leaf chlorophyll concentration is a key indicator of nutrient deficiencies, the presence of pests and diseases, and drought stress [8,9]. Since the spectral properties of this pigment are already well known, the regular evaluation of canopy pigmentation is a widely applied practice in viticulture, which is most frequently measured by destructive spectrophotometry, hand-held instruments, or remote sensing [10,11].
Smartphone applications are becoming increasingly important in precision horticulture. Apps provide solutions for managing production based on the real-time data of plant characteristics, evaluation of the environment, and scheduling and monitoring tasks [12]. In addition to the main advantages of smartphones, such as easy usage, portability, their numerous functions, computing power, and built-in sensors, Kwon and Park [13] highlight the functionality of the camera, as it has a high resolution, manual or auto-exposure control, and autofocus. The authors review numerous scientific results based on smartphone camera systems, including those for E. coli detection, meat quality evaluation, measurement of water chlorine concentration, and the quantification of corn leaf chlorophyll concentration in SPAD units. Lima et al. [14] showed that smartphone-based digital images are appropriate for photometric measurements of liquid-liquid extractions, too.
Vegetation indices (VIs) are dimensionless values composed of a set of simple mathematical operations (addition, subtraction, multiplication, division) applied to different radiation bands. The most widespread VI is the Normalized Difference Vegetation Index (NDVI), which is calculated from the near-infrared and red bands [15]. Although the NDVI shows a high correlation with vegetative performance, for imaging, a multispectral camera is required to calculate these indices. Therefore, several studies have been designed to find RGB-based (RGB refers to Red, Green, and Blue) indices that could provide information about the physiological status of plants. Databases list large numbers of spectral indices for different purposes or application domains such as vegetation, water, burn, snow, urban, soil, etc. [16]. Henrich et al. [17], for example, list numerous vegetation indices where only the visible bands (Red, Green, and Blue) are required, such as in the case of the Normalized Green–Red Difference Index (NGRD), which is calculated by Green−Red/Green + Red. Recently, several authors have reported that many RGB-based vegetation indices correlate with the leaf chlorophyll content [18,19,20].
Our last study also showed that leaf coloration and RGB-based vegetation indices of the grapevine (Vitis vinifera L.) cultivar ‘Hárslevelű’ have a high level of correlation with chlorophyll concentration [10]. Based on a literature review on the subject, it was found that the correlation of vegetation indices with leaf chlorophyll concentration changed direction, and certain VIs were positively correlated in one species and negatively in another, meaning that this correlation was possibly species- or even genotype-specific. Although the present study deals with the viticultural aspect of the problem, it is conceivable that a similar phenomenon would be encountered with other crops, so the question is of a general nature.
Therefore, the objective of the present study was to compare the chlorophyll concentration, leaf RGB (Red, Green, Blue), and CIE-L*a*b* (where CIE refers to Commission internationale de l’éclairage—International Commission on Illumination, L refers to lightness, a* refers to Green-Red transition, and b* refers to Blue-Yellow transition) as well as chroma and hue values in different grapevine genotypes. Here, chroma is defined by CIE as “the colorfulness of an area judged as a proportion of the brightness of a similarly illuminated area that appears white or highly transmitting”, and hue is defined as the “attribute of a visual perception according to which an area appears to be similar to one of the colors: red, yellow, green, and blue, or to a combination of adjacent pairs of these colors considered in a closed ring” (cit. in [21]). In addition to these, 31 RGB-based vegetation index values of four grapevine genotypes were assessed to find correlations between the color properties and pigmentation.
In addition to the assessment of pigmentation, RGB-based remote and proximal sensing could be a powerful tool to identify plant species [22] or even cultivars [23]. According to this, our second aim was to use the available color information and find those characteristics that have discriminating power to classify the genotypes.

2. Materials and Methods

2.1. Plant Material

Fully developed leaf samples without any visible deficiency or infection symptoms were collected in August 2023 from four grapevine (Vitis vinifera L.) genotypes ‘Chardonnay’, ‘Sauvignon blanc’, and ‘Pinot noir’ clones 666 and 777. The plantation is located in the Etyek wine region (Etyek, Hungary). ‘Chardonnay’ plants were trained on a single cordon, while ‘Sauvignon blanc’ and the two ‘Pinot noir’ clones were trained on a double umbrella in a 3.0 m row and 0.9 m plant distance. The age of the plants, environmental conditions (e.g., elevation, slope angle, pedology, climatic parameters), vineyard structure such as row orientation and maintenance practices (e.g., nutrient supply, plant protection) were uniform. Samples were collected from the middle third and from both sides of the canopy from at least 30 plants. Leaf discs of equal size (r = 10 mm; A = 314.2 mm2) were cut from the lamina after the sampling.

2.2. Color Evaluation and RGB-Based Vegetation Indices

The color properties of a total of 100 leaf discs from at least 50 leaves of each genotype were evaluated with a Xiaomi Redmi Note 9 (Xiaomi, Beijing, China) smartphone (48 MP main camera: 1/2″ sensor size, 1.6 μm 4-in-1 Super Pixel, 0.8 μm pixel size, f/1.79, AF,6P lens, FOV 79.4°; 8 MP ultra-wide-angle camera: FOV 118°, f/2.2, 1/4″ sensor size, 1.2 μm pixel size, 5P lens, 2 MP macro-camera: AF (2 cm–10 cm), 1.75 μm pixel size, f/2.4 aperture, 2 MP depth camera: 1/5″ sensor size, 1.7 μm pixel size, 3P lens, f/2.4 FF) [24]. The phone was held on a smartphone stand in the same position for the experiment. The colorimetric data of all discs were obtained with the Color Grab (Loomatix) application from the full area of the 314.2 mm2 leaf discs. Illumination of the samples was standardized with two Nan-lite Compac 20 led light panels (ta = 45 °C/113 °F. Color Temperature: 5600 K, Guangdong NanGuang Photo & Video Systems Co., Ltd., Shantou, China). The white balance reference for each disc was provided for the internal standardization of the Color Grab application. RGB and CIE-L*a*b* values were recorded; then, CIE-L*a*b* values were used to calculate chroma ( C = a * 2 + b * 2 ) and hue (hue = 180 + arctan(b*/a*). Based on the RGB values, a further 31 color and vegetation indices (from r to I2 in Table 1) were also assessed according to Pék et al. [25] and Sánchez-Sastre et al. [18].

2.3. Chlorophyll Measurement

The chlorophyll concentration of each disc was measured with an Apogee MC100 (S/N:1999, Apogee Instruments Inc., North Logan, UT, USA) [26] portable chlorophyll meter using the internal setting developed for grapevine according to the manufacturers’ protocol. The instrument is calibrated to define the µmol of chlorophyll per m2 units. The measurement area is 63.9 mm2, and the accuracy is ±10 µmol × m−2 chlorophyll concentration using a generic equation. Measurements were carried out in 3 replications on each leaf disc, and the mean value of the 3 measurements was considered as representative of the sample.

2.4. Data Analysis

Statistical evaluation was carried out in the PAST [27] and R (version 4.3.2, R Foundation for Statistical Computing, Vienna, Austria). The chlorophyll concentration, hue, and chroma values were tested for normality; then, outliers (not more than 3 out of the 100 per each genotype) were removed. Differences in the pigmentation and colorimetric properties among the genotypes were evaluated by one-way ANOVA, while the correlation between the chlorophyll concentration and RGB-based vegetation indices was investigated by Pearson’s correlation. Pearson’s correlation coefficients between the leaf chlorophyll content and the color indices were visualized with Circos [28]. Support Vector Machine analysis was carried out to find the most suitable colorimetric characteristics to classify the genotypes. Parameter groups were tested individually, and all parameters were tested together on randomly selected 80% training and 20% validation data. Tenfold cross-validation was conducted, and its result was used to compare the effectiveness of the models. Kernel functions of linear, polynomial (third order), radial, and sigmoid were evaluated with a default weight factor (g). Groups for SVM were defined following the list in Table 1: the CIE-L*a*b* set consisted of Nr. 1–5, the RGB set Nr. 6–20, the derived RGB parameter set Nr. 21–30, the optimized PCA scores Nr. 31–32, and the heterogeneous set Nr. 33–39.

3. Results

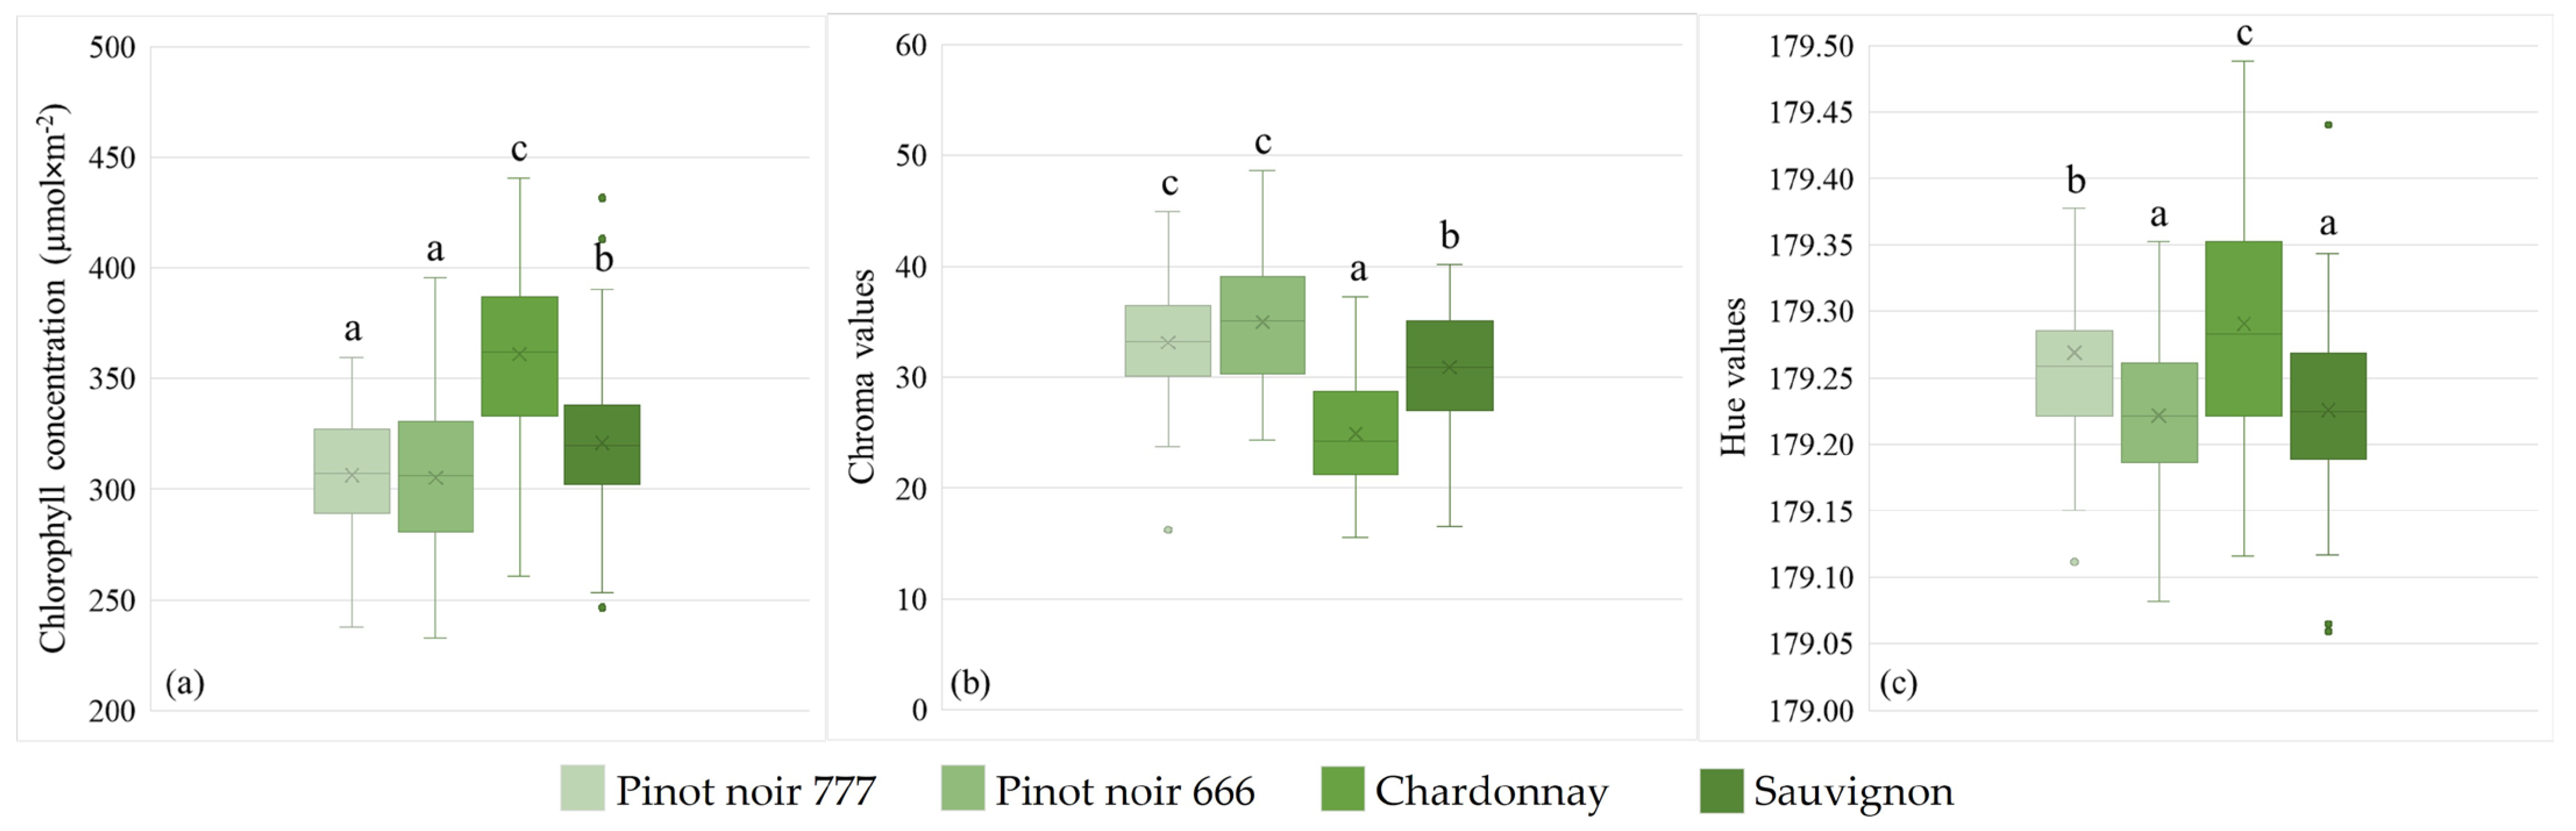
3.1. Chlorophyll Concentration

The chlorophyll concentrations of leaf samples in this study varied between 232.8 and 440.6 µmol × m−2 for ‘Pinot noir’ 666 and ‘Chardonnay’. Results showed that the chlorophyll concentration significantly differed (p < 0.05) among the genotypes. Leaves of the grapevine cultivar ‘Chardonnay’ had significantly higher chlorophyll concentration (360.91 µmol × m−2) than those of the ‘Sauvignon blanc’ (321.04 µmol × m−2) and ‘Pinot noir’ clones 666 (305.13 µmol × m−2) and 777 (306.39 µmol × m−2). Moreover, ‘Sauvignon blanc’ also had significantly higher pigmentation than the ‘Pinot noir’ clones (Figure 1a). The coefficient of variability of the chlorophyll concentration ranged from 9.14% (‘Pinot noir’ 777) to 11.34% (‘Pinot noir’ 666).

3.2. Color Values

The chroma values showed significant (p < 0.05) differences among the genotypes. The mean value of the ‘Chardonnay’ (25.16) was significantly lower than that of the ‘Pinot noir’ clones 666 and 777 (35.2 and 33.5, respectively), and those were higher than the ‘Sauvignon blanc’ (31.11) (Figure 1c). The hue values of genotypes also showed a significant (p < 0.05) difference. The lowest values belonged to ‘Pinot noir’ 666 and ‘Sauvignon blanc’ (179.2215 and 179.2257, respectively), while ‘Chardonnay’ had the highest value (179.2908) (Figure 1c). Concerning the hue, the lower the value, the greener it was, while the higher the value, the bluer color it was on the color wheel. In our study, ‘Pinot noir’ 666 and ‘Sauvignon blanc’ were greener, while ‘Chardonnay’ had a blueish leaf color.

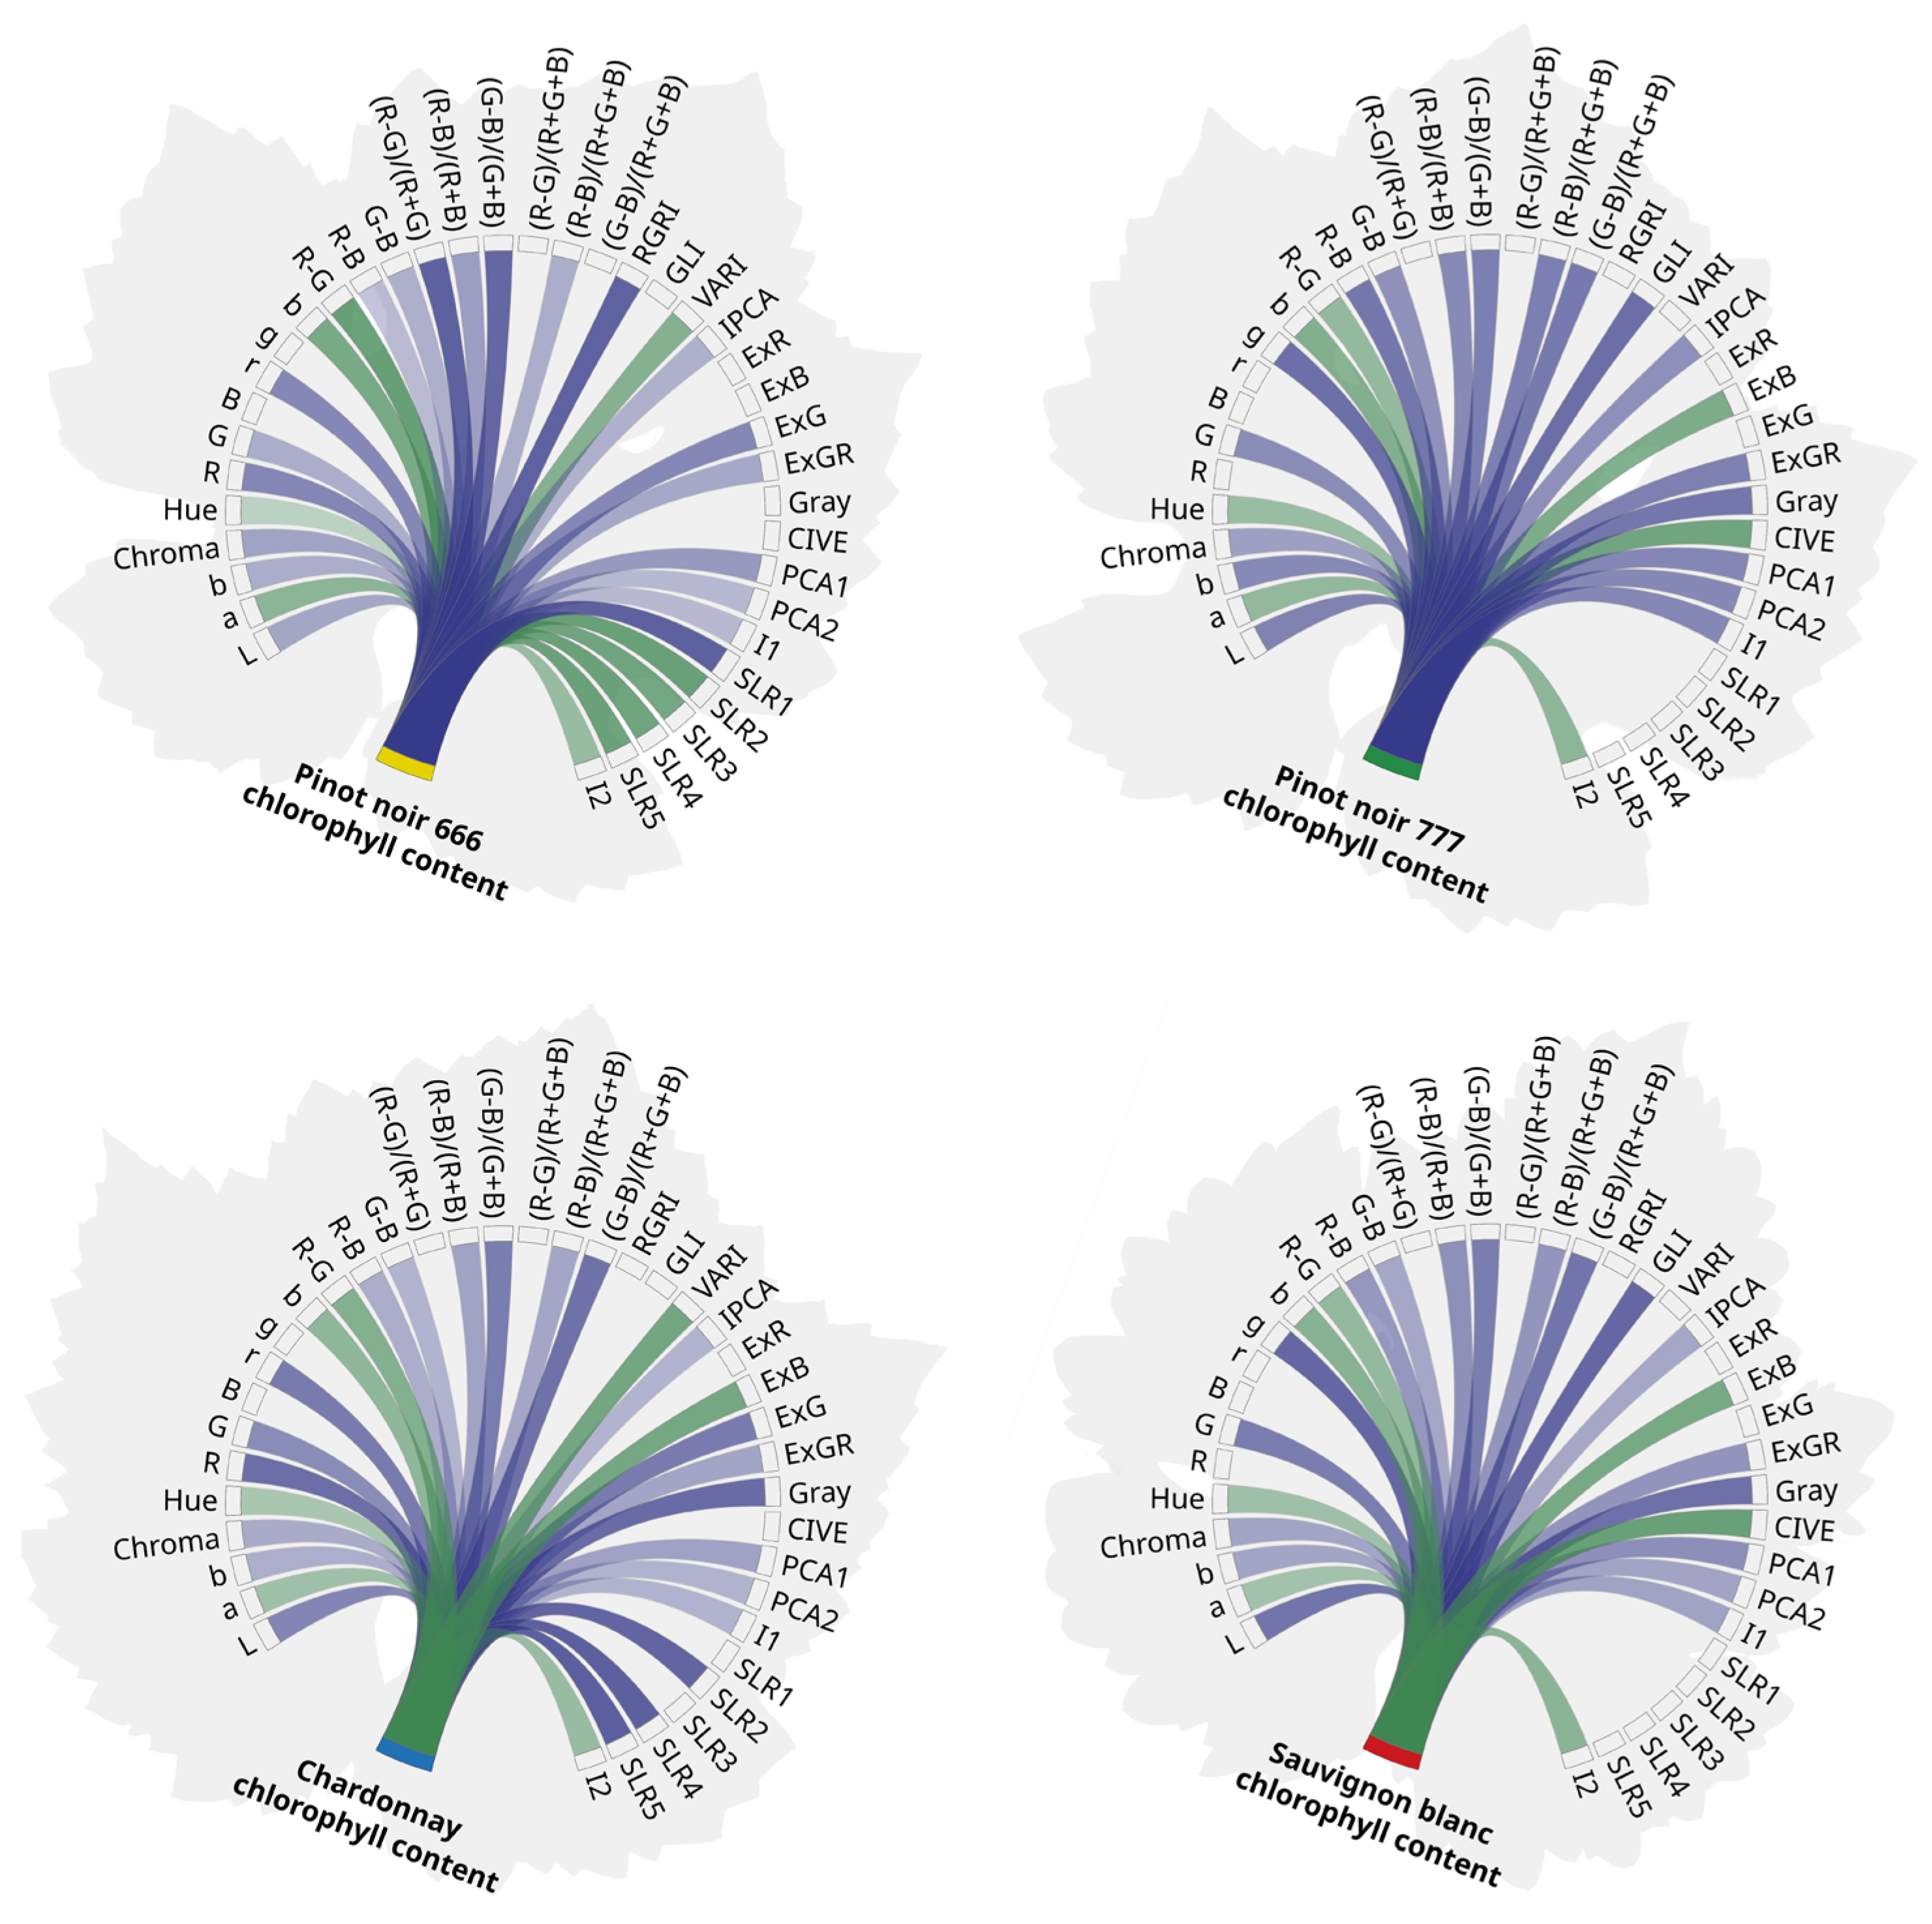
3.3. Correlation of Vegetation Indices with Chlorophyll Concentration

In the first run of the calculation, genotype was not taken into consideration, and correlation was investigated on the pooled samples. In this case, the highest Pearson’s correlation between the chlorophyll concentration and color properties was obtained with the CIE-a* (corr. coeff.: 0.67, p < 0.01), while the highest negative correlation was in the case of chroma, R-B and G-B (corr. coeff.: −0.71, p < 0.01). In some vegetation indices, we found that correlations did not point in the same direction. For instance, (R − G)/(R + G + B), RGRI and SLR1 showed positive correlations for the pooled samples, and in the cases of ‘Sauvignon blanc’ and ‘Pinot noir’ 777, while the correlation was negative in the cases of ‘Chardonnay’ and ‘Pinot noir 666’ (Table 1, Figure 2).

3.4. Classification of Grapevine Genotypes Based on Their Leaf Color Properties

Support Vector Machine (SVM) analysis was performed to classify the selected genotypes based on their color features. The training and validation results are reported in Table 2. Among the parameter groups, CIE-L*a*b* and RGB feature sets achieved the highest accuracy in training, which were close to each other and the result of all the parameters together. The highest training score of all parameters showed that these features were not simply redundant but could complete each other and had a synergistic effect. The correct classification results of validation were slightly below those of training with few percentages.
The linear kernel showed the best classification power for parameter groups CIE-L*a*b*, RGB, and derived RGB. The radial kernel obtained the highest score for optimized PCA and miscellaneous features. The low accuracy of PCA parameters is probably due to the few members (2), while other groups had more members.

4. Discussion

From an agricultural point of view, one of the most important features of smartphones is the camera, which has achieved a high level of resolution and optical properties, while other sensors, such as accelerometers, gyroscopes, proximity sensors, or GPS are nowadays also being integrated. Pongnumkul et al. [29] reviewed the most important smartphone-based solutions, and within the farming applications, the authors classified them as disease detection and diagnosis, fertilizer calculator, soil study, water study, crop water demand estimation, and crop production analysis. In addition to the above-mentioned purposes, many applications are dedicated to a narrower field of research in precision horticulture based on the advanced camera specifications and colorimetric evaluation technologies. For instance, De Bei et al. [30] developed the smartphone application, called VitiCanopy, to evaluate the Leaf Area Index (LAI) and canopy porosity of vineyards. Later, Aquino et al. [31] provided a solution (vitisFlower) for flower counting inside the inflorescence. In the present study, a colorimetric tool, Color Grab was applied to receive the colorimetric information of the grapevine leaf samples. The application provides a solution to standardize the colorimetric properties with a white reference and give the most important color dimensions of the investigated samples. Former studies showed that Color Grab is appropriate for applications in scientific experiments [14].
The leaf morphoanatomy of grapevine cultivars showed significant differences between epidermal cells, cuticles, mesophylls, palisades, and spongy tissue thickness [32]. Chlorophyll is present in the palisade and spongy mesophyll layer of the lamina tissues; therefore, in uniform circumstances, different chlorophyll concentrations could be explained by the anatomy of the cultivars. The current results of chlorophyll concentration measurement verify that the pigmentation of the leaf is different among cultivars, while at the clone level, only minor differences were obtained. Casanova-Gascon et al. [33] found that green pigmentation has a high variability among grapevine cultivars ranging from 0.1450 to 0.3774 mg/100 mg for ‘Macabeo’ and ‘Aglianico’ cultivars, respectively. For average values, ‘Cabernet sauvignon’ and ‘Aglianico’ had high chlorophyll concentration, contrary to ‘Sauvignon blanc’, which had low. It must be highlighted that sampling has a significant effect on the results. Our former study showed that the chlorophyll concentration of the ‘Hárslevelű’ leaf samples ranged from 0 to 380.5 µmol × m−2 with an average of 242 µmol × m−2 [10]. The wide range resulted from the various phenological stages of the samples as both young and old leaves were investigated. In the present study, we focused on fully developed adult leaves collected from the middle third of the main shoots. The range of the chlorophyll concentration was much lower than those in our earlier study, as in this experiment, the lowest value was 232.8 µmol × m−2 (‘Pinot noir’ 666), while the highest was 440.6 µmol × m−2 (‘Chardonnay’).

4.1. Leaf Color

Leaf coloration differs in grapevine cultivars, which is particularly detailed in ampelographic albums and descriptor lists. For example, OIV [1] defines adult leaf coloration (OIV069) as pale green (3), medium green (5), and dark green (7) with the corresponding reference ‘Chasselas blanc’/’Silvaner’, ‘Sauvignon blanc’/’Garnacha tinta’, and ‘Clairette’/’Merlot’, respectively, with an important remark, namely, that the descriptor is “easily modified by fertilization”. In our study, the sampling area was treated with the same fertilization; therefore, we could exclude the effect of the nutrient status on the leaf coloration differences. Compared to the nomination of the color based on the visual inspection, the numerical explanation of color spaces has an important benefit, as it excludes the observer’s personal decision; therefore, the color quantification is more widespread in the investigations of both the berry [34] and leaf analysis [35]. In this study, coloration was expressed by RGB, CIE-L*a*b*, chroma and hue values, and the results showed that the coloration of the cultivars significantly differed. This finding supports the previous study reported by Fuentes et al. [36], where 16 investigated cultivars showed high variability in their study. Later, Gutiérrez-Gamboa et al. [37] investigated drought-stressed and non-stressed grapevine plants, and they found that there is a significant colorimetric difference among the genotypes. It has to be highlighted that each report shows different RGB and CIE-L*a*b* color values, and there is a noticeable difference among the findings of the same cultivar (Table 3).

4.2. Correlation of the Chlorophyll Concentration with Color Indices

Former results showed that the leaf chlorophyll content and RGB-based vegetation indices had high correlation in different plant species [18,20,38,39]; therefore, non-destructive remote sensing measurements would be an alternative way to measure pigmentation. Our recent study [10] emphasized that many RGB-based vegetation indices had high correlation with grapevine leaf chlorophyll content, while our results and the former findings did not point in the same direction. Therefore, we hypothesized that the correlation would be genotype-specific. The present study showed that in certain genotypes, the indices were positively correlated with pigmentation, while in the case of other genotypes, the correlation was negative. These results underline that the link between vegetation indices and chlorophyll concentration could be specific to the cultivar and the genotype (e.g., clone). We emphasize that the leaf anatomy and the presence of other pigments could be the reason for the surface color differences between genotypes, resulting in an alteration in the vegetation and color indices, while the samples may have the same chlorophyll content. For example, Liakopoulos et al. [40] showed that anthocyanins, xanthophylls, non-xanthophyll cycle carotenoids, chlorophylls [Chl (a + b)] and Chl a/b (moreover, the xanthophyll components/chlorophylls ratio) were significantly differing among cultivars, which was influenced by the developmental stage of the samples.
Compared to our former results, the present study found a much lower correlation between the RGB base color indices and the leaf chlorophyll content. This could be explained by the sampling methods, as in the former study, we collected a wide range of samples concerning phenological stages, while in this experiment, the samples were accurately defined fully and well-developed laminas where the variability of the chlorophyll concentration and the color properties was much lower. This result emphasizes that correlations between vegetation indices and pigmentation are influenced by the range in the developmental and physiological properties of the observed samples. Minor differences in the chlorophyll concentration are less able to be detected based on color indices, while major differences, which are major problems in the canopy, could be detected and identified effectively.

4.3. Color-Based Classification

Leaf morphometric traits proved to be appropriate for the discriminant analysis of the grapevine cultivars. Preiner et al. [41] showed that the phyllometric traits of 360 leaf samples belonging to 10 cultivars provide 100% correct classification. Later, Reiczigel et al. [42] showed that the morphometric data of 144 grape genotypes included in Németh’s ampelographic books [43,44,45] have high discriminative power, as stepwise discriminant analysis correctly classified cultivars by origin (convar. pontica—80%, convar. orientalis—66%, convar. occidentalis—36%) and utilization (wine grape—97%, table grape—62%). Fuentes et al. [36] used morpho-colorimetric data for classification based on machine learning and obtained 94.2% accuracy. In this study, SVM analysis showed high accuracy, as for parameter groups CIE-L*a*b*, RGB, and derived RGB, the linear kernel showed 68.66%, 70.19%, 66.84% classification power, respectively.

5. Conclusions

In this study, the leaf coloration of four grapevine (Vitis vinifera L.) genotypes was evaluated by a proximal sensing method, and colorimetric data were correlated to chlorophyll concentrations. The results showed that the coloration of genotypes significantly differed in terms of the chroma and hue values, although the plant material was collected from similar environmental conditions. The findings of this study showed that pigmentation and coloration had specific relation; moreover, the results emphasized that the correlation of the color indices to the leaf chlorophyll concentration was genotype specific, as in the case of each genotype. Moreover, different color attributes had the highest correlation to pigmentation. During the classification, the Support Vector Machine analysis revealed 22.88% to 71.63% correct classification of the genotypes influenced by the color properties that were included in the analysis. This later result raises new questions about the use of color and vegetation indices in the grapevine genotype identification according to remote sensing methods.

Author Contributions

Conceptualization, P.B.-P.; methodology, P.B.-P. and L.B.; software, L.B. and T.D.; investigation, P.B.-P., D.T., G.V., I.F. and L.B.; writing—original draft preparation, P.B.-P., D.T., T.D., I.F., G.V., L.B., D.Á.N.S. and Z.V.; writing—review and editing, P.B.-P., Z.V., D.T. and L.B.; visualization, P.B.-P. and T.D.; supervision, D.Á.N.S. and Z.V. All authors have read and agreed to the published version of the manuscript.

Funding

This research received no external funding.

Data Availability Statement

The original contributions presented in the study are included in the article, further inquiries can be directed to the corresponding author.

Conflicts of Interest

The authors declare no conflicts of interest.

References

  1. OIV. OIV Descriptor List for Grape Varieties and Vitis Species, 2nd ed.; Office International de la Vigne et du Vin: Paris, France, 2009; p. 177. [Google Scholar]
  2. Costa, B.R.S.; Oldoni, H.; da Silva, T.M.M.; Farinassi, L.G.; Bognola, I.A.; Bassoi, L.H. How similar is the zoning of different vegetation indices: Defining the optimal framework for monitoring grapevines’ growth within vigorous vineyards. Sci. Hort. 2023, 322, 112404. [Google Scholar] [CrossRef]
  3. Bertamini, M.; Nedunchezhian, N. Leaf age effects on chlorophyll, Rubisco, photosynthetic electron transport activities and thylakoid membrane protein in field grown grapevine leaves. J. Plant Phys. 2002, 159, 799–803. [Google Scholar] [CrossRef]
  4. Lashbrooke, J.G.; Young, P.R.; Strever, A.E.; Stander, C.; Vivier, M.A. The development of a method for the extraction of carotenoids and chlorophylls from grapevine leaves and berries for HPLC profiling. Aust. J. Grape Wine Res. 2010, 16, 349–360. [Google Scholar] [CrossRef]
  5. Taskos, D.G.; Koundouras, S.; Stamatiadis, S.; Zioziou, E.; Nikolaou, N.; Karakioulakis, K.; Theodorou, N. Using active canopy sensors and chlorophyll meters to estimate grapevine nitrogen status and productivity. Prec. Agric. 2015, 16, 77–98. [Google Scholar] [CrossRef]
  6. Bascuñán-Godoy, L.; Franck, N.; Zamorano, D.; Sanhueza, C.; Carvajal, D.E.; Ibacache, A. Rootstock effect on irrigated grapevine yield under arid climate conditions are explained by changes in traits related to light absorption of the scion. Sci. Hortic. 2017, 218, 284–292. [Google Scholar] [CrossRef]
  7. Ferreira, V.; Pinto-Carnide, O.; Arroyo-García, R.; Castro, I. Berry color variation in grapevine as a source of diversity. Plant Phys. Biochem. 2018, 132, 696–707. [Google Scholar] [CrossRef] [PubMed]
  8. Petit, A.N.; Vaillant, N.; Boulay, M.; Clément, C.; Fontaine, F. Alteration of photosynthesis in grapevines affected by esca. Phytopathology 2006, 96, 1060–1066. [Google Scholar] [CrossRef]
  9. Min, Z.; Li, R.; Chen, L.; Zhang, Y.; Li, Z.; Liu, M.; Fang, Y. Alleviation of drought stress in grapevine by foliar-applied strigolactones. Plant Phys. Biochem. 2019, 135, 99–110. [Google Scholar] [CrossRef]
  10. Bodor-Pesti, P.; Taranyi, D.; Sárdy, D.N.; Nguyen, L.L.P.; Baranyai, L. Correlation of the Grapevine (Vitis vinifera L.) Leaf Chlorophyll Concentration with RGB Color Indices. Horticulturae 2023, 9, 899. [Google Scholar] [CrossRef]
  11. Domanda, C.; Nuzzo, V.; Montanaro, G.; Failla, O.; Rustioni, L. Trichomes affect grapevine leaf optical properties and thermoregulation. Theor. Experym. Plant Phys. 2023, 35, 299–308. [Google Scholar] [CrossRef]
  12. Kobayashi, K.D. Are there horticulture-related mobile applications for me? HortTechnology 2013, 23, 399–401. [Google Scholar] [CrossRef]
  13. Kwon, O.; Park, T. Applications of Smartphone Cameras in Agriculture, Environment, and Food: A review. J. Biosys. Eng. 2017, 42, 330–338. [Google Scholar] [CrossRef]
  14. Lima, M.J.; Nascimento, C.F.; Rocha, F.R. Feasible photometric measurements in liquid–liquid extraction by exploiting smartphone-based digital images. Anal. Meth. 2017, 9, 2220–2225. [Google Scholar] [CrossRef]
  15. Crippen, R.E. Calculating the vegetation index faster. Remote Sens. Environ. 1990, 34, 71–73. [Google Scholar] [CrossRef]
  16. Montero, D.; Aybar, C.; Mahecha, M.D.; Martinuzzi, F.; Söchting, M.; Wieneke, S. A standardized catalogue of spectral indices to advance the use of remote sensing in Earth system research. Sci. Data 2023, 10, 197. [Google Scholar] [CrossRef] [PubMed]
  17. Henrich, V.; Krauss, G.; Götze, C.; Sandow, C. IDB–www.indexdatabase.de, Entwicklung einer Datenbank für Fernerkundungsindizes. AK Fernerkund. Bochum 2012, 4–5, 10. [Google Scholar]
  18. Sánchez-Sastre, L.F.; Alte da Veiga, N.M.; Ruiz-Potosme, N.M.; Carrión-Prieto, P.; Marcos-Robles, J.L.; Navas-Gracia, L.M.; Martín-Ramos, P. Assessment of RGB vegetation indices to estimate chlorophyll content in sugar beet leaves in the final cultivation stage. AgriEngineering 2020, 2, 128–149. [Google Scholar] [CrossRef]
  19. Lu, J.; Eitel, J.U.; Engels, M.; Zhu, J.; Ma, Y.; Liao, F.; Tian, Y. Improving Unmanned Aerial Vehicle (UAV) remote sensing of rice plant potassium accumulation by fusing spectral and textural information. Int. J. Appl. Earth Obs. Geoinf. 2021, 104, 102592. [Google Scholar] [CrossRef]
  20. Cheng, L.; Zhu, X.; Gao, L.; Li, C.; Wang, L.; Zhao, G.; Jiang, Y. Estimation of chlorophyll content in apple leaves based on RGB model using digital camera. Acta Hort. Sin. 2017, 44, 381–390. [Google Scholar] [CrossRef]
  21. Pazda, A.D.; Thorstenson, C.A. Color intensity increases perceived extraversion and openness for zero-acquaintance judgments. Pers. Indiv. Diff. 2019, 147, 118–127. [Google Scholar] [CrossRef]
  22. Wang, Z.; Li, H.; Zhu, Y.; Xu, T. Review of plant identification based on image processing. Arch. Comput. Methods Eng. 2017, 24, 637–654. [Google Scholar] [CrossRef]
  23. Nasiri, A.; Taheri-Garavand, A.; Fanourakis, D.; Zhang, Y.D.; Nikoloudakis, N. Automated grapevine cultivar identification via leaf imaging and deep convolutional neural networks: A proof-of-concept study employing primary Iranian varieties. Plants 2021, 10, 1628. [Google Scholar] [CrossRef] [PubMed]
  24. Available online: https://www.mi.com/np/redmi-note-9/specs/ (accessed on 17 October 2024).
  25. Pék, Z.; Helyes, L.; Lugasi, A. Color changes and antioxidant content of vine and postharvest-ripened tomato fruits. HortScience 2010, 45, 466–468. [Google Scholar] [CrossRef]
  26. Apogee Chlorophyll Meter Support. Available online: https://www.apogeeinstruments.com/chlorophyll-meter-support/#specifications (accessed on 1 February 2023).
  27. Hammer, Ø.; Harper, D.A. Past: Paleontological statistics software package for education and data analysis. Palaeont. Electr. 2001, 4, 1. [Google Scholar]
  28. Krzywinski, M.; Schein, J.; Birol, I.; Connors, J.; Gascoyne, R.; Horsman, D.; Marra, M.A. Circos: An information aesthetic for comparative genomics. Genome Res. 2009, 19, 1639–1645. [Google Scholar] [CrossRef]
  29. Pongnumkul, S.; Chaovalit, P.; Surasvadi, N. Applications of smartphone-based sensors in agriculture: A systematic review of research. J. Sens. 2015, 2015, 195308. [Google Scholar] [CrossRef]
  30. De Bei, R.; Fuentes, S.; Gilliham, M.; Tyerman, S.; Edwards, E.; Bianchini, N.; Collins, C. VitiCanopy: A free computer App to estimate canopy vigor and porosity for grapevine. Sensors 2016, 16, 585. [Google Scholar] [CrossRef]
  31. Aquino, A.; Millan, B.; Gaston, D.; Diago, M.P.; Tardaguila, J. vitisFlower®: Development and testing of a novel android-smartphone application for assessing the number of grapevine flowers per inflorescence using artificial vision techniques. Sensors 2015, 15, 21204–21218. [Google Scholar] [CrossRef]
  32. Teixeira, G.; Monteiro, A.; Santos, C.; Lopes, C.M. Leaf morphoanatomy traits in white grapevine cultivars with distinct geographical origin. Ciência Técn. Vitiviníc 2018, 33, 90–101. [Google Scholar] [CrossRef]
  33. Casanova-Gascón, J.; Martín-Ramos, P.; Martí-Dalmau, C.; Badía-Villas, D. Nutrients assimilation and chlorophyll contents for different grapevine varieties in calcareous soils in the Somontano DO (Spain). Beverages 2018, 4, 90. [Google Scholar] [CrossRef]
  34. Somogyi, E.; Lázár, J.; Bodor, P.; Kaszab, T. Colour of grapevine (Vitis vinifera L.) accessions influenced by the length of cold storage: Grapevine berry colour measurement. Prog. Agric. Eng. Sci. 2021, 16, 109–116. [Google Scholar] [CrossRef]
  35. Doğan, A.; Uyak, C. A different approach for grape leaf color. J. Agric. Fac. Gaziosmanpaşa Univ. JAFAG 2020, 37, 44–52. [Google Scholar] [CrossRef]
  36. Fuentes, S.; Hernández-Montes, E.; Escalona, J.M.; Bota, J.; Viejo, C.G.; Poblete-Echeverría, C.; Medrano, H. Automated grapevine cultivar classification based on machine learning using leaf morpho-colorimetry, fractal dimension and near-infrared spectroscopy parameters. Comput. Electron. Agric. 2018, 151, 311–318. [Google Scholar] [CrossRef]
  37. Gutiérrez-Gamboa, G.; Torres-Huerta, N.; Araya-Alman, M.; Verdugo-Vásquez, N.; Moreno-Simunovic, Y.; Valdés-Gómez, H.; Acevedo-Opazo, C. Leaf morpho-colorimetric characterization of different grapevine varieties through changes on plant water status. Horticulturae 2021, 7, 315. [Google Scholar] [CrossRef]
  38. Kawashima, S.; Nakatani, M. An algorithm for estimating chlorophyll content in leaves using a video camera. Ann. Bot. 1998, 81, 49–54. [Google Scholar] [CrossRef]
  39. Guendouz, A.; Bendada, H.; Benniou, R. A comparative study of chlorophyll content estimation in barley (Hordeum vulgare L.) genotypes based on RGB (Red, Green, Blue) image analysis. Agric. Sci. Digest A Res. J. 2022, 42, 68–71. [Google Scholar] [CrossRef]
  40. Liakopoulos, G.; Nikolopoulos, D.; Klouvatou, A.; Vekkos, K.A.; Manetas, Y.; Karabourniotis, G. The photoprotective role of epidermal anthocyanins and surface pubescence in young leaves of grapevine (Vitis vinifera). Ann. Bot. 2006, 98, 257–265. [Google Scholar] [CrossRef]
  41. Preiner, D.; Safner, T.; Karoglan Kontić, J.; Marković, Z.; Šimon, S.; Maletić, E. Analysis of phyllometric parameters efficiency in discrimination of Croatian native V. vinifera cultivars. Vitis 2014, 53, 215–217. [Google Scholar] [CrossRef]
  42. Reiczigel, Z.; Szekszárdi, A.; Bisztray, G.D.; Ladányi, M.; Bálo, B.; Bodor, P. Szőlőfajták Ampelometriai Mutatóinak Statisztikai Elemzése. XXIII. Növénynemesítési Tudományos Nap; MTA Agrártudományok Osztálya Növénynemesítési Tudományos Bizottság, Magyar Növénynemesítők Egyesülete: Budapest, Hungary, 2017; p. 137. [Google Scholar]
  43. Németh, M. Ampelográfiai Album. Termesztett Borszőlőfajták 1; Mezőgazdasági Kiadó: Budapest, Hungary, 1967; p. 235. [Google Scholar]
  44. Németh, M. Ampelográfiai Album. Termesztett Borszőlőfajták 2; Mezőgazdasági Kiadó: Budapest, Hungary, 1970; p. 272. [Google Scholar]
  45. Németh, M. Ampelográfiai Album 3. Alany-, Direkt Termő és Csemegeszőlő-Fajták; Mezőgazdasági Kiadó: Budapest, Hungary, 1975; p. 358. [Google Scholar]
Figure 1. Mean leaf chlorophyll concentration (a), chroma (b) and hue values (c) of the investigated grapevine genotypes. Horizontal lines in each box indicate the median. Different letters indicate significant differences between the genotypes (p < 0.05) (n = 100).
Horticulturae 10 01179 g001
Figure 2. Pearson’s correlation between the leaf chlorophyll content and color indices. Green links show a positive correlation, while blue links depict a negative correlation between the chlorophyll content and the index. Only correlation indices with p < 0.01 were included. Deeper colors refer to stronger correlation, and light colors refer to weaker correlation.
Horticulturae 10 01179 g002
Table 1. Pearson’s correlation of leaf chlorophyll concentration with color properties and RGB-based indices where L* refers to lightness, while a* and b* refer to Green-Red transition, and Blue-Yellow transition respectively. RGB refers to Red, Green, and Blue; further indices are explained in Pék et al. [25] and Sánchez-Sastre et al. [18].
Nr. Color AttributeVitis vinifera L.‘Chardonnay’‘Sauvignon Blanc’‘Pinot Noir’ 666‘Pinot Noir’ 777
1L*−0.4943**−0.4126**−0.3275**−0.5912**−0.3963**
2a*0.6731**0.5448**0.5599**0.4395**0.4746**
3b*−0.6853**−0.6386**−0.5868**−0.6349**−0.4322**
4Chroma−0.7187**−0.6211**−0.5889**−0.5776**−0.5562**
5Hue0.6308**0.5978**0.5430**0.7038**0.5133**
6R−0.2175**−0.2872*−0.1274n.s.−0.4158**−0.1281n.s.
7G−0.5463**−0.4529**−0.3690**−0.6264**−0.4509**
8B0.1702**0.0760n.s.0.1783n.s.0.0401n.s.0.1896n.s.
9r−0.1918**−0.3587**−0.1759n.s.−0.4223**−0.1544n.s.
10g−0.2929**−0.1698n.s.−0.2487*−0.0250n.s.−0.2899**
11b0.4679**0.4559**0.4072**0.3324**0.3838**
12R-G0.5969**0.3877**0.4789**0.2380*0.4789**
13R-B−0.5712**−0.6262**−0.5121**−0.7073**−0.3352**
14G-B−0.7112**−0.6664**−0.5997**−0.6445**−0.4795**
15(R − G)/(R + G)0.0817n.s.−0.1066n.s.0.0548n.s.−0.2154*0.0883n.s.
16(R − B)/(R + B)−0.5261**−0.5777**−0.4713**−0.5431**−0.4320**
17(G − B)/(G + B)−0.4280**−0.3660**−0.3657**−0.2497*−0.3818**
18(R − G)/(R + G + B)0.1571**−0.0196n.s.0.1313n.s.−0.1316n.s.0.1652n.s.
19(R − B)/(R + G + B)−0.5525**−0.5944**−0.4999**−0.6279**−0.3805**
20(G − B)/(R + G + B)−0.3807**−0.3103*−0.3264**−0.1571n.s.−0.3484**
21RGRI0.0941n.s.−0.1056n.s.0.0549n.s.−0.2221*0.1030n.s.
22GLI−0.3034**−0.1722n.s.−0.2516*−0.0310n.s.−0.2884**
23VARI0.1080*0.3007*0.1470n.s.0.4012**0.0260n.s.
24IPCA−0.7098**−0.6669**−0.5989**−0.6489**−0.4759**
25ExR0.1571**−0.0196n.s.0.1313n.s.−0.1316n.s.0.1652n.s.
26ExB0.3807**0.3103**0.3264**0.1571n.s.0.3484**
27ExG−0.1918**−0.3587**−0.1759n.s.−0.4223**−0.1544n.s.
28ExGR−0.5505**−0.5891**−0.4956**−0.6043**−0.3848**
29Gray−0.3574**−0.2721**−0.3056**−0.1188n.s.−0.3350**
30CIVE0.2852**0.1581n.s.0.2420*0.0148n.s.0.2838**
31PCA1−0.5283**−0.5662**−0.4683**−0.5222**−0.4190**
32PCA2−0.6808**−0.6639**−0.5809**−0.6902**−0.4281**
33I1−0.6762**−0.6627**−0.5781**−0.6933**−0.4227**
34SLR10.0813n.s.−0.1085n.s.0.0552n.s.−0.2149*0.0879n.s.
35SLR2−0.0898n.s.−0.2421*0.0637n.s.0.2312*−0.0663n.s.
36SLR3−0.0272*−0.1631n.s.0.1408n.s.0.2803**−0.0301n.s.
37SLR4−0.0687n.s.−0.2089*0.0933n.s.0.2520*−0.0548n.s.
38SLR5−0.0717n.s.−0.2051*0.0881n.s.0.2513*−0.0562n.s.
39I20.4466**0.5067**0.4351**0.5106**0.4472**
* indicates significant correlation with the chlorophyll concentration at p < 0.05, ** indicates significant correlation with the chlorophyll concentration at p < 0.01., n.s. indicates not significant correlation.
Table 2. Classification results (%) of DA and SVM with tenfold cross-validation by parameter groups.
ParametersDiscriminant AnalysisKernel Function
LinearPolynomialRadialSigmoid
Training
CIE-L*a*b* 68.6665.0970.5643.09
RGB70.1965.2271.9740.00
Derived RGB66.8455.9164.3123.19
PCA39.5339.0343.6925.63
Miscellaneous56.7549.9760.1633.09
All73.2563.5672.9140.50
Validation
CIE-L*a*b*68.567.7560.5064.6341.75
RGB64.567.8859.8866.6340.00
Derived RGB62.564.7552.1360.0022.88
PCA54.538.3838.1339.8824.25
Miscellaneous61.2554.8847.1355.3831.25
All62.7571.6358.3866.3839.88
Table 3. Mean RGB and CIE-L*a*b* values of the investigated grapevine cultivars compared to previous findings.
Literature‘Pinot Noir’ 777‘Pinot Noir’ 666‘Chardonnay’‘Sauvignon Blanc’
Rpresent study45.4238.844135.99
Fuentes et al. [36]--118.794.9
Gutiérrez-Gamboa et al. [37]—stressed64.37 *68.9671.83
Gutiérrez-Gamboa et al. [37]—non-stressed75.92 *81.2475.94
Gpresent study84.8778.4370.4569.94
Fuentes et al. [36]--129119.2
Gutiérrez-Gamboa et al. [37]—stressed67.72 *74.3575.94
Gutiérrez-Gamboa et al. [37]—non-stressed78.92 *85.3677.77
Bpresent study38.2127.8236.8926.23
Fuentes et al. [36]--13.127.9
Gutiérrez-Gamboa et al. [37]—stressed47.53 *46.8649.06
Gutiérrez-Gamboa et al. [37]—non-stressed48.04 *50.3449.49
L*present study32.2329.4626.8226.21
Fuentes et al. [36]--57.656.1
Gutiérrez-Gamboa et al. [37]—stressed---
Gutiérrez-Gamboa et al. [37]—non-stressed---
a*present study−24.09−24.69−18.61−21.82
Fuentes et al. [36]--−8.6−19.3
Gutiérrez-Gamboa et al. [37]—stressed---
Gutiérrez-Gamboa et al. [37]—non-stressed---
b*present study22.3724.6616.4321.73
Fuentes et al. [36]--13.127.9
Gutiérrez-Gamboa et al. [37]—stressed---
Gutiérrez-Gamboa et al. [37]—non-stressed---
* Gutiérrez-Gamboa et al. [37] reported results about the ‘Pinot noir’ without indication of the clone.
Disclaimer/Publisher’s Note: The statements, opinions and data contained in all publications are solely those of the individual author(s) and contributor(s) and not of MDPI and/or the editor(s). MDPI and/or the editor(s) disclaim responsibility for any injury to people or property resulting from any ideas, methods, instructions or products referred to in the content.

