Abstract
Grape seed proanthocyanidin (GSP) contains polyphenolic bioflavonoids ubiquitously found in the lignified portions of grape seeds from the winery and distillery industries, as an antioxidant. To explore its potential as a rumen modifier in methanogenesis inhibition, a 2 × 5 factorial experiment was conducted to determine the effect of GSP at 0, 15, 30, 60 and 120 mg/g of substrate on the rumen fermentation and methanogenesis of two representative total mixed rations (HY, a diet for high-yield (>2 kg/d) lactating cows, and LY, a diet for low-yield (<25 kg/d) lactating cows). By using the MIXED procedure, after a 48 h in vitro rumen incubation, increasing the GSP addition linearly decreased the in vitro dry matter digestion (IVDMD) and slowed down the rates of ration fermentation (RmaxS, g/h) and kinetic gas production (RmaxG, mL/h), with the decreases being more pronounced in the LY than HY group (p < 0.05). The GSP addition decreased hydrogen recovery (2Hrec) and altered the fermentation gas composition. The molar CH4 proportion was significantly reduced with both 60 and 120 mg GSP addition (p < 0.01). The total volatile fatty acid production was linearly decreased with the increasing GSP addition (p < 0.01). In addition, the GSP addition significantly decreased the ratio of methanogens to total bacteria (p < 0.05), and the reduction was notably greater in the HY than in the LY substrate (45.3% vs. 15.2% decrease), although the diversity of rumen methanogenic archaea was not affected in either the HY or the LY group. Bioinformatic analysis illustrated that the rumen archaeal community was predominated by a Methanobrevibacter genus (>72.5%), followed by Methanomassiliicoccus (>20.9%) and Methanosphaera (>1.0%). Methanobrevibacter could play an important role in methanogenesis in the presence of GSP, though it is usually considered to be the main hydrogenotrophic methanogen. In brief, the GSP addition presented high potential as a rumen modifier to mitigate methanogenesis by decreasing the ratio of methanogens to total bacteria. Methanobrevibacter could play an important role in methanogenesis in the presence of GSP. However, a relatively low administration level of GSP should be taken into consideration in order to obtain its inhibitory effect on CH4 emission, with a minimal negative effect on rumen digestion and fermentation.
1. Introduction
Enteric methane production from ruminants not only accounts for approximately 8% of global anthropogenic greenhouse gas (GHG) emissions, but also causes a loss of feed energy of up to 12% [1,2]. In recent decades, there has been increasing interest in developing dietary phytochemicals as rumen modifiers (e.g., essential oils, tannins, flavonoids, saponins) to mitigate enteric ruminal CH4 emissions [3,4].
The antioxidant capacity of grape seed proanthocyanidin(GSP) has been commonly reported in studies [5,6]. Bagchi et al. showed that GSP addition could significantly protect a variety of animal body tissues and organs from the damage of reactive oxygen species [7]. In addition, grape marc has attracted attention due to its potential to inhibit CH4 production. Moate et al. noted that both pelleted grape marc and ensiled grape marc reduced CH4 emissions by approximately 20% when fed to dairy cows [8]. In addition, Hixson et al. found that grape marc samples could reduce in vitro CH4 production by 2.0–18% without decreasing the overall gas production [9]. Grape marc dry matter contains seed-derived fatty acids that have been widely implicated in reducing methanogenesis [8,10,11]. However, GSP, which comprises a group of polyphenolic bioflavonoids ubiquitously found in the lignified portions of grape marc, may also play an important role in reducing CH4 production. Until now, little work has focused on how GSP contributes to the decrease in CH4 emissions based on its action mode in the rumen.
Total mixed rations (TMRs) help dairy cows to achieve maximum performance and are the most common method for feeding high-producing, indoor-housed dairy cows in large-scale farms in China [12]. Based on actual and fat-corrected milk, days in milk, reproductive status, and different types of TMRs have often been formulated to satisfy the nutrient requirements of lactating cows. In the present study, two typical TMRs from dairy cow farms in China were chosen as model substrates, and the primary objective was to determine the supplementing effect of different levels of GSP on in vitro rumen degradability, kinetic gas production and fermentation characteristics of each diet incubated with rumen fluid collected from lactating dairy cows. Moreover, the quantitative real-time PCR and Illumina MiSeq sequencing approaches were applied to investigate the influence of GSP addition on the abundance and diversity of rumen archaea.
2. Materials and Methods
2.1. Grape Seed Procyanidin
Grape seed procyanidin, a reddish-brown powder that is soluble in water, was purchased from Chenguang Biological Technology Co., Ltd. (Handan, China). The product contained 95% procyanidins, which are members of the proanthocyanidin class of flavonoids. All other chemicals were purchased from the Beijing Chemical Reagent Company (Beijing, China).
2.2. Total Mixed Rations
Two representative TMRs were collected from a large-scale intensive dairy farm in China, with one diet fed to the high-producing lactating cattle (HY, >32 kg/d) and another diet fed to the lower producing cattle (LY, <25 kg/d). Both diet samples were oven-dried at 65 °C overnight and then ground in a Wiley mill to pass through a 1.0 mm screen. The ingredients and chemical composition on a dry matter (DM) basis are presented in Table 1.

Table 1.
Feed ingredients and chemical composition of 2 total mixed rations (TMR) incubated in vitro. HY, a ration for high-yield (>32 kg/d) lactating cows; LY, a ration for low-yield (<25 kg/d) lactating cows.
2.3. Rumen Fluid Collection
Four rumen-fistulated lactating Holstein dairy cows (630 ± 18 kg body weight) served as donor animals and were housed in a free stall. The cows had free access to water and were fed a TMR provided by a dairy farm in Shunyi district (Beijing, China). Cows were maintained on a TMR of 520 g/kg whole corn silage, 110 g/kg alfalfa hay and 370 g/kg concentrate. The fresh rumen fluid was collected 2 h after the morning feeding, mixed in equal amounts, and squeezed through four layers of surgical gauze. The rumen fluid was then transferred into a pre-warmed thermos at 39 °C. All animals were cared for and experimental operations were carried out under the Guidelines of the Beijing Municipal Council on Animal Care [13].
2.4. Experimental Design and In Vitro Batch Culture
A 2 × 5 factorial design was applied in batch cultures with two TMRs (HY and LY) and five GSP levels at 0 (control), 15, 30, 60 and 120 mg/g of substrate, respectively. The GSP doses used in the present study were based on a previous study [14]. Glass bottles with a volume capacity of 120 mL served as incubators, and the batch cultures were repeated in three runs and each run contained five fermentations for each treatment (n = 15). In addition, five substrate-free bottles served as blanks in each run. A primary GSP solution (180 g/L) was prepared with a medium (pH 6.85) and then diluted into five working solutions of 7.5, 15, 30 and 60 mg GSP/mL. In each run, 500 mg of TMRs, 50 mL pre-warmed medium, 24 mL rumen fluid and 1 mL of corresponding GSP working solutions were added to each bottle (2 TMRs × 5 GSP levels × 5 fermentations = 50 bottles). All bottles were immediately purged with anaerobic N2 for 5 s to remove air from the headspace, and then sealed with butyl rubber stoppers and Hungate screw caps (Head Biotechnology Company, Beijing, China) and immediately connected to the gas inlets of an automated gas production recording system (AGRS-III, China Agricultural University, Beijing, China) [15] with medical plastic infusion pipes and needles. Fermentation gases during 48 h incubation were collected with air bags for gas composition analysis [16]. Driven by differential pressure sensors, and having 64 separated channels in total, the gas recording system was capable of recording the real-time cumulative gas production precisely and plotting a scatter diagram which provided a visual range for the user to continuously monitor the fermentation profile.
After each 48 h period of incubation, the bottles were disconnected from the system and the final pH was immediately determined in culture fluids. A subsample of the culture fluid (2.0 mL) was individually collected into DNase-free polypropylene tubes and preserved at −80 °C for methanogenic archaea analysis. A second subsample of culture fluids (1.0 mL) was sampled and mixed with 300 μL of 25 mg/mL metaphosphoric acid solution for 30 min at 4 °C, and centrifuged at 10,000× g for 15 min at 4 °C. Supernatants were sampled and stored at −20 °C for the analyses of ammonia N [17] and volatile fatty acids (VFA). The individual VFAs, including acetate, propionate, isobutyrate, butyrate, isovalerate and valerate in the supernatants, were measured with a gas chromatography method [16]. The gas chromatography (GC522, Wufeng Instruments, Shanghai, China) was equipped with a 15 m semicapillary column (Ø 0.53 mm) with pure N2 as the carrier gas at a column temperature of 120 °C. Following the description by Pang et al. [18], a third subsample of culture fluids (1.0 mL) was transferred to a polypropylene tube and frozen at −20 °C for the microbial crude protein (MCP) concentration analysis. After the culture fluid sampling, the material remaining in each bottle was filtered through a nylon bag (8 × 12 cm, 42 μm pore size) and dried at 65 °C for 48 h. The difference between the initially incubated DM and residual DM, corrected by the blanks after the incubation, was calculated to determine the in vitro dry matter disappearance (IVDMD). Finally, a 1.0 mL gas sample in the airbags was removed by syringes for the analysis of H2, CH4 and CO2 concentration using a gas chromatographic method described by Zhang and Yang [19].
2.5. DNA Extraction, 16S rDNA Gene Amplification and Illumina Sequencing
In addition, because the 15 mg GSP addition remarkably reduced CH4 production, 16S rDNA gene amplification and Illumina sequencing were performed for 0 and 15 mg GSP treatments.
The microbial DNA of the culture fluid was extracted using an OMEGA extraction kit (E.Z.N.ATM Mag-Bind Soil DNA Kit, Norcross, GA, USA) following the manufacturer’s instructions. The quality and concentration of extracted DNA was determined with agarose gel electrophoresis (1%) and NanoDrop 1000 Spectrophotometer (NanoDrop Technologies, Inc., Wilmington, NC, USA), respectively.
Due to the lower abundance of the archaeal community in comparison to the bacterial community, the archaeal community was especially analyzed using nested PCR. First, the primers of Arch 340F (50–CCCT AYGG GGYG CASC AG–30) and Arch 1000R (50–GAGA RGWR GTGC ATGG CC–30) were used for the amplification of the specific archaeal community. Then, the primers of Arch 349F (50–GYGC ASCA GKCG MGAA W–30) and Arch 806R (50–GGAC TACV SGGG TATC TAAT–30) were applied in the second PCR using the first PCR product as a template, as described by Takai and Horikoshi [20]. These primers were designed with Primer Premier 5. The PCR reaction was performed using a T100TM Thermal Cycler (BIO-RAD, United States) under a condition described previously by Wang et al. [21]. For each sample, DNA was amplified in triplicate and the PCR products were further purified with a DNA purification kit (Gel Purification kits, Sangon, Shanghai, China). The concentrations were then determined using Qubit® 3.0 spectrometry (Invitrogen, Waltham, MA, USA). Finally, the purified PCR amplicons were pooled at 1:1 and subjected to subsequent sequencing using the Illumina MiSeq platform (Shanghai Sangon Biotech Co., Ltd., Shanghai, China).
2.6. Sequencing Data Processing and Analysis
The raw FASTQ files were quality filtered and merged using Cutadapt, Pear, Prinseq, Usearch and Uchime software with the standard protocols described by Wang et al. [21]. After filtration, the average length of all the clean reads was 378 bp, and there were 89,906 average filtered clean reads for archaeal community analysis. The quality-filtered sequences were clustered into operational taxonomic units (OTUs) according to the 97% sequence identity using the average neighbor algorithm [2]. The final taxonomic assignment was carried out with a bootstrap of 80% using Mothur [22]. The taxonomic classification of the sequences was conducted with a bootstrap of 80% using the Ribosomal Database Project (RDP) Classifier. The coverage and sampling efforts were estimated by the determination of Good’s coverage and rarefaction curves. Archaeal population diversity (inverse Simpson’s index), evenness (Shannon’s evenness index) and richness (Chao1 and ACE) were measured with Mothur [22]. A principal component analysis (PCoA) and an analysis of similarity (ANOSIM) of significant features were performed to assess significant differences among treatments. The relative abundance of methanogenic archaea was expressed as a percentage. In order to predict the functional responses to in vitro ruminal fermentation and methanogenesis after GSP addition, PICRUSt was applied to generate a functional profile based on 16S rDNA data. The Cluster of Orthologous Groups (COG) and Kyoto Encyclopedia of Genes and Genomes (KEGG) were applied to predict microbe genes present in the culture fluid sample and to organize the genes into gene pathways.
2.7. Quantitative Realtime PCR Analysis
The abundance of total bacteria and methyl coenzyme-M reductase gene (mcrA, for methanogens) in each culture fluid sample was estimated using a Light Cycler 480 II instrument (Rotkreuz, Switzerland). The PCR primers that were designed with Primer Premier 5 to be used for total bacteria were 338F (5′-ACT CCT ACG GGA GGC AGC AG-3′) and 806R (5′-GGA CTA CHV GGG TWT CTA AT-3), and mcrA was F (5′-GGT GGT GTM GGD TTC ACM CAR TA-3′) and R (5′-CGT TCA TBG CGT AGT TVG GRT AGT-3′). The recombinant plasmids’ DNA containing each cloned respective target sequence were used as the standard DNA in real-time PCR. Real-time PCR reactions were performed in a final mixture of 10 μL comprising 5 μL of 2 × Taq SybrGreen qPCR Master Mix, 0.2 μL of 10 μM PCR-specific primer F or primer R, double distilled water to bring the volume to 3.6 μL, and 1 μL of template DNA. Amplifications were carried out under the following conditions: 95 °C for 3 min (template denaturation step), followed by 45 cycles of 95 °C for 5 s (melting) and 60 °C for 30 s (annealing and extension) and finished with a final extension at 72 °C for 5 min. The quantification of copies of total bacteria and mcrA gene in each culture fluid sample was performed in triplicate, and the mean value was calculated. Standard curves were established using 10-fold serial dilutions of each standard DNA containing the target gene. The absolute abundance of total bacteria and methanogens was expressed as copies of the target gene/mL of culture samples. The melt curves showed a single sharp peak, indicating that no nonspecific fluorescence was produced, and the quantification was accurate at this time. The results of the melt curve showed the reliability of the data. It was worth nothing that the results of qPCR estimated the number of gene copies, not the total number of cells.
2.8. Calculations
The data of cumulative gas production (GPt, mL/g DM) at different incubation times were fitted iteratively to a monophasic Michaelis–Menten equation [23] with the non-linear least squares regression (NLIN) procedure of SAS (1999), as in Equation (1):
where A is the asymptotic gas production (mL/g DM), B is a sharpness parameter determining the curve shape and C is the time (h) at which half of A is reached.
The maximum gas production rate (RmaxG, mL/h), the time at which RmaxG was reached (TRmaxG, h), the maximum substrate digestion rate of (RmaxS, g/h) and the time at which maximum substrate digestion rate was reached (TRmaxS, h) were calculated according to the previous description from Pang et al. [18].
The ratio of non-glucogenic to glucogenic acids (NGR) [24] and the hydrogen recovery (2Hrec) [25] were calculated as for Equations (2) and (3):
where acetate (Ace), propionate (Pro) and butyrate (But) are expressed in molar proportions (mmoL/moL) of total VFA production, and CH4 and H2 are the molar proportions of total gas production (mmoL/moL).
2.9. Statistical Analysis
The experimental data from gas production and rumen fermentation comprised two TMRs (HY and LY), five GSP doses (0, 15, 3060 and 120 mg/g substrate), five fermentations per dosage of GSP and three repeated runs of batch cultures. The model was applied as:
where Yijkl is the dependent variable under examination, μ is the overall mean, Ti is the fixed TMRs effect (i = 2, HY and LY), Gj is the fixed GSP dosage level effect (j = 5), (T × G)k is the interaction effect between TMRs and GSP, Bl is the random effect of batch run (l = 3) and εijkl is the error term. Least square mean and standard error (SEM) were calculated with the least square mean statement of the general linear model procedure. Orthogonal polynomial contrasts (contrast) were performed to determine linear and quadratic dosage effects of the GSP addition. Overall mean differences among GSP treatments were determined with Tukey’s test. Bacterial and methanogen abundance were analyzed using the MIXED procedure of SAS with a model that included the fixed effect of experimental treatment and the random effect of run nested within the treatment. Data on the bacterial and methanogen abundance were transformed to log10 (n + 1) to ensure normal distribution. Differences were declared at p < 0.05, whereas values of 0.05 < p < 0.10 were considered to be a trend. Analyses of methanotroph community data and 16S predicted functional profiles were carried out using the i-Sanger platform (http://www.i-sanger.com/, accessed on 6 April 2023).
Yijkl = μ + Ti + Gj + (T × G)k + Bl + εijkl
3. Results
3.1. Kinetic Gas Production
The cumulative gas production profile is presented in Figure 1. GP48 and the asymptotic gas production (A) were greater in HY than in LY (Table 2, p < 0.05), and both RmaxG and RmaxS were linearly decreased by the GSP addition, suggesting a slowdown of the fermentation rate of the rations.
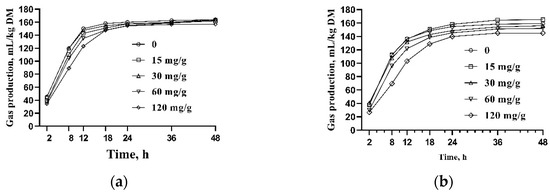
Figure 1.
Effect of different addition levels of grape seed proanthocyanidin (GSP) in culture fluids on the cumulative gas production of two total mixed rations (TMRs) incubated with rumen fluids obtained from lactating dairy cows. Diluted buffered rumen fluids (75 mL) were incubated for 48 h with 0.5 g ground TMRs of the HY rations: (a) a diet for high-yield cows or LY rations; (b) a diet for low-yield cows, with different GSP addition levels in culture fluids.
Table 2.
Effect of GSP addition on kinetic gas production and fermentation gas composition of 2 total mixed rations (TMRs) incubated with rumen fluids obtained from lactating dairy cows 1.
3.2. Fermentation Characteristics
As shown in Table 3, the pH value was higher in LY than HY, but GSP had no significant effect on the pH in either HY or LY. The ammonia N content tended to be greater in LY than HY (p = 0.09), and it decreased linearly with increasing GSP levels (p < 0.01). The total VFA concentrations were greater in HY than LY, and linearly declined against the GSP addition (p < 0.01). Regarding the VFA pattern in molar proportion, increasing the GSP addition linearly decreased the propionate and linearly increased the acetate (p < 0.05). As a result, the ratio of non-glucogenic to glucogenic acids was increased linearly by the GSP addition (p < 0.01). Meanwhile, the 2Hrec decreased against the increase in GSP in both HY and LY (p < 0.01).
Table 3.
Effect of different addition levels of GSP in culture fluids on fermentation characteristics of 2 total mixed rations (TMRs) incubated with rumen fluids obtained from lactating dairy cows 1.
3.3. CH4 Production along with IVDMD, Total VFA and GP48
As shown in Table 2, both CH4 and H2 production linearly decreased with GSP addition, and the CH4 production was reduced by up to 16.4 and 12.6% with 120 mg GSP addition in HY and LY, respectively. The IVDMD, total VFA and GP48 linearly decreased with the increasing GSP addition. In addition, the decreasing rate of IVDMD, total VFA and GP48 were consistently greater in LY than in HY (Figure 2). Unlike the above linear decreasing pattern, the decline of CH4 production was shown as the 1-compartment exponential model; the CH4 decrease rate decreased sharply in response to a GSP addition of less than 60 mg, and subsequently reached a stable level. The average decreasing rate per dose level was numerically lower in LY than HY (0.003 vs. 0.004, p = 0.11).
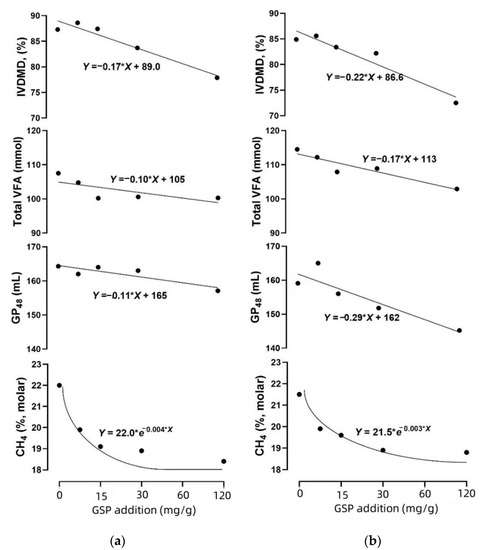
Figure 2.
The changes in CH4 production and in vitro dry matter disappearance (IVDMD) against the GSP addition. The p-values for the linear decrease model of CH4 production, IVDMD, GP48 and total VFA in HY ((a), a diet for high-yield cows) were 0.11, 0.01, 0.05 and 0.17, and they were 0.10, 0.01, 0.03 and 0.02 in LY ((b), a diet for low-yield cows). The correlation coefficient between CH4 production and IVDMD was 0.58 (p = 0.03) in HY, and it was 0.22 (p = 0.50) in LY. The correlation coefficient between CH4 production and total VFA was 0.57 (p = 0.07) in HY, and it was 0.89 (p < 0.01) in LY. There was no significant correlation between CH4 production and GP48. *, multiplication.
3.4. The Abundance Ratio of Total Bacteria to Methanogens (B:M)
The 30 mg GSP addition increased the abundance of total bacteria by 1.7 times relative to the control in the HY group, but no difference occurred in the LY group (Figure 3). The 30 mg GSP addition did alter the total methanogen abundance, as revealed by the mcrA gene in both LY and HY groups (p > 0.05). However, the 30 mg GSP addition significantly decreased the abundance ratio of methanogens to total bacteria (B:M), and the decrease was more pronounced in HY than LY (45.3% vs. 15.2% decrease).
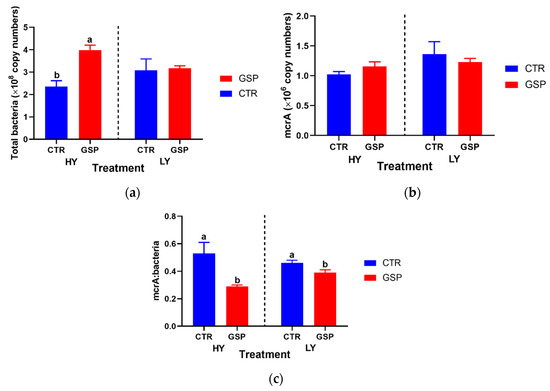
Figure 3.
Effect of 0 or 15 mg GSP addition in culture fluids on total methanogens and total bacteria population changes of two total mixed rations (TMRs, HY and LY) incubated with rumen fluids obtained from lactating dairy cows. CTR, control group with no GSP addition; GSP, treatment group with 15 mg GSP addition. HY, a diet for high-yield cows; LY, a diet for low-yield cows; (a), total bacteria; (b), total methanogens; (c), ratio of methanogens to bacteria. Values with different superscripts differ significantly (p < 0.05). Effect of TMR and interaction between TMRs and GSP was not reported since no statistical significance was observed.
3.5. Archaeal Diversity and the Abundance of Related Enzymes with Methanogenesis
The GSP addition did not statistically alter the archaeal community in terms of Shannon, ACE, Chao 1 and Simpson indexes (Table 4). Based on the weighted UniFrac metrics, the PCoA analysis in Figure 4 revealed that the GSP addition did not alter the archaeal community structure (R < 0.10, p = 0.36), and the principal coordinates 1, 2 and 3 accounted for 71.0, 18.0 and 8.0% of the total variation, respectively.
Table 4.
Effect of 0 or 30 mg GSP addition in culture fluids on alpha diversity indices of archaea with two total mixed rations (TMRs) incubated with rumen fluids obtained from lactating dairy cows (n = 4 per treatment) 1.
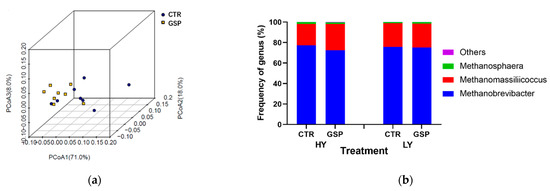
Figure 4.
Principal coordinate analysis (PCoA, (a)) of archaeal community structures and effect of 0 or 30 mg GSP addition in culture fluids on the predominant archaea genera; (b) composition of two total mixed rations (TMR, HY and LY) incubated with rumen fluids obtained from lactating dairy cows. PCoA plots were derived using the weighted UniFrac method. CTR, control group with no GSP addition; GSP, treatment group with 30 mg GSP addition.
At the genus level, methanogens with a relative abundance of ≥0.1% of the total sequences in at least one of the samples were further analyzed. The top three predominant genera were Methanobrevibacter (>72.5% of the total sequence reads), Methanomassiliicoccus (>20.9%) and Methanosphaera (>1.0%). The relative abundance of Methanobrevibacter was numerically lower in the GSP-treated group than in the control group. Conversely, the relative abundances of Methanomassiliicoccus and Methanosphaera were increased.
As shown in Table 5, the COG and KEGG pathway analysis of the phylogenetic investigation of communities by the reconstruction of unobserved states (PICRUSt) indicated that the GSP addition did not affect the abundance of enzymes related to CH4 production (e.g., formylmethanofuran dehydrogenaser, formylmethanofuran: tetrahydromethanopterin formyltransferase, coenzyme F420, tetrahydromethanopterin S-methyltransferase, methyl coenzyme M reductase).
Table 5.
Effect of 0 or 30 mg GSP addition in culture fluids on abundance of enzymes related to CH4 production of two total mixed rations (TMRs) incubated with rumen fluids obtained from lactating dairy cows 1.
4. Discussion
Grape seed extract contains a mixture of polyphenols, which includes proanthocyanidin. GSP has a variety of functional activities, including antibacterial and anticancer effects, and is also particularly powerful in scavenging oxygen free radicals [26,27,28]. Grape seed polyphenols were found to inhibit fat deposition [29]. Plant extracts have the potential to reduce CH4 production in the rumen of ruminants [30,31]. Among them, total grape seed extract has been reported to possess in vitro effects in alleviating CH4 production [32].
The increase in GSP addition indeed decreased IVDMD and total gas production, which implied that the GSP presented an inhibitory activity on the microbial digestion and fermentation of nutrients in rations. In a review about the biological activities of polyphenols from grapes, Xia et al. noted that grape seed extracts including grape seed oil, tannins and GSP have been used as natural antimicrobial agents [33]. However, no decrease in bacterial abundance occurred with GSP addition in the present study, suggesting that GSP might show a negative interference on the rates of gas production and substrate digestion by inhibiting microbial enzymes or antimicrobial activity, rather than having a direct antimicrobial effect. In addition, both tendencies and significant differences between HY and LY diets were observed in terms of IVDMD and gas production kinetics, suggesting that the extent and rate of the feed degradation and fermentation depended mainly on the nature of the incubated substrate. Gordon and Phillips noted that a high fiber content in diets promoted the colonization and growth of fungi and cellulolytic bacteria [34]. In the present study, a greater decrease in IVDMD in response to GSP addition occurred in high-fiber-containing LY than in low-fiber-containing HY, implying that GSP presented greater adverse effects on the microbial activity of fiber digestion. The total VFA concentrations in the present study decreased in both the high-starch-containing HY and low-starch-containing LY (9.6% and 7.4% decrease), implying that GSP also presented a negative effect on the metabolic activity of rumen microbes.
The antimethanogenic activity of polyphenolic compounds has been consistently demonstrated in several in vitro and in vivo studies; however, the effects have usually varied depending on its concentration, type or source. In contrast to other studies, this study focused on the differences in the types of fermentation substrates, and different fermentation substrates reflected the proportion of starch in the diet, which is essential for ruminant fattening. Based on basic research, Bhatta et al. evaluated the effects of six commercially available natural sources of tannins on in vitro ruminal CH4 production and noted that these tannins reduced the CH4 production and archaeal and protozoal populations [35], which was consistent with the present study. Previous research has suggested that the presence of starch could promote the release of methane [36]. However, the inhibition was observed on both substrate types in the present study. Moate et al. noted that both pelleted grape marc and ensiled grape marc decreased by approximately 20% in CH4 emissions and CH4 yield of dairy cows [8]. However, Buenoa et al., in an in vitro study, noted that dietary Acacia (Acacia molissima) tannin extract at 50 g/kg·DM did not alter CH4 emission when incubated together with mixed rumen microoragnisms from five ruminant species [37]. Consistent with the studies by Bhatta et al. and Moate et al. [8,35], a linear reduction was found for the CH4 production in the present study when the concentration of GSP was increased. However, the IVDMD and total VFA decreased when the dietary inclusion of GSP increased from 60 to 120 mg in the present study. These results indicate that, at a dietary inclusion above 60 mg, GSP may exert a strong negative impact on nutrients uptake by rumen bacteria and the microbial activity involved in rumen DM degradation. In rumen fermentation, methanogenesis is the main route of [H] transformation from the fermentative microbiota to methanogenic archaea, mainly as H2 [38]. The reduction in CH4 production may cause the accumulation of H2 if the reducing power had no disposal [39]. However, the reduction of 2Hrec by the supplementation of 120 mg GSP did not result in the increase in H2 accumulation, which suggested that the incorporation of [H] spared from methanogenesis into fermentation products occurred in the present study. The inhibition of ruminal methanogenesis may be achieved through directly reducing the numbers of methanogens or by decreasing the activity of enzymes secreted by archaea communities [40]. In the present study, total methanogens and the archaeal community were determined using qPCR and Illumina Miseq sequencing, and the results revealed that the GSP addition decreased the ratio of methanogens (mcrA) to total bacteria, and decreased the abundance of Methanobrevibacter. Methanobrevibacter, the first predominant genera of archaea in the present study, is usually considered to be the main hydrogenotrophic methanogen, which could convert H2 or formate to CH4 [41]. Coenzyme F420, which existed in all rumen methanogens, is a key coenzyme for methanogenesis due to it being a cofactor necessary for enzymes such as hydrogenase and formate dehydrogenase. The energy-conserving corrinoid-containing tetrahydromethanopterin S-methyltransferase catalyzes the exergonic formation of methyl-coenzyme M and tetrahydroinethanopterin from methyltetrahydromethanopterin and coenzyme M and couples this reaction with the electrogenic translocation of sodium ions over the cytoplasmic membrane in which the complex is integrated [42]. Another coenzyme characteristic of methanogens is coenzyme M, which is methylated to produce CH4. Methyl-coenzyme M reductase is the enzyme that is responsible for catalyzing the CH4-producing step in the process of methanogenesis [43]. Both the KEGG and COG pathway analysis indicated that coenzyme F420, methyl-coenzyme M reductase and tetrahydromethanopterin S-methyltransferase relating to three major pathways (hydrogenotrophic, methylotrophic and acetoclastic) for ruminal methanogenesis were all numerally lower in the GSP addition group, although it was a pity there was no occurrence of a statistical difference.
5. Conclusions
Regardless of the source of TMRs in the present study, the antioxidant GSP addition could mitigate methanogenesis (12.6–16.4% decrease) by decreasing the in vitro dry matter digestibility, Methanobrevibacter abundance and the ratio of methanogens to total bacteria. However, a relatively low administration level of GSP should be taken into consideration in order to obtain its inhibitory effect on CH4 emission with a minimal negative effect on rumen digestion and fermentation.
Author Contributions
Conceptualization, Q.W., Z.Z. and H.Y.; methodology, software, L.Z.; validation, formal analysis, investigation, resources, data curation, F.Z.; writing—original draft preparation, F.Z. and Z.Z.; writing review and editing, Q.W. and H.Y.; project administration, Y.W. and H.Y.; funding acquisition, S.L. and H.Y. All authors have read and agreed to the published version of the manuscript.
Funding
This research received no external funding.
Institutional Review Board Statement
The Animal Ethics Committee of China Agricultural University approved all procedures with animals. The sampling procedures followed the Guidelines on the Ethical Treatment of Experimental Animals (2006) No. 398 set by the Ministry of Science and Technology, China.
Informed Consent Statement
Not applicable.
Data Availability Statement
Not applicable.
Acknowledgments
Thanks are due to the Chinese academy of agricultural sciences for providing the donor animals in this experiment.
Conflicts of Interest
The authors declare no conflict of interest.
References
- Johnson, K.A.; Johnson, D.E. Methane emissions from cattle. J. Anim. Sci. 1995, 73, 2483–2492. [Google Scholar] [CrossRef]
- Saminathan, M.; Sieo, C.C.; Gan, H.M.; Abdullah, N.; Wong, C.M.V.L.; Ho, Y.W. Effects of condensed tannin fractions of different molecular weights on population and diversity of bovine rumen methanogenic archaea in vitro, as determined by high-throughput sequencing. Anim. Feed Sci. Technol. 2016, 216, 146–160. [Google Scholar] [CrossRef]
- Patra, A.K.; Yu, Z. Effects of essential oils on methane production and fermentation by, abundance and diversity of, rumen microbial populations. Appl. Environ. Microbiol. 2012, 78, 4271–4280. [Google Scholar] [CrossRef] [PubMed]
- Patra, A.; Park, T.; Kim, M.; Yu, Z. Rumen methanogens and mitigation of methane emission by anti-methanogenic compounds and substances. J. Anim. Sci. Biotechnol. 2017, 8, 13. [Google Scholar] [CrossRef]
- An, Q.; Gong, X.; Le, L.; Zhu, D.; Xiang, D.; Geng, F.; Zhu, H.; Peng, L.; Zou, L.; Zhao, G.; et al. Prospects for Proanthocyanidins from Grape Seed: Extraction Technologies and Diverse Bioactivity. Food Rev. Int. 2023, 39, 349–368. [Google Scholar] [CrossRef]
- Chen, M.; Yu, S. Lipophilized Grape Seed Proanthocyanidin Derivatives as Novel Antioxidants. J. Agric. Food Chem. 2017, 65, 1598–1605. [Google Scholar] [CrossRef] [PubMed]
- Bagchi, D.; Garg, A.; Krohn, R.L.; Bagchi, M.; Bagchi, D.J.; Balmoori, J.; Stohs, S.J. Protective Effects of Grape Seed Proanthocyanidins and Selected Antioxidants against TPA-induced Hepatic and Brain Lipid Peroxidation and DNA Fragmentation, and Peritoneal Macrophage Activation in Mice. Gen. Pharmacol. 1998, 30, 771–776. [Google Scholar] [CrossRef]
- Moate, P.J.; Williams, S.R.O.; Torok, V.A.; Hannah, M.C.; Ribaux, B.E.; Tavendale, M.H.; Eckard, R.J.; Jacobs, J.L.; Auldist, M.J.; Wales, W.J. Grape marc reduces methane emissions when fed to dairy cows. J. Dairy Sci. 2014, 97, 5073–5087. [Google Scholar] [CrossRef]
- Hixson, J.L.; Durmic, Z.; Vadhanabhuti, J.; Vercoe, P.E.; Smith, P.A.; Wilkes, E.N. Exploiting compositionally similar grape marc samples to achieve gradients of condensed tannin and fatty acids for modulating in vitro methanogenesis. Molecules 2018, 23, 1793. [Google Scholar] [CrossRef]
- Beauchemin, K.A.; McGinn, S.M.; Benchaar, C.; Holtshausen, L. Crushed sunflower, flax, or canola seeds in lactating dairy cow diets: Effects on methane production, rumen fermentation, and milk production. J. Dairy Sci. 2009, 92, 2118–2127. [Google Scholar] [CrossRef]
- Rasmussen, J.; Harrison, A. The Benefits of Supplementary Fat in Feed Rations for Ruminants with Particular Focus on Reducing Levels of Methane Production. ISRN Vet. Sci. 2011, 2011, 613172. [Google Scholar] [CrossRef] [PubMed]
- Unusan, N. Proanthocyanidins in grape seeds: An updated review of their health benefits and potential uses in the food industry. J. Funct. Foods 2020, 67, 103861. [Google Scholar] [CrossRef]
- Ogden, B.E.; Wanyong, P.W.; Takashi, A.; Byeong, H.L. Laboratory Animal Laws, Regulations, Guidelines and Standards in China Mainland, Japan, and Korea. ILAR J. 2017, 57, 301–311. [Google Scholar] [CrossRef] [PubMed]
- Pellikaan, W.F.; Stringano, E.; Leenaars, J.; Bongers, D.J.G.M.; Schuppen, L.V.; Plant, J.; Mueller-Harvey, I. Evaluating effects of tannins on extent and rate of in vitro gas and CH4 production using an automated pressure evaluation system (APES). Anim. Feed Sci. Technol. 2011, 166–167, 377–390. [Google Scholar] [CrossRef]
- Bai, S.; Cao, Z.J.; Cao, B.B.; Yang, H.J.; Li, S.L.; Liu, J.X. Effects of different forage combinations in total mixed rations on in vitro gas production kinetics, ruminal and milk fatty acid profiles of lactating cows. Meat Sci. 2018, 145, 51–57. [Google Scholar] [CrossRef]
- Yang, H.J.; Zhuang, H.; Meng, X.K.; Zhang, D.F.; Cao, B.H. Effect of melamine on in vitro rumen microbial growth, methane production and fermentation of Chinese wild rye hay and maize meal in binary mixtures. J. Agric. Sci. 2014, 152, 686–696. [Google Scholar] [CrossRef]
- Verdouw, H.; Van Echteld, C.J.A.; Dekkers, E.M.J. Ammonia determination based on indophenol formation with sodium salicylate. Water Res. 1978, 12, 399–402. [Google Scholar] [CrossRef]
- Pang, D.G.; Yang, H.J.; Cao, B.B.; Wu, T.T.; Wang, J.Q. The beneficial effect of enterococcus faecium, on the in vitro, ruminal fermentation rate and extent of three typical total mixed rations in northern china. Livest. Sci. 2014, 167, 154–160. [Google Scholar] [CrossRef]
- Zhang, D.F.; Yang, H.J. In vitro ruminal methanogenesis of a hay-rich substrate in response to different combination supplements of nitrocompounds, pyromellitic diimide and, 2-bromoethanesulphonate. Anim. Feed Sci. Technol. 2011, 163, 20–32. [Google Scholar] [CrossRef]
- Takai, K.; Horikoshi, K. Rapid detection and quantification of members of the archaeal community by quantitative PCR using fluorogenic probes. Appl. Environ. Microbiol. 2000, 66, 5066–5072. [Google Scholar] [CrossRef]
- Wang, K.; Nan, X.M.; Chu, K.K.; Tong, J.J.; Yang, L.; Zheng, S.S.; Zhao, G.Y.; Jiang, L.S.; Xiong, B.H. Shifts of hydrogen metabolism from methanogenesis to propionate production in response to replacement of forage fiber with non-forage fiber sources in diets in vitro. Front. Microbiol. 2018, 9, 10. [Google Scholar] [CrossRef]
- Langille, M.; Zaneveld, J.; Caporaso, J.G.; McDonald, D.; Knights, D.; Reyes, J.; Clemente, J.; Burkepile, D.; Vega Thurber, R.; Knight, R.; et al. Predictive functional profiling of microbial communities using 16S rRNA marker gene sequences. Nat. Biotechnol. 2013, 31, 814–821. [Google Scholar] [CrossRef]
- Groot, J.C.J.; Cone, J.W.; Williams, B.A.; Debersaques, F.M.A.; Lantinga, E.A. Multiphasic analysis of gas production kinetics for in vitro fermentation of ruminant feeds. Anim. Feed Sci. Technol. 1996, 64, 77–89. [Google Scholar] [CrossRef]
- Ørskov, E.R. Manipulation of rumen fermentation for maximium food utilization. Wld. Rev. Nutr. Diet. 1975, 22, 152–182. [Google Scholar]
- Demeyer, D.; De Graeve, K. Differences in stoichiometry between rumen and hindgut fermentation. Adv. Anim. Physiol. Anim. Nutr. 1991, 22, 50–61. [Google Scholar]
- Luo, S.; Zhang, X.; Zhang, X.; Zhang, L. Extraction, Identification and Antioxidant Activity of Proanthocyanidins from Larix Gmelinii Bark. Nat. Prod. Res. 2014, 28, 1116–1120. [Google Scholar] [CrossRef] [PubMed]
- Hamza, A.A.; Heeba, G.H.; Elwy, H.M.; Murali, C.; El-Awady, R.; Amin, A. Molecular Characterization of the Grape Seeds Extract’s Effect against Chemically Induced Liver Cancer: In Vivo and in Vitro Analyses. Sci. Rep. 2018, 8, 1270. [Google Scholar] [CrossRef] [PubMed]
- Fiesel, A.; Ehrmann, M.; Gessner, D.K.; Most, E.; Eder, K. Effects of Polyphenol-rich Plant Products from Grape or Hop as Feed Supplements on Iron, Zinc and Copper Status in Piglets. Arch. Anim. Nutr. 2015, 69, 276–284. [Google Scholar] [CrossRef]
- Du, H.; Wang, Q.; Li, T.; Ren, D.; Yang, X. Grape seed proanthocyanidins reduced the overweight of C57BL/6J mice through modulating adipose thermogenesis and gut microbiota. Food Funct. 2021, 12, 8467–8477. [Google Scholar] [CrossRef]
- Patra, A.K.; Saxena, J. A new perspective on the use of plant secondary metabolites to inhibit methanogenesis in the rumen. Phytochemistry 2010, 71, 1198–1222. [Google Scholar] [CrossRef]
- Sinz, S.; Kunz, C.; Liesegang, A.; Ueli, B.; Svenja, M.; Carla, R.S.; Michael, K. In vitro bioactivity of various pure flavonoids in ruminal fermentation, with special reference to methane formation. Czech. J. Anim. Sci. 2018, 63, 293–304. [Google Scholar] [CrossRef]
- Wischer, G.; Boguhn, J.; Steingaß, H.; Schollenberger, M.; Rodehutscord, M. Effects of different tannin-rich extracts and rapeseed tannin monomers on methane formation and microbial protein synthesis in vitro. Animal 2013, 7, 1796–1805. [Google Scholar] [CrossRef] [PubMed]
- Xia, E.Q.; Deng, G.F.; Guo, Y.J.; Li, H.B. Biological activities of polyphenols from grapes -Review. Int. J. Mol. Sci. 2010, 11, 622–646. [Google Scholar] [CrossRef] [PubMed]
- Gordon, G.L.R.; Phillips, M.W. The role of anaerobic gut fungi in ruminants. Nutr. Res. Rev. 1998, 11, 133–168. [Google Scholar] [CrossRef]
- Bhatta, R.; Uyeno, Y.; Tajima, K.; Takenaka, A.; Yabumoto, Y.; Nonaka, I.; Enishi, O.; Kurihara, M. Difference in the nature of tannins on in vitro ruminal methane and volatile fatty acid production and on methanogenic archaea and protozoal populations. J. Dairy Sci. 2009, 92, 5512–5522. [Google Scholar] [CrossRef]
- Luo, D.; Li, Y.; Yao, H.; Chapman, S.J. Effects of different carbon sources on methane production and the methanogenic communities in iron rich flooded paddy soil. Sci. Total Environ. 2022, 823, 153636. [Google Scholar] [CrossRef]
- Buenoa, I.C.S.; Brandia, R.A.; Franzolina, R.; Benetela, G.; Fagundesa, G.M.; Abdallab, A.L.; Louvandinib, H.; Muir, J.P. In vitro methane production and tolerance to condensed tannins in five ruminant species. Anim. Feed Sci. Technol. 2015, 205, 1–9. [Google Scholar] [CrossRef]
- Wolin, M.J.; Miller, T.L.; Stewart, C.S. Microbe-microbe interactions. In The Rumen Microbial Ecosystem; Hobson, P.N., Stewart, C.S., Eds.; Blackie Academic & Professional: London, UK, 1997; pp. 467–491. [Google Scholar]
- Ungerfeld, E.M. Shifts in metabolic hydrogen sinks in the methanogenesis-inhibited ruminal fermentation: A meta-analysis. Front. Microbiol. 2005, 6, 37. [Google Scholar] [CrossRef] [PubMed]
- Cieslak, A.; Szumacher-Strabel, M.; Stochmal, A.; Oleszek, W. Plant components with specific activities against rumen methanogens. Animal 2013, 7, 253–265. [Google Scholar] [CrossRef] [PubMed]
- Leahy, S.C.; Kelly, W.J.; Ronimus, R.S.; Wedlock, N.; Altermann, E.; Attwood, G.T. Genome sequencing of rumen bacteria and archaea and its application to methane mitigation strategies. Animal 2013, 7, 235–243. [Google Scholar] [CrossRef]
- Harms, U.; Thauer, R.K. Identification of the active site histidine in the corrinoid protein MtrA of the energy-conserving methyltransferase complex from Methanobacterium thermoautotrophicum. Eur. J. Biochem. 1997, 250, 783–788. [Google Scholar] [CrossRef] [PubMed]
- Duin, E.C.; Mckee, M.L. A new mechanism for methane production from methyl-coenzyme M reductase as derived from density functional calculations. J. Phys. Chem. B 2008, 112, 2466–2482. [Google Scholar] [CrossRef] [PubMed]
Disclaimer/Publisher’s Note: The statements, opinions and data contained in all publications are solely those of the individual author(s) and contributor(s) and not of MDPI and/or the editor(s). MDPI and/or the editor(s) disclaim responsibility for any injury to people or property resulting from any ideas, methods, instructions or products referred to in the content. |
© 2023 by the authors. Licensee MDPI, Basel, Switzerland. This article is an open access article distributed under the terms and conditions of the Creative Commons Attribution (CC BY) license (https://creativecommons.org/licenses/by/4.0/).