Abstract
In this study, the effects of mixed silage on the fermentation quality, chemical composition and bacterial communities of corn straw and soybean straw were assessed. Corn straws, soybean straws or a mixture of corn straws and soybean straws in a 1:1 mass ratio were uniformly mixed and processed using the same method to produce bagged silage weighing 50 kg per bag. At days 0, 14 and 60 of the fermentation process, the nutritional composition and fermentation quality indicators of each group were measured. A complete factorial design to assess the effect of the ensiling time, types of fermented straw (treatment group) and their interactions on the assessed parameters was performed. In addition, metabolomics sequencing and microbial community analysis were performed on the samples on the 60th day of fermentation. Compared with the corn straw group and the soybean straw group, the silage fermentation quality of the corn straw–soybean straw group is better, which is reflected in higher crude protein rate (p < 0.05), higher lactic acid content (p < 0.05) and lower ammonia nitrogen content (p < 0.05). The combined analysis of differential microbial taxa (species level) and differential metabolites revealed a positive correlation between certain bacterial species, such as manihotivorans, brevis and zeae, and significantly downregulated metabolites, such as pyrocatechol and N-benzoyltyramine. Similarly, positive correlations were observed between certain bacterial species, such as dublinensis, marcescens and agglomerans, and upregulated metabolites, such as D-xylonic acid and neochlorogenic acid. These findings suggest that the key microbial–metabolite pathways identified are responsible for the good fermentation quality observed during mixed fermentation of corn straw and soybean straw at a 1:1 mass ratio.
1. Introduction
In southern China, the scarcity of high-quality forage resources and the high costs of forage processing and transportation have posed significant challenges to the development of regional animal husbandry [1]. Therefore, the development of local coarse forage resources can greatly alleviate the shortage of forage resources in tropical animal husbandry [2]. Silage fermentation refers to the processing of fresh green forage by rapid chopping, compacting and sealing, followed by anaerobic fermentation by microorganisms to produce juicy feed [3]. If green forage materials are ensiled in a timely manner, the loss of their nutritional components is generally only 10–15%, and the protein, vitamins and other nutrients in green forage can be better preserved [4]. Silage feed fermented with probiotics has greatly improved storage time, palatability and digestibility, and the bioactive substances derived from microorganisms can also increase the added value of silage materials.
Corn straw, one of the most common geographically specific straw feed resources in southern China, usually has more lactic acid bacteria attached to its surface and contains higher levels of soluble carbohydrates [5,6]. By strict exhaust and sealing, high-quality silage feed can be easily obtained through natural fermentation. However, soybean, a leguminous plant also widely grown in southern China, often has fewer lactic acid bacteria attached to its straw surface or insufficient soluble carbohydrate content, making it difficult to ensile successfully [7]. As a result, soybean straw is often discarded directly, leading to resource waste and environmental pollution. In this regard, the use of mixed silage fermentation with microorganisms can combine easily fermentable green forage with other materials that are difficult to ensile alone, enabling the development of unconventional forage resources and playing an important role in ensuring a stable supply of feed resources for ruminant animals [8].
Therefore, the current study aimed to evaluate the impact of mixed silage fermentation on the nutritional value and fermentation quality of corn straw and soybean straw. Fermentation quality determination, microbial community analysis and plant-wide targeted metabolomic profiling were performed on the samples fermented for 60 days, revealing the interactions between microbial communities and plant metabolites during the mixed fermentation process.
2. Materials and Methods
2.1. Silage Preparation
Corn and soybean straw were produced by Guangdong Haotian Agricultural Development Co., Ltd. (E 110°55′14.62″, N 21°39′57.81″, altitude of 30.49 m) in Maoming, Guangdong Province, China. The dry matter content of soybean and corn straw was determined before the experiment. Soybean and corn straws were cut into 1–2 cm lengths using a feed chopper and then thoroughly mixed in a TMR machine according to the designed proportions (w/w). The experimental groups were as follows: (1) corn straw group; (2) corn straw and soybean straw (1:1 w/w) group (corn straw–soybean straw group); (3) soybean straw group. Clean drinking water was added during the mixing process to achieve a dry matter content of about 65% in the mixed silage. After thorough mixing with the TMR machine, the mixed silage was packaged in 50 kg bags using a silage packing machine. In this study, a total of 36 bags were stored at room temperature. When sampling, the silage bag was completely opened, the silage was fully and evenly mixed in the shortest possible time, the evenly mixed silage was piled into a cone shape and then flattened, the silage was divided into four equal parts from the center of a circle, two parts at any diagonal angle were randomly discarded, the remaining two parts were evenly mixed, and the mixture was continuously evenly mixed and shrunk according to the method until the amount of the remaining sample was close to the required amount for measurement. Samples collected on days 0, 7, 14, 30 and 60 of the experiment were used to determine the pH value, and samples collected on days 7, 14 and 60 of the experiment were used to determine the nutritional composition of the feed. Additionally, samples collected on day 60 were immediately frozen in liquid nitrogen and sent to a company for plant metabolomics and microbial community analysis.
2.2. Assessing Silage for Chemical Composition and Quality of Fermentation
Then, 30 g of each silage sample was added to a blender with 270 mL of distilled water and homogenized for 1 min. The resulting slurry was filtered through two layers of cheesecloth and filter paper to obtain the silage extract. The pH of the extract was measured using a PHS-25 pH meter (INESA, Shanghai, China), and the remaining samples were used to test organic acid concentration and ammonia nitrogen (AN). The extract was centrifuged (10,000× g at 4 °C for 15 min), and the supernatant was used for volatile fatty acid (VFA) analysis with a high-performance liquid chromatography (HPLC) system (LC-20AD, SHIMADZU, Kyoto, Japan) equipped with an Athena-C18 column (4.6 mm × 250 mm, 5 μm) at 25 °C. The mobile phase consisted of 0.02 mol/L potassium dihydrogen phosphate (pH 2.60) and methanol at a flow rate of 0.8 mL/min. The injection volume was 10 μL, and the detection wavelength was 210 nm. AN concentration was measured using the phenol-hypochlorite reaction described by Broderick and Kang [9]. To determine DM, subsamples of fresh material or silage were dried at 65 °C for 48 h. The dried sample was ground using a knife mill (BJ-1000A, Baijie, China) with a 1 mm mesh sieve and stored for subsequent analysis. Total nitrogen (TN) was measured using a nitrogen analyzer (Kjeltec 8400, FOSS, Sweden), and crude protein was estimated by multiplying TN by 6.25. Neutral detergent fiber (NDF) and acid detergent fiber (ADF) were determined using the method of Van Soest et al. [10]. The content of water-soluble carbohydrates (WSCs) was analyzed using the phenol/sulfuric acid method [11].
2.3. Bacterial Community Analysis
The extraction of DNA was carried out using a commercial DNA extraction kit (E.Z.N.A.® Omega Bio-tek, Norcross, GA, USA) according to the manufacturer’s instructions. After purification, DNA purity and concentration were measured using a NanoDrop 2000. The bacterial 16S rRNA V3–V4 region was amplified using primers 338F (CCTACGGGNGGCWGCAG) and 806R (GGACTACHVGGGTATCTAAT) [12]. Following purification and quantification, PCR products were sequenced using the Illumina MiSeq/HiSeq sequencing system, and the raw data were pre-processed by separating the data according to barcode sequences into different sample data and trimming barcode and PCR amplification primer sequences. The paired-end reads were then merged using the vsearch v2.14.2 software based on the overlap of paired-end reads to obtain raw tag data [13]. The tags were filtered using trimmomatic-0.36 software to remove tags with a continuous high-quality (Q20 or higher) base length less than 75% of the total length, as well as those containing N, and to obtain clean tags [14]. To study the composition and diversity of species populations in each sample, all effective tag sequences from all samples were clustered into operational taxonomic units (OTUs) based on a 97% similarity threshold using vsearch. The representative sequence of each OTU was annotated using RDP Classifier (version 2.2) based on the GreenGene database, and the species composition and abundance information of each sample at different taxonomic levels was summarized and statistically analyzed [15].
2.4. Metabolite Analysis
All samples were vacuum freeze-dried using a freeze dryer (Scientz-100F) and ground to a powder using a grinder (MM 400, Retsch). Fifty milligrams of sample powder was added to 1200 μL of internal standard extraction solution (70% methanol water pre-cooled at −20 °C), dissolved thoroughly, centrifuged (12,000× g rpm, 10 min) and filtered (0.22 μm microfiltration membrane) to prepare the extract, which was used for UPLC-MS/MS analysis. The information of these samples was subjected to qualitative analysis using the self-built MetWare database provided by Wuhan Metware Biotechnology Co., Ltd (Wuhan, Chian). The standard for selection of differentially expressed metabolites was variable importance in the projection (VIP) ≥ 1.0 and absolute fold change (FC) ≥ 2.0. The identified metabolites were annotated using the KEGG compound database (http://www.kegg.jp/kegg/compound/, accessed on 25 July 2022), and the annotated metabolites were then mapped to the KEGG pathway database (http://www.kegg.jp/kegg/pathway.html, accessed on 25 July 2022). Subsequently, all bioinformatic data analyses, including the correlation analysis between differentially expressed metabolites and differentially abundant microbiota, were conducted through the free online platform provided by Metware Cloud (Wuhan, China) (http://cloud.metware.cn/, accessed on 25 July 2022).
2.5. Statistical Analyses
Data from the silages on the 0th, 15th and 60th days of storage were analyzed using a two-way ANOVA with a 3 (days of storage) × 3 (treatments) factorial arrangement. Changes in chemical composition, microbial population and bacterial community indices during storage were compared using Duncan’s test in the SPSS 26.0 software (SPSS Inc., Chicago, IL, USA). Statistical significance was determined at a probability level of less than 0.05 (p < 0.05).
3. Results
3.1. Chemical Characteristics of Fresh Corn Straw and Soybean Straw
Table 1 shows the chemical compositions of the fresh corn straw and soybean straw material. As expected, the dry matter content and crude protein content of soybean straw were approximately twice as high as those of corn straw. The neutral detergent fiber contents and acid detergent fiber contents of soybean straw were also slightly higher than those of corn straw.

Table 1.
Chemical composition of corn straw and soybean straw before ensiling (n = 3).
3.2. Fermentation Quality of Mixed Corn Straw and Soybean Straw Silage
The visual appearance of the silage on day 0, day 14 and day 60 is shown in Figure 1A. In terms of color, there were no noticeable differences among the corn straw group, soybean straw group and corn straw–soybean straw group after 60 days of fermentation. However, the tracking measurements of pH during fermentation revealed that the corn straw group and corn straw–soybean straw group were able to maintain a pH value below 4.2 after 7 days of fermentation, whereas the pH value of the soybean straw group was higher than the other two groups and had already exceeded 4.2 by day 60 (Figure 1B).
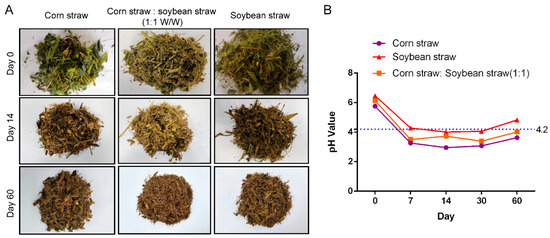
Figure 1.
Visual appearance and pH value changes in the silage during fermentation. (A) The visual appearance of the silage on day 0, day 14 and day 60. (B) Changes in pH values of the silage on day 0, day 7, day 14 and day 60 of fermentation.
The chemical characteristics of mixed corn straw and soybean straw ensiled for 7, 14 and 60 days are shown in Table 2. There was an effect of treatments (p < 0.05) with the corn straw–soybean straw group having higher dry matter contents, higher crude protein contents, higher acid detergent fiber (ADF) contents, higher neutral detergent fiber (NDF) and lower water-soluble carbohydrate (WSC) than the corn straw group on day 7, day 14 and day 60. There was also an effect of treatments (p < 0.05) with the corn straw–soybean straw group having lower dry matter contents, lower crude protein contents, low ADF contents, lower NDF and higher WSC than the soybean straw group on day 7, day 14 and day 60. The ensiling time affected the contents of dry matter, ADF, NDF and WSC (p < 0.05).
Table 2.
Chemical characteristics of mixed corn straw and soybean straw ensiled for 7, 14 and 60 days (n = 3).
The ensiling fermentation characteristics of mixed corn straw and soybean straw ensiled for 60 days are shown in Table 3. The corn straw–soybean straw group had higher contents of acetic acid than the soybean straw group (p < 0.05) and had lower contents of lactic acid and NH3-N than the corn straw group (p < 0.05). Neither propionic acid nor butyric acid were detected in the experiments.
Table 3.
Ensiling fermentation characteristics of mixed corn straw and soybean straw ensiled for 60 days (n = 3).
3.3. Metabolic Characteristics of Corn Straw and Soybean Straw Mixed Silage
After 60 days of fermentation, the metabolic profiling of the silage groups was further analyzed. As shown in Figure 2, significant differences in metabolic profiles were observed among the three groups, including the corn straw group, the soybean straw group and the corn straw–soybean straw group (Figure 2A). Figure 2B presents a heatmap of differential metabolites among the three groups. Statistical analysis revealed that there were 1286 differential metabolites between the corn straw group and the soybean straw group (Figure 2C), while there were 786 differential metabolites between the corn straw–soybean straw group and the corn straw group, with 42 unique differential metabolites. Additionally, there were 889 differential metabolites between the corn straw–soybean straw group and the soybean straw group, with 40 unique differential metabolites.
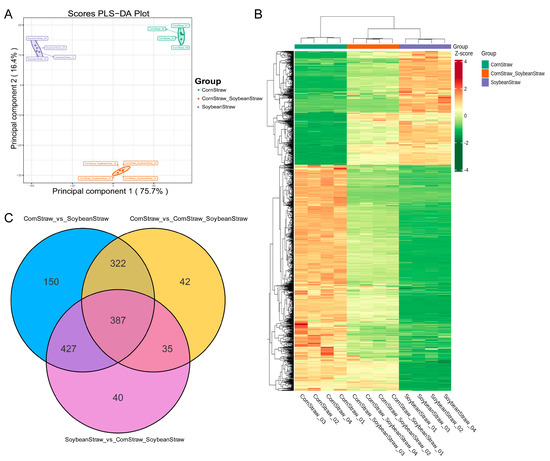
Figure 2.
Metabolomics analysis of different silage groups fermented for 60 days. (A) Principal component analysis of metabolites in different silage groups. (B) Heat map of cluster analysis for metabolites in different silage groups. (C) Venn diagram of differential metabolites in different silage groups.
The volcano plot (Figure 3A) illustrates that in comparison to the corn straw group, the soybean straw group had 434 metabolites with higher abundances and 845 metabolites with lower abundances. The main metabolic classes of differential metabolites included flavonoids, phenolic acids and terpenoids (Figure 3B). Analysis of the Kyoto Encyclopedia of Genes and Genomes (KEGG) pathway enrichment and the differential abundance score (DA score) of differential metabolites (Figure 3C) revealed that, in comparison to the corn straw group, several metabolic pathways such as flavonoid biosynthesis and isoflavonoid biosynthesis were significantly downregulated in the soybean straw group, while pathways such as flavone and flavonol biosynthesis, glyoxylate and dicarboxylate metabolism and purine metabolism were significantly upregulated. Figure 3D,E display the types and up/downregulation of differential metabolites in the flavonoid biosynthesis and flavone and flavonol biosynthesis pathways, respectively.
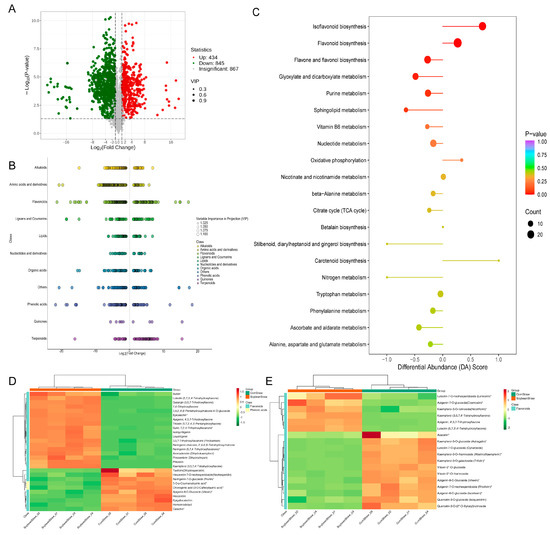
Figure 3.
Metabolomics analysis of different metabolites between soybean straw group and corn straw group. (A) Volcanic diagram of differential metabolites between soybean straw group and corn straw group. (B) Cluster scatter diagram of differential metabolites between soybean straw group and corn straw group; the greater the absolute value of abscissa, the greater the content difference between the two groups of samples. (C) Differential metabolite KEGG and differential abundance score between soybean straw group and corn straw group; the longer the dot distribution on the left side of the axis and the line segment, the more the overall expression of the pathway was downregulated. The longer the dot distribution on the right side of the axis and the line segment, the more the overall expression of the pathway was upregulated. (D) Types and up/downregulation of differential metabolites in the flavonoid biosynthesis pathway. (E) Types and up/downregulation of differential metabolites in the flavone and flavonol biosynthesis pathways. Stars indicate that isomers are indistinguishable.
Figure 4A presents the volcano plot of differential metabolites between the corn straw–soybean straw group and the soybean straw group. In comparison to the soybean straw group, the corn straw–soybean straw group exhibited higher abundances of 738 metabolites and lower abundances of 142 metabolites. Among the top 50 differential metabolites ranked by fold change (Figure 4B), four metabolites, namely pyrocatechol, N-benzoyltyramine, 5-aminovaleric acid and hexanoyl-L-glycine, showed significantly lower abundances in the corn straw–soybean straw group compared to the soybean straw group and were negatively correlated with the remaining upregulated differential metabolites. The main metabolic classes of differential metabolites between the corn straw–soybean straw group and the soybean straw group included flavonoids, phenolic acids and amino acids and derivatives (Figure 4C). Results of the KEGG pathway enrichment analysis (Figure 4D) revealed that the major enriched metabolic pathways for differential metabolites included flavonoid biosynthesis, isoflavonoid biosynthesis, glyoxylate and dicarboxylate metabolism and sphingolipid metabolism. Figure 4E,F display the types and up/downregulation of differential metabolites in the flavonoid biosynthesis and flavone and flavonol biosynthesis pathways, respectively, among the three groups.
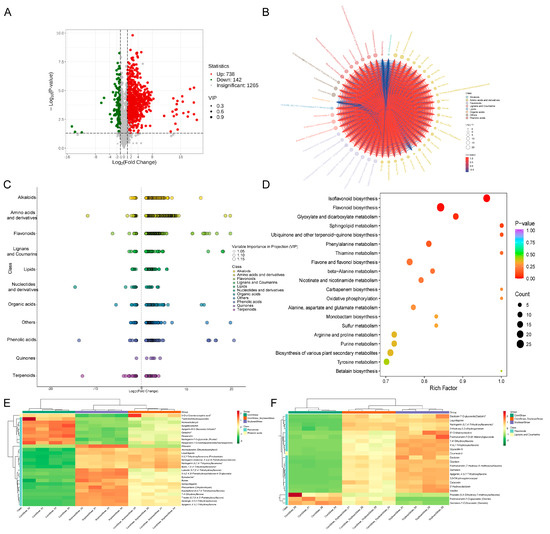
Figure 4.
Metabolomics analysis of different metabolites between soybean straw group and corn straw-soybean straw group. (A) Volcanic diagram of differential metabolites between soybean straw group and corn straw-soybean straw group. (B) Chord diagram of differential metabolites between soybean straw group and corn straw-soybean straw group; the connecting line represents the magnitude of Pearson correlation coefficient between the different corresponding metabolites, the red line represents positive correlation and the blue line represents negative correlation. (C) Cluster scatter diagram of differential metabolites between soybean straw group and corn straw-soybean straw group. (D) KEGG enrichment map of differential metabolites between soybean straw group and corn straw-soybean straw group. (E) Types and up/downregulation of differential metabolites in the flavonoid biosynthesis pathway. (F) Types and up/downregulation of differential metabolites in the flavone and flavonol biosynthesis pathways. Stars indicate that isomers are indistinguishable.
3.4. Microbial Community of Corn Straw and Soybean Straw Mixed Silage
The principal component analysis (PCA) results of microbial communities among different groups are shown in Figure 5A. There were significant differences in microbial community composition among corn straw group, soybean straw group and corn straw–soybean straw group, with high consistency within each group. Compared to the corn straw group, the soybean straw group had more OTUs and lower Simpson and Shannon values (Figure 5B–D). In comparison to the soybean straw group, the corn straw–soybean straw group had more OTUs and higher Simpson and Shannon values (Figure 5E–G). The comparison of microbial phyla (at the phylum level) revealed that Firmicutes was the dominant phylum in the soybean straw group, while Proteobacteria and Firmicutes were the dominant phyla in the corn straw group and corn straw–soybean straw group (Figure 5H). The comparison of microbial genera (at the genus level) showed that Lactobacillus and Weissella were the dominant genera in the soybean straw group, while Klebsiella, Lactobacillus and Citrobacter were the dominant genera in the corn straw group and corn straw–soybean straw group (Figure 5I). The comparison of microbial species (at the species level) revealed that brevis was the dominant species in the soybean straw group, while brevis and dublinensis were the dominant species in the corn straw group and corn straw–soybean straw group (Figure 5J). The evolutionary branching diagram of differential microbial communities from phylum to species level in the corn straw group, soybean straw group and corn straw–soybean straw group is displayed in Figure 5K,L, which illustrates the important microbial groups within each group.
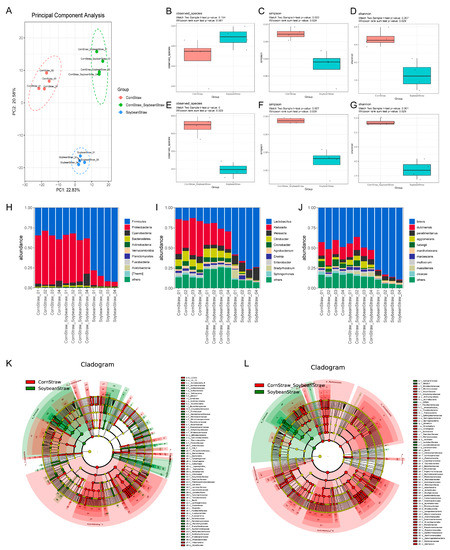
Figure 5.
Differential microbial community analysis of different silage groups fermented for 60 days. (A) Principal component analysis of microbial community in different silage groups. (B–D) Box plot of observed species index, Simpson index and Shannon index differences between soybean straw group and corn straw group. (E–G) Box plot of observed species index, Simpson index and Shannon index differences between soybean straw group and corn straw-soybean straw group. (H–J) Cluster tree diagram of microbial richness at phylum level, genus level and species level in each silage group. (K) Bifurcation diagram of microbial community evolution in soybean straw group and corn straw group. (L) Bifurcation diagram of microbial community evolution in soybean straw group and corn straw-soybean straw group; the circle radiating from inside to outside represents the classification level from phylum to genus (or species). Each small circle at different classification levels represents a classification at that level, and the diameter of the small circle is directly proportional to the relative abundance. Coloring principle: the species with no significant differences are uniformly colored yellow, and the differential species biomarker is colored according to the group. The red node represents the microorganism group that plays an important role in the red group, and the green node represents the microorganism group that plays an important role in the green group. If one group in the figure is missing, it indicates that there are no significantly differential species in this group. Legend on right indicates species name.
3.5. Metabolome–Microbiome Co-Analysis of Corn Straw and Soybean Straw Mixed Silage
To further investigate the correlation between microbial communities and differential metabolites in corn straw–soybean straw, we analyzed the correlation between microbial taxa (at the species level) and the top 20 upregulated and downregulated metabolites in the corn straw–soybean straw and soybean straw groups. As shown in Figure 6, there were positive correlations between manihotivorans, brevis and zeae and pyrocatechol and N-benzoyltyramine, which were significantly downregulated metabolites. Similarly, there were positive correlations between dublinensis, marcescens and agglomerans and D-xylonic acid and neochlorogenic acid, which were upregulated metabolites.
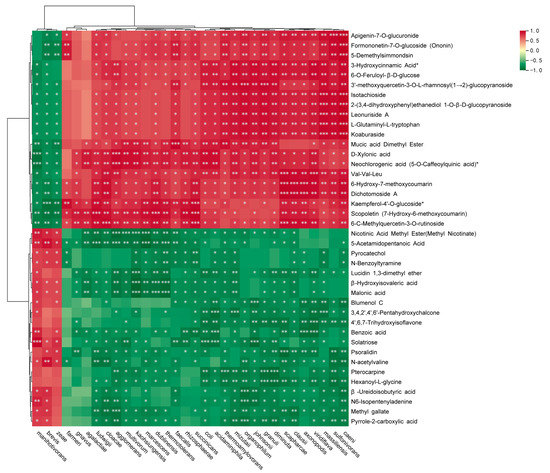
Figure 6.
Metabolome-microbiome (species level) co-analysis of corn straw and soybean straw mixed silage. * p < 0.05, ** p < 0.01, *** p < 0.001.
4. Discussion
4.1. Analysis of Fermentation Quality of Mixed Silage from Soybean Straw and Corn Straw
The quality of silage feed includes two aspects: one is the quality of fermentation during the fermentation process, also known as fermentation quality; the other is the nutritional value of silage feed and its value in animal feed utilization [16,17]. The quality of silage feed is directly affected by the raw material type, harvesting period and silage technology, and the quality of fermentation directly affects the loss rate of nutrients and the nutritional value of feed during storage, which also affects the physiological or production processes of livestock [18,19]. Moisture content, soluble carbohydrate content and buffering capacity are important factors for judging whether the feed material is suitable for silage fermentation [20]. High-quality silage feed has been reported to promote the health of lactating cows and increase milk production [21,22]. Silage feed with slightly lower nutritional value is also beneficial for the management of beef cattle and sheep [16]. The corn selected in this study is widely planted in southern China. Due to the influence of humid climate and geographical conditions, its water content is higher than 80%. Although it is conducive to compaction, it is also prone to nutrient loss, especially nitrogen loss, which is evident in the higher content of ammonia nitrogen in corn straw alone after 60 days of fermentation as shown in Table 3. Although soybean straw has a high dry matter content, its high crude protein content and low soluble carbohydrate content are not conducive to the activity of lactic acid bacteria. From the pH value measurement results, the pH decrease rate and amplitude of soybean straw alone during the early stage of silage fermentation were slow and low, and the pH at d60 was higher than 4.2, the ammonia nitrogen content was higher, the lactic acid content was low, the color was darker and, overall, the fermentation quality was poor. From a nutritional value perspective, there was no significant difference in crude protein content before and after fermentation among the three treatment groups. The soluble carbohydrate content in the corn straw–soybean straw group was significantly higher than that in the other two groups at d60. The selection of two or more raw materials for mixed silage plays an important role in the development of feed resources. In Wang’s study, the mixed silage of soybean curd residue with corn stover or rice straw preserved more nutrients and helped improve fermentation quality [5]. In this study, corn straw and soybean straw were mixed for silage, which reduced the moisture content of the raw materials before silage, increased the crude protein content compared with corn straw and increased the soluble carbohydrate content compared with soybean straw. From the perspective of fermentation quality indicators, the lactic acid content of the corn straw–soybean straw group was higher than that of the soybean straw group after 60 days of fermentation, the acetic acid content was higher than that of the corn straw group, the ammonia nitrogen content was the lowest among the three groups and the pH value could also be maintained below 4.2. Therefore, mixed silage fermentation integrates the fermentation characteristics of corn straw and the nutritional characteristics of soybean straw, realizing the utilization of soybean straw resources and also improving the value of corn straw utilization. The next step for researchers should be to design animal feeding experiments to evaluate the effect of mixed silage feed on animal performance.
4.2. The Composition Characteristics of Microbial Communities in Different Silage Groups
Silage fermentation is a complex biochemical process mainly dominated by anaerobic lactic acid bacteria [23]. It can generally be divided into three stages: aerobic respiration period (first 3 days), lactic acid fermentation period (first 3 weeks) and stable storage period (after 3 weeks) [24]. After the aerobic fermentation period, silage enters an anaerobic state, and lactic acid bacteria rapidly reproduce and produce a large amount of lactic acid, which inhibits the activity of harmful microorganisms such as Clostridium [23]. When the pH drops below 4.2, lactic acid bacteria are also inhibited. The stable anaerobic and acidic environment of silage enables it to be stored for a long time. According to Figure 5, the microbial community structure of the corn straw–soybean straw group is more similar to that of corn straw at the phylum, genus and species levels. At the genus level, there are significant differences in the abundance of Lactobacilus and Kebsiella between corn straw, mixed silage and soybean straw. The soybean straw has a higher abundance of Lactobacilus and a lower abundance of Kebsiella, which appears to contradict the lower lactate content of the soybean straw group. However, when analyzing the abundance of the microbial community (species level), brevis, a heterofermentative lactic acid bacterium, is the most abundant species in the soybean straw group. Compared with homofermentative lactic acid bacteria, heterofermentative lactic acid bacteria have half the lactate synthesis efficiency and produce more acetic acid and carbon dioxide, which leads to poor silage fermentation [23,25]. This can explain why the lactate content is lower and acetic acid content is higher in the soybean straw group. In fact, the inhibitory effect of heterofermentative lactic acid bacteria on aerobic deterioration of silage has been paid more and more attention in recent years. The addition of heterofermentative lactic acid bacteria can help to extend the storage and utilization time of silage [23]. In this study, compared with the corn straw group, the mixture silage of soybean straw and corn straw not only realizes the silage utilization of soybean straw resources, but also improves the nutritional characteristics and microbial diversity of corn straw silage.
4.3. Combined Analysis of Metabolomics and Microbiota to Characterize the Characteristics of Mixed Silage Fermentation
Metabolome refers to the totality of all small-molecule metabolic products within a biological system, including metabolites, metabolic products, intermediates, drugs and toxins [26]. Metabolomics is the scientific field of systematically analyzing and studying the metabolome, with the aim of understanding the changes in the metabolome of a biological system under different conditions, as well as exploring the relationship between the metabolome and other levels (such as the microbiome) to gain a deeper understanding of the function and biochemical properties of biological systems [27]. Metabolomics is widely used in plant research, for example, to study the interaction between the plant metabolome and environmental factors (such as climate, soil, light and nutrients) to reveal the mechanisms of plant adaptation to the environment [28]. In this study, the metabolite and microbial compositions of different silage fermentation treatments were detected, with the aim of conducting a comprehensive and systematic analysis of silage fermentation and revealing the changes in microbial metabolic pathways and the interrelationship between metabolites. As shown in Figure 2, the metabolite composition characteristics of the mixed silage fermentation product of corn straw and soybean straw neither tend to be similar to corn straw nor tend to be similar to soybean straw. Although the content of various metabolites in the corn straw–soybean straw group is basically in between that of corn straw group and soybean straw group, there are also many different metabolites produced only through mixed fermentation. The main types of different metabolites between corn straw group and soybean straw group are flavonoids and phenolic acids. The signaling pathways of flavonoid biosynthesis, isoflavonoid biosynthesis and other metabolic pathways are less active in the soybean straw group, while the signaling pathways of flavone and flavonol biosynthesis are more active. Compared with soybean straw group, there are 738 different regulated metabolites in the corn straw–soybean straw group, and their functions are mainly concentrated in flavonoid biosynthesis, isoflavonoid biosynthesis and other metabolic signaling pathways. At the same time, we also screened several special downregulated metabolites in the mixed fermentation group, including pyrocatechol, N-benzoyltyramine, 5-aminovaleric acid and hexanoyl-L-glycine, and their content showed a negative correlation with most upregulated metabolites. There are reports indicating that pyrocatechol is a secondary metabolite of plant phenols that is produced by microbial metabolism during the ensiling process. It possesses antibacterial and antioxidant properties, and its addition can enhance the antioxidant capacity of ensiled forage [29]. Although no examples were found for the application of N-benzoyltyramine, 5-aminovaleric acid and hexanoyl-L-glycine in the fermentation of silage, we speculate that they may have similar effects as pyrocatechol in prolonging the storage and utilization time of silage, which is worth further investigation by researchers.
The microbial community in silage is an important component involved in the fermentation process [30]. The interaction between the microbial community and the metabolites in silage collectively influences the quality and nutritional value of silage. In our correlation analysis between the microbial community (at the species level) and differential metabolites, we found a significant positive correlation between brevis and anihotivorans (a homolactic fermenting Lactobacillus [31]) and pyrocatechol, N-benzoyltyramine and 5-aminovaleric acid. This further suggests that a high abundance of brevis is accompanied by a higher level of pyrocatechol, N-benzoyltyramine and 5-aminovaleric acid content, which inhibits the fermentation effect of soybean straw. The microbial community structure after mixing corn straw with soybean straw is more conducive to fermentation quality and stability. The mechanism of brevis and other strains involved in the synthesis of these key metabolites also needs further experimental exploration. This is of great significance for developing more scientific production technologies for mixed silage and optimizing and controlling the silage fermentation process.
5. Conclusions
This study compared the characteristics of corn straw, soybean straw and a mixture of the two in silage fermentation. The results showed that the quality of fermented silage of soybean straw alone was poor, while the quality of mixed fermentation silage was relatively high due to its high crude protein content, lactic acid content and low ammonia nitrogen content. By conducting a combined analysis of the metabolome and microbial community in the fermented silage, a positive correlation was found between manihotivorans, brevis and zeae and significantly downregulated metabolites such as pyrocatechol and N-benzoyltyramine; a positive correlation was also found between dublinensis, marcescens and agglomerans and upregulated metabolites such as D-xylonic acid and neochlorogenic acid. These identified microbial–metabolite regulatory networks can help in developing better utilization technologies for soybean straw as feed resources.
Author Contributions
Conceptualization, D.L. and Z.Z.; methodology, Z.Z.; software, L.M.; validation, K.Z., Z.Z. and X.T.; formal analysis, K.Z.; investigation, D.L.; resources, W.C.; data curation, Z.Z.; writing—original draft preparation, Z.Z.; writing—review and editing, D.L.; visualization, K.Z.; supervision, S.Y.; project administration, D.L.; funding acquisition, D.L. All authors have read and agreed to the published version of the manuscript.
Funding
This research was funded by the Heyuan Branch, Guangdong Laboratory for Lingnan Modern Agriculture Project (DT20220021 and DT20220023), the Open Project of Guangdong Public Laboratory of Animal Breeding and Nutrition (2022SZ03) and the Guangdong Modern Agro-industry Technology Research System (2023KJ114). Special acknowledgements to the Guangdong Agricultural Technology Extension Center for its support.
Institutional Review Board Statement
Not applicable.
Informed Consent Statement
Not applicable.
Data Availability Statement
Not applicable.
Conflicts of Interest
The authors declare no conflict of interest.
References
- Hou, L.; Bai, W.; Zhang, Q.; Jiao, S.; Tang, G.; Luo, Y.; Bai, R.; Song, S.; Zhang, W. Agronomic and economical characterizations of a two-harvest regime for oat forage in cold regions of Northern China. Environ. Sci. Pollut. Res. Int. 2021, 28, 68804–68816. [Google Scholar] [CrossRef] [PubMed]
- Bernardes, T.F.; Daniel, J.L.P.; Adesogan, A.T.; McAllister, T.A.; Drouin, P.; Nussio, L.G.; Huhtanen, P.; Tremblay, G.F.; Belanger, G.; Cai, Y. Silage review: Unique challenges of silages made in hot and cold regions. J. Dairy Sci. 2018, 101, 4001–4019. [Google Scholar] [CrossRef] [PubMed]
- Muck, R.E.; Nadeau, E.M.G.; McAllister, T.A.; Contreras-Govea, F.E.; Santos, M.C.; Kung, L., Jr. Silage review: Recent advances and future uses of silage additives. J. Dairy Sci. 2018, 101, 3980–4000. [Google Scholar] [CrossRef]
- Borreani, G.; Tabacco, E.; Schmidt, R.J.; Holmes, B.J.; Muck, R.E. Silage review: Factors affecting dry matter and quality losses in silages. J. Dairy Sci. 2018, 101, 3952–3979. [Google Scholar] [CrossRef]
- Wang, X.; Song, J.; Liu, Z.; Zhang, G.; Zhang, Y. Fermentation Quality and Microbial Community of Corn Stover or Rice Straw Silage Mixed with Soybean Curd Residue. Animals 2022, 12, 919. [Google Scholar] [CrossRef]
- Lian, T.; Zhang, W.; Cao, Q.; Wang, S.; Dong, H.; Yin, F. Improving production of lactic acid and volatile fatty acids from dairy cattle manure and corn straw silage: Effects of mixing ratios and temperature. Bioresour. Technol. 2022, 359, 127449. [Google Scholar] [CrossRef]
- Ni, K.; Wang, F.; Zhu, B.; Yang, J.; Zhou, G.; Pan, Y.; Tao, Y.; Zhong, J. Effects of lactic acid bacteria and molasses additives on the microbial community and fermentation quality of soybean silage. Bioresour. Technol. 2017, 238, 706–715. [Google Scholar] [CrossRef]
- Mu, L.; Wang, Q.; Cao, X.; Zhang, Z. Effects of fatty acid salts on fermentation characteristics, bacterial diversity and aerobic stability of mixed silage prepared with alfalfa, rice straw and wheat bran. J. Sci. Food Agric. 2022, 102, 1475–1487. [Google Scholar] [CrossRef]
- Broderick, G.A.; Kang, J.H. Automated simultaneous determination of ammonia and total amino acids in ruminal fluid and in vitro media. J. Dairy Sci. 1980, 63, 64–75. [Google Scholar] [CrossRef]
- Van Soest, P.J.; Robertson, J.B.; Lewis, B.A. Methods for dietary fiber, neutral detergent fiber, and nonstarch polysaccharides in relation to animal nutrition. J. Dairy Sci. 1991, 74, 3583–3597. [Google Scholar] [CrossRef]
- Dubois, M.; Gilles, K.; Hamilton, J.K.; Rebers, P.A.; Smith, F. A colorimetric method for the determination of sugars. Nature 1951, 168, 167. [Google Scholar] [CrossRef]
- Yang, L.; Yuan, X.; Li, J.; Dong, Z.; Shao, T. Dynamics of microbial community and fermentation quality during ensiling of sterile and nonsterile alfalfa with or without Lactobacillus plantarum inoculant. Bioresour. Technol. 2019, 275, 280–287. [Google Scholar] [CrossRef] [PubMed]
- Rognes, T.; Flouri, T.; Nichols, B.; Quince, C.; Mahe, F. VSEARCH: A versatile open source tool for metagenomics. PeerJ 2016, 4, e2584. [Google Scholar] [CrossRef] [PubMed]
- Bolger, A.M.; Lohse, M.; Usadel, B. Trimmomatic: A flexible trimmer for Illumina sequence data. Bioinformatics 2014, 30, 2114–2120. [Google Scholar] [CrossRef] [PubMed]
- Wang, Q.; Garrity, G.M.; Tiedje, J.M.; Cole, J.R. Naive Bayesian classifier for rapid assignment of rRNA sequences into the new bacterial taxonomy. Appl. Environ. Microbiol. 2007, 73, 5261–5267. [Google Scholar] [CrossRef]
- Krizsan, S.J.; Randby, A.T. The effect of fermentation quality on the voluntary intake of grass silage by growing cattle fed silage as the sole feed. J. Anim. Sci. 2007, 85, 984–996. [Google Scholar] [CrossRef]
- Keady, T.W.; Lively, F.O.; Kilpatrick, D.J.; Moss, B.W. The effects of grain treatment, grain feed level and grass silage feed value on the performance of and meat quality from, finishing beef cattle. Animal 2008, 2, 149–159. [Google Scholar] [CrossRef]
- Ertekin, I.; Kizilsimsek, M. Effects of lactic acid bacteria inoculation in pre-harvesting period on fermentation and feed quality properties of alfalfa silage. Asian-Australas J. Anim. Sci. 2020, 33, 245–253. [Google Scholar] [CrossRef]
- Gebrehawariat, E.; Tamir, B.; Tegegne, A. Feed intake and production parameters of lactating crossbred cows fed maize-based diets of stover, silage or quality protein silage. Trop. Anim. Health Prod. 2010, 42, 1705–1710. [Google Scholar] [CrossRef]
- Kung, L., Jr.; Shaver, R.D.; Grant, R.J.; Schmidt, R.J. Silage review: Interpretation of chemical, microbial, and organoleptic components of silages. J. Dairy Sci. 2018, 101, 4020–4033. [Google Scholar] [CrossRef]
- Dai, Q.; Hou, Z.; Gao, S.; Li, Z.; Wei, Z.; Wu, D. Substitution of fresh forage ramie for alfalfa hay in diets affects production performance, milk composition, and serum parameters of dairy cows. Trop. Anim. Health Prod. 2019, 51, 469–472. [Google Scholar] [CrossRef] [PubMed]
- Salawu, M.B.; Adesogan, A.T.; Dewhurst, R.J. Forage intake, meal patterns, and milk production of lactating dairy cows fed grass silage or pea-wheat bi-crop silages. J. Dairy Sci. 2002, 85, 3035–3044. [Google Scholar] [CrossRef] [PubMed]
- Oliveira, A.S.; Weinberg, Z.G.; Ogunade, I.M.; Cervantes, A.A.P.; Arriola, K.G.; Jiang, Y.; Kim, D.; Li, X.; Goncalves, M.C.M.; Vyas, D.; et al. Meta-analysis of effects of inoculation with homofermentative and facultative heterofermentative lactic acid bacteria on silage fermentation, aerobic stability, and the performance of dairy cows. J. Dairy Sci. 2017, 100, 4587–4603. [Google Scholar] [CrossRef] [PubMed]
- Johnson, L.; Harrison, J.H.; Hunt, C.; Shinners, K.; Doggett, C.G.; Sapienza, D. Nutritive value of corn silage as affected by maturity and mechanical processing: A contemporary review. J. Dairy Sci. 1999, 82, 2813–2825. [Google Scholar] [CrossRef]
- Martinez-Miranda, J.G.; Chairez, I.; Duran-Paramo, E. Mannitol Production by Heterofermentative Lactic Acid Bacteria: A Review. Appl. Biochem. Biotechnol. 2022, 194, 2762–2795. [Google Scholar] [CrossRef]
- Fernie, A.R. Review: Metabolome characterisation in plant system analysis. Funct. Plant Biol. 2003, 30, 111–120. [Google Scholar] [CrossRef]
- Kulathunga, J.; Simsek, S. A Review: Cereals on Modulating the Microbiota/Metabolome for Metabolic Health. Curr. Nutr. Rep. 2022, 11, 371–385. [Google Scholar] [CrossRef]
- Mahrous, E.A.; Farag, M.A. Two dimensional NMR spectroscopic approaches for exploring plant metabolome: A review. J. Adv. Res. 2015, 6, 3–15. [Google Scholar] [CrossRef]
- Xu, D.; Ding, W.; Ke, W.; Li, F.; Zhang, P.; Guo, X. Modulation of Metabolome and Bacterial Community in Whole Crop Corn Silage by Inoculating Homofermentative Lactobacillus plantarum and Heterofermentative Lactobacillus buchneri. Front. Microbiol. 2018, 9, 3299. [Google Scholar] [CrossRef]
- Wang, Z.; Tan, Z.; Wu, G.; Wang, L.; Qin, G.; Wang, Y.; Pang, H. Microbial community and fermentation characteristic of whole-crop wheat silage treated by lactic acid bacteria and Artemisia argyi during ensiling and aerobic exposure. Front. Microbiol. 2022, 13, 1004495. [Google Scholar] [CrossRef]
- Morlon-Guyot, J.; Guyot, J.P.; Pot, B.; Jacobe de Haut, I.; Raimbault, M. Lactobacillus manihotivorans sp. nov., a new starch-hydrolysing lactic acid bacterium isolated during cassava sour starch fermentation. Int. J. Syst. Bacteriol. 1998, 48 Pt 4, 1101–1109. [Google Scholar] [CrossRef] [PubMed]
Disclaimer/Publisher’s Note: The statements, opinions and data contained in all publications are solely those of the individual author(s) and contributor(s) and not of MDPI and/or the editor(s). MDPI and/or the editor(s) disclaim responsibility for any injury to people or property resulting from any ideas, methods, instructions or products referred to in the content. |
© 2023 by the authors. Licensee MDPI, Basel, Switzerland. This article is an open access article distributed under the terms and conditions of the Creative Commons Attribution (CC BY) license (https://creativecommons.org/licenses/by/4.0/).